
Abstract
Deliberate or accidental contamination of food, feed, and water supplies poses a threat to human health worldwide. A rapid and sensitive detection technique that could replace the current labor-intensive and time-consuming culture-based methods is highly desirable. In addition to species-specific assays, such as PCR, there is a need for generic methods to screen for unknown pathogenic microorganisms in samples. This work presents a metagenomics-based direct-sequencing approach for detecting unknown microorganisms, using Bacillus cereus (as a model organism for B. anthracis) in bottled water as an example. Total DNA extraction and 16S rDNA gene sequencing were used in combination with principle component analysis and multicurve resolution to study detection level and possibility for identification. Results showed a detection level of 105 to 106 CFU/L. Using this method, it was possible to separate 2 B. cereus strains by the principal component plot, despite the close sequence resemblance. A linear correlation between the artificial contamination level and the relative amount of the Bacillus artificial contaminant in the metagenome was observed, and a relative amount value above 0.5 confirmed the presence of Bacillus. The analysis also revealed that background flora in the bottled water varied between the different water types that were included in the study. This method has the potential to be adapted to other biological matrices and bacterial pathogens for fast screening of unknown bacterial threats in outbreak situations.
The culture-based approaches for detection usually require some prior knowledge of the microbial content of the sample. Molecular methods like PCR, which often is used as the detection method, can provide fast identification.10,11 However, these assays are usually optimized for detection of a single organism or a very limited number of pathogens. If the cause of the contamination is unclear or unknown, a large number of assays and runs are needed to determine the actual species, which can put demands on a laboratory and be time-consuming. Variants of the targets might not be detectable if changes in the nucleotide sequence have occurred in the primer and/or probe binding site. Furthermore, because a significant proportion of microorganisms cannot be cultured, they cannot be detected using these techniques.12,13 For the unknown threat, a culture-independent technique that screens for the presence of any targets would simplify the analysis considerably.
A powerful technique for resolving samples with unknown composition is metagenomics. In this approach, the entire microbial gene pool of, for example, food, feed, water, or environmental samples is examined. In contrast to tools like PCR and microarray, where specific biomarkers are searched for, the metagenomics-based approach identifies those biomarkers that are actually present in the sample, and it is subsequently possible to match them to the microflora that are present. 14 Two basic approaches are employed when metagenomics is used to define the content of microbial communities: (1) whole genome–based, and (2) target-specific approaches (reviewed by Karlsson et al. 15 and Suenaga 16 ). The whole genome–based approach gives more detailed information, but it is technically more difficult to perform, both in terms of need for specific equipment as well as computer power and storage of the huge amounts of data generated. In the target-specific approach, a smaller fraction of the genome is amplified and sequenced. This gives rise to less complicated data that is easier and faster to process, but the information on the content of the microflora is limited to the targets used. A commonly used marker is the 16S rDNA gene, which is universally conserved and has a high degree of diversity across bacterial species.17,18 One method that has been used for target-specific metagenomics is the direct-sequencing approach, in which the entire microflora is sequenced without prior cultivation.19,20
In this study, the direct 16S rDNA targeted-sequencing approach19,20 has been evaluated as a diagnostic tool for detection of B. cereus artificially inoculated in bottled water without prior cultivation. For an overview of the experimental design, see Figure 1. B. cereus was used as a model organism for B. anthracis, the causative agent of anthrax. Two different B. cereus isolates were used, F2085/98 and NVH0597-99, which had previously been found to have a close resemblance to B. anthracis. 21 Spectra generated from the sequencing of the samples were compared using multivariate statistical methods, including principal component analysis (PCA) and multivariate curve resolution (MCR).
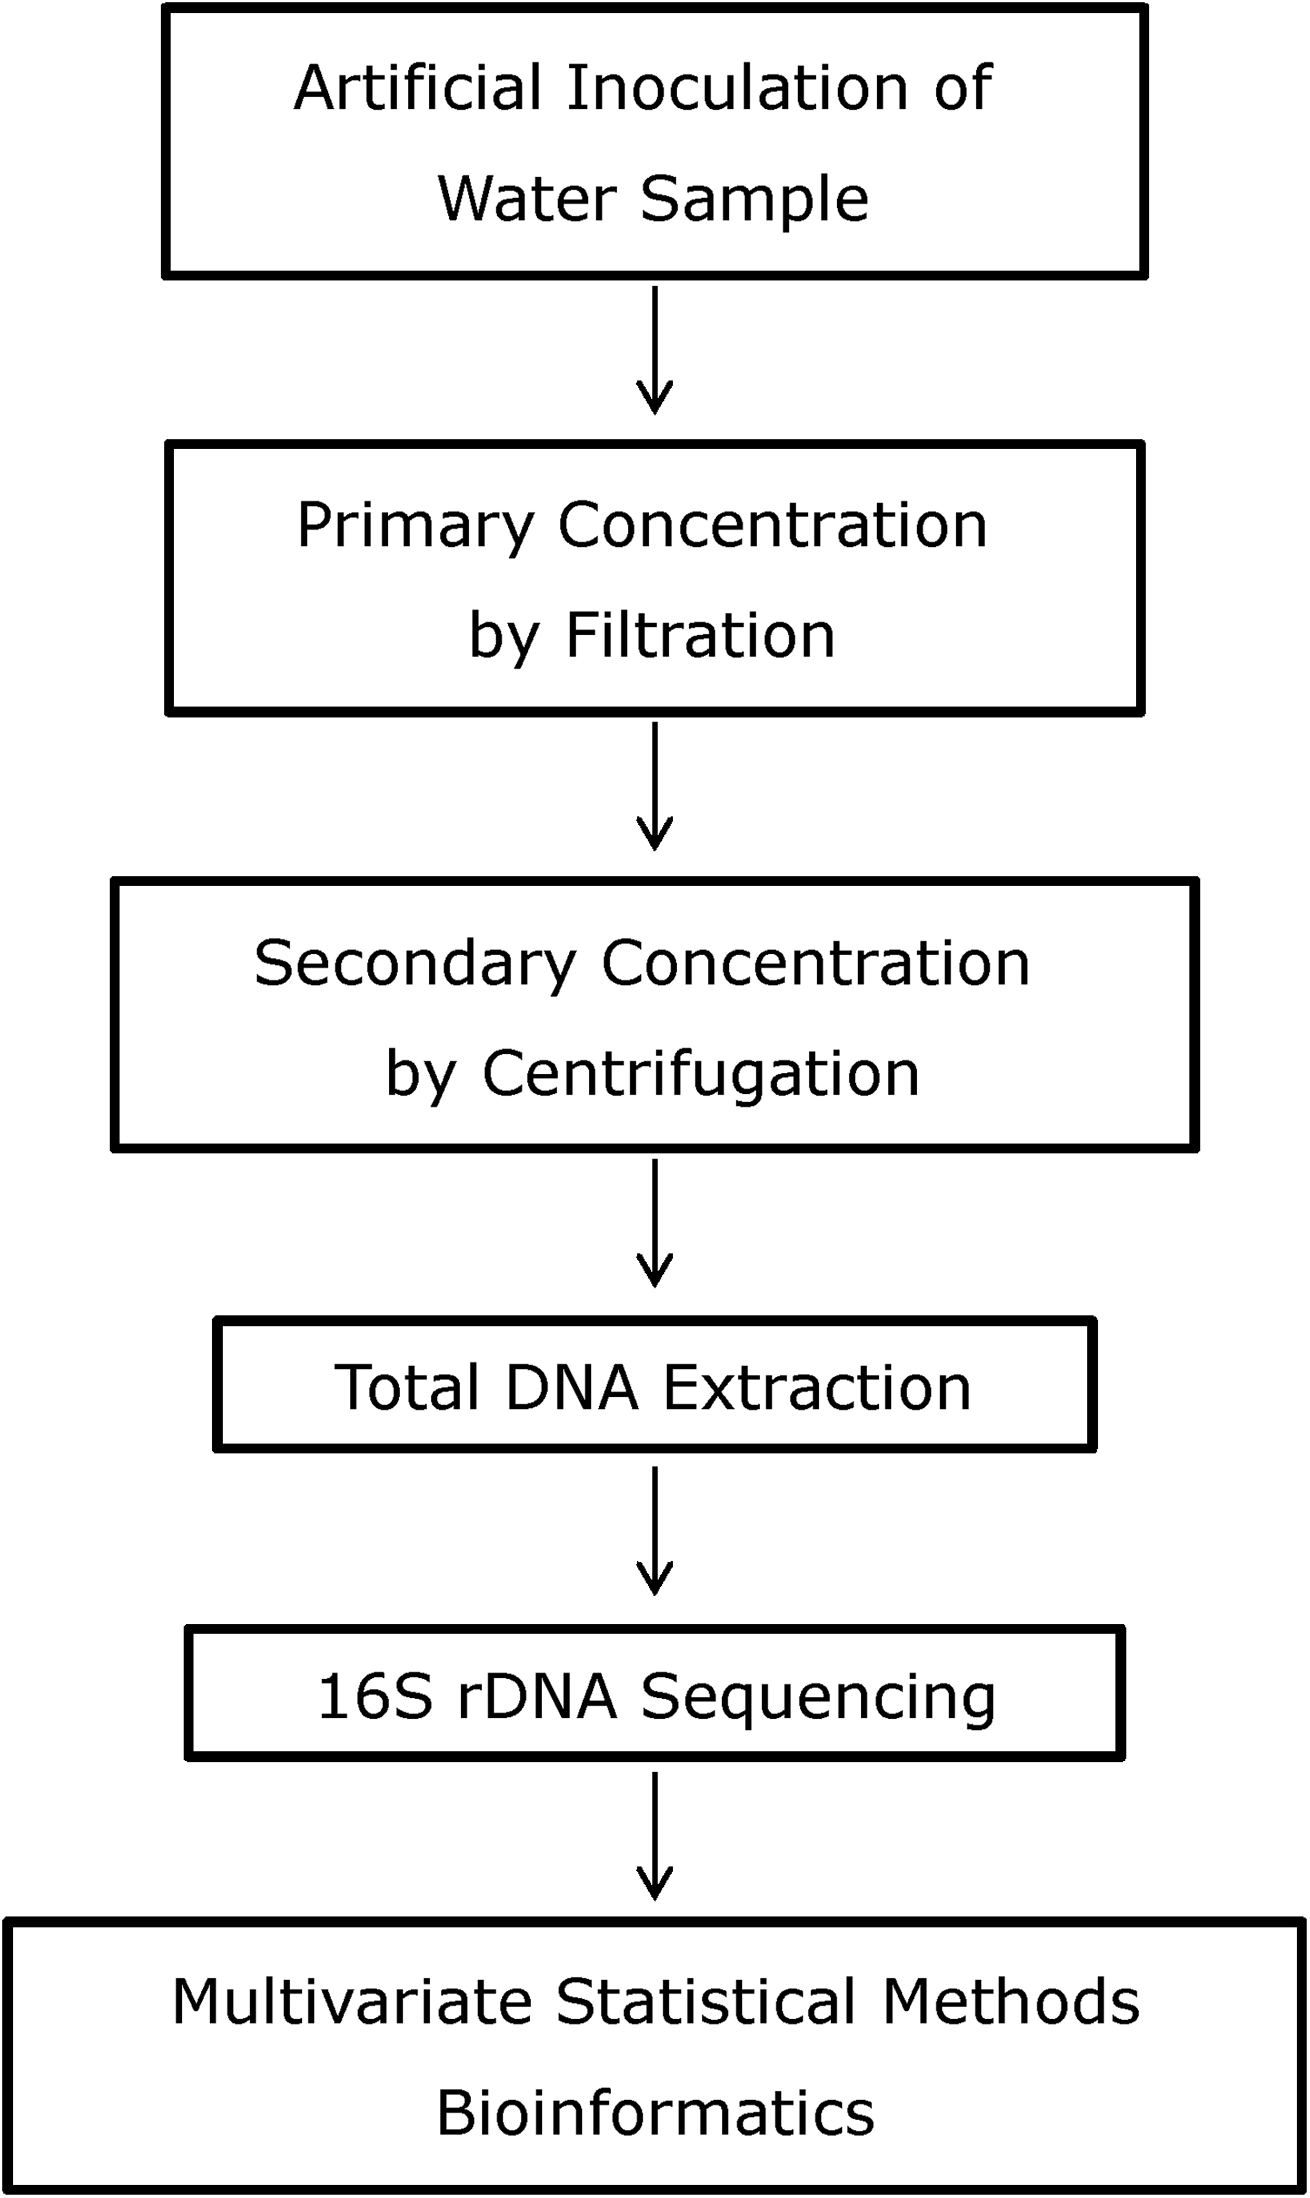
Schematic Overview of the Direct-Sequencing Approach Using the Marker 16S rDNA
Materials and Methods
Bottled Mineral Water
Four brands of noncarbonated natural mineral water originating in 2 countries were analyzed. This water was contained in 1.5 L or 2 L polyethylene terephthalate (PET) bottles and was purchased from local retail stores in Denmark and Sweden. Three of the brands were produced in Denmark (A, B, and D) and one in Norway (C). The bottles were stored at room temperature (20-25°C) prior to analysis.
Bacterial Strains and Inoculation of Water Samples
The strains used in this study are the 2 B. cereus strains, F2085/98 and NVH0597-99. 21 Cells were grown in 8 ml of Luria-Bertani (LB) broth (Sigma, Brøndby, Denmark) at 37°C for 18 h. A 10×dilution series in 0.9% NaCl was made, and the dilutions from 10−4 to 10−8 were plated in duplicates on Plate Count Agar (PCA, Oxoid, Greve, Denmark) and incubated overnight at 37°C. The weighted average of the Colony Forming Units (CFU) was calculated. The mineral waters (A-D, samples of 1.5 L) were inoculated with 1 of the 2 B. cereus strains in the levels 10, 102, 103, 104, 105, and 106 CFU/L, and all samples were performed in duplicate.
Sample Concentration and DNA Extraction
After B. cereus inoculation, each 1.5 L water sample was filtered using a Nalgene filtration assembly (Sigma-Aldrich, Brøndby, Denmark) through a 0.45 μm, 47 mm Whatman® Membrane Filter (GE Healthcare, Brøndby, Denmark). After filtration, the filter paper was transferred to a tube, and 2 ml Phosphate Buffered Saline (PBS, Sigma, pH 7.4)+1% Tween® 20 (Sigma) was added. The tubes were vortexed for 3×10 seconds, and the liquid was transferred to an Eppendorf tube and centrifuged for 10 min at 16,300×g. The supernatant was removed, and the resulting cell pellet was stored at −20°C until DNA purification.
DNA was purified from the cell pellet using the DNeasy Blood & Tissue Kit (Qiagen, Copenhagen, Denmark) with a modified Gram-positive protocol for the lysis step; lysis was done at 37°C for 60 min, and an RNase A digestion step was included. The DNA was stored at −20°C until further analysis.
Direct Sequencing and Data Processing
DNA from the water samples was amplified with universal 16S rDNA primers, 22 and PCR was thereafter performed according to Skånseng et al. 19 The PCR products were purified before sequencing, using 0.4 μl ExoSap-IT (USB Corp., Cleveland, Ohio) to 5 μl of PCR product. A universally conserved primer 23 was used for sequencing. The sequencing procedure was performed according to Skånseng et al. 19
The direct-sequencing spectra were aligned, trimmed, and processed with the use of MATLAB (MathWorks, Natick, MA) as described by Zimonja et al. 20 The generated data were imported into R v2.15.1 24 for PCA 25 and Unscrambler software v9.6 (CAMO Software) for MCR analysis. 26
Results
Classification of Total Bacterial Flora
The direct-sequencing approach of a universally conserved 16S rDNA gene region 27 was used for classification of the total bacterial flora in the water samples artificially contaminated with B. cereus. Of the 80 samples sequenced, spectra were obtained from 68 samples (data not shown), which were further analyzed.
The mixed spectra were first transformed into frequencies of pentamers for determination of the phylogenetic differences between the samples, and thereafter PCA was performed. 28 PCA is used to reduce the dimensionality of data with many variables, while retaining most of the variation in the data set. 29 PCA was chosen to describe the phylogenetic relations instead of the tree-based system to avoid DNA sequence alignment. The resulting PCA plot is shown in Figure 2. The 2 first principal components (PCs) explained 72% of the total variance in the data set, with PC1 representing 60% (Figure 2). Adding further PCs did not notably increase the percentage of variance explained. The samples in the lower left corner of the PCA plot were selected, and the corresponding sequences were searched in the Ribosomal Database Project (RDP) database. 30 This search was done in order to be able to identify which organisms were represented in the different samples. The microflora in these samples were identified as belonging to the order of Bacillales (Figure 2). PC1 separated the samples where Bacillus was detected from those where it was not detected. Furthermore, the 2 B. cereus isolates (F2085/98 and NVH0597-99) were separated by PC1, with samples inoculated with B. cereus NVH0597-99 in Bacillus group 1 and samples inoculated with B. cereus F2085-98 in Bacillus group 2 (Figure 2).
Principal Component Analysis (PCA) Score Plot. Principal component 1 (PC1) was plotted against PC2. The coloring of samples represents the level of B. cereus inoculation in the water, and symbols represent the water suppliers. The percentage shown on each axis represents the portion of variance explained by that principal component (PC). Circles around data points represent the 4 main groups that were visually identified from the PCA plot with the main order/genus that was identified in each group written next to the circle. Bacillus 1 and Bacillus 2 are 2 separate groups, where Bacillales was identified as the most frequently found in these samples.
Samples from the right part of the PCA plot were searched in RDP, and it was found that the flora of these samples were dominated by the orders Burkholderiales and Rhodocyclales, depending on the water supplier. The water suppliers A, B, and D were associated with Burkholderiales, whereas water type C was associated with Rhodocyclales.
Detection Level of B. cereus in Water Samples
MCR was used to determine the detection level. MCR is a method that estimates concentrations of contributing components when no prior information is available about the nature and composition of the mixtures analyzed. 26 One of the components from the MCR analysis, component 2, was found to explain the artificial contamination level of B. cereus. The relative amount of component 2 is shown in Table 1. Those samples with the highest relative values of component 2 (>0.5) were confirmed as Bacillus by search in RDP and BLAST.30,31 The interpretation is that artificial contamination with 105 and 106 CFU/L detects Bacillus. It was further seen that contamination with B. cereus NVH0597-99 gave higher relative values compared with F2085/98 at the same contamination level, and the tendency was that, with higher contamination levels, the difference between the 2 strains increased (data not shown). For both B. cereus isolates, it was possible to detect 105 CFU/L when inoculated in water from supplier C, whereas for the water from suppliers A and B, the detection was at 106 CFU/L. For the water from supplier D, it was not possible to detect B. cereus in any of the samples.
Results from the multivariate curve resolution (MCR) analysis for different contamination levels of Bacillus cereus for the investigated water suppliers A-D
The total number of samples for each inoculation level; the number in parenthesis is the number of samples that gave a sequencing result.
Mean relative amount±standard deviation.
Order listed with the most frequent first.
Discussion
In this study, a metagenomics-based direct-sequencing approach 27 for detection was evaluated on water samples artificially contaminated with B. cereus. Using this method for metagenomics-based analysis generates low amounts of data, which makes handling and analyzing the data easier compared with other metagenomics-based methods, since assembly of sequences is not necessary.
The sequence similarity between B. cereus and B. anthracis is very high,5,6 which makes it difficult to distinguish between them based on sequence analysis. Furthermore, studies have shown that certain isolates of B. cereus, such as the 2 strains used in this study, demonstrate the same growth pattern and germination and biochemical characteristics as B. anthracis. 21 From the PCA plot (Figure 2), the 2 strains of B. cereus seem to be separated by the PC1, even though they have highly similar DNA sequences. The separation is most likely not caused by the difference in water type, since the samples found positive for Bacillus originate from 3 different water suppliers (A, B, and C). The separation of the 2 B. cereus isolates by the PCA plot point to the possibility of distinguishing between B. anthracis and other related species like B. cereus and B. thuringiensis that normally pose a problem.5,6 Further studies using B. anthracis are needed to confirm this.
High-resolution melting curve analysis (HRM) on the amplified 16S rDNA genes could be an alternative to the sequencing step, also offering the possibility for quantification. 32 However, in order to use HRM on any potential bacterial pathogen in a sample, a complete database of melting point characteristics for all bacterial pathogens has to be established. Furthermore, it could be difficult to differentiate closely related species, such as B. cereus, B. thuringiensis, and B. anthracis, based solely on the melting point characteristics. A study by Klaschik et al. used HRM on the 16S rDNA gene to differentiate among 17 bacteria. 33 The melting curve analysis was able to classify most of the bacteria on species level, apart from Staphylococcus aureus and S. epidermidis. The 2 staphylococci could be classified only on species level.
From the MCR analysis (Table 1), it was found that the detection level of the B. cereus strains was around 105 to 106 CFU/L, depending on the water supplier, with water supplier D having the highest detection level. The relative amount values from water supplier D were lower compared with the other supplier at the same artificial inoculation concentration (data not shown). This could indicate that there is a difference in the composition of the water, of either the bacterial or chemical composition that might interfere with the filtration, DNA extraction, or the PCR amplification. The pH of the different water varies between pH 7.0 and 7.6 (values as stated on the bottles), which could affect the membrane filters. It has previously been demonstrated that changes in pH and salt concentrations can change the properties of the filter. 34 The water from the various suppliers contains differing amounts of Mg2+ and Ca2+. Excess Mg2+ is known to inhibit the PCR reaction, 35 and water from suppliers A, B, and D has more than 10 times as much Mg2+ as that from supplier C. High concentrations of Ca2+ can lead to a competitive binding by the DNA polymerase instead of Mg2+, making it inaccessible for the DNA polymerase and thereby decreasing the activity of the polymerase. 36 The higher concentrations of Mg2+ and Ca2+ for the water from suppliers A, B, and D could explain the lower detection level compared with that from supplier C. Furthermore, the filtration of the water, before the DNA extraction, results in a concentration of any inhibitors present in the samples. 37 In a further development of this method, it can be recommended to include a DNA extraction control to check for PCR inhibition. Those samples positive for Bacillus were also the ones having the highest relative amount value (>0.5), and this was observed only for samples with inoculation levels of 5 and 6 log CFU/L. Large standard deviations were noted for the low inoculation levels, indicating that for these samples the identification is less certain. Due to the short analysis time of this method, it is possible to include a short enrichment step to improve the detection level.
A better detection of B. cereus NVH0597-99 was seen from the MCR and PCA analysis (Table 1 and Figure 2, respectively), together with the sequence search in BLAST and RDP. Furthermore, a slightly higher number of samples with B. cereus NVH0597-99 were regarded as positive for Bacillus at a contamination level of 105 CFU/L compared with samples inoculated with B. cereus F2085/98. The difference in detection level of the 2 strains could be a result of differences in the DNA extraction efficiency or variations in 16S rDNA copy number, which has been shown to affect the amplification of 16S rDNA genes from mixed samples. 38 Generally, levels below 103 CFU B. cereus per g or ml of food are considered to be safe. 39 It has been shown that samples implicated in outbreaks of B. cereus contain>103 CFU/ml or g of food, 40 which would then be detectable using this method. The lethal dose of B. anthracis in humans resulting from consumption of contaminated food is not known, since data from both outbreak investigations and animal models show a huge variation in the LD values. 41 However, the detection level obtained in this study is in the same range as for other published methods.42,43
Another shortcoming of the described method is that it might be unable to detect contamination from spores. The spores from both B. cereus and B. anthracis are more resistant compared with vegetative cells. 44 The DNA-extraction method applied in this study might not be sufficient in releasing DNA from the spores, thus enabling amplification of the 16S rDNA gene, which would give a false-negative result. To solve this, the lysis step during the DNA extraction could be extended for sufficient release of DNA from spores. Another limitation of the method, which needs to be further investigated, is the possibility that the method can distinguish B. anthracis from B. cereus and B. thuringiensis. The 16S rRNA gene sequences of these species have been shown to have high levels of sequence similarity.5,45
The direct-sequencing method revealed a distinct difference in the composition of the background flora among the water from 4 suppliers. The background flora of the water was mainly dominated by the orders Burkholderiales and Rhodocyclales, which previously has been associated with bottled water. 46 Interestingly, the composition of the background flora seemed to depend on the country of origin of the water (Denmark or Norway). Further analysis has to be conducted to see if the differences are caused by variation in storage time and/or location prior to purchase. Studies have shown that location, temperature, and storage time have a profound effect on the variation of the bacterial flora.47-49 The results, however, imply that the method might be used for quality assurance to check the purity of bottled water, but further analysis with a larger sample set has to be conducted to confirm these findings.
In conclusion, the direct-sequencing method evaluated in this study has the potential to provide fast identification of unknown biological threats in an outbreak situation, enabling quick answers for the public and thereby minimizing economic consequences and further spread. The method presented here can be used to acquire knowledge about the variation of the normal background flora in a given matrix, which can be useful for detection and identification of any changes in the composition of the bacterial flora. By knowing the normal bacterial flora in a given matrix—for example, food or feed—a single sample can be used as an indicator for any abnormal microflora present, whether it is deliberate or accidental contamination. However, for the method to be applied to other kinds of biological matrices, additional optimization and verification are needed.
Footnotes
Acknowledgments
Thanks to Pia Engelsmann for technical assistance and to the National Veterinary Institute, Uppsala, Sweden, for kindly providing the B. cereus strains. The work was supported by the European Union–funded Integrated Project BIOTRACER (contract 036272) under the 6th RTD Framework and executed in the framework of the EU project AniBioThreat (Grant Agreement: Home/2009/ISEC/AG/191) with financial support from the Prevention of and Fight against Crime Programme of the European Union, European Commission—Directorate General Home Affairs. This publication reflects the views only of the authors, and the European Commission cannot be held responsible for any use that may be made of the information contained therein.