
Abstract
Molecular bioforensic research is dependent on rapid and sensitive methods such as real-time PCR (qPCR) for the identification of microorganisms. The use of synthetic positive control templates containing small modifications outside the primer and probe regions is essential to ensure all aspects of the assay are functioning properly, including the primers and probes. However, a typical qPCR or reverse transcriptase qPCR (qRT-PCR) assay is limited in differentiating products generated from positive controls and biological samples because the fluorescent probe signals generated from each type of amplicon are indistinguishable. Additional methods used to differentiate amplicons, including melt curves, secondary probes, and amplicon sequencing, require significant time to implement and validate and present technical challenges that limit their use for microbial forensic applications. To solve this problem, we have developed a novel application of electrospray ionization mass spectrometry (ESI-MS) to rapidly differentiate qPCR amplicons generated with positive biological samples from those generated with synthetic positive controls. The method has sensitivity equivalent to qPCR and supports the confident and timely determination of the presence of a biothreat agent that is crucial for policymakers and law enforcement. Additionally, it eliminates the need for time-consuming methods to confirm qPCR results, including development and validation of secondary probes or sequencing of small amplicons. In this study, we demonstrate the effectiveness of this approach with microbial forensic qPCR assays targeting multiple biodefense agents (bacterial, viral, and toxin) for the ability to rapidly discriminate between a positive control and a positive sample.
Molecular bioforensic research depends on rapid, sensitive methods such as real-time PCR (qPCR) to identify microorganisms. The authors developed a novel application of electrospray ionization mass spectrometry (ESI-MS) to rapidly differentiate qPCR amplicons generated with positive biological samples from those generated with synthetic positive controls. The method has sensitivity equivalent to qPCR and supports the confident and timely determination of the presence of a biothreat agent, which is crucial for policymakers and law enforcement. It also eliminates the need for time-consuming methods to confirm qPCR results.
The use of either of these techniques for microbial forensic analyses requires significant effort to prevent sample contamination and requires the inclusion of positive and negative controls to provide confidence in the accuracy of a given result. The use of positive controls is essential to ensure the target of interest will be detected each time the assay is performed, although it adds the risk of carryover contamination to the test sample. Synthetic templates are a typical choice for positive controls and are usually constructed to contain a small insert or deletion in a region outside the primer or probe binding regions of the target sequence. 4 These types of positive controls are indistinguishable from positive samples based solely on the threshold cycle (Ct) values obtained from a typical qPCR reaction. Therefore, any sample contamination with the positive control would result in a false positive detection in a negative sample by qPCR unless additional methods are used to distinguish between them. Previously available methods for differentiating true biological positive results from contamination events include dual probe assays, amplicon sequencing, and melt curves. Dual probe assays are complicated by the use of unnecessary additional probes that may not detect with the same sensitivity or specificity and require separate validation studies. Amplicon sequencing requires extensive molecular manipulations that are difficult in biocontainment, and it is technically challenging for small amplicons less than 200 base pairs. Melt curve analysis requiring amplicon detection with a saturation dye is incompatible with the validated probe-based qPCR detections discussed in this study.
PCR followed by electrospray ionization mass spectrometry (PCR/ESI-MS) provides a fast alternative for amplicon interrogation and is amenable to forensic applications. The technology is a rapid, high-throughput method for identifying, characterizing, and quantifying microorganisms including bacteria, viruses, and fungi.5-7 The PCR/ESI-MS technique identifies microorganisms by determining the precise molecular mass of the individual strands of the PCR products followed by bioinformatic triangulation based on the calculated unambiguous base compositions of those products. Briefly, PCR amplicons are ionized into the gas phase by electrospray-ionization (ESI), which separates the 2 DNA strands, and each strand is then “weighed” by the mass spectrometer with enough accuracy to determine the base composition (ie, the number of adenines, guanines, cytosines, and thymines) of the amplicon. While the base composition of the intact amplicon does not convey the order of the bases, it readily distinguishes single nucleotide polymorphisms (SNPs) and length variants. Because the products from a test sample and a positive control containing an insertion or deletion will have different molecular masses due to different lengths (and thus different base compositions), this method can be used to address the issue of positive control contamination in test samples. This rapid confirmation of the presence of a biological agent is critical for microbial forensic investigators and for policymakers who are tasked with supporting public safety.
We investigated the ability of ESI-MS to quickly and accurately differentiate between positive control and test sample products from both qPCR and qRT-PCR reactions used to identify pathogens of microbial forensic interest. Multiple sample types, including nucleic acids from bacterial, viral, and eukaryotic organisms, were used to test the effectiveness of ESI-MS to differentiate isolate test sample products from synthetic positive control products.
Materials and Methods
Isolate and Control Nucleic Acid Samples
DNA samples from Brucella melitensis Switzerland F6145 (Bm), Francisella tularensis Vienna (Ft), Ricinus communis Indian HC4 (Rc), Rickettsia prowazekii Breinl (Rp), Rickettsia rickettsii Bitterroot VR891 (Rr), and Rickettsia typhi Wilmington (Rt) were acquired from the National Bioforensic Repository Collection (Columbus, OH). Clostridium botulinum Type F 27321 (Cb) DNA was provided by Richard Robison (Brigham Young University, Provo, UT). RNA from Nipah 199901924 Malaysia Prototype (Ni), Hendra Lung-1 strain (He), and Flexal BeAn 293022 (Fl) virus samples was extracted from cell lysates in Trizol LS (Invitrogen, Carlsbad, CA). Control synthetic templates (CSTs) for F. tularensis and R. communis were received from Naval Medical Research Center (Bethesda, MD). All other CSTs were purchased from American International Biotechnology Services (AIBioTech, Glen Allen, VA).
qPCR and qRT-PCR Reactions
Serial dilutions of the nucleic acids (CSTs and isolate) were amplified by qPCR or qRT-PCR using the ABI7900 (Applied Biosystems, Foster City, CA). Data were analyzed using the SDS software, version 2.3 (Applied Biosystems). DNA templates and CSTs (5 μl) were amplified in replicates of 6, using TaqMan™ Gold with Buffer A (Applied Biosystems) in a final volume of 50 μl in 1X buffer. Ten replicates of no template control (NTC) were identical to the isolate and CST reactions but lacked a nucleic acid template. Reaction mixes contained dATP, dCTP, and dGTP each at 0.25 mM (Bm, Ft, Rc) or 0.2 mM (Rp, Rt, Rr); dUTP at 0.5 mM (Bm, Ft, Rc) or 0.4 mM (Rp, Rt, Rr); MgCl2 at 5 mM (Rc, Rp, Rr, Rt), 6 mM (Ft), or 3.5 mM (Bm); forward and reverse primers each at 0.3 μM (Ft, Rc), 0.2 μM (Rp, Rt), 0.4 μM (Rr), or 0.6 μM forward and 0.3 μM reverse (Bm); probe at 0.2 μM (Rc, Rr), 0.3 μM (Rp, Rt), 0.4 μM (Ft), or 0.15 μM (Bm). Cycling conditions were 95°C for 10 min followed by 45 cycles of 95°C for 15 s and 60°C for 1 min. Sequences for the primers (Eurofins MWG Operon, Huntsville, AL) and probes (Applied Biosystems or Integrated DNA Technologies, Coralville, IA) for the reactions can be found in Table 1.8-11
Primer and Probe Sequences for qPCR and qRT-PCR
For each target, forward (F) and reverse (R) primers, and probe (P) sequences are shown.
Naval Medical Research Center; communicated by Joan Gebhardt.
Lawrence Livermore National Laboratory; communicated by Elizabeth Vitalis.
RNA templates and CSTs (5 μl) were amplified in replicates of 6 using SuperScriptIII Platinum One-Step Quantitative RT-PCR System w/ROX (Invitrogen) in a final reaction volume of 50 μl. Ten replicates of NTC were identical to the isolate and CST reactions but lacked a nucleic acid template. Reaction mixes contained forward and reverse primers, each at 0.9 μM (Ni), 0.3 μM (He), or 0.2 μM (Fl), and probes at 0.2 μM (Ni), 0.15 μM (He), or 0.1 μM (Fl); additional MgSO4 was added at 2.5 mM to the He reaction only. Cycling conditions were 50°C for 30 min, 95°C for 10 min, followed by 45 cycles of 95°C for 15 s and 60°C for 1 min. Sequences for the primers (Eurofins MWG Operon) and probes (Applied Biosystems or Integrated DNA Technologies) for the reactions can be found in Table 1.12,13
Mass Spectrometry for Base Composition Analysis
To determine the precise molecular mass of both strands of the qPCR and qRT-PCR products, the samples were analyzed by ESI-MS on a PLEX-ID (Abbott Laboratories, Carlsbad, CA). The method used was essentially that described using the first PCR/ESI-MS instrument, the Ibis T5000 biosensor.6,14 Unambiguous base compositions (nA nG nC nT nU) were determined for both strands of the qPCR and qRT-PCR amplicons from their exact mass measurements.
qPCR Product Sequencing
The Clostridium botulinum qPCR product was sequenced from the forward and reverse primers with BigDye Terminator 1.1 (Applied Biosystems) following the manufacturer's instructions on ABI Prism 3130 XL Genetic Analyzer (Applied Biosystems). Data from 4 forward and 4 reverse replicates were analyzed with Sequencher v 4.9 (Gene Codes Corp, Ann Arbor, MI).
Template Mixture Experiment
qPCR and qRT-PCR reactions were performed as described except that CST and isolates were intentionally mixed prior to amplification to mimic a contamination event. Rickettsia rickettsii isolate and CST were combined at approximately 10,000 isolate and 100 CST copies as an example for qPCR. Flexal virus isolate and CST were combined at approximately 100 isolate and 10 CST copies as an example for qRT-PCR.
Results
Differentiation Between Isolate and Positive Control Synthetic Template Amplicons by ESI-MS
Nucleic acids (DNA or RNA) from the organisms listed in Table 1, including viral, bacterial, and plant species, and the associated CSTs from each were detected successfully by qPCR and qRT-PCR analysis. Serial dilutions (6 replicates each) of isolate and associated CST nucleic acids were analyzed by either qPCR (DNA isolates) or qRT- PCR (RNA isolates) followed by ESI-MS. The qRT-PCR reaction products from the RNA templates contained 4 bases (A, G, C, and T). The qPCR products from the DNA templates contained 5 bases (A, G, C, T, and U), because the reaction conditions for the qPCR resulted in the incorporation of uracils. The DNA primers used in these reactions contained thiamines, while the Taq™ polymerase incorporated uracils for the remainder of the product.
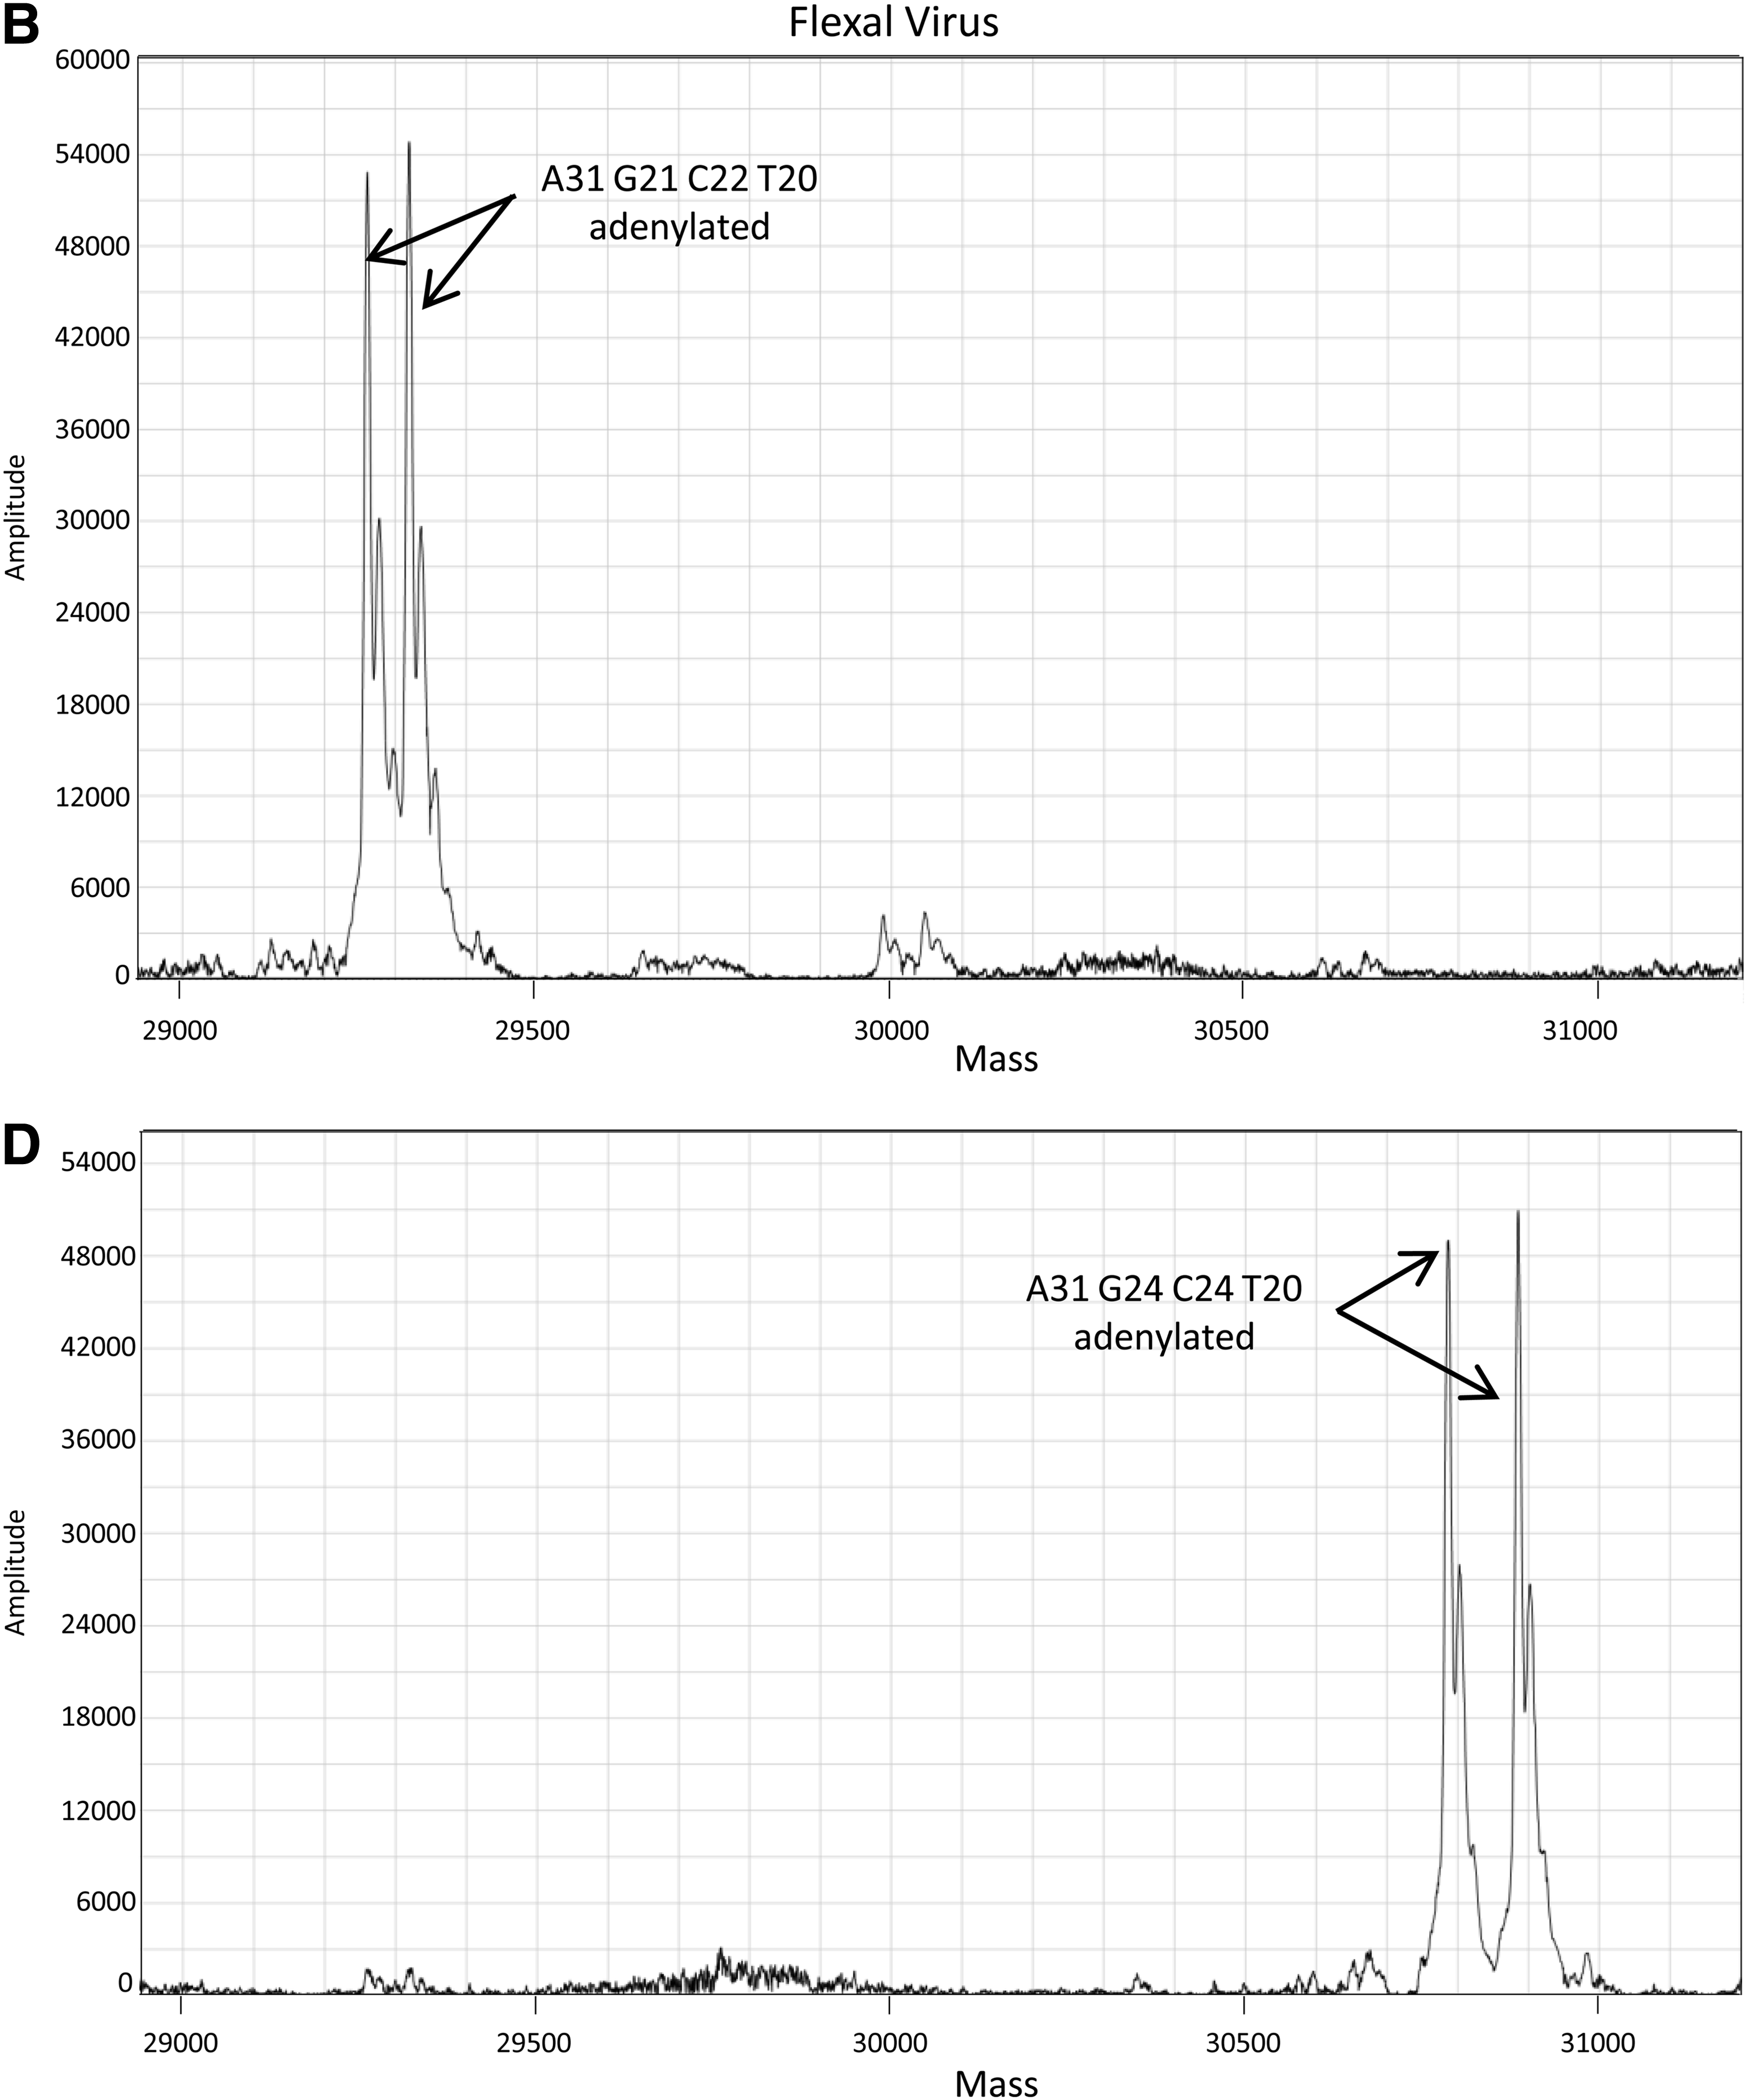
The contribution to the molecular mass of all 5 nucleotides must be taken into account for qPCR products when determining the base composition of the forward and reverse strands using the ESI-MS method. Additionally, if the polymerase incorporates nontemplated adenosines, 15 that factor must also be addressed during the calculations to determine base composition. The products of the qPCR and qRT-PCR reactions comprised both nonadenylated and adenylated forms (see Figure 1).
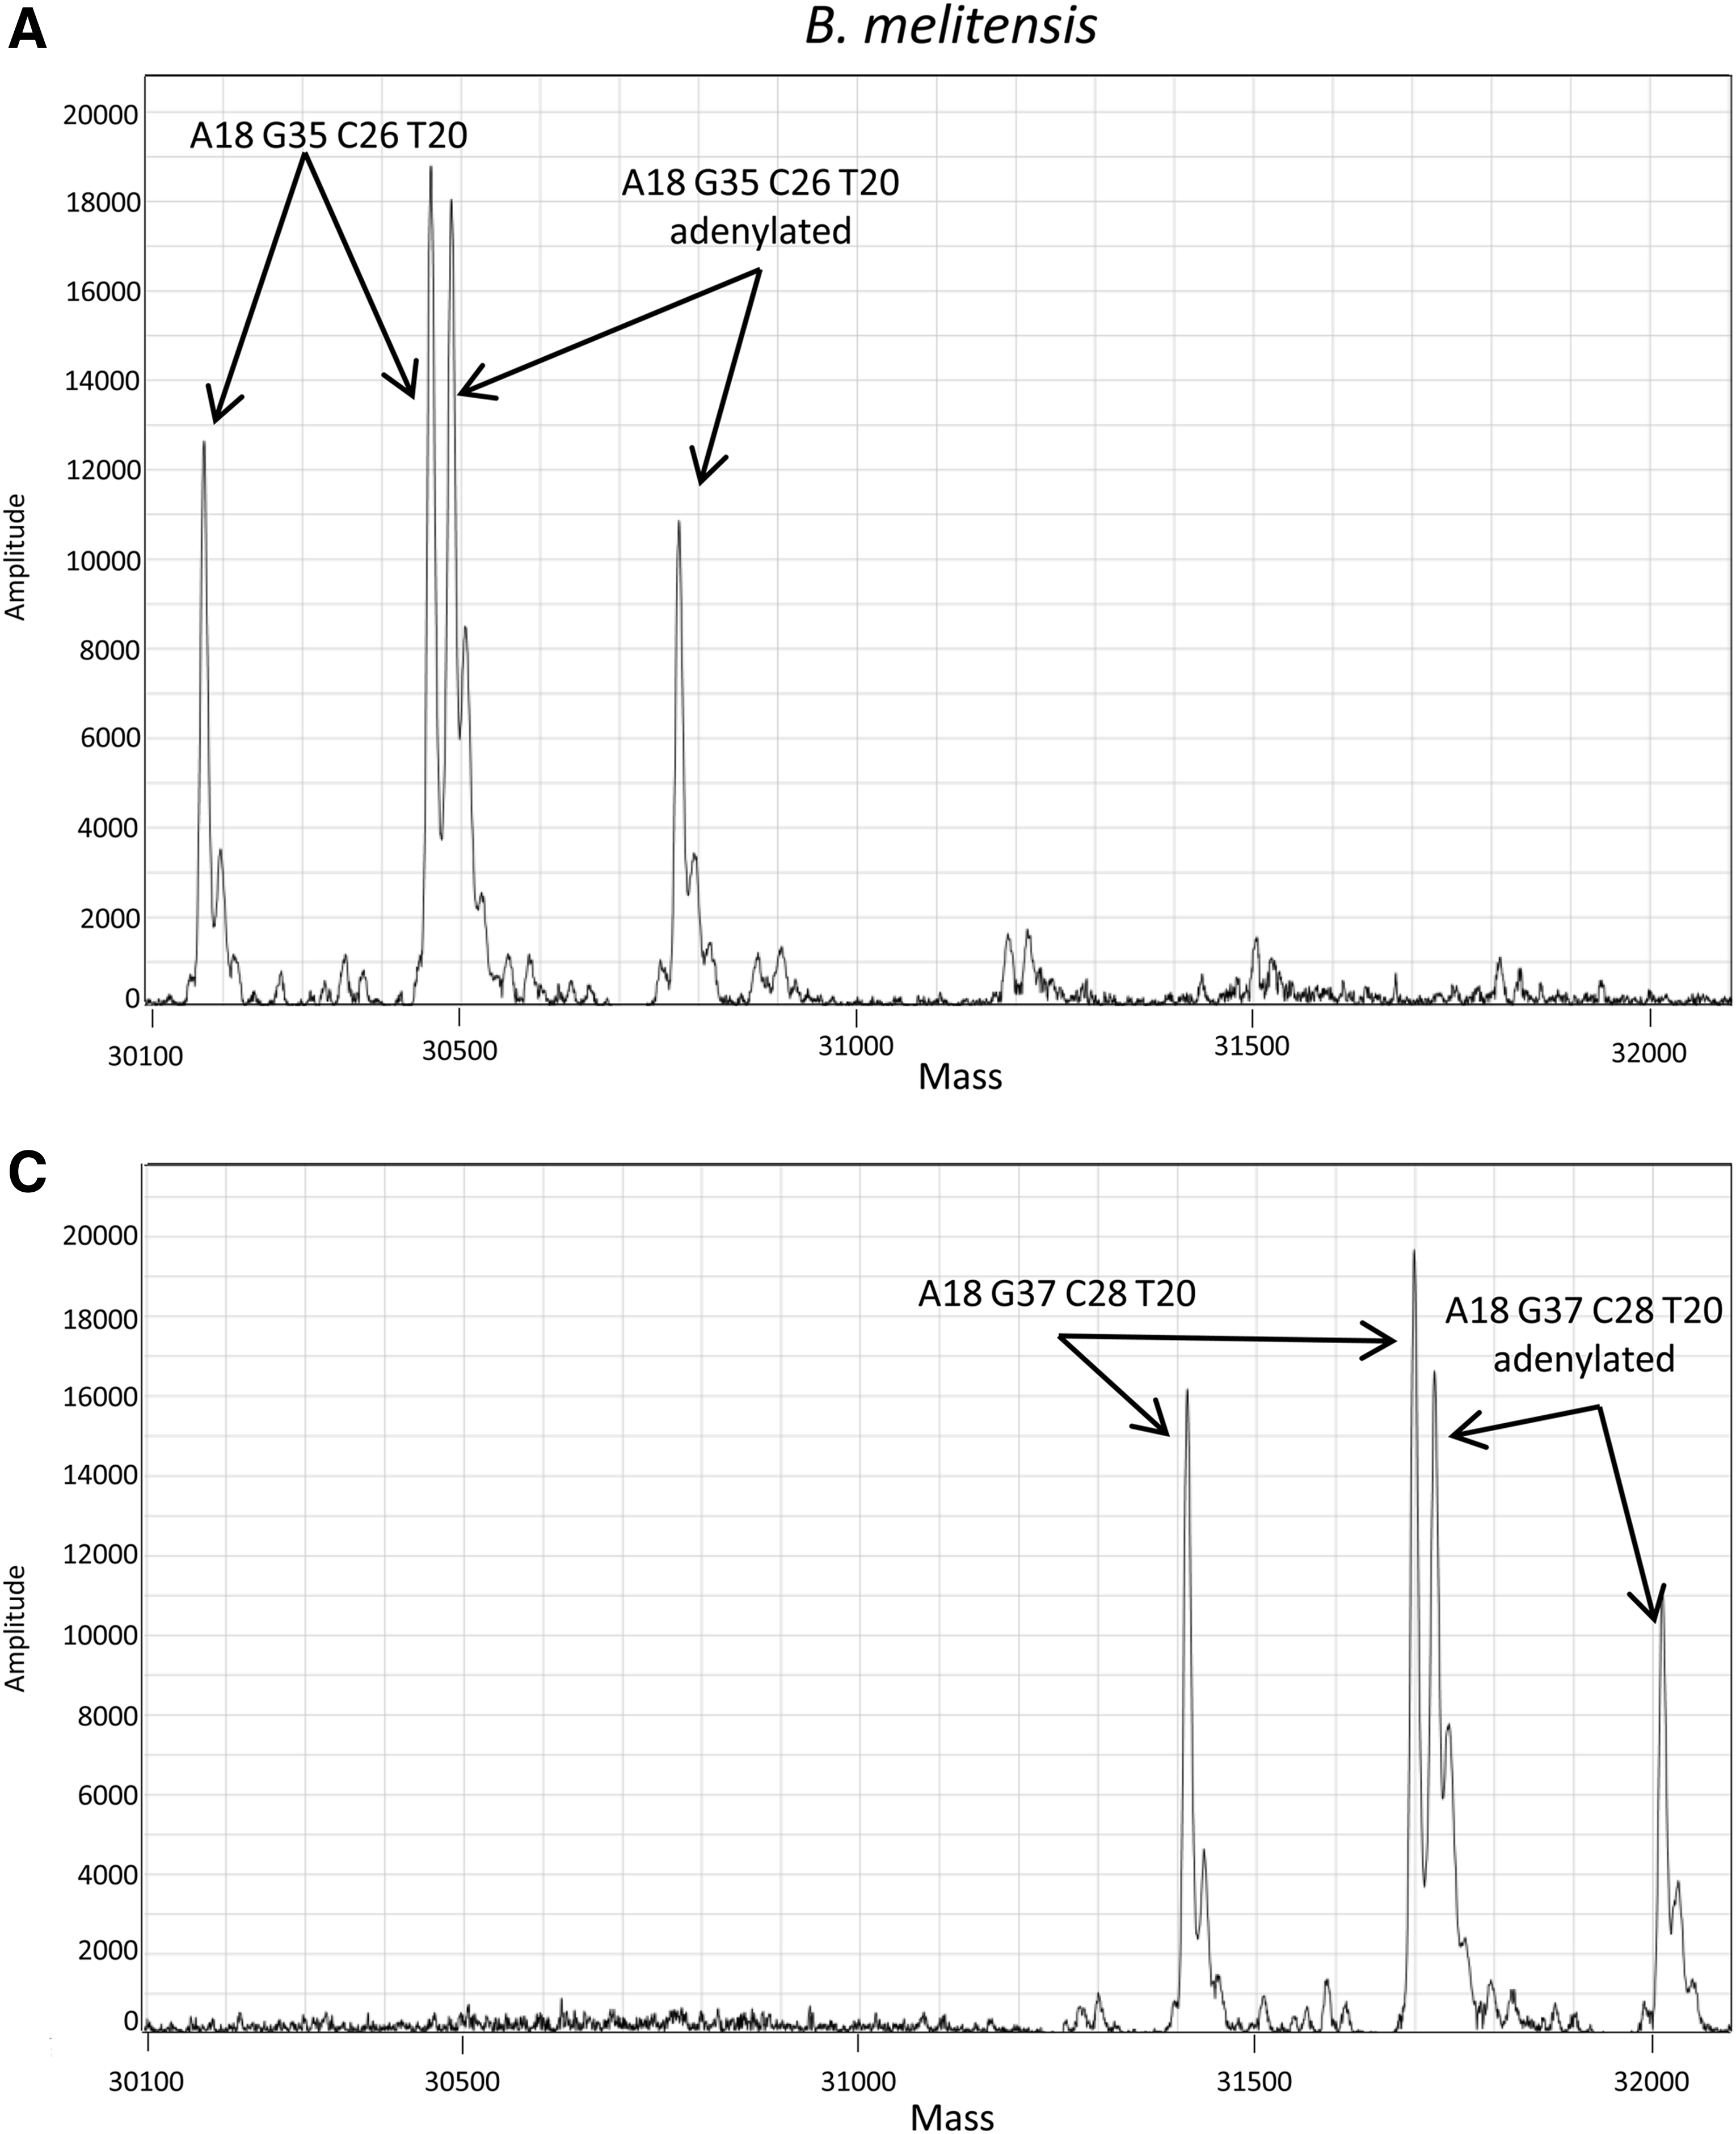
Representative ESI-MS mass spectra for qPCR (B. melitensis) and qRT-PCR (Flexal virus). B. melitensis (A) and Flexal virus (B) isolates; B. melitensis (C) and Flexal virus (D) CSTs. Panels are drawn to scale to illustrate the shift in molecular weight of the isolate and CST products. Arrows indicate forward and reverse strands with base compositions shown for the forward strand.
Initial test isolate nucleic acid concentrations were dependent on availability of template, and copy numbers were estimated from a standard curve derived from each associated CST. For each test isolate nucleic acid and associated CST, replicate Ct values were determined. Reaction products were further analyzed by ESI-MS to determine precise base composition for differentiation between isolate and CST qPCR or qRT-PCR products. The forward strand base compositions determined for the amplicon products are shown in Table 2.
qPCR and qRT-PCR Forward Strand ESI-MS Base Count from Isolates and CSTs
CST=control synthetic template.
Reported values are for the native strand (nonadenylated).
Average Ct values and the number of positive replicates for the templates are listed in Table 3 (DNA isolates) and Table 4 (RNA isolates). Depending on the analyzed concentrations for each isolate, sensitivity of qPCR and qRT-PCR for target nucleic acids ranged from a single copy to tens of copies. Because contamination carryover is an important issue with highly sensitive assays, it was important to differentiate between isolate and CST products. Samples were subjected to ESI-MS base composition analysis as described 16 to specifically identify the products in each reaction, differentiating between isolate and CST products.
Correlation of Isolate and CST qPCR and ESI-MS Positive Identifications
CST=control synthetic template.
NTC=no template control.
NA=not applicable.
For isolate, copy numbers are estimated from standard curve derived from CST.
Average Ct values reflect the number of positives (out of 6) as reported in the qPCR Positives column.
ESI-MS positives reflect the number of samples that produced clearly defined peaks on the mass spectra of the correct MW for both the forward and reverse strands with and/or without adenylation.
Correlation of Isolate and CST qRT-PCR and ESI-MS Positive Identifications
CST=control synthetic template.
NTC=no template control.
NA=not applicable.
For isolate, copy numbers are estimated from standard curve derived from CST.
Average Ct values reflect the number of positives (out of 6) as reported in the qRT-PCR Positives column.
ESI-MS positives reflect the number of samples that produced clearly defined peaks on the mass spectra of the correct MW for both the forward and reverse strands with and/or without adenylation.
Standard deviation not applicable as only one replicate was detected.
Representative mass spectra for a qPCR reaction (B. melitensis) and a qRT-PCR (Flexal virus) reaction are shown in Figure 1. The shift in molecular weight between the isolate and CST is clearly discernible. All detected products from the Flexal virus reaction contained an extra adenosine as a result of nontemplate adenylation as determined by the ESI-MS. However, the products from the B. melitensis reaction contained both nontemplated adenylated strands and nonadenylated strands. A variety of adenylated and nonadenylated product patterns were observed from the various isolates and CSTs analyzed in this study. The base compositions for the forward strand of each isolate and CST in Table 2 were calculated taking into account the presence of both uracils and thiamines, but for clarity, they were reported as if thiamines only were incorporated. Likewise, all reported base counts reflect native products without extra adenylation.
Identical base compositions were determined at each dilution for all targets and reflected the expected composition of each isolate and its associated CST for each reaction product. All qPCR and qRT-PCR positive reactions were detected by ESI-MS; however, there were instances of ESI-MS detection of amplicons that did not result in defined Ct values from the qPCR and qRT-PCR reactions (Table 3, R. communis isolate copy level of 1, 4/6 PCR positives vs. 6/6 MS positives; Table 4, Nipah virus CST copy level of 10, 1/6 PCR positive vs. 4/6 MS positives).
Template Mixture Experiments
In the event of an actual contamination, some level of CST would be unknowingly introduced into the isolate sample reaction. It is impossible to know from Ct values the levels of the specific CST and isolate amplicons. These mixtures, while indistinguishable by Ct, were clearly resolved in ESI-MS analysis.
As an example of a contaminated qPCR reaction, 10,000 copies of Rickettsia rickettsii isolate and 100 copies of its specific CST were combined in 6 replicates prior to thermocycling. The combined Ct average was 33.45±0.10, representing both products as they are indistinguishable by this assay alone. As seen in Figure 2A, the ESI-MS analysis clearly differentiated and individually identified the products from both templates.
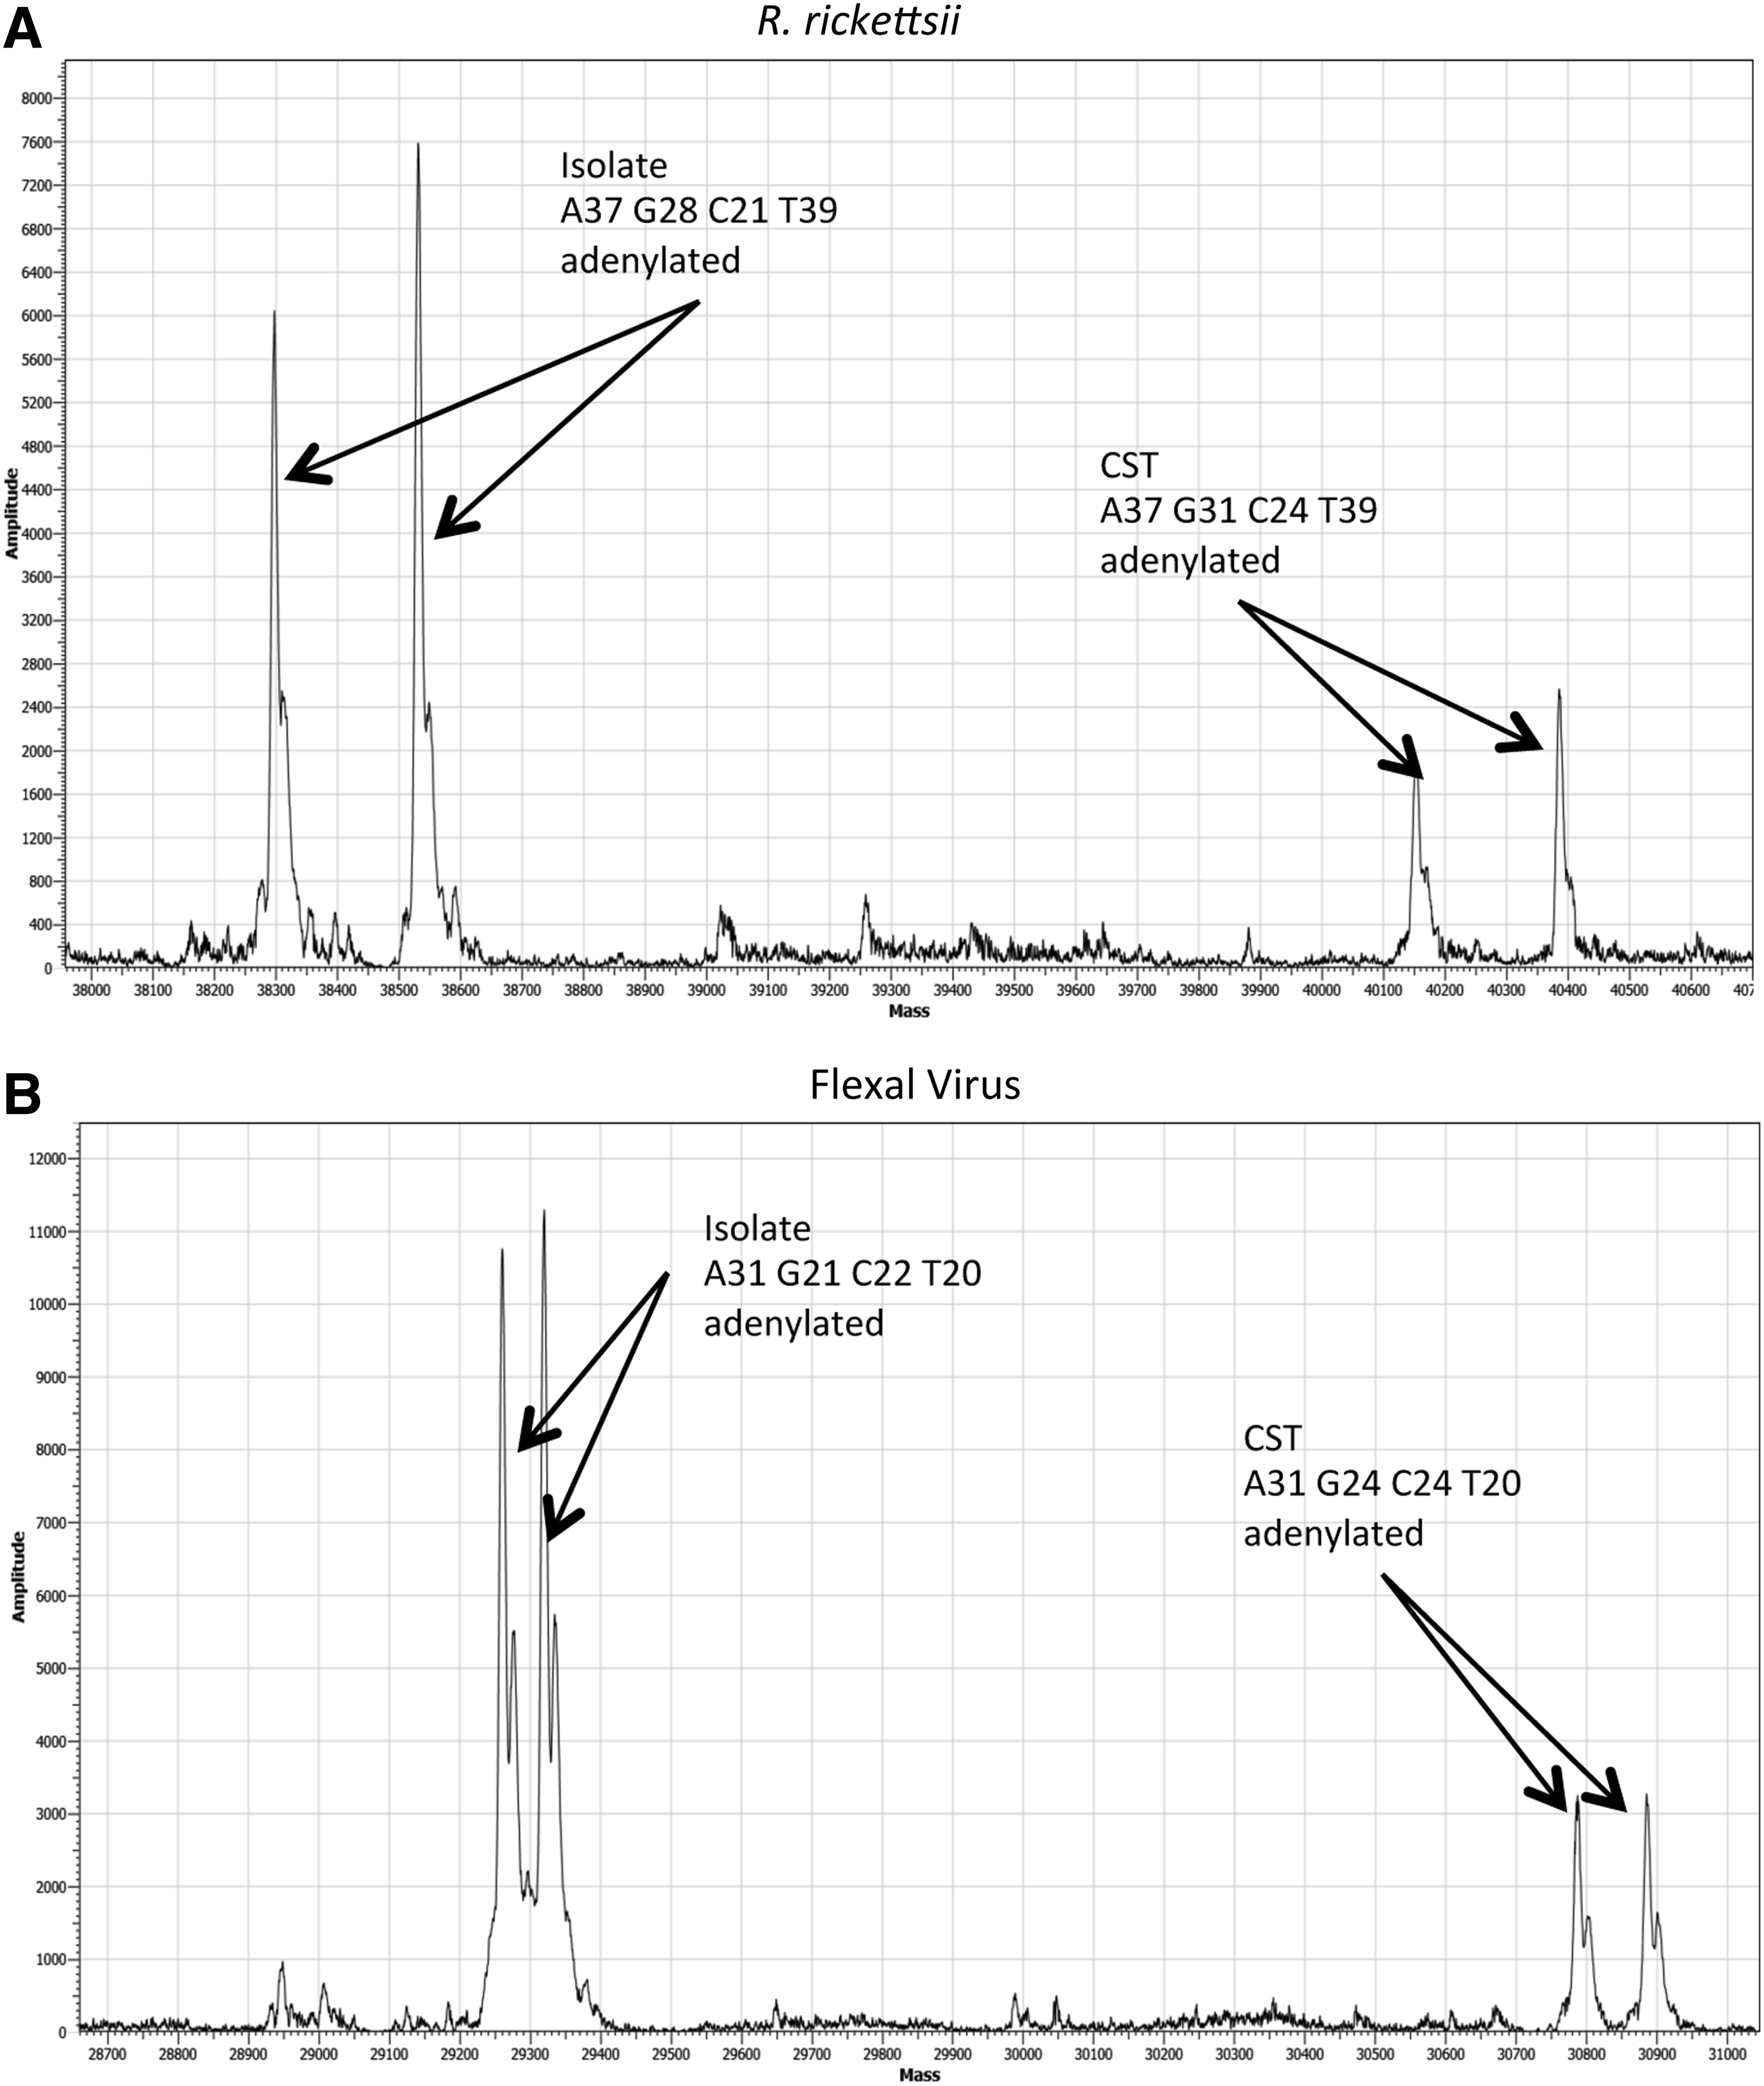
Representative ESI-MS mass spectra of isolate and CST from reaction mixtures containing both isolate and CST templates during qPCR (R. rickettsii) and qRT-PCR (Flexal virus). Reaction mixtures contained an excess of isolate template over CST with approximately 10,000 copies of isolate and 100 copies of CST for R. rickettsii (A) and approximately 100 copies of isolate and 10 copies CST for Flexal virus (B).
Flexal virus was chosen to provide an example of mixed templates in qRT-PCR. The combined templates contained isolate at approximately 100 copies and the CST at approximately 10 copies. Their combined Ct average was 31.51±0.21, again representing both products. As seen in Figure 2B, the ESI-MS analysis, again, clearly differentiated and identified the products from both templates.
SNP Detection and Verification
The sensitivity of the ESI-MS allowed detection of a SNP between the C. botulinum F isolate qPCR product and the composition reported for the reference in GenBank (Accession CP000728.1). The detected base count from the isolate nucleic acid differed from the predicted reference GenBank base count by an A-G SNP (Figure 3A). Subsequent sequence analysis of the purified isolate amplicon DNA confirmed the A-G SNP transition (Figure 3B).
SNP identification for the C. botulinum isolate. Identification of SNP by ESI-MS base count determination (A); SNP confirmation by DNA sequence analysis (B). Isolate sequence was compared to GenBank reference sequence for C. botulinum F (Accession CP000728.1).
Discussion
qPCR methods are useful for microbial forensics due to the ability of these techniques to detect low levels of specific nucleic acid sequences from bacterial, viral, and eukaryotic agents. Positive controls are essential to demonstrate full functionality each time the assay is performed. Typically, the positive control template is identical to the test sample except for a small sequence variation, such as an insertion or deletion of several bases. When testing an unknown sample, it is important to establish that a positive result was not due to contamination by the positive control. Individual reactions (qPCR or qRT-PCR) alone are not capable of distinguishing between a true positive and a false positive arising from contamination with positive control. However, a true positive will differ in sequence and molecular weight from the positive control and therefore can be differentiated using detection methods such as ESI-MS.
A key attribute of the ESI-MS method described above is that, because it employs a method of detection and analysis that is completely orthogonal to (and independent of) conventional fluorescence-based qPCR approaches, it provides an independent method with which to interrogate the threat space. Thus, use of ESI-MS based methods in conjunction with standard qPCR methods has the potential to significantly reduce or eliminate false alarms. False positives can have deleterious effects on public health and biodefense surveillance programs, as they erode the confidence of both the policymakers and the public they strive to protect. Misinterpreting a positive-control carryover event as the positive detection of a high consequence biodefense organism in an operational sample would have serious downstream implications and would come at a significant cost. The cost is not only the financial impact of an unnecessary building evacuation (and potentially an unnecessary building decontamination); one must also consider the cost of reduced efficiency of affected personnel and infrastructure and the associated reduction in operational readiness.
The confirmation of a positive qPCR or qRT-PCR result has required DNA sequence analysis of the product, which is time consuming and problematic for short products without additional molecular manipulation. ESI-MS provides a rapid alternative means of confirmation with a time frame of less than an hour following the identification of a potential positive with no additional manipulation. The primary limitations of using ESI-MS to determine amplicon base composition are its inability to elucidate base linking order and its practical size maximum of approximately 160 nucleotides. 7
Both the forward and reverse strands of the qPCR and qRT-PCR products generate a peak of specific molecular weight determined by the ESI-MS. Base composition can be determined from the precise molecular mass determination of the forward and reverse strand for each product using bioinformatic calculations.6,14 The difference between a true positive and a positive control is readily apparent in the mass spectrum and is reflected in unique base composition identifications.
In this study, we demonstrated equivalent sensitivity between qPCR or qRT-PCR detection and ESI-MS detection of the same products. Products from both reaction types were successfully identified by ESI-MS, and in some cases the ESI-MS was able to detect positive samples that were negative by qPCR or qRT-PCR (undetermined Ct value). Products from bacterial, viral, and plant nucleic acids from organisms of biodefense interest were successfully detected at very low levels and were distinguished from their respective positive controls.
The ability of ESI-MS analysis to identify CST contamination in an isolate sample was demonstrated for both qPCR and qRT-PCR conditions. While both templates contributed to the Ct value, it was only with the ESI-MS analysis of the reaction products that the contribution from both templates was identified. The CST contamination was clearly identified even though it was a minor constituent of the reaction template.
Additionally, the molecular weight as determined by ESI-MS indicated a potential SNP in the C. botulinum F isolate that we evaluated compared to the reference sequence reported in GenBank. The SNP was not likely due to polymerase error during qPCR as it was identified in each of the multiple replicates tested. The SNP was confirmed by sequencing analysis, which identified the specific G to A transition predicted by the ESI-MS analysis. Other techniques such as melt curve analysis may also have predicted the presence of the SNP but would still require confirmation by sequencing.
The ESI-MS successfully detected multiple base differentials between isolates and positive controls as well as a single base SNP in one of the isolates. The technique has broad applicability for quality control of qPCR and qRT-PCR reactions. In addition to previously reported capabilities identifying PCR products and qPCR products,6,16 here we demonstrated the successful identification of qPCR reactions containing 5 different nucleotides (including uracils) by ESI-MS. A limitation of the technique is the inability to identify positional changes that do not result in an overall base composition change for an individual strand. For example, an A to G SNP on the same amplicon as a G to A SNP results in a pair of offsetting “mass silent” differences that would be elucidated by amplicon sequencing but that are indistinguishable by mass spectrometry.
Verification of positive results is crucial in the detection of biothreat agents. ESI-MS sizing of qPCR and qRT-PCR amplicons serves as a convenient method for such critical result verification. The method allows the use of identical primers and probes to eliminate ambiguity that may arise from the use of alternative primers, probes, or detection methods to discriminate controls from test samples. Other methods such as melting curve analysis are incompatible with probe-based qPCR detection such as those used in this analysis, and the use of additional PCR probe(s) introduces new variables, requiring a completely separate validation performed in a restrictive biocontainment environment while not guaranteeing equivalence in sensitivity or specificity. The ESI-MS method provides vital confidence to scientists, policymakers, and law enforcement officials that the detected signal originates from the presence of a biological agent rather than the positive control.
Footnotes
Acknowledgments
The authors thank Jennifer Goodrich for useful discussions throughout the work described here. We also thank Neill White and Robin Warren for their contribution to the determination of the correct base counts from the determined molecular masses.