
Abstract
Introduction:
Graph theory has been applied to study the pathophysiology of multiple sclerosis (MS) since it provides global and focal measures of brain network properties that are affected by MS. Typically, the connection strength and, consequently, the network properties are computed by counting the number of streamlines (NOS) connecting couples of gray matter regions. However, recent studies have shown that this method is not quantitative.
Methods:
We evaluated diffusion-based microstructural measures extracted from three different models to assess the network properties in a group of 66 MS patients and 64 healthy subjects. Besides, we assessed their correlation with patients' disability and with a biological measure of neuroaxonal damage.
Results:
Graph metrics extracted from connectomes weighted by intra-axonal microstructural components were the most sensitive to MS pathology and the most related to clinical disability. In contrast, measures of network segregation extracted from the connectomes weighted by maps describing extracellular diffusivity were the most related to serum concentration of neurofilament light chain. Network properties assessed with NOS were neither sensitive to MS pathology nor correlated with clinical and pathological measures of disease impact in MS patients.
Conclusion:
Using tractometry-derived graph measures in MS patients, we identified a set of metrics based on microstructural components that are highly sensitive to the disease and that provide sensitive correlates of clinical and biological deterioration in MS patients.
Impact statement
Graph theory has been widely used to study the alterations in the structural connectivity of multiple sclerosis (MS) patients. Usually, brain graphs used for the extraction of network metrics are created by counting the number of streamlines connecting gray matter regions, however, this method is not quantitative. In this study, we used tractometry to average the values of diffusion-based microstructural maps along the reconstructed streamlines. Our results show that network metrics extracted from the connectomes weighted on microstructural maps provide sensitive information to MS pathology, which correlate with clinical and biological measures of disease impact.
Introduction
Multiple sclerosis (MS) is a disease of the nervous systems characterized by focal and diffuse inflammation and degeneration, which variably affect structural and functional connectivity (Rolak, 2003). Demyelination and axonal degeneration are cardinal features of MS, which affect specific tracts but also alter brain networks, both locally and globally (Rolak, 2003).
Hence, methods to assess global and local network properties are valuable to investigate the pathophysiology of MS, as well as to better understand its clinical and biological impact.
Tractography allows reconstructing noninvasively the major fiber tracts of the white matter (WM), which are identified through “streamlines” (Yeh et al., 2020). The map of streamlines—that is, structural connections of the brain that form a “connectome”—can be modeled as a network, where nodes correspond to gray matter regions and edges represent the streamline connections between pairs of them (Sotiropoulos and Zalesky, 2019).
The weight of an edge in a connectome reflects the inter-regional connection strength between brain regions and aims to characterize biologically interpretable properties such as axon density and demyelination (Kamagata et al., 2019). This network formalism (graph theory) allows characterizing brain connectivity in vivo and studying a wide range of neurological diseases (Sotiropoulos and Zalesky, 2019). Graph theory permits in fact the analysis of connectivity at the topological level by extracting some metrics that may capture pathology-related alterations (Van Wijk et al., 2010).
The most common strategy to weight connectome edges is based on counting the number of streamlines (NOS) connecting each pair of regions (Jones et al., 2013; Sotiropoulos and Zalesky, 2019). However, recent studies have highlighted that this approach lacks specificity and it is not quantitative in fact, tractography algorithms, propagate through the estimated fiber orientation without considering the density of the underlying bundles. Thus, although tractography is very effective in recovering the major fiber pathways, it does not inform about the number of axons constituting these fiber bundles (axon density). For this reason, NOS cannot be considered a valid biomarker of the strength of connection between regions (Jones et al., 2013; Sotiropoulos and Zalesky, 2019; Yeh et al., 2020).
To retrieve information on the underlying tissue and, in turn, to get more biologically interpretable properties, several microstructural diffusion-based models have been combined with the estimated streamlines (Bells et al., 2011).
The most common model is diffusion tensor imaging (DTI) that characterizes the measured diffusion displacement as a three-dimensional (3D) Gaussian process, which completely describes the molecular mobility along each axis and the correlation between the movements and the axes (Descoteaux, 2008; Le Bihan et al., 2001). However, DTI assumes a single fiber population in each voxel, therefore, it does not provide sufficient information of the individual tissue microstructure features. However, more advanced models have the ability to isolate the signal contribution from different tissue compartments, further increasing the specificity to different tissue subtypes (Alexander et al., 2019). These models include neurite orientation dispersion and density imaging (NODDI) (Zhang et al., 2012) and spherical mean technique (SMT) (Kaden et al., 2015, 2016).
NODDI explicitly takes orientation dispersion of the neurites into account and models three microstructural environments in a voxel: intracellular (or intra-axonal), extracellular (or extra-axonal), and cerebral spinal fluid (or free water) compartments (Zhang et al., 2012). SMT, instead, investigates the tissue microscopic features independently from the fiber's orientation. This characteristic allows minimizing the confounding effects derived from fiber crossing, curving, and orientation dispersion. Furthermore, this method exploits a microscopic diffusion model that describes the signal coming from the tissue microenvironment to estimate the microscopic features specific to the intraneurite and extraneurite compartments (Kaden et al., 2015, 2016).
The analysis of the connectomes with graph theory has been previously applied to MS patients (Fleischer et al., 2019; Kocevar et al., 2016; Li et al., 2013; Nigro et al., 2015; Ozturk et al., 2010; Pagani et al., 2020; Pardini et al., 2015; Rocca et al., 2016; Schiavi et al., 2020b). The results of studies comparing MS patients with healthy controls (HCs) have shown that different global structural network changes occur in MS patients (Fleischer et al., 2019; Kocevar et al., 2016; Li et al., 2013; Nigro et al., 2015; Ozturk et al., 2010; Pagani et al., 2020; Pardini et al., 2015; Rocca et al., 2016; Schiavi et al., 2020b). Some studies evidenced that transferring and processing of information within the networks of patients with MS are less efficient with respect to HCs (He et al., 2009; Schiavi et al., 2020b; Shu et al., 2011), whereas other studies revealed an increase in network segregation in MS patients compared with HCs (Gamboa et al., 2014; Llufriu et al., 2017; Richiardi et al., 2012; Rocca et al., 2010; Schiavi et al., 2020b; Tewarie et al., 2014).
In this study, we investigated the pathology-related alterations in connectomes of MS patients compared with HCs using tractometry (Bells et al., 2011). This technique weights the connections obtained from tractography by averaging the tissue properties estimated from diffusion-based microstructural maps along their paths, hereby providing more quantitative estimates than the NOS and better biological interpretability. More precisely, we investigated which microstructural maps and which global network metrics extracted from them are more sensitive to alterations in the structural connectivity of MS patients. Furthermore, we performed a clinical and biological validation of tractometry by assessing their relationship with (1) the Expanded Disability Status Scale (EDSS) (Kurtzke, 2009) and (2) serum neurofilament light polypeptide (sNfL) levels, which is a promising biomarker of neuroaxonal injury (Khalil et al., 2018).
Subjects/Materials and Methods
Subjects
Sixty-six MS patients (39 females, 43.9 ± 14.5 years, 20 primary/secondary progressive, and 46 relapsing remitting) and sixty-four HCs (38 females, 36.9 ± 12.8 years) were enrolled in this study, refer to Table 1 for more details. The inclusion criteria for the enrollment of MS patients included (1) age between 18 and 75 years, (2) MS diagnosis fulfilling McDonald criteria (Thompson et al., 2018), (3) absence of neurological or psychiatric disease other than MS, and (4) absence of contraindications in subjects for magnetic resonance imaging (MRI). MRI and sNfL were assessed at least 3 months after a clinical relapse/corticosteroid treatment and the assessment of disability scores (EDSS) was performed within 3 months from the MRI in case of clinically stable patients (Disanto et al., 2017).
Demographic and Clinical Characteristic of Multiple Sclerosis Patients and Healthy Controls
Demographic and clinical characteristics of MS patients (divided according to the clinical phenotype of the disease) and HCs.
EDSS, expanded disability status scale; F, female; HCs, healthy controls; M, male; max, maximum; min, minimum; MS, multiple sclerosis; NfL, neurofilament light polypeptide; PP, primary progressive MS patients; RR, relapsing remitting MS patients; SD, standard deviation; SP, secondary progressive MS patients; TOT, total.
The ethical review committee of the University Hospital Basel (IRB of Northwest Switzerland) approved the study, and all participants entered the study after written consent.
MRI acquisition
All subjects underwent MRI on a 3T system (Prisma; Siemens Healthcare, Erlangen, Germany) with 64-channel head and neck coil. The acquisition protocol included (1) 3D FLAIR (repetition time [TR]/echo time [TE]/inversion time [TI] = 5000/386/1800 ms) 1 mm3 isotropic spatial resolution; (2) 3D MP2RAGE (TR/TI1/TI2 = 5000/700/2500 ms) 1 mm3 isotropic spatial resolution; and (3) multishell diffusion (TR/TE/impulse duration [d]/time between impulses [D] = 4.5 s/75 ms/19 ms/36 ms) 1.8 mm3 isotropic spatial resolution with b values 700/1000/2000/3000 s/mm2 and 6/20/45/66 diffusion directions, respectively, per shell, and 12 measurements at b value 0 s/mm2 with both anterior to posterior and reversed phase encoding.
Anatomical images
MS lesions were semiautomatically segmented with an automatic in-house deep learning-based method (La Rosa et al., 2020), followed by manual correction. This method takes as input both FLAIR and MP2RAGE MRI contrasts and consists of two convolutional neural networks. Thus, WM lesion masks were manually corrected on the FLAIR sequences and filled on the T1 images to improve the registration and the segmentation steps on the patients' images.
We processed T1-filled images with FreeSurfer and we used the standard Desikan–Killiany atlas (Desikan et al., 2006) for the automatic segmentation that provides cortical and subcortical parcellation of 85 (42 for hemisphere + brainstem) regions of interest.
Diffusion MRI processing
Diffusion MR images were corrected for movement artifacts and susceptibility induced distortions using eddy and top-up commands from FMRIB Software Library (FSL) (Gibbs and Liu, 2015; Horsfield, 1999; Yamada et al., 2014). To reconstruct the whole brain anatomically constrained tractography, we performed the five-tissue-type segmentation on T1 images using MRtrix3 (Tournier et al., 2019), a step that is necessary to retrieve the tissue information according to the FSL algorithm (Smith et al., 2012). Once the five tissues were obtained, they were registered to the diffusion space using FMRIB's linear image registration tool with boundary-based algorithm provided by FSL (Jenkinson et al., 2002). We estimated the response functions for each individual tissue type, as segmented by T1, to perform multitissue spherical deconvolution, and we generated 3 millions of streamlines using the iFOD2 algorithm of MRtrix3 (Tournier et al., 2019).
To reduce the incidence of false positives that are typical of probabilistic tractography (Sarwar et al., 2019), we set the power parameter to 3. The power option, in fact, directly influences the magnitude of the conservative estimates of fiber orientation used by iFOD2. With a power of infinity, theoretically, iFOD2 is turned into a deterministic algorithm that is known to find fewer false positives at the price of potentially introducing false negative. However, because of the loss of tissue and edema in the lesion areas, a pure deterministic algorithm might be less efficient in reconstructing all the pathways in MS patients. Thus, we tuned this parameter by visually inspecting the tractographies.
To compute microstructural maps from the DTI model, we used the measurements with b ≤ 1000 s/mm2 for the fitting of the diffusion tensor in FSL (O'Donnell and Westin, 2011). We retrieved the microstructural maps of fractional anisotropy (FA), mean diffusivity (MD), and radial diffusivity (RD). The first describes the degree of the diffusion process anisotropy, the second is the mean of the three eigenvalues of the diffusion tensor, whereas the third describes the diffusion perpendicular to the main diffusion direction (Le Bihan et al., 2001). To fit the NODDI model, we used the AMICO software (Daducci et al., 2015) on measurements with b ≤ 2000 s/mm2 and obtained the maps of intraneurite volume fraction (ICVF) and isotropic volume fraction (ISOVF). The former describes the intracellular environment, whereas the latter describes the free water in the extracellular environment (Zhang et al., 2012).
For the extraction of microstructural maps from SMT, we used the open-source code available at
Connectome estimation
As reported in Figure 1, we generated the connectomes using the cortical and the subcortical regions of gray matter as nodes and the estimated streamlines as edges with different weights. For the NOS, we created a matrix containing in each cell the NOS that start from one region and arrive in another region (0 = no connection).
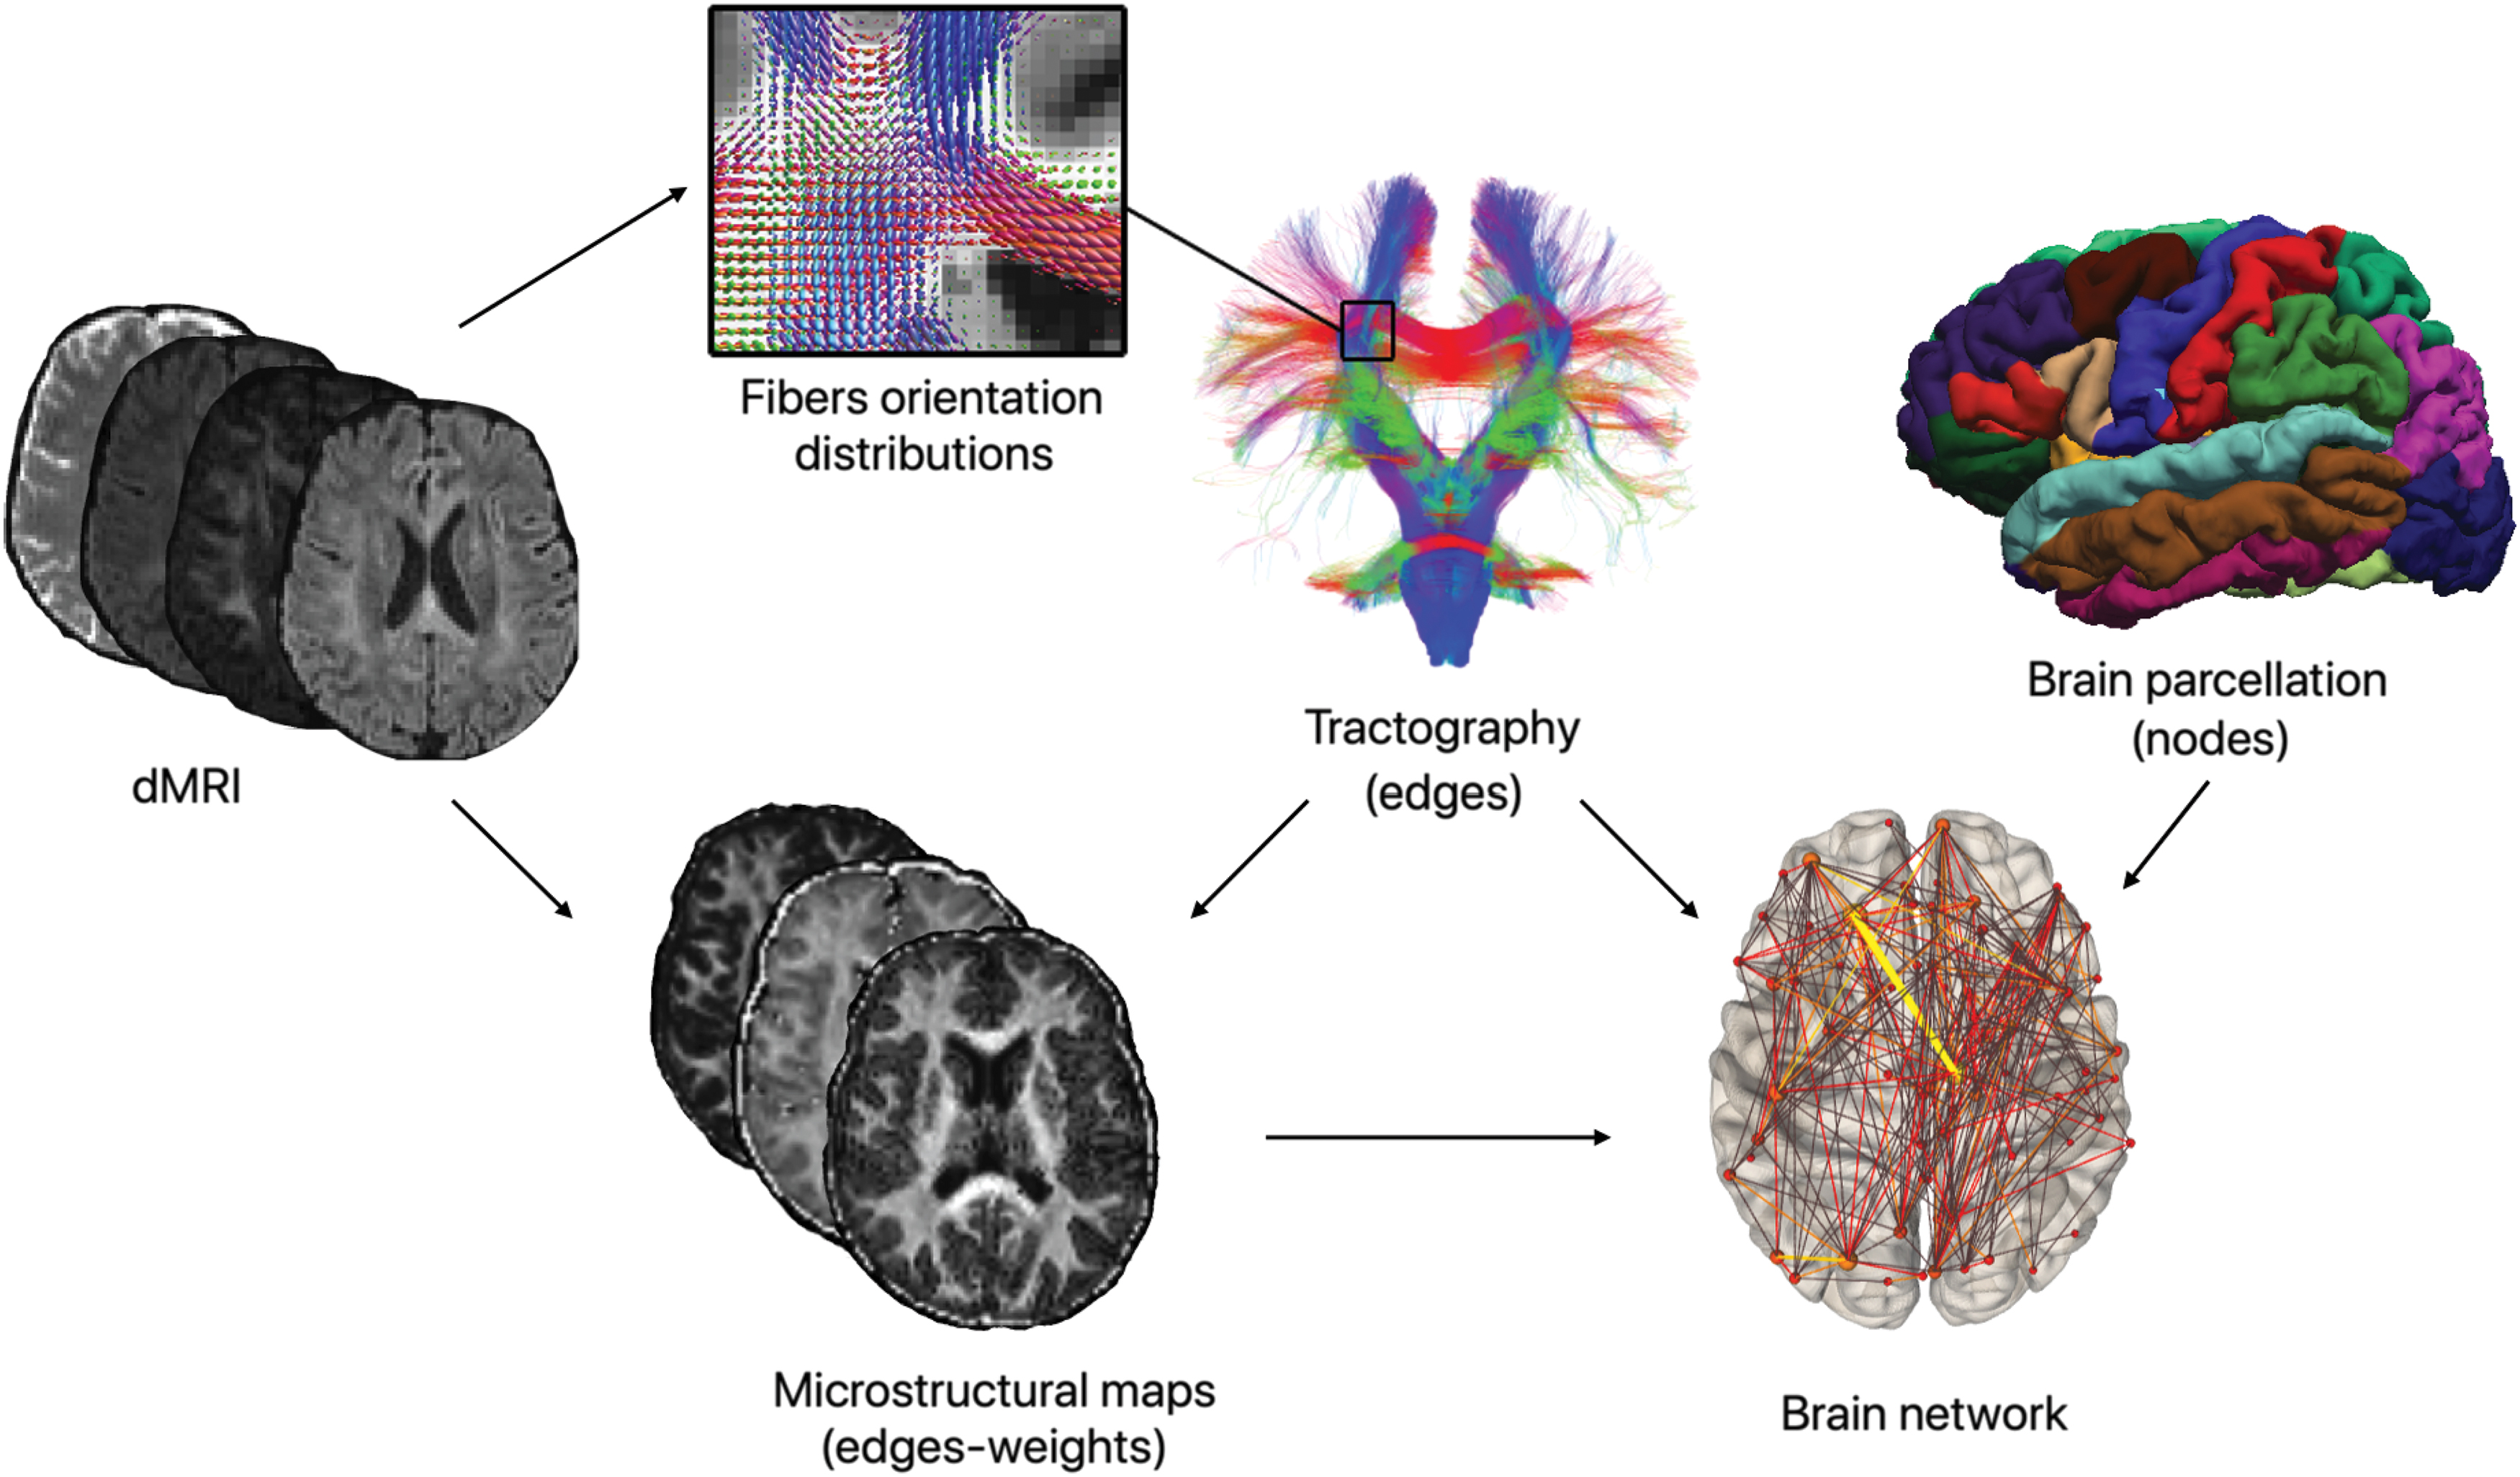
Pipeline for the construction of brain graphs weighed using tractometry. By combining the parcellation of gray matter regions, the streamlines computed using tractography, and the different diffusion-based microstructural maps, we obtained the weighted connectomes. Using these weighted connectomes, we built the brain graphs from which we calculated the global network metrics to analyze the topological properties of the networks. dMRI, diffusion-weighted magnetic resonance images. Color images are available online.
To obtain the other connectomes, we used tractometry and computed the average value along the tracts of the previously described scalar maps extracted from the microstructural models DTI, NODDI, and SMT to assess the connectivity in a more quantitative way. These maps, in fact, provide information on the morphological structure of axons. To achieve this, using MRtrix3 (Tournier et al., 2019), we sampled the streamlines of each bundle in n points and then we averaged the values of the microstructural maps described in Diffusion MRI Processing section evaluated at those spatial coordinates. This approach is expected to produce more quantitative estimates of the connectivity that are presumed to lead to a better interpretation of biological features (Bells et al., 2011).
Network metrics
As suggested in Sotiropoulos and Zalesky (2019), we filtered the connectomes by removing the connections that were not present in at least 50% of HCs, to remove eventual spurious WM connections (Buchanan et al., 2020; Zalesky et al., 2010).
To remove eventual bias coming from the ease in tracking shorter connections, we also zeroed all the values on the diagonal (Griffa et al., 2013). Then, we used Brain Connectivity Toolbox to extract from each connectome five global network metrics: density, which is the ratio between actual and possible connections, efficiency, which corresponds to the average inverse shortest weighted path length and is inversely related to the characteristic path length, modularity, which reflects the network segregation, clustering coefficient, which indicates the degree on which nodes tend to cluster together, and mean strength, which corresponds to all the nodal strength average where the nodal strength is defined as the sum of the edges' weight connected to a node.
The algorithms that are usually applied for the extraction of network metrics explicitly assume that in weighted brain networks, edges with the highest weights delineate the strongest and most reliable connections (Zalesky et al., 2010). However, in our study, we have also weighted the connections with MD, RD, ISOVF, EXTRATRANS, and EXTRAMD maps. According to this weighting approach, edges with high values may represent connections that traverse voxels characterized by the presence of cerebrospinal fluid. Thus, high edge weights do not indicate stronger connections and violate the underlying assumptions for network analysis. To avoid this issue, as suggested in Zalesky et al. (2010), we applied the negative logarithm transformation to each entry of these weighted connectomes, to consider the edges with the original lower weights as the most likely communication paths.
Statistical analysis
The statistical analysis was performed in R using robust models to account for eventual outliers (Koller and Stahel, 2011). First, we tested the differences in density among the two groups of subjects using a robust linear model with age and gender as covariate. Density was significantly different between HCs and MS patients (p < 0.001). We then tested the relationship between density and T2 lesion volumes using Pearson correlation, accounting for gender and age as covariates. As expected, Figure 2 shows that density is negatively related with the volume of the WM lesions (p < 0.001, σ = −0.611). Thus, in accordance with what is reported in Schiavi et al. (2020b) and Van Wijk et al. (2010), we added this variable among the confounding factors.
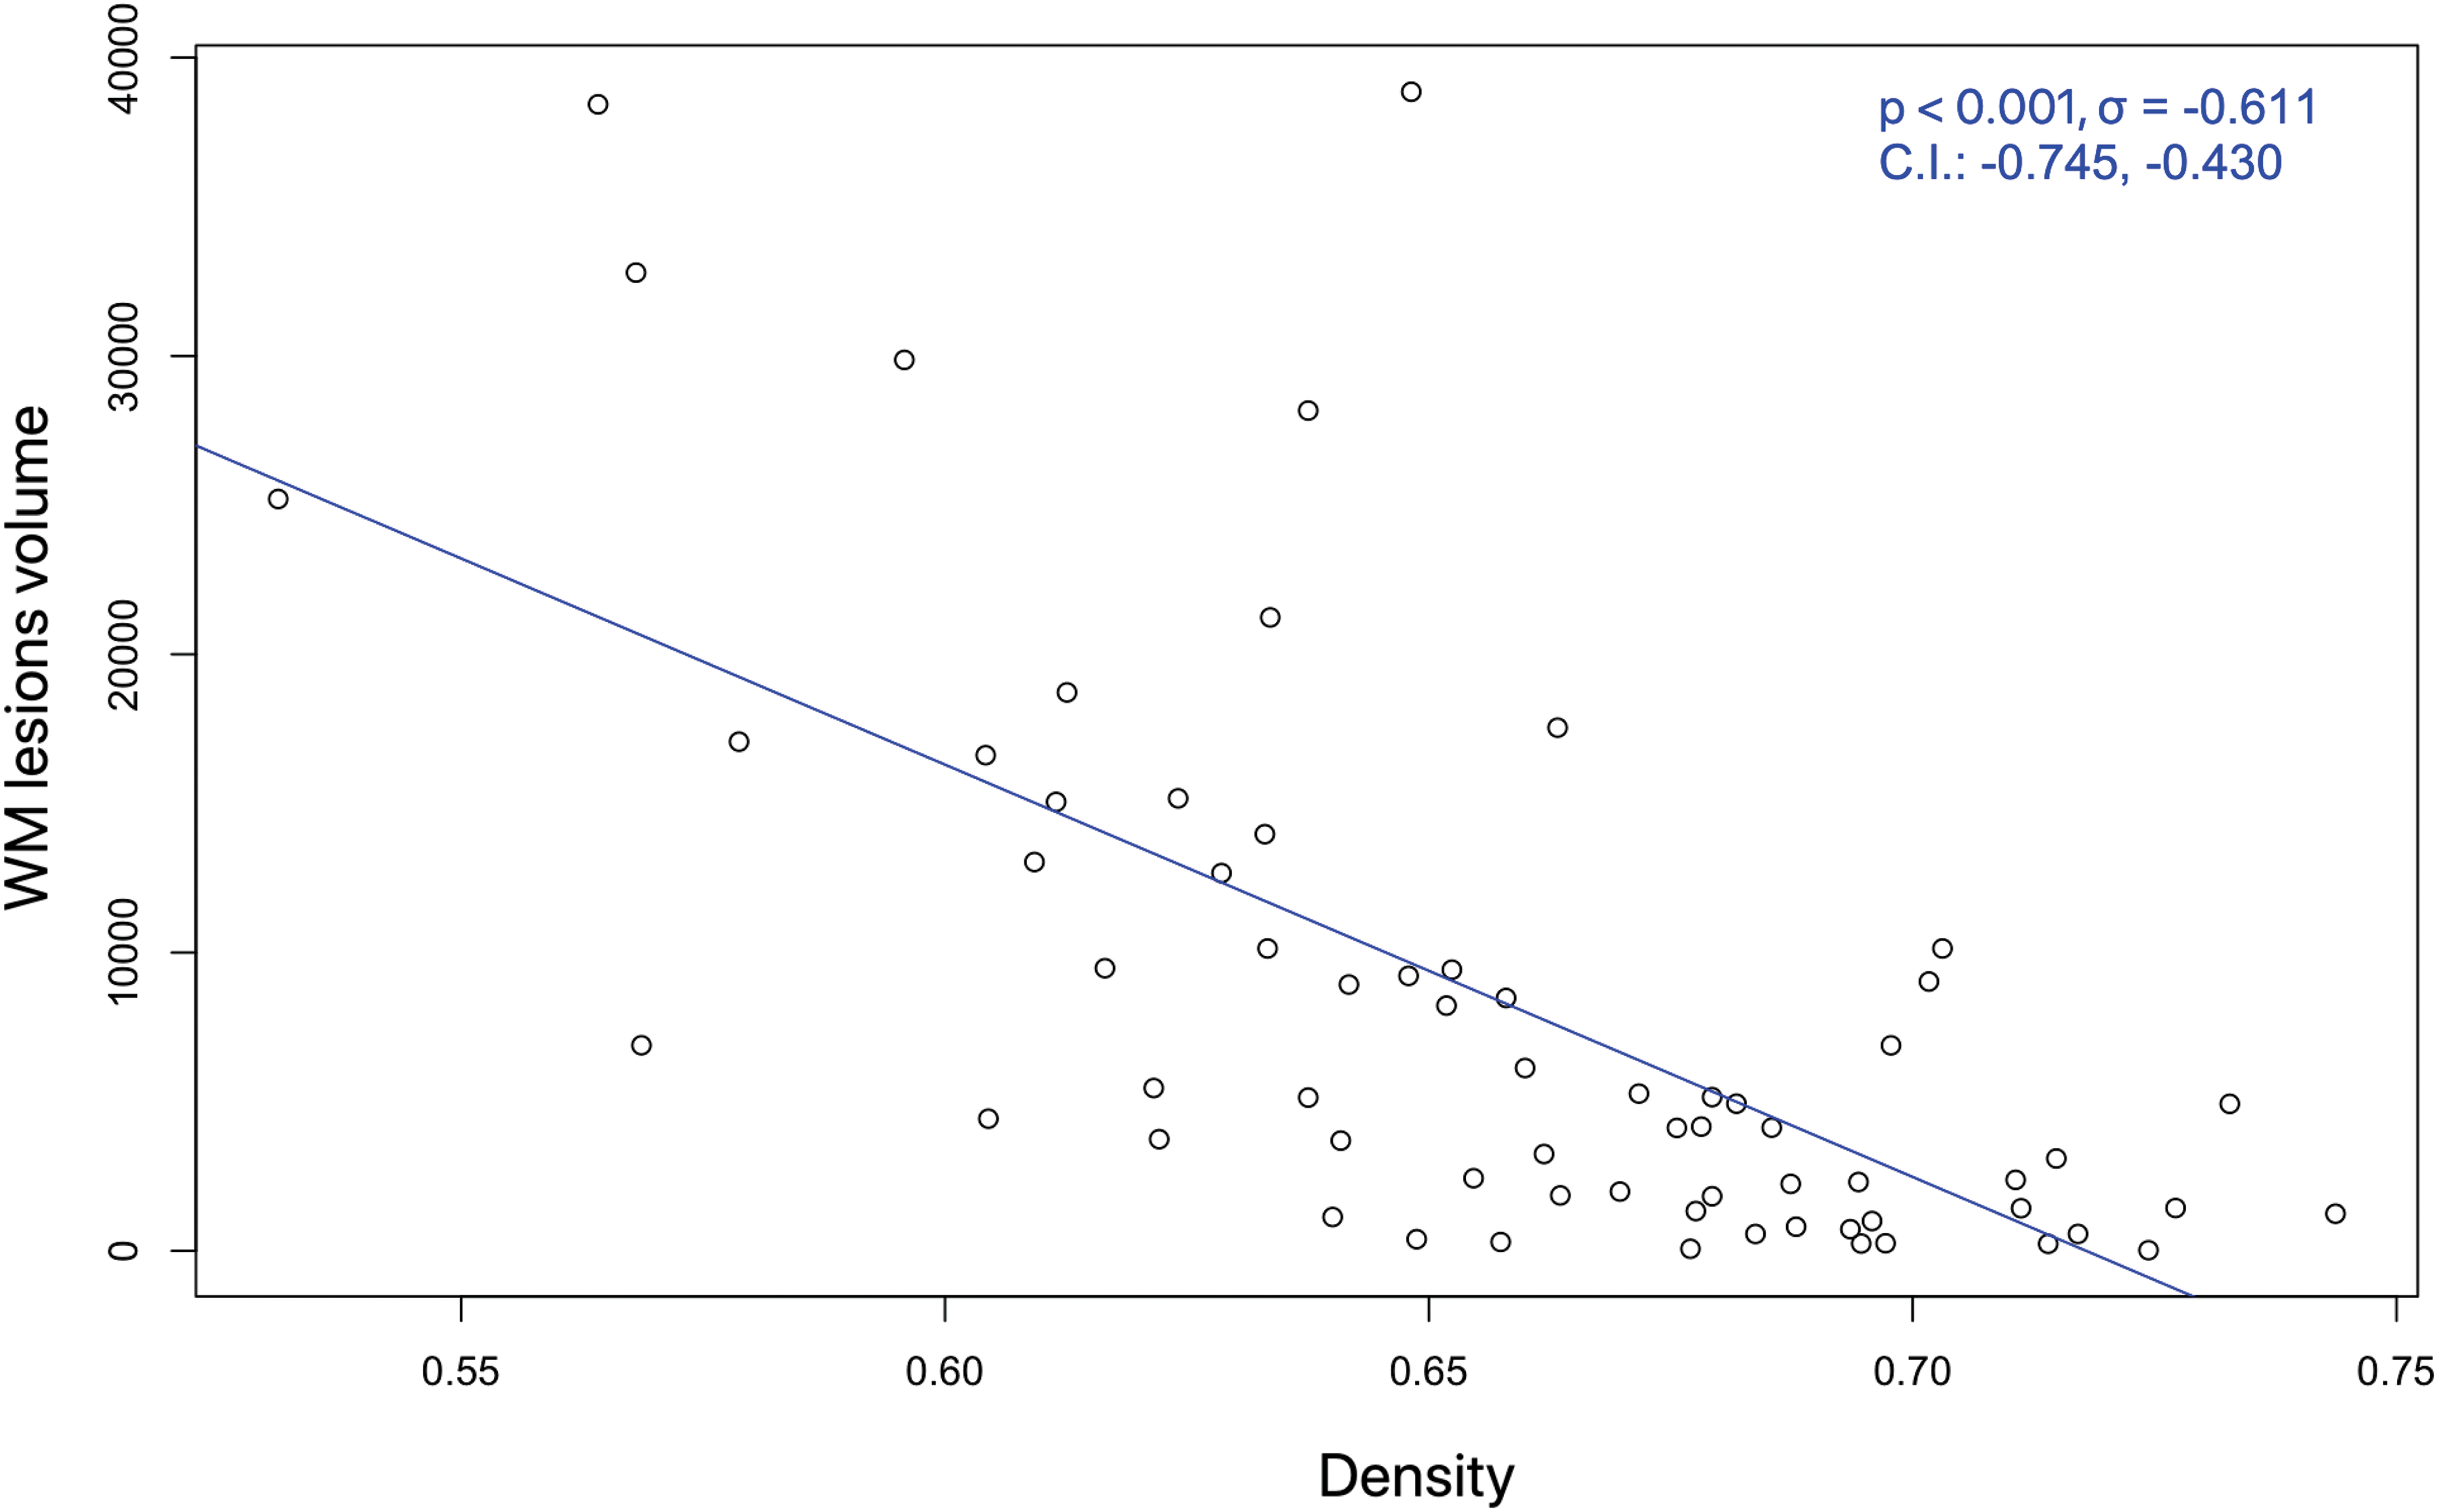
Correlation between the white matter lesion volume (in mm3) and the density of the connectomes of all MS patients involved in our study. CI, confidence interval; WM, white matter. Color images are available online.
We tested the H0-1 that there are no differences among network metrics when they are extracted from a connectome weighted for each of the nine considered microstructural measures; we also assessed the H0-2 that there are no differences in network metrics between MS patients and HCs when each network metric is extracted from a connectome weighted for DTI, NODDI, and SMT.
We report p values adjusted for multiple comparisons with Holm test (Aickin and Gensler, 1996) for both H0-1 (4 comparisons for each microstructural measure) and H0-2 (12 comparisons for DTI, NODDI, and SMT, respectively). Finally, network metrics extracted from each connectome were evaluated (1) in a robust linear model adjusted for gender, age, and disease duration to evaluate their contributions in explaining the worsening of motor disability measured through the EDSS and (2) in a robust linear model adjusted for gender and age to evaluate whether the alterations of MS patient's structural connectivity are related to the sNfL increase.
Results
Results of groups comparison are reported in Table 2. The values that reached statistical significance are highlighted in bold, and the corresponding violin plots are shown in Figure 3.
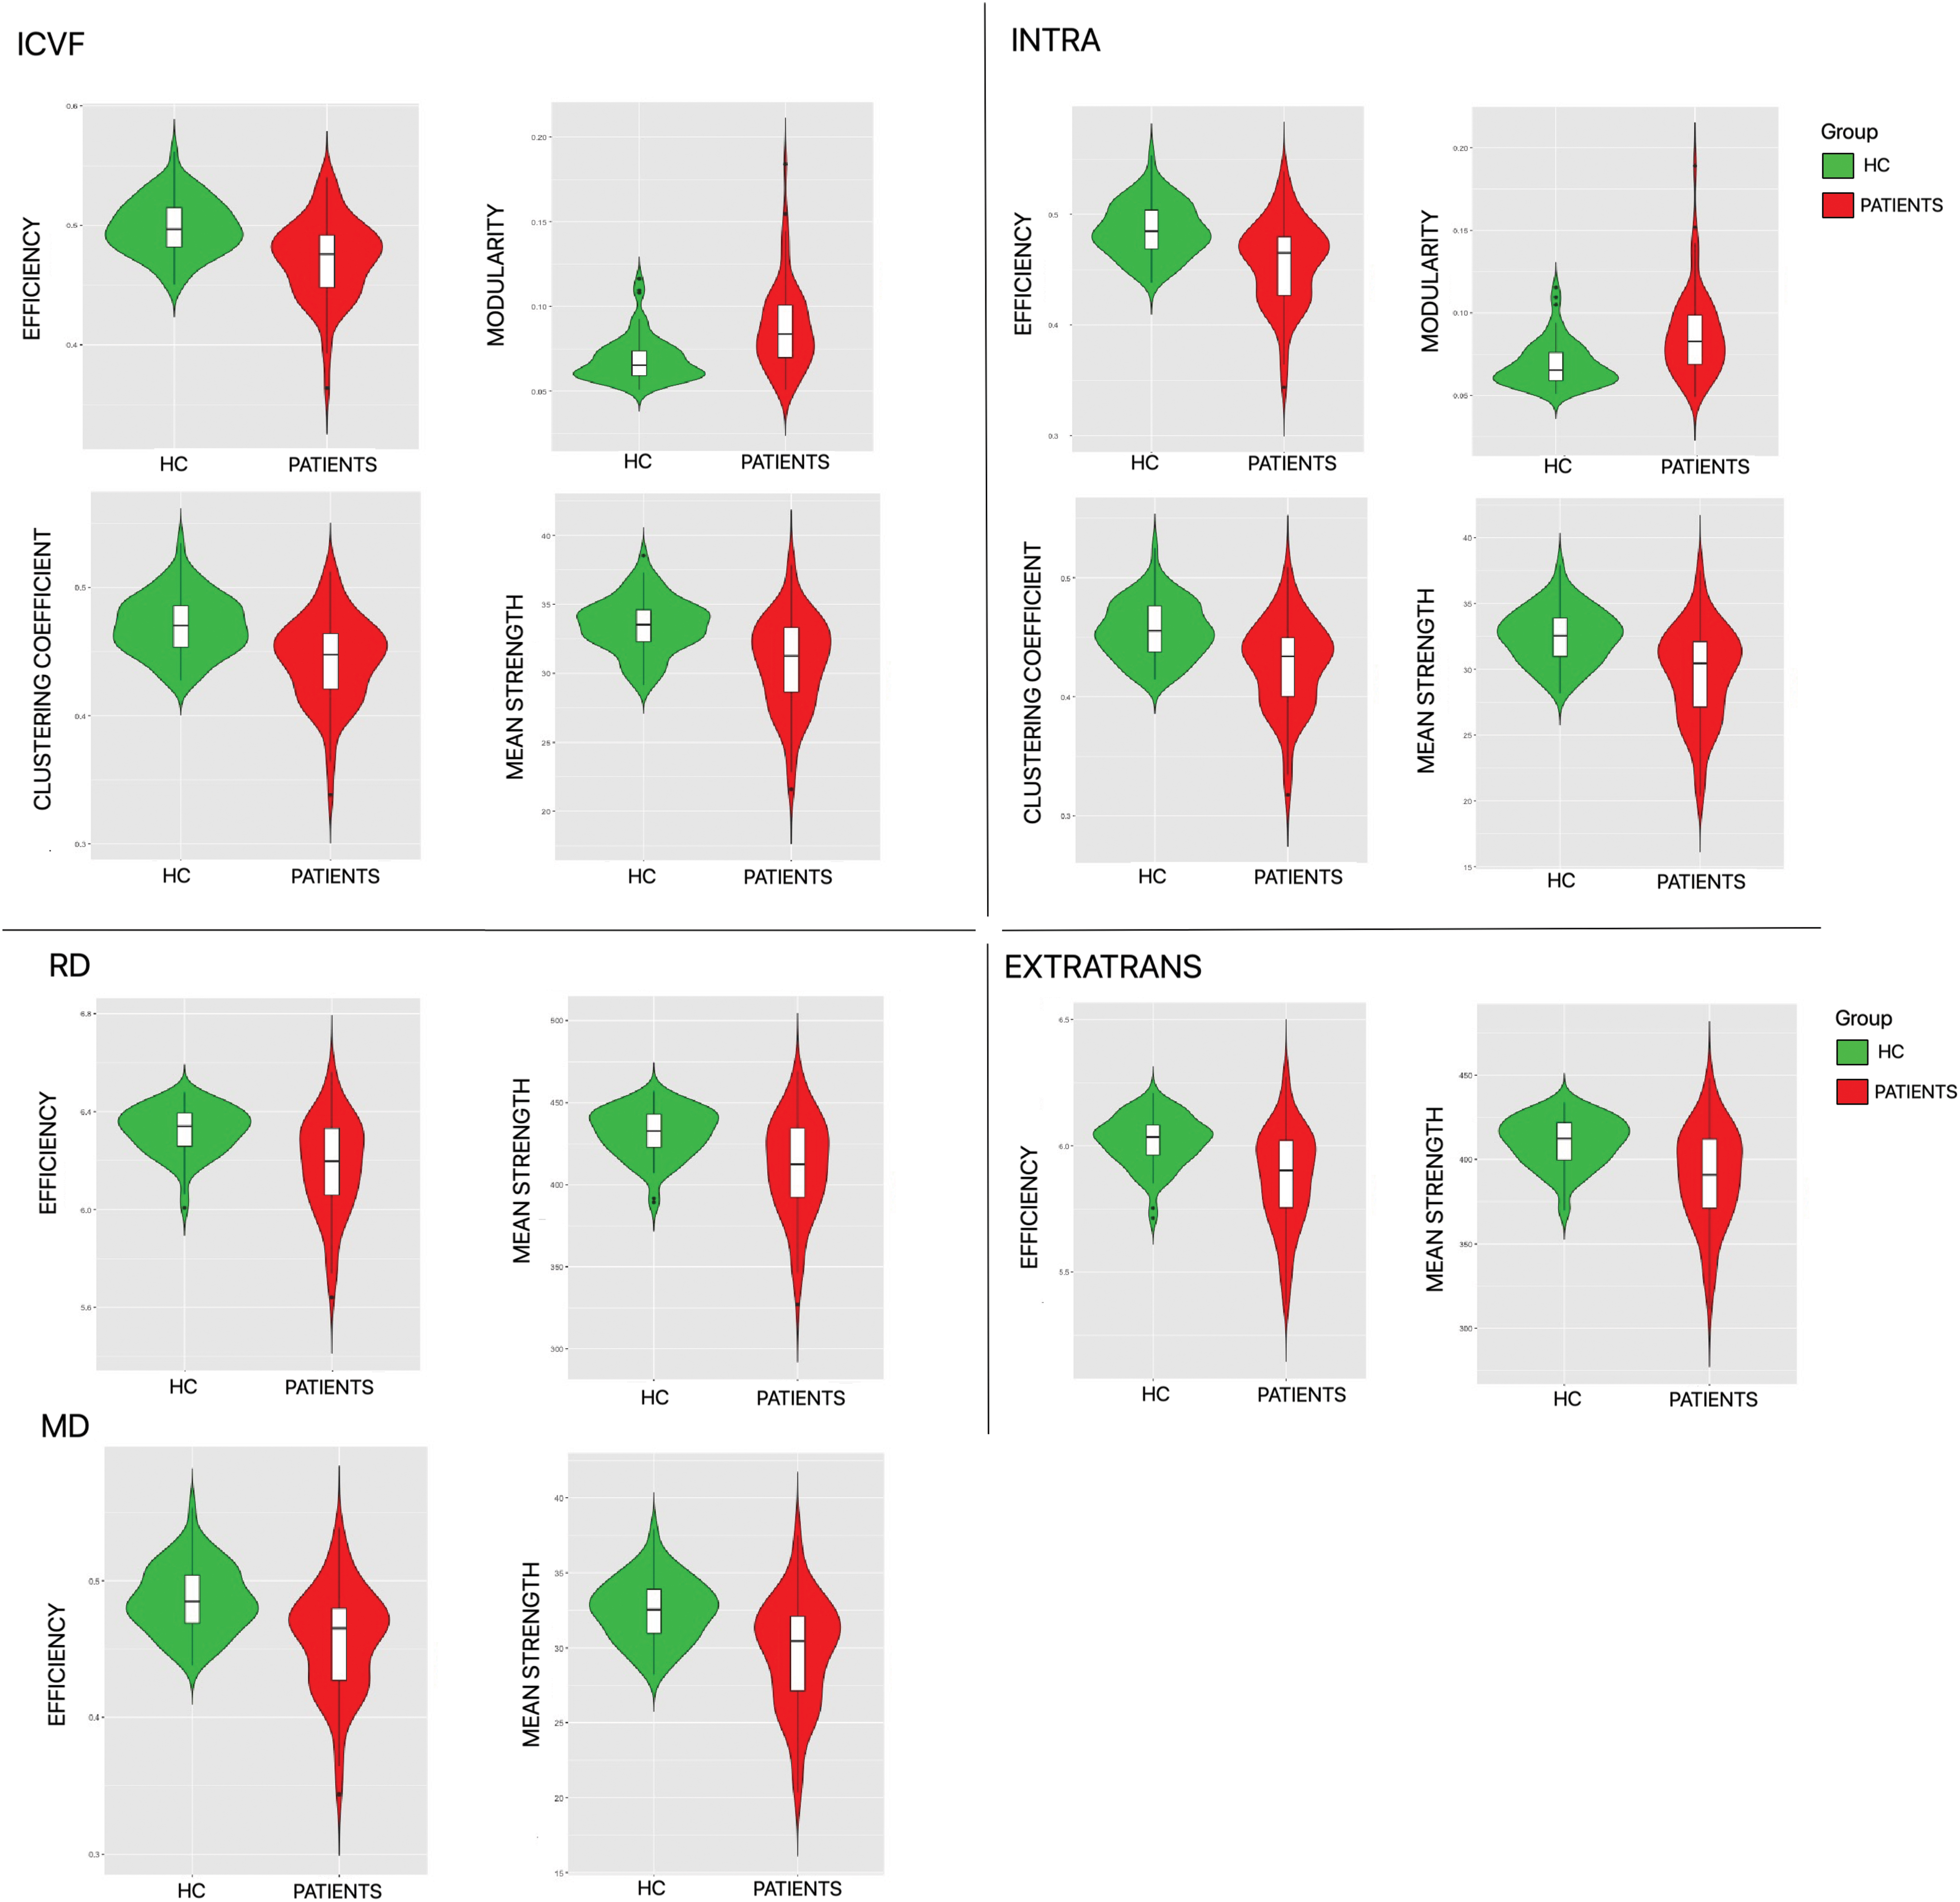
Violin plots of the metrics showing statistically significant differences between HCs (in green) and multiple sclerosis patients (in red). In the upper part of the violin plots, we show the efficiency, modularity, clustering coefficient, and mean strength resulting from the connectomes weighted using ICVF and INTRA. In the bottom part, we show efficiency and mean strength resulting from the connectomes weighted using RD, EXTRATRANS, and MD. EXTRATRANS, extraneurite transverse diffusivity; HC, healthy controls; ICVF, intraneurite volume fraction; INTRA, neurite volume fraction; MD, mean diffusivity; RD, radial diffusivity. Color images are available online.
Comparison of Network Metrics Computed Using Different Microstructural Weightings Between Multiple Sclerosis Patients and Healthy Controls
Results of group comparison performed with robust linear model accounting for gender, age, and density as covariates. To account for multiple comparison, we applied Holm post hoc correction (1) for each network metrics of each microstructural map (adjusted p value metrics) and (ii) for each network metrics extracted from all the microstructural maps of each diffusion-based model (adjusted p value model). The statistically significant results are highlighted in bold.
EXTRAMD, extraneurite mean diffusivity; EXTRATRANS, extraneurite transverse diffusivity; FA, fractional anisotropy; ICVF, intraneurite volume fraction; INTRA, neurite volume fraction; ISOVF, isotropic volume fraction; MD, mean diffusivity; MS, multiple sclerosis; NOS, number of streamlines; RD, radial diffusivity.
Our results refute the first H0 hypothesis showing that (1) when the network analysis was performed with tractometry derived from DTI-MD, DTI-RD, and SMT-EXTRATRANS, there was a significant decrease in global efficiency and in mean strength in MS patients compared with HCs, and that (2) if the network analysis was performed with tractometry derived from NODDI-ICVF and SMT-INTRA, there were both a significant decrease in global efficiency, clustering coefficient, and mean strength and a significant increase in modularity of MS patients compared with HCs.
Interestingly, when the network analysis was performed using NOS-weighted connectomes, there were no significant differences between patients and controls surviving the use of density as a confounding factor.
When we tested the second H0 hypothesis, the network analysis using tractometry derived from NODDI-ICVF appeared to be the most sensitive. In fact, the mean strength extracted from ICVF showed statistically significant differences between MS and HCs, and other network metrics obtained using this map show similar results without reaching statistical significance.
Among the tested maps, we found that network metrics computed by weighting the connectomes with NODDI-ICVF and SMT-INTRA well explained the EDSS (adjusted R 2 = 0.535 and adjusted R 2 = 0.526, respectively). Although age seemed to drive the differences, modularity also contributed significantly (p = 0.016 and p = 0.028, respectively) as given in Table 3 (we refer to Supplementary Tables S2 and S3 for more details regarding the statistical analysis).
Correlation Between Network Metrics Weighted for Intraneurite Volume Fraction/Neurite Volume Fraction, and Expanded Disability Status Scale
The statistically significant results are highlighted in bold.
Robust linear models to identify the contribution of each network metrics in explaining the EDSS. Age, gender, and disease duration are included as covariates. For compactness, only the maps that show significant results are presented. In the upper part we have the model corresponding to ICVF, whereas in the bottom we have the model corresponding to INTRA. Both models explain ∼53% of our data. In the two models, in addition to age that describes most of EDSS, modularity also seems to contribute to explaining the worsening of the disease, highlighting that EDSS is related to the segregation of the network.
SE, standard error.
However, we found that network metrics computed by weighting the connectomes with DTI-FA, DTI-MD, DTI-RD, NODDI-ICVF, SMT-EXTRAMD, and SMT-EXTRATRANS were associated with sNfL (adjusted R 2 = 0.597; adjusted R 2 = 0.609; adjusted R 2 = 0.600, adjusted R 2 = 0.598, adjusted R 2 = 0.611, adjusted R 2 = 0.603, respectively). Again, modularity contributed significantly, despite age and gender seem to drive the significance, as given in Table 4 (p = 0.025, p = 0.033, p = 0.016, p = 0.022, p = 0.013, and p = 0.049, respectively).
Correlation Between Network Metrics Weighted for Different Microstructural Measures and Serum Neurofilament Light Polypeptide
The statistically significant results are highlighted in bold.
Robust linear models to identify the correlation between the changes in the structural connectivity of MS patients through the global network metrics and the increase of sNfL. Age and gender are included as covariates. For compactness, only the maps that show significant results are presented. Both models explain ∼60% of our data. In the six models, in addition to age, which explain most of sNfL increase, gender and modularity also seem to contribute to explaining the increase of NfL blood concentration, highlighting that the network segregation is related to increased inflammation and axonal damage.
sNfL, serum neurofilament light polypeptide.
Discussion
Our tractometry study compared the sensitivity of network analysis performed using different connectomes, weighted with these advanced models, to identify differences in structural network properties in MS patients versus HCs. In addition, our study provided a clinical and biological validation of the results by assessing the relationship between (1) network measure weighted for different microstructural parameters and (2) patient's disability and (3) sNfL levels, which are a measure of neuroaxonal damage.
Previous connectomic studies in MS patients used essentially NOS or FA to weight the computed connectomes (Charalambous et al., 2019; Kamagata et al., 2019; Kocevar et al., 2016; Li et al., 2013; Llufriu et al., 2017; Pagani et al., 2020; Pardini et al., 2015; Shu et al., 2011, 2016), which were then used to extract network-based metrics in MS patients and HCs. These studies showed an overall decrease in patient network performances especially regarding a decrease in efficiency and an increase in network segregation.
Although these studies have proven to be sensitive to MS pathology, they lack yet specificity to the structural substrate of network alterations. Weighting the connectomes for measures derived from microstructural models applied to multishell diffusion data allows to achieve higher specificity to alterations occurring within specific compartments of the brain tissue (Lakhani et al., 2020).
Since MS is a complex neurological disease, which is characterized by inflammatory demyelination and axonal loss, and also by remyelination and network remodeling (Cunniffe and Coles, 2019), the information derived from network measures obtained using microstructural maps may be more sensitive and specific than the approaches based on NOS. Newly developed advanced multicompartment diffusion MRI models are in fact able to isolate the contribution of the signal deriving from the different tissue compartments, thus having the potential to detect specific tissue subtypes and associated injuries with increased pathologic specificity (Lakhani et al., 2020).
When assessing the pathological sensitivity of our network-based analysis derived from tractometry, we have found that the most sensitive microstructural measures were related to the intracellular compartment, that is, intra-axonal compartment since we focused on WM connections. Specifically, when the connectomes were weighted for both NODDI-ICVF and SMT-INTRA, we measured a significant decrease in global efficiency, clustering coefficient, and mean strength as well as a significant increase in modularity in MS patients compared with HCs. This indicates an increased network segregation, a decrease in the number of connections, and, in turn, a loss in network efficiency in MS patients, confirming and extending what was observed in Welton et al. (2020), where a normalized NOS measure was applied.
Adding to previous knowledge, our results also show a direct relationship between the observed reduction in the edge values weighted with NODDI-ICVF and SMT-INTRA and axonal damage, since these two maps describe the anisotropic signal of the intra-axonal compartment. Furthermore, it is probable that these results are also related to the demyelination that occurred in those axons, since NODDI-ICVF has been also shown to strongly correlate with the myelin fraction of a spinal cord tissue, in a recent postmortem MRI and histology study (Grussu et al., 2017). As a consequence, the reduction in efficiency, clustering coefficient, and connection strength that we measured in MS patients—together with the observed increase in modularity (and hence segregation)—may be representative of both axonal damage and demyelination in the tracts of interest. In contrast, measures of demyelination and of increased diffusivity obtained with DTI showed less sensitivity to MS pathology, whereas NOS measures appeared to be relatively insensitive.
Similarly, when we assessed the relationship between the network-based measures derived from microstructural maps and patient's disability, only the modularity measured in connectomes weighted with NODDI-ICVF and SMT-INTRA maps shows a significant relationship with patient disability, suggesting that the network segregation caused by axon myelin damage led to a disruption in network properties that is associated with the overall patient disability.
We acknowledge that EDSS is a crude measure of clinical disability and EDSS scores >5 are mainly driven by walking abilities, as well as by spinal cord damage. However, it is important to note that it is also very often the case that individuals with high disability scores and long disease duration have also an important lesion load in the brain that seem to be confirmed by our analyses. To disentangle better these two aspects, in future studies more data should be acquired for patients with EDSS ≥5 to better investigate the impact of the spinal cord damage.
Counterintuitively, when we assessed the relationship between network-based measures derived from microstructural maps and neuroaxonal damage—as measured in the serum with NfL—we found that the decrease in modularity weighted by measures of extracellular diffusivity was related to a biological increase of neuroaxonal damage. These results are quite intriguing as they may indicate that the properties of the extracellular compartment, which is essentially constituted by the extracellular matrix, interstitial fluids, and glia cells, influence the network aggregation in a way that is, in part, proportional to neuroaxonal damage (Van Horssen et al., 2007). Network metrics obtained with connectomes weighted for NOS did not show any correlation with both patients' EDSS and sNfL.
It is important to remark that the lesions of MS patients are characterized by voxels containing different types of tissue, which makes tissue segmentation critical for those voxels. For this reason, we have decided to use the multishell multitissue constrained spherical deconvolution algorithm, which is able to take into account partial volume effects and allows to estimate the fiber orientation distribution in multiple tissues, even within the same voxel. The obtained estimation of the FODs, in combination with the iFOD2 tracking algorithm (Tournier et al., 2010) constrained to a deterministic-like behavior, guarantees the reconstruction of the streamlines even in lesion voxels (Lipp et al., 2020). Thus, even in the areas affected by lesions, the connectivity is not completely disrupted.
Nevertheless, in very damaged lesions, there may be no residual anisotropic tissue, leading, therefore, to the estimation of few connections (Van Wijk et al., 2010). This causes a decrease in connection density of the connectomes that is negatively correlated with the volume of the WM lesions as shown in Figure 2, and very damaged lesions may also significantly impact the microstructural properties of the entire tract they affect. In light of this, and to grant a fair comparison between connectomes of the two groups of subjects (Schiavi et al., 2020b), we used the connection density as a confounding factor in our statistical analyses. Nevertheless, it has to be acknowledged that the impact of very destructive lesions will be more evident on NOS-weighted connectomes than in connectomes weighted by other microstructural measures.
Limitations of our study are related to the small number of enrolled patients, which did not allow us to perform a proper comparison of the sensitivity and biological correlation of microstructure-weighted network metrics between progressive and relapsing-remitting patients. We have, however, computed the results of the group comparison between relapsing remitting MS patients and HCs (Supplementary Table S1), which showed very similar results to those obtained in the whole cohort. In a follow-up study, we will expand the cohort by including more progressive patients. Another limitation of this study is related to the fact that sNfL was assessed within 3 months from the MRI, hence we cannot exclude that disease-related or unrelated factors may have affected sNfL values. Furthermore, in this study we have focused on the relationship between network metrics derived from microstructural-weighted connectomes and disability or biological biomarkers of disease impact (i.e., sNfL).
Future studies will also attempt at assessing the value of weighting the connectomes with myelin-specific measures such as myelin water fraction and quantitative magnetization transfer (Granziera et al., 2020; Koenig et al., 1990; Mackay et al., 1994; Mossahebi et al., 2014, 2015). Finally, another interesting point for the future could be to evaluate the sensitivity to the pathology by weighting the connectomes using the newly proposed anatomically constrained microstructure-informed tractography (Daducci et al., 2014; Schiavi et al., 2020a).
Conclusion
In conclusion, we have shown that network-derived metrics in MS patients are most sensitive to MS pathology and most related to clinical disability when connectomes are weighted for intracellular/intra-axonal microstructural metrics, whereas connectomes weighted for extracellular diffusivity permit to assess network metrics that are most related to biological measures of neuroaxonal damage.
Footnotes
Acknowledgments
We thank Mrs. Marguerite Limberg for her precious contribution in enrolling study participants. And we thank all the patients and HCs for their contribution.
Authors' Contributions
S.B., Si.S., A.D., and C.G. contributed to conception and design of the study; S.B., Si.S., Sa.S., P.J.L., M.B., and M.W. analyzed data; P.J.L., M.B., and M.W. acquired data; S.B., Si.S., A.D., and C.G. drafted a significant portion of the article and figures; S.B., Si.S., Sa.S., P.J.L., M.B., M.W., L.K., J.K., A.D., and C.G. revised the final article; funding was taken care of L.K., J.K., A.D., and C.G.
Author Disclosure Statement
All authors have nothing to disclose for the purpose of this study.
Funding Information
S.B., Si.S., Sa.S., P.J.L., M.B., L.K., J.K., and A.D declare no funding was received. M.W. is paid by the Swiss National Science Foundation (SNSF) grant PP00P3_176984 and he has also received research funding by Biogen for developing spinal cord MRI. C.G. is funded by the Swiss National Science Foundation (SNSF) grant PP00P3_176984, the Stiftung zur Förderung der gastroenterologischen und allgemeinen klinischen Forschung, EUROSTAR E!113682 HORIZON2020.
Supplementary Material
Supplementary Table S1
Supplementary Table S2
Supplementary Table S3
References
Supplementary Material
Please find the following supplemental material available below.
For Open Access articles published under a Creative Commons License, all supplemental material carries the same license as the article it is associated with.
For non-Open Access articles published, all supplemental material carries a non-exclusive license, and permission requests for re-use of supplemental material or any part of supplemental material shall be sent directly to the copyright owner as specified in the copyright notice associated with the article.