
Abstract
Background:
Alzheimer's disease (AD) is the most common form of dementia with genetic and environmental risk contributing to its development. Graph theoretical analyses of brain networks constructed from structural and functional magnetic resonance imaging (MRI) measurements have identified connectivity changes in AD and individuals with mild cognitive impairment. However, brain connectivity in asymptomatic individuals at risk of AD remains poorly understood.
Methods:
We analyzed diffusion-weighted MRI data from 161 asymptomatic individuals (38–71 years) from the Cardiff Ageing and Risk of Dementia Study (CARDS). We calculated white matter tracts and constructed whole-brain, default mode network (DMN) and visual structural brain networks that incorporate multiple structural metrics as edge weights. We then calculated the relationship of three AD risk factors, namely Apolipoprotein-E ɛ4 (APOE4) genotype, family history of dementia (FH), and central obesity (Waist-Hip-Ratio [WHR]), on graph theoretical measures and hubs.
Results:
We observed no risk-related differences in clustering coefficients, characteristic path lengths, eccentricity, diameter, and radius across the whole-brain, DMN or visual system. However, a hub in the right paracentral lobule was present in all the high-risk groups (FH, APOE4, obese), but absent in low-risk groups (no FH, APOE4-ve, healthy WHR).
Discussion:
We identified no risk-related effects on graph theoretical metrics in the structural brain networks of cognitively healthy individuals. However, high risk was associated with a hub in the right paracentral lobule, a medial fronto-parietal cortical area with motor and sensory functions. This finding is consistent with accumulating evidence for right parietal cortex contributions in AD. If this phenotype is shown to predict symptom development in longitudinal studies, it could be used as an early biomarker of AD.
Impact statement
Alzheimer's disease (AD) is a common form of dementia that to date has no cure. Identifying early biomarkers will aid the discovery and development of treatments that may slow AD progression in the future. In this article, we report that asymptomatic individuals at heightened risk of dementia due to their family history, Apolipoprotein-E ɛ4 genotype, and central adiposity have a hub in the right paracentral lobule, which is absent in low-risk groups. If this phenotype were to predict the development of symptoms in a longitudinal study of the same cohort, it could provide an early biomarker of disease progression.
Introduction
Alzheimer's disease (AD) is one of the major causes of dementia that affect 10% of individuals older than the age of 65. In the United States, over 1 million individuals per year will be affected by AD by 2050 (Hebert et al., 2013). A recent review by the Lancet Commission concluded that almost half of the dementia cases might be prevented or delayed by modifying 12 risk factors (Livingston et al., 2020). It emphasized the importance of improving the early detection of individuals at risk of developing AD so that preventative therapeutics can be discovered and developed in the future. It is therefore important to gain a better understanding of how AD risk factors affect the structure of the brain in healthy individuals and how risk-related effects differ from those of healthy aging.
The human brain has been characterized as a network of cortical and subcortical areas (network nodes) that communicate with each other via white matter tracts (connections or edges) that carry neuronal signals (Bullmore and Bassett, 2011; Rubinov and Sporns, 2010). Structural networks can be derived from diffusion-weighted magnetic resonance imaging (dMRI) data via tractography (Basser et al., 2000; Mukherjee et al., 2008a,b), and are represented mathematically by graphs. Graph theory can then be used to quantify the local and global organizational properties of the brain's structural connectome (Bullmore and Sporns, 2009).
Graph theoretical analyses of brain networks have provided insight into the effect of AD on the brain's connectivity (Dai et al., 2019; John et al., 2017; Lo et al., 2010). More specifically, there is strong evidence that even though AD pathology is initially present in localized brain areas, it still affects the whole brain as a network. It is, therefore, possible that people at risk of developing AD could show alterations in their structural brain networks and their graph theoretical metrics before developing the disease. This implies that investigations into possible relationships between AD risk factors and graph theoretical metrics of structural brain networks could provide biomarkers that signal disease onset or track disease progression.
In the present study, we used graph theory to characterize the mesoscale of structural brain networks for the whole-brain connectome and for a system that is known to be affected in AD, namely the default mode network (DMN), as well as the visual network as a control (Badhwar et al., 2017), in 161 cognitively healthy individuals from the Cardiff Ageing and Risk of Dementia Study (CARDS) (38–71 years) (Coad et al., 2020; Metzler-Baddeley et al., 2019a,b; Mole et al., 2020a,b) with different risk factors for AD. The risk factors investigated were Apolipoprotein-E ɛ4 (APOE4), family history of dementia (FH), and central obesity as assessed with the Waist-Hip-Ratio (WHR). A statistical framework was followed to reveal potential differences in the structural network organization between groups of aggregated risk levels. Our hypothesis was that individuals at the highest risk of dementia, that is, obese APOE4 carriers with a FH, compared with those at lowest risk, that is, normal-weighted noncarriers without a family history, would have altered integration and segregation parameters (increased characteristic path lengths, decreased clustering, etc.). In our exploratory analysis of hubs, we aimed to identify any highly interconnected nodes that consistently differed between low- and high-risk group (FH vs. no FH, APOE4 carrier vs. noncarrier, obese vs. healthy WHR).
Materials and Methods
Details of the CARDS procedures have been previously published (Coad et al., 2020; Metzler-Baddeley et al., 2019a,b; Mole et al., 2020a,b) and hence are only briefly described in the following. The CARDS was approved by the School of Psychology Research Ethics Committee at Cardiff University (EC.14.09.09.3843R2) and all participants provided written informed consent.
Participants
Individuals between the ages of 38 and 71 were recruited from the local community via Cardiff University community panels, notice boards, and poster advertisements. Exclusion criteria included a history of neurological and/or psychiatric disease, severe head injury, drug or alcohol dependency, high-risk cardioembolic source, or known significant large-vessel disease. MRI screening criteria were fulfilled by 166 participants. Table 1 summarizes their demographic background, and information about their genetic and lifestyle risk variables. Depression was screened for with the Patient Health Questionnaire (PHQ-9) (Kroenke et al., 2001), verbal intellectual function was assessed with the National Adult Reading Test (NART) (Nelson, 1991), and cognitive impairment with the Mini Mental State Examination (MMSE) (Folstein et al., 1975). One participant was excluded after assessment of the MMSE score (MMSE = 26). Four participants had missing data, and thus, the final analysis had a sample size of 161.
Participant Demographics
This table lists the demographics (age, years of education and sex) of the participants who took part in this study, and splits M and F data by risk factor group. Mean age and years of education, accurate to 2 decimal places, are quoted with standard deviations reported in brackets (σ).
APOE4, Apolipoprotein-E ɛ4; F, female; FH, family history of dementia; M, male; WHR, waist/hip ratio.
Assessment of risk factors
Participants gave saliva samples with the Genotek Oragene-DNA kit (OG-500) for APOE genotyping. APOE genotypes ɛ2, ɛ3, and ɛ4 were determined by TaqMan genotyping of single-nucleotide polymorphism (SNP) rs7412 and KASP genotyping of SNP rs429358 (Metzler-Baddeley et al., 2019a). Genotyping was successful for 164 of the 165 participants. In addition, 163 participants provided information about their FH, that is, whether a first-grade relative was affected by AD, vascular dementia, or any other type of dementia. We also obtained the number of years spent in education for the 164 participants, to include as a covariate in this analysis (Table 1).
Participants' waist and hip circumferences were measured to calculate the waist/hip ratio (WHR). Central obesity was defined as a WHR ≥0.9 for men and ≥0.85 for women (Table 1). Other metabolic risk factors were self-reported in a medical history questionnaire [see for details Mole and collegues (2020a) Neurobiology of Aging] but were not included in the present analysis.
MRI data acquisition
MRI data were collected on a 3T MAGNETOM Prisma clinical scanner (Siemens Healthcare, Erlangen, Germany) (Coad et al., 2020; Metzler-Baddeley et al., 2019a,b; Mole et al., 2020a) at the Cardiff University Brain Research Imaging Centre (CUBRIC). A 3D magnetization-prepared rapid gradient-echo sequence was used to acquire T1-weighted anatomical images with the following parameters: 256 × 256 acquisition matrix, TR = 2300 ms, TE = 3.06 ms, TI = 850 ms, flip angle θ = 9°, 176 slices, 1 mm slice thickness, 1 × 1 × 1 mm isotropic resolution, FOV = 256 mm, and acquisition time of ∼6 min.
Diffusion-weighted magnetic resonance images were acquired with high angular resolution diffusion imaging (HARDI) (Tuch et al., 2002) using a spin-echo echo-planar dual-shell HARDI sequence with diffusion encoded along 90 isotropically distributed orientations (Jones et al., 1999) (30 directions at b = 1200 sec/mm2, 60 directions at b = 2400 sec/mm2) as well as 6 nondiffusion-weighted images with dynamic field correction using the following parameters: TR = 9400 ms, TE = 67 ms, 80 slices, 2 mm slice thickness, 2 × 2 × 2 mm voxel, FOV = 256 × 256 × 160 mm, GRAPPA acceleration factor = 2, and acquisition time of ∼15 min.
HARDI data processing and whole-brain tractography
Diffusion-weighted imaging data processing has been previously detailed in Coad and colleagues (2020), Metzler-Baddeley and colleagues (2019a,b), and Mole and colleagues (2020a,b). In brief, dual-shell data were split and b = 1200 and 2400 sec/mm 2 data were corrected separately for distortions induced by the diffusion-weighted gradients and motion artifacts in ExploreDTI (v4.8.3) (Leemans et al., 2009). Echo planar imaging-induced geometrical distortions were corrected by registering the diffusion-weighted image volumes to the T1-weighted images (Irfanoglu et al., 2012).
Outliers in the diffusion data were identified with the RESDORE algorithm (Parker, 2014). Whole-brain tractography was performed with the damped Richardson/Lucy algorithm (dRL) (Dell'Acqua et al., 2010) on the 60 direction, b = 2400 sec/mm 2 HARDI data for each data set in single-subject space using in-house software (Parker, 2014) coded in MATLAB (The MathWorks, Natick, MA). Fiber tracts were reconstructed by estimating the dRL fiber orientation density functions (fODFs) at the center of each image voxel with seed points positioned at the vertices of a 2 × 2 × 2 mm grid superimposed over the image. At each seed point, the tracking algorithm interpolated local fODF estimates and then propagated 0.5 mm along orientations of each fODF lobe above a threshold of a peak amplitude of 0.05. Individual streamlines were then propagated by interpolating the fODF at their new location and by propagating 0.5 mm along the minimally subtending fODF peak. This process was repeated until the minimally subtending peak magnitude fell below 0.05 or the change of direction exceeded an angle of 45°. Tracking was subsequently repeated in the opposite direction from the initial seed point. Streamlines with lengths outside a range of 10 to 500 mm were removed.
Generating integrated weighted structural brain networks: whole-brain analysis
Whole-brain tractography maps were used in ExploreDTI v4.8.6 (Leemans et al., 2009) to create connectivity matrices that describe the structural connectome mathematically. Network nodes were defined according to the automated anatomical labeling (AAL) atlas (Tzourio-Mazoyer et al., 2002) using the 90 cortical and subcortical areas of the cerebrum. The edges of the networks were the tractography-reconstructed tracts: all edges between brain areas not connected by tracts were therefore equal to zero. This process resulted in sixteen 90 × 90 connectivity matrices, the edges of each quantifying if there was a tract or not, number of streamlines between two nodes, percentage of tracts (PS) between two nodes, average tract length (ATL), Euclidean distance (ED), density of tracts, tract volume (TV), mean diffusivity (MD), axial diffusivity (AxD), radial diffusivity (RD), fractional anisotropy (FA), second and third eigenvalue of the diffusion tensor, linear anisotropy, planar anisotropy, and spherical anisotropy.
The above mentioned metrics were chosen because they could reflect the signal transport and integration abilities of the structural connectome (Messaritaki et al., 2021). In addition, the strength of the structural connectivity between brain areas depends on the metric used to weight the network edges. As a result, the network measures derived via the graph theoretical analysis depend on the connectivity matrix used—that is, which of the above metrics we chose as an edge weight. We have recently shown that this ambiguity can be solved by linearly combining nine normalized metrics (number of tracts, PS, ATL, ED, density, TV, MD, RD, and FA) into a single graph (Dimitriadis et al., 2017b) and thresholding the subsequent graphs using an orthogonal minimal spanning tree scheme (Dimitriadis et al., 2017a). This protocol creates connectivity matrices that combine the information from the included metrics in a data-driven manner, so that the maximum information from all metrics is retained in the final graph; these are termed integrated graphs. The thresholding step can be applied in dense matrices, resulting in a topographically filtered integrated weighted structural brain network. The network and nodal reliability of such integrated graphs was improved beyond that of the nine individual metrics (Dimitriadis et al., 2017b). In addition, they were shown to have very good discrimination capability in a binary classification problem (Dimitriadis et al., 2017b), and to exhibit good scan/rescan reliability (Messaritaki et al., 2019a,b). A recent study demonstrated that community partitions and provincial hubs are highly reproducible in a test/retest study when structural brain networks were constructed with the integrated approach (Dimitriadis et al., 2020). For those reasons, we created integrated weighted brain networks instead of pursuing a single-metric structural connectivity matrix.
To reduce the number of false positives possibly resulting from the tractography, we set to zero all edges in the structural connectivity matrices that corresponded to tracts with fewer than five streamlines (excluding ED as this is a biological metric and has a value regardless of the number of streamlines). All subsequent analyses were performed on these thresholded connectivity matrices (Fig. 1).
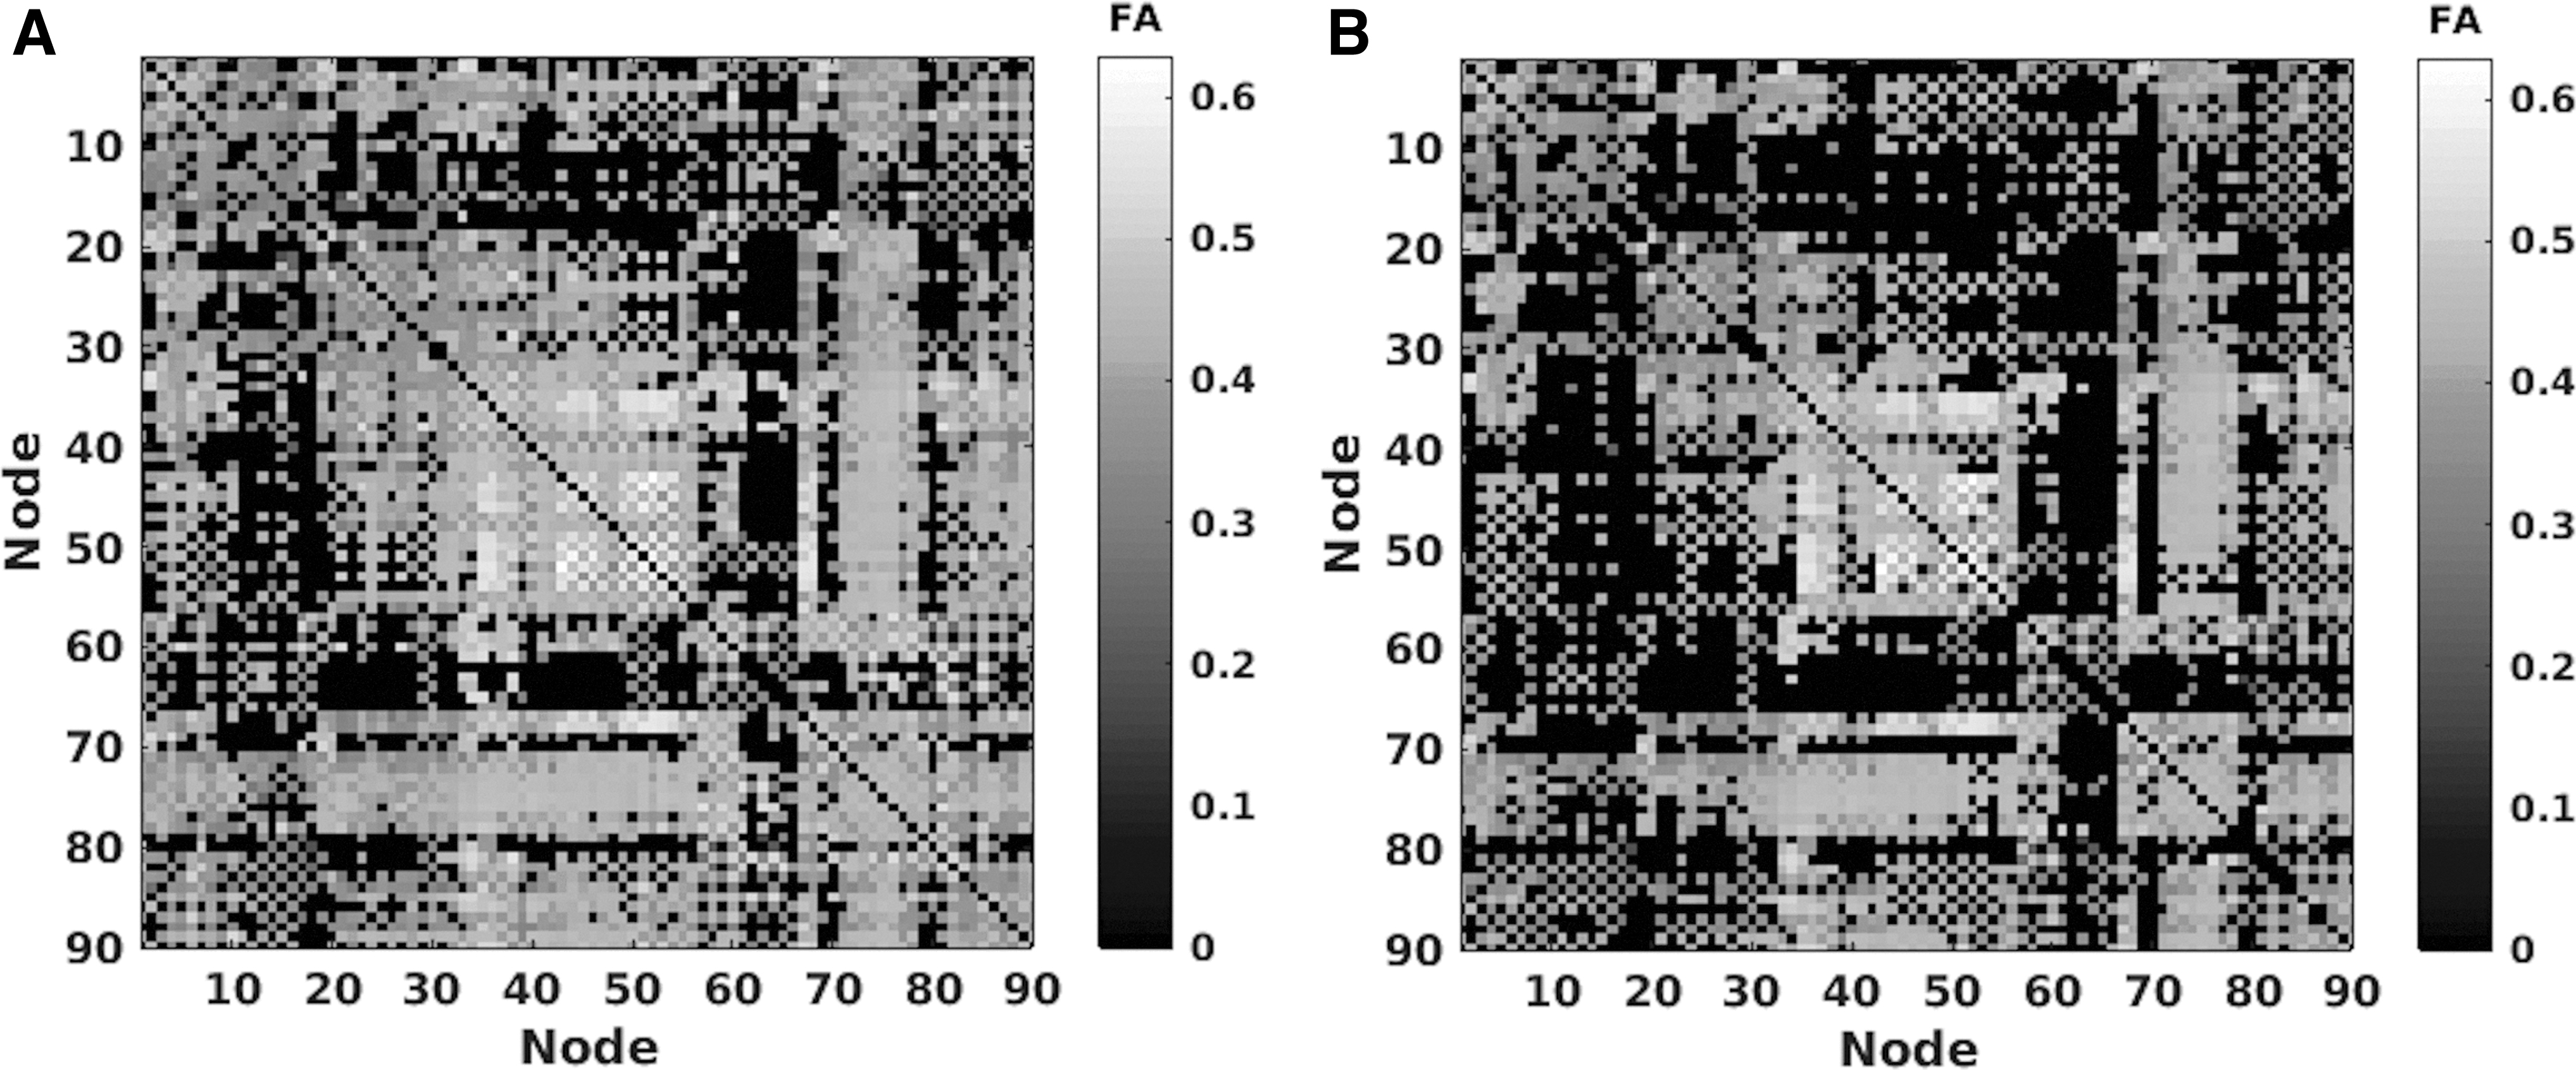
An example of the conservative threshold added to all dMRI connectivity matrices.
To decide which metrics to combine into the integrated weighted structural brain network, we calculated the intercorrelation coefficients (Corrcoef, MATLAB R2015a) between the number of streamlines (NS), PS, ATL, ED, density of streamlines (SLD), TV, MD, RD, AxD, and FA, see Table 2. In addition, we performed a multicollinearity test (Collintest, MATLAB R2015a) in an endeavor to eliminate metrics representing redundant information within our integrated graphs. After excluding highly correlated and multicollinear metrics, the remaining metrics were integrated into a single graph via a linear graph-distance combination (Dimitriadis et al., 2017b). 1
Abbreviations Used for the Diffusion-Weighted Magnetic Resonance Imaging Metrics
This table defines the abbreviations used throughout the article for each of the dMRI metrics.
dMRI, diffusion-weighted magnetic resonance imaging.
Calculating network measures from integrated graphs
The resulting graphs were weighted and undirected. Using the MATLAB Brain Connectivity Toolbox (Rubinov and Sporns, 2010), we calculated the following metrics: Clustering coefficient: A measure of how interconnected nodes are (averaged across all nodes) Characteristic path length: The average minimum number of connections to link two nodes Eccentricity: Maximum shortest distance between one node and all others (averaged across all nodes) Radius: Minimum eccentricity Diameter: Maximum eccentricity Global efficiency: Inverse of the characteristic path length
2
Network measures were examined for multicollinearity using Belsley collinearity diagnostics (Collintest, MATLAB R2015a) to ensure that only unique predictors were included in our analysis. The remaining network measures were analyzed using the multivariate general linear models described below. We were also interested in identifying potential interactions between our risk factors.
Subnetwork analysis
As AD preferentially impacts the DMN, we repeated the analysis for this subnetwork by adapting the AAL atlas (Tzourio-Mazoyer et al., 2002) based on the data from Power and colleagues (2011). The DMN graphs comprised 22 nodes from each hemisphere encompassing the frontal, temporal, and parietal lobes, including the precuneus, cingulate gyrus, and hippocampus (Fig. 2). To investigate if any changes were specific to the DMN, we analyzed a separate control subnetwork—the visual system (Wang et al., 2012), by adjusting the regions of interest specified in Power and colleagues (2011). The resulting integrated weighted structural brain networks were composed of 16 nodes from the left and right hemispheres: inferior temporal gyrus, fusiform gyrus, superior/middle/inferior occipital gyrus, lingual gyrus, cuneus, calcarine fissure, and the surrounding cortex (Fig. 2).

Nodes included in the subnetwork analysis for the DMN and visual system. The top figure
Hub analysis
Hubs are nodes of a network that are highly connected to other nodes and act as bridges that facilitate the transfer of signals in the brain, contributing to its integration abilities (van den Heuvel and Sporns, 2013). Crucially, hubs appear to play a role in AD (Buckner et al., 2009). We split the cohort into risk factor groups—positive (N = 59) versus negative family history (N = 104), APOE4 carriers (N = 64) versus noncarriers (N = 100), centrally obese (N = 102) versus healthy weight (N = 63)—to explore whether hubs changed as a function of risk factor profile in healthy individuals. Hubs were identified across the whole brain for each participant by ranking nodal betweenness centrality and strength, where higher scores indicate hubs. In addition, nodal local efficiency and clustering coefficients were ranked, with smaller values indicating hubs. A node was defined as a hub when it was in the top 20% for global measures and the lowest 20% for local measures. Using replicator dynamics (Dimitriadis et al., 2010; Neumann et al., 2005), hubs that were consistently present across the individual risk factor cohorts were determined. 3 This analysis was then repeated using data from the DMN and visual subnetworks to identify internally important nodes.
Statistical analyses
In SPSS v26 (IBM Corp., 2019), we performed multivariate general linear models with factors of APOE4 carrier/noncarrier, FH/no family history, and WHR obese/healthy on dependent variables; mean clustering coefficient, characteristic path length, eccentricity, global efficiency, diameter, and radius. The analyses were adjusted for covariates: age, years of education, and sex. To ensure assumptions were met, normality of residuals was tested using Kolmogorov–Smirnov tests. We adopted Belsley collinearity diagnostics (MATLAB R2015a) to assess multicollinearity effects between the estimated network metrics.
Results
Inclusion of metrics into integrated networks using correlation and collinearity tests
A multicollinearity test was performed on the 10 variables with a default cutoff of 30 for the condition index and 0.5 for proportion of variance decomposition. This analysis revealed multicollinearity between AxD, MD, and RD (Table 3). Correlation coefficients (Table 4) were calculated between all 10 connectivity metrics. We used a cutoff of R > 0.6 to flag strong correlations to investigate further. PS, NS, and TV were highly intercorrelated, and for that reason we only included NS in our analysis. AxD, MD, and RD exhibit multicollinearity and both AxD and RD correlated strongly with FA (R = 0.6036, p < 10−8 and R = −0.6721, p < 10−8, respectively)—thus these two metrics were excluded. This resulted in a final inclusion of ATL, SLD, FA, ED, MD, and NS. We reran the correlation and multicollinearity analysis on these metrics and confirmed no strong correlations (Table 4) or multicollinearity. These six metrics were then combined into a single graph (Fig. 3) with an algorithm introduced in our previous study (Dimitriadis et al., 2017b).

An example of the six individual network measures that were combined into an integrated weighted structural brain network for one participant.
Belsley Collinearity Diagnostics Results for Diffusion-Weighted Magnetic Resonance Imaging Connectivity Matrices
Belsley collinearity diagnostics run across the dMRI metrics demonstrating multicollinearity between AxD, MD, and RD. The bold numbers identify metrics that meet our exclusion criteria, condition index >30, and variance decomposition >0.5.
Abbreviations of the dMRI metrics are defined in Table 2.
CondIdx, condition index; sValue, singular values.
Correlation Coefficients (R) Determined by MATLAB (corrcoef) Between the Individual Connectivity Metrics (Abbreviations Defined in Table 2)
Bold numbers identify intercorrelations with an R > 0.6. The lower half of the table shows reduced intercorrelation coefficients after the analysis has been rerun with AxD, PS, RD, and TV excluded.
Exclusion of mean eccentricity from further analyses
Belsley collinearity diagnostics applied over the adopted set of network metrics flagged multicollinearity between diameter and mean eccentricity using whole-brain network measures (Table 5). We therefore excluded the eccentricity from further analyses and kept the diameter, which in combination with the radius informs us about the lower (radius) and upper limits (diameter) of eccentricity.
Belsley Collinearity Diagnostics Results: Network Measures
This table demonstrates multicollinearity between whole-brain diameter and mean eccentricity when assessed with Belsley collinearity diagnostics. Bold numbers indicate metrics that meet our exclusion criteria, condition index >30, and variance decomposition >0.5.
Lambda, characteristic path length.
Whole-brain analysis
Kolmogorov–Smirnov tests for normality revealed non-Gaussian distributions for all network measures (p < 0.05, Table 6 and Supplementary Fig. S1). To alleviate this, diameter, characteristic path length, and radius were log transformed to reduce positive skew, and efficiency and clustering coefficients were squared to reduce negative skew. After data cleaning, the diameter, characteristic path length, and radius mimicked normal distributions when assessed by Kolmogorov–Smirnov tests (p > 0.05), but efficiency (skew = −0.688, SEskew = 0.192, kurtosis = 0.516, SEkurtosis = 0.381) and clustering coefficients (skew = −0.154, SEskew = 0.192, kurtosis = 1.639, SEkurtosis = 0.381) were non-normal. Despite the latter, the analysis was continued as the graphs, when inspected, appeared improved beyond the original in regard to skew (Supplementary Fig. S1), and therefore, we decided that the data complied with general linear model assumptions despite formally failing the tests. One extreme outlier was present in the diameter data after transformation (defined as >3 × interquartile range), and thus, we excluded this participant from further whole-brain analyses. Omnibus multivariate analyses revealed no significant main or interaction effects (p > 0.05, Table 7), suggesting that there were no differences in whole-brain network measures between individuals who carry APOE4 versus noncarriers, have an FH versus no FH, and obese versus healthy WHR.
Kolmogorov–Smirnov Test Results for the Whole-Brain, Default Mode Network and Visual System
Lack of normality of standardized residuals assessed with Kolmogorov–Smirnov tests of the whole-brain, DMN and visual system. The lower part of the table demonstrates how the normality of the metrics is improved after data cleaning (removing outliers and transforming the data). p Values are reported to 3 decimal places.
DF, degrees of freedom; DMN, default mode network.
Multivariate Results
There were no significant differences in network measures as a function of risk factors: FH, APOE4, and WHR across the whole-brain, DMN or a control subnetwork (visual system). p Values are reported to 3 decimal places.
F, F statistic.
Subnetwork analyses
We then investigated whether any individual differences were occurring at a subnetwork level.
DMN analysis
Kolmogorov–Smirnov tests revealed non-normality for all network measures calculated from the DMN integrated graphs (Table 6 and Supplementary Fig. S2). To correct for this, the diameter, characteristic path length, and radius were log transformed and the efficiency was squared. Despite being non-Gaussian as determined by Kolmogorov–Smirnov tests, the distribution of residuals for mean clustering coefficients was not too heavily skewed. We identified nine extreme outliers (>3 × interquartile range) within efficiency data and one within clustering coefficients, and thus, these were removed from the analysis. After data cleaning, the characteristic path length (skew = 0.508, SEskew = 0.197, kurtosis = 0.516, SEkurtosis = 0.381), efficiency (skew = −1.522, SEskew = 0.197, kurtosis = 3.106, SEkurtosis = 0.392), and clustering coefficients (skew = −0.599, SEskew = 0.197, kurtosis = 1.131, SEkurtosis = 0.392) were not formally normal when reassessed with Kolmogorov–Smirnov tests, however, the analysis was continued (Supplementary Fig. S2) as not to lose value in our raw data, as a result of another round of data cleaning. Multivariate analyses revealed no significant effects (N = 151, p > 0.05, Table 7), suggesting that there are no differences in DMN measures as a result of risk-factor profile.
Visual network analysis
Kolmogorov–Smirnov tests revealed non-normality for all six network measures for the visual system (Table 6 and Supplementary Fig. S3). Following the same process as before, the diameter, characteristic path length, and radius were log transformed and the efficiency and clustering coefficients were squared. No outliers were identified in the transformed metrics. Diameter (skew = 0.852, SEskew = 0.192, kurtosis = 1.004, SEkurtosis = 0.38), characteristic path length (skew = 0.0614, SEskew = 0.191, kurtosis = 1.385, SEkurtosis = 0.38), radius (skew = 0.751, SEskew = 0.191, kurtosis = 1.164, SEkurtosis = 0.38), and efficiency (skew = −0.956, SEskew = 0.191, kurtosis = 1.241, SEkurtosis = 0.38) were non-normal, however, the analysis was continued (Supplementary Fig. S3), with a sample size of 161, as the distributions were improved beyond the untransformed metrics to a point that we believe meets the underlying assumptions of the analysis. The general linear model (N = 161) revealed no significant multivariate effects (Table 7).
Analysis of network hubs in the whole brain
Replicator dynamics identified hubs consistent across the individual risk factor groups. Individuals with no FH (N = 104) had hubs located in the left and right Rolandic operculum, right inferior parietal gyrus, left angular gyrus, and right Heschl's gyrus, whereas individuals with a positive FH (N = 59) had hubs at the right Rolandic operculum, left inferior frontal gyrus opercular part, left and right paracentral lobule, and the right Heschl's gyrus (Fig. 4). Individuals who had a healthy WHR (N = 63), and thus considered at less risk of developing AD, had hubs within the left inferior frontal gyrus opercular part, right Rolandic operculum, right inferior parietal gyrus, and right Heschl's gyrus, whereas individuals who were centrally obese (N = 102) had hubs within the right Rolandic operculum, right paracentral lobule, and both left and right Heschl's gyri (Fig. 4). Participants who were negative for the APOE4 allele (and thus considered low risk) had hubs in the left inferior frontal gyrus opercular part, right Rolandic operculum, right precuneus, and right Heschl's gyrus (N = 100), whereas APOE4-positive individuals (N = 64) had hubs in the right Rolandic operculum, right inferior parietal gyrus, left angular gyrus, right paracentral lobule, and right Heschl's gyrus (Fig. 4).

Nodes identified as hubs, change dependent on risk factor profile. This figure shows the changes in nodes defined as hub regions, when you transition from a low-risk group to a high-risk group. A size scale is used to define hub changes, large symbols indicate gained hubs whereas small symbols represent those hubs which are lost. The intermediate size indicates hubs that remain.
To summarize the above-described pattern, the right Rolandic operculum and Heschl's gyrus remain present as hubs regardless of risk factor. In contrast, at-risk individuals (obese, positive FH, and APOE4 carriers) consistently have a hub in the right paracentral lobule, which is absent in their respective low-risk group (Table 8 and Fig. 4).
Hub Changes As a Function of Risk Factor
For the whole-brain analysis (top): The right Rolandic operculum and right Heschl's gyrus remain constant when switching from a low-risk—no FH, no APOE4 allele, healthy WHR score—to a high-risk group (FH, APOE4, centrally obese). Whereas the right paracentral lobule is consistently gained. Furthermore, a few more hubs are gained or lost, although inconsistent across risk factor groups. In the DMN analysis (middle): Individuals with an FH had a hub in the right precuneus in contrast to those with no FH. Conversely, this hub is lost between individuals with no APOE4 in comparison with those who carry APOE4 and instead a hub is gained within the left inferior parietal gyrus. In the visual subnetwork analysis (bottom): Hubs within the right calcarine fissure, right middle occipital lobe, and right inferior occipital lobe remained in all risk factor manipulations.
Analysis of internally important nodes/hubs in the DMN
Hubs were identified within the left and right opercular parts of the inferior frontal gyrus, right inferior parietal gyrus, and left angular gyrus in individuals with no FH, whereas individuals with FH had hubs within the left and right opercular parts of the inferior frontal gyrus, right inferior parietal gyrus, left angular gyrus, and right precuneus. Both individuals of healthy WHR and individuals who were obese had hubs within the left and right opercular parts of the inferior frontal gyrus, right inferior parietal gyrus, and left angular gyrus. In participants without the APOE4 allele, hubs were identified in the left and right opercular parts of the inferior frontal gyrus, right inferior parietal gyrus, left angular gyrus, and right precuneus, whereas individuals who carry APOE4 had hubs within the left and right opercular parts of the inferior frontal gyrus, left and right inferior parietal gyri, and left angular gyrus.
As opposed to the analysis of the whole brain, there were no consistent differences of hubs within the DMN as a result of risk factor profile. Individuals without an FH compared with those with an FH gained a hub within the right precuneus, whereas this hub was lost in the transition between APOE4 noncarriers and carriers and instead they gained a hub in the left inferior parietal gyrus (Table 8).
Analysis of internally important nodes/hubs in the visual subnetwork
Replicator dynamics identified internally important nodes within the right calcarine fissure, right middle occipital lobe, and right inferior occipital lobe of the visual subnetwork. Each of these hubs was identified regardless of risk factor profile, suggesting that AD risk has no effect on hubs within the visual network (Table 8).
Discussion
To the best of our knowledge, our study investigated for the first time the effects of APOE4 genotypes, central obesity, and FH on the graph theoretical metrics of structural brain networks derived via tractography, in cognitively healthy adults. The advantage of our analysis methods over conventional structural network analyses lies in the use of integrated structural network matrices, which combine, in a data-driven manner, multiple metrics of the white matter tracts, rather than arbitrarily using one metric. This means that more information is included in the individual structural network matrices.
Graph theoretical metrics expressing segregation and integration of each participant's structural brain connectome were calculated for the whole brain and for two subnetworks, the DMN (which is known to be impaired in AD) and the visual network (used here as a control network). Multivariate analyses revealed no significant effects for either whole brain or for the subnetworks, which suggests that there were no differences in network measures for any of the risk factors (APOE4, FH, or central obesity). This interesting finding, which indicates that the integration and segregation properties of these structural networks were preserved in asymptomatic individuals at heightened risk of developing AD, could point to a possible compensatory mechanism that leads to minimal functional disruption (as indicated by the normal cognitive abilities of our sample). We note, however, that it is not known when, or indeed if, any of these individuals would develop AD. Cortical thickness-based structural brain networks, which reflect different organizational properties to the tractography-derived networks used in our analysis, demonstrated altered properties in subjects with mild cognitive impairment (MCI) and AD compared with healthy controls following the progress of the disease (Zhou and Liu, 2013). In addition, Brown and colleagues (2011) found that tractography-derived structural brain networks in older APOE4 carriers exhibited loss of local interconnectivity in contrast to those of older noncarriers, and that the carriers had impaired memory abilities as well. Finally, Ma and colleagues (2017) found that structural brain connectivity was disrupted in adults (older than 55 years of age) as a result of an interaction between APOE4 status and developed MCI, more so than it was for APOE4 carriers only. These findings may suggest that structural connectivity changes are not present in cognitively healthy individuals at risk, and reflect a manifestation of established disease and/or of older age.
Looking at the hubs of the whole-brain structural networks of low-risk versus high-risk individuals, we identified that the three subgroups of high-risk individuals (centrally obese, positive FH, and positive APOE4) when compared with individuals in the respective low-risk groups (normal WHR, negative FH, and negative APOE4) consistently exhibited a hub in the right paracentral lobule. Importantly, there were no consistent differences of hubs within the DMN and visual network as a result of risk factor profile. The paracentral lobule is located on the medial surface of the cerebral hemisphere and includes parts of both the frontal and parietal lobes. It has gyral projections to the medial frontal gyrus, cingulate sulcus, and precuneus and sulcal projections to the paracentral, cingulate, precentral sulci, and the pars marginalis of cingulate sulcus. The paracentral lobule controls motor and sensory innervations of the contralateral lower limb. In a recent study, widespread cortical thinning in the left hemisphere regions, including the pericalcarine cortex, supramarginal gyrus, cuneus cortex, lateral occipital cortex, precuneus cortex, fusiform gyrus, superior frontal gyrus, lateral occipital cortex, entorhinal cortex, inferior parietal cortex, isthmus-cingulate cortex, postcentral gyrus, superior parietal cortex, caudal middle frontal gyrus, insula cortex, precentral gyrus, and paracentral lobule, was observed in patients with AD compared with normal controls (Yang et al., 2019). Another structural MRI study on nondemented older subjects revealed a modulation of the cortical thickness covariance between the left parahippocampal gyrus and left medial cortex, supplementary motor area, the left medial superior frontal gyrus, and paracentral lobule driven by the interaction of the rs405509 genotype and age (Chen et al., 2015). In a previous CARDS analysis on the same cohort, we explored the impact of APOE4, FH and WHR on white matter microstructure (Mole et al., 2020a). Individuals with the highest genetic risk (FH+ and APO-E4) showed a reduced macromolecular proton fraction (MPF) from quantitative magnetization transfer in the right parahippocampal cingulum associated with obesity. In addition, APOE4-related MPF reductions were apparent in the left thalamus (Mole et al., 2020b). Furthermore, Rs405509 is an AD-related polymorphism located in the APOE promoter region that regulates the transcriptional activity of the APOE gene. Abnormal structural brain connectivity was identified between the angular gyrus, superior parietal gyrus, precuneus, posterior cingulum, putamen, precentral gyrus, postcentral gyrus, and paracentral lobule in elders with subjective cognitive decline compared with healthy controls (Kim et al., 2019). These aberrant structural connections were also associated with cognitive scores.
In addition to MRI, PET imaging has identified reduced metabolism in the parietal areas in both APOE4 carriers with MCI (Paranjpe et al., 2019) and clinical AD (Mosconi et al., 2004). Furthermore, magnetoencephalography (MEG) in young healthy APOE4 carriers (Koelewijn et al., 2019) has identified hyperconnectivity in the right parietal regions, consistent with the here reported findings. Thus, the novel phenotype we have identified can potentially predict the development of symptoms in a longitudinal study of the same cohort, it could be used as an early biomarker of dementia.
Assessment of our analysis
Our findings would benefit from replication in a larger sample due to the fragmentation of the initial sample into subgroups with the different risk profiles. It would also be beneficial for structural network analyses to include measures that are believed to play a more important role in the functional performance of the brain, such as myelination of the white matter tracts (Messaritaki et al., 2021) and axonal diameter. We finally note that the thresholding of structural connectivity matrices derived from tractography is still an issue of debate. Buchanan and colleagues (2020), Civier and colleagues (2019), and Drakesmith and colleagues (2015) have shown the possible effects of thresholding when different tractography methods are used. In our analysis, we adopted a modest thresholding of five streamlines, to reduce possible false positives.
Conclusion
In conclusion, our study did not detect any changes in structural brain networks that would imply alterations in the integration and segregation of structural network properties in cognitively healthy individuals with different risk factors. We identified the right paracentral lobule as a hub brain area in high-risk individuals, but not in low-risk individuals. A longitudinal study of the same cohort with the incorporation of functional neuroimaging data could evaluate this phenotype further.
Footnotes
Authors' Contributions
All authors approved the final version of the article.
Author Disclosure Statement
No competing financial interests exist.
Funding Information
Supplementary Material
Supplementary Figure S1
Supplementary Figure S2
Supplementary Figure S3
References
Supplementary Material
Please find the following supplemental material available below.
For Open Access articles published under a Creative Commons License, all supplemental material carries the same license as the article it is associated with.
For non-Open Access articles published, all supplemental material carries a non-exclusive license, and permission requests for re-use of supplemental material or any part of supplemental material shall be sent directly to the copyright owner as specified in the copyright notice associated with the article.