
Abstract
Background:
Major depressive disorder (MDD) is a mood disorder associated with disruptions in emotional control. Previous studies have investigated abnormal regional activity and connectivity within the fronto-limbic circuit. However, condition-specific connectivity changes and their association with the pathophysiology of MDD remain unexplored. This study investigated effective connectivity in the fronto-limbic circuit induced by negative emotional processing from patients with MDD.
Methods:
Thirty-four unmedicated female patients with MDD and 28 healthy participants underwent event-related functional magnetic resonance imaging at 7T while viewing emotionally negative and neutral images. Brain regions whose dynamics are driven by experimental conditions were identified by using statistical parametric mapping. Effective connectivity among regions of interest was then estimated by using dynamic causal modeling.
Results:
Patients with MDD had lower activation of the orbitofrontal cortex (OFC) and higher activation of the parahippocampal gyrus (PHG) than healthy controls (HC). In association with these regional changes, we found that patients with MDD did not have significant modulatory connections from the primary visual cortex (V1) to OFC, whereas those connections of HC were significantly positively modulated during negative emotional processing. Regarding the PHG activity, patients with MDD had greater modulatory connection from the V1, but reduced negative modulatory connection from the OFC, compared with healthy participants.
Conclusions:
These results imply that disrupted effective connectivity among regions of the OFC, PHG, and V1 may be closely associated with the impaired regulation of negative emotional processing in the female patients with MDD.
Impact statement
This is the first study using the dynamic causal modeling on 7T functional magnetic resonance imaging to investigate negative emotional condition-specific changes in the effective connectivity in patients with major depressive disorder (MDD). We found that within the selected fronto-limbic circuit, patients with MDD did not have significant connection from the primary visual cortex to orbitofrontal cortex (OFC), and reduced negative (inhibitory) connection from the OFC to parahippocampal gyrus during negative emotional processing. These results indicate that the abnormal effective connectivity observed from patients with MDD is associated with the impaired regulation of negative emotional response, which may have implications for neurophysiological mechanisms for a persistent feeling of sadness in MDD.
Introduction
Major depressive disorder (MDD) is a mood disorder that is mainly characterized by episodes of prolonged low mood, impaired cognition, and reduced energy (Chamberlain and Sahakian, 2006; Kessler et al., 2003). Brain imaging studies have explored the neural substrates underlying mood dysregulation in MDD, showing that mood dysregulation in MDD is correlated with hyperactivation and hypoactivation of the limbic and frontal regions, respectively (Diener et al., 2012; Fitzgerald et al., 2008). The limbic regions are involved in the perception and generation of emotion (LeDoux, 1998), whereas prefrontal regions play a role in emotion regulation (Etkin et al., 2011). In particular, anatomical tracing studies have shown strong reciprocal connections between these frontal and limbic regions (Amaral and Price, 1984; Ghashghaei and Barbas, 2002). Therefore, there is increasing interest in elucidating how connectivity changes in the fronto-limbic circuit are associated with cognitive and emotional disturbances in MDD.
Several studies have revealed significant reductions in the fronto-limbic functional connectivity during emotional processing in unmedicated individuals with MDD (Anand et al., 2005; Kong et al., 2013; Siegle et al., 2007). Functional connectivity was inferred based on temporal correlation between pairs of functional magnetic resonance imaging (fMRI) measurements. Anand et al. (2005) reported that functional connectivity between the anterior cingulate cortex and limbic regions was lower in patients with MDD than in healthy subjects during exposure to emotionally neutral, positive, and negative pictures. Kong et al. (2013) found decreased functional connectivity between the rostral prefrontal cortex and amygdala in patients with MDD for the fear but no significant differences for the happy or neutral conditions. However, functional connectivity does not provide information on directed influence between brain regions. Thus, the extent of disruption of forward or backward connections between the frontal and limbic regions during emotional processing in patients with MDD is unclear.
To address these issues, several studies have characterized the emotional dysregulation of MDD in terms of effective connectivity (Almeida et al., 2009a; Carballedo et al., 2011; Lu et al., 2012; Musgrove et al., 2015), which explicitly refers to the directed influence of one region on another (Friston, 1994, 2011; for reviews see Li et al., 2018). Carballedo et al. (2011) used structural equation modeling analysis (Mclntosh and Gonzalez-Lima, 1994) in an fMRI study, and they found imbalance in effective connectivity in the fronto-limbic circuit whereas MDD participants engaged in perception of faces with negative emotions. The interpretation of these findings, however, is restricted to the level of measured hemodynamic signals (Penny et al., 2004). In contrast, dynamic causal modeling (DCM) allows one to infer changes in effective connectivity at the neuronal level based on a biophysical model of how neuronal activity is transformed into measured brain responses (Friston et al., 2003). Using DCM on fMRI, Almeida et al. (2009a) found that patients with MDD had significantly reduced endogenous connectivity from the left-sided orbitofrontal cortex (OFC) to amygdala while viewing happy, sad, and neutral faces, relative to healthy controls (HC). However, emotional condition-specific effects on the effective connectivity (i.e., modulatory connectivity) were not further investigated in patients with MDD.
An additional study (Lu et al., 2012) addressed abnormal endogenous and modulatory connectivity across the fronto-limbic circuit in MDD by using DCM on magnetoencephalography (MEG). Lu et al. (2012) reported that endogenous connection from the dorsolateral prefrontal cortex (DLPFC) to the amygdala was significantly decreased, but condition-specific change in connectivity from the anterior cingulate cortex to the DLPFC was increased by sad face responses in MDD. However, MEG is known to have a low sensitivity to subcortical sources, such as limbic regions, and connectivity strengths between frontal and limbic regions were not shown for each group (Lu et al., 2012). A more recent study by Musgrove et al. (2015) investigated fronto-limbic effective connectivity of patients with MDD by using DCM on 3T fMRI. They found a significantly weaker bottom–up connectivity from the amygdala to the subgenual anterior cingulate cortex in patients with MDD during processing of facial expressions of fear and anger, compared with HC.
The aim of this study is to investigate whether female patients with MDD have disrupted effective connectivity of the fronto-limbic circuit during negative emotional processing, using DCM on 7T fMRI. Our hypothesis is that attenuated suppressive influence from the frontal to limbic regions in patients with MDD causes hyperactivation of the limbic system in response to negative emotional stimuli, which, in turn, is associated with the emotional dysregulation observed in patients with MDD.
The 7T MRI allows for acquisition of functional images with higher signal-to-noise ratio and higher specificity of the blood oxygen level-dependent (BOLD) signal to the underlying neuronal responses than the 3T MRI (Yacoub et al., 2001). In our previous work, we showed that the posterior entropy of 7T parameter estimates was less than that of 3T parameter estimates, suggesting that 7T furnishes more efficient estimates (i.e., reduced uncertainty) of DCM connectivity parameters (Jung et al., 2018; Tak et al., 2018). In this study, we exploited these advantages of DCM for 7T fMRI in exploring abnormal connections from the patients with MDD.
Materials and Methods
Participants
Thirty-four unmedicated female subjects with depression participated in this study. The participants with depression were between 20 and 31 years of age and had MDD with a current depressive episode. All participants with depression were diagnosed by a licensed psychologist, according to the Structured Clinical Interview for the Diagnostic and Statistical Manual of Mental Disorders, 5th Edition (DSM-5). In addition, depression severity was assessed with the Beck Depression Inventory (BDI)-2 (Beck et al., 1996a,b) and the Hamilton Depression Rating Scale (HAM-D) (Hamilton, 1960). In particular, the BDI-2 with a cut-off point of 15 was used as a screening method for current episodes of MDD (Matthews et al., 2008; Viinamäki et al., 2004).
Twenty-eight female healthy subjects also participated in this study. The healthy participants were between 20 and 29 years of age, had no history of psychiatric illness, and were not currently taking any prescription or centrally acting medications. Both groups were matched for age, sex ratio, and years of education, based on the two-sample t-tests assuming unequal variance. Although there were more numbers of patients with MDD than HC, there was no significant difference in the sample means between these groups with regards to age and years of education (see Results section). All participants were right-handed.
All participants were recruited from universities near the study location, as well as through local advertising and web postings. They received financial compensation for their participation. The study protocol was approved by the Public Institutional Bioethics Committee designated by the Ministry of Health and Welfare (P01-201609-11-002). We confirmed that all methods were carried out in accordance with the relevant institutional guidelines and regulations. All participants were informed in detail about the nature of the study and provided written informed consent for the study.
Additional details about methods of subject recruitment and screening for a current MDD episode were as follows. Participants were first selected from those who self-administered BDI-2 and reported the total score of BDI-2 higher than 30. Participants were then assigned to a face-to-face diagnostic interview by a licensed psychologist. Participants who misunderstood the BDI-2 items or exaggerated the symptoms were excluded. Then, each depressive criterion of DSM-5 was checked to confirm the diagnosis of MDD. The participants diagnosed with MDD were assigned to fMRI acquisition as soon as possible within 2 weeks. Immediately before conducting the fMRI, participants were interviewed briefly to confirm that they were still in the MDD episode. BDI-2 and HAM-D scores were measured, and those who scored lower than 15 of BDI-2 were ruled out of the fMRI acquisition. The mean and lowest scores of BDI-2 of the MDD participants were 33.7 and 19, respectively.
Paradigm design
Participants underwent event-related fMRI while viewing emotionally negative and neutral images selected from the International Affective Picture System (IAPS) (Lang et al., 2008). The IAPS images are rated on two primary dimensions, affective valence, which ranges from unpleasant to pleasant, and arousal, which ranges from calm to excited. Using standardized valence and arousal ratings for the IPAS picture set (Lang et al., 2008), negative images (valence ratings, 2–3; arousal ratings, <6) and neutral images (valence ratings, 4.5–5.5; arousal ratings, <3) were selected. The participants were not asked to rate the valence and arousal of the pictures. These inclusion criteria were consistent with the criteria used in previous fMRI studies (Anand et al., 2005). In the fMRI experiment paradigm, brief instructions pertaining to the experiment were given for 6 sec at the beginning of the experiment, followed by the presentation of randomly selected negative or neutral images for 5 sec each. Each inter-stimulus interval was presented for 7–13 sec (average 10 sec) (Buckner et al., 1996; Seok and Sohn 2015). Total experiment time was 8 min and 48 sec. To prevent any loss of concentration due to the long interval between stimulus presentations, the subjects were asked to press the response key whenever a green screen was displayed during the interval. The green screen was randomly displayed 12 times. An overview of the experimental design is shown in Figure 1. The IAPS catalog numbers for negative and neutral pictures, and their timing information used in this study are available from the corresponding author on request.

Schematic of the experimental paradigm. The event-related paradigm involved viewing emotionally negative and neutral images selected from the International Affective Picture System. Stimuli were presented randomly in 20 negative and 20 neutral images. Each stimulus was presented for 5 sec, and the randomly selected inter-stimulus interval ranged from 7 to 13 sec.
MRI acquisition
All images were acquired by using a 7T Philips Achieva scanner (Philips Medical Systems, Best, The Netherlands). BOLD images were obtained by using a T2*-weighted gradient echo-planar imaging sequence. Detailed scanning protocols are as follows: repetition time (TR) = 2000 ms, echo time (TE) = 17 ms, flip angle = 70°, bandwidth = 1856 Hz/pixel, field of view = 192 × 192 mm2, voxel size = 2.0 × 2.0 × 3.5 mm3, and 32 interleaved slices without slice gaps. High-resolution structural images were acquired by using a three-dimensional T1-weighted sequence with TR = 5.5 ms, TE = 2.6 ms, flip angle = 7°, field of view = 234 × 234 mm2, voxel size = 0.7 × 0.7 × 0.7 mm3, and 334 slices.
Image pre-preprocessing
Pre-processing of the functional images was performed by using Statistical Parametric Mapping (SPM12) (Wellcome Centre for Human Neuroimaging, UK; Friston et al., 2011). The effects of head motions were suppressed by spatially realigning all time frames to the first image using an affine (six parameter) spatial transformation method, and geometric distortion was corrected by the unwarp function. The ensuing realignment parameters were saved for modeling residual head motion effects in the BOLD time series. Slice-acquisition delays for each functional image were compensated by realigning the signal in each slice temporally to a reference slice (e.g., the middle slice) using sinc interpolation. Realigned images were co-registered with a high-resolution anatomical image. Afterward, all images were spatially normalized into the Montreal Neurological Institute (MNI) space. Spatial smoothing with a 6-mm full-width-at-half-maximum Gaussian kernel was finally applied to the spatially normalized images to accommodate inter-subject variability in the group analyses.
The intensity non-uniformity for 7T MR images was higher than that for 3T MR images, due to higher radio-frequency effects (Duyn, 2012). These artifacts confounded the generation of within-brain mask. Therefore, before a general linear model (GLM) analysis, we corrected the bias field in both functional and structural images by using the unified segmentation algorithm (Ashburner and Friston, 2005) that has been implemented in SPM12. Specifically, a bias field was estimated by parameterizing the bias as the exponential of a linear combination of low-frequency basis functions. The bias field was then removed by multiplying the estimated bias by functional and structural images.
GLM analysis
Whole-brain SPM used a GLM analysis of the BOLD data acquired at 7T MRI (Friston et al., 1994). The first-level design matrix was constructed to include two regressors modeling two conditions (events of negative and neutral images) convolved with a basis set consisting of the canonical hemodynamic response function and its temporal derivative, which allowed us to account for the variability in the delay of the peak of the response. In addition, the instruction periods and the six realignment parameters were included as nuisance variables to model task-independent activation and the residual head motion effects on the BOLD time series, respectively. Low-frequency confounds were removed from the BOLD data by using a high-pass filter based on a discrete cosine transform set with a cut-off frequency of 1/128 Hz. The effects of interest for each subject were estimated by fitting the GLM to the individual BOLD responses.
The contrast images of all subjects from the first level were then analyzed by using a random-effects analysis through summary statistics, to assess the group-level activation of the BOLD response during negative emotional processing (Penny and Holmes, 2006). Specifically, a contrast of the main effects (negative emotional > neutral images) for each of the two groups of individuals, HC and patients with MDD, was assessed by using a one-sample t-test design at the second level. Group differences in the BOLD activation in response to negative versus neutral images were finally evaluated by using a two-sample t-test design at the second level. This allowed a direct comparison between participants with MDD and HC. The subtraction contrast between negative and neutral conditions (+Negative −Neutral) was used.
DCM analysis
Effective connectivity among regions of interest (ROIs) was assessed by using a DCM analysis (Ashburner et al., 2014; Friston et al., 2003). Within a DCM framework, multiple hypotheses on a brain network of connected ROIs were expressed by different connectivity models. Inference on model parameters and model structures proceeded by using standard variational Bayesian procedures, and it was based on the posterior density over parameters and models respectively (Friston et al., 2007, 2016; Penny, 2012; Penny et al., 2010). All DCM models used in this study comprised empirically defined left-sided regions of the OFC, parahippocampal gyrus (PHG), and primary visual cortex (V1). These ROIs were obtained from the SPM analysis as representative regions of the fronto-limbic circuit (see the Results section for more details).
Previous studies have consistently reported hyperactivation of the PHG (Diener et al., 2012; Groenewold et al., 2013; Sheline et al., 2009; Stuhrmann et al., 2011; Surguladze et al., 2005), and hypoactivation of the OFC in patients with MDD (Fitzgerald et al., 2008; Keedwell et al., 2005; Sheline et al., 2009) for negative emotional stimuli. Moreover, anatomical brain imaging studies have shown the connections among the regions of the OFC, PHG, and V1 (Catani et al., 2003; Cavada et al., 2000). Cavada et al. (2000) showed that the OFC is connected to the PHG and the visual areas. Catani et al. (2003) reported an anatomical connection between the PHG and the occipital lobe. In addition, Bruder et al. (2017) provided neuroimaging evidence of right-left asymmetry in depressive disorders. They reported a reduction of left prefrontal activity in depressed patients associated with downregulation of limbic response to negative emotional information. Based on these findings, we tested a unilateral left connectivity models with regions of the PHG, OFC, and V1, to investigate (1) how the negative emotional stimuli affect the directed connections among the PHG, OFC, and V1, and (2) how these interactions differ in MDD and healthy participants.
The basic connectivity structure, from which all other models were derived, is summarized in Figure 2. Specifically, the V1 was regarded as the region to receive the visual (i.e., driving) input consisting of emotionally negative and neutral images. The models then differed in terms of which connections were modulated by the negative emotional condition; that is, the forward and backward connections between V1 and PHG, V1 and OFC, and OFC and PHG. As these were either present or absent, this resulted in 26 = 64 different DCM models. We assumed that all regions had full endogenous connectivity.
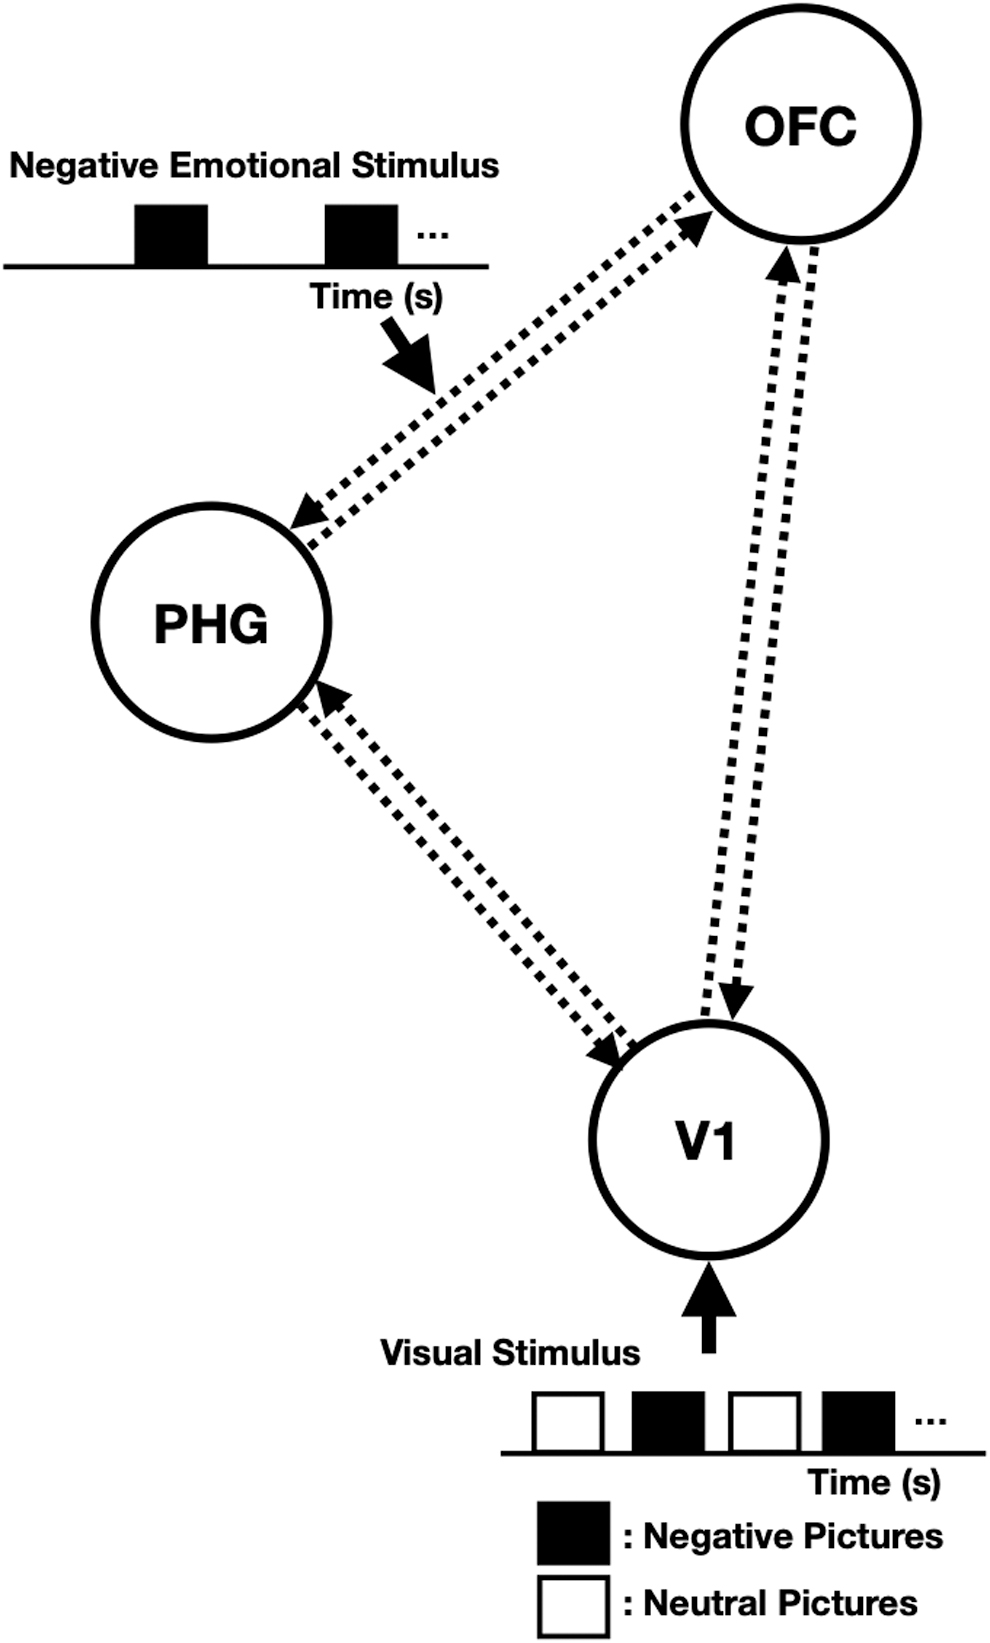
The model structure for the DCM analysis of negative emotional processing data. Sixty-four models were tested in this study. The models consisted of three regions: the OFC, the PHG, and the V1. We assumed that all three regions were reciprocally connected to each of the other regions (i.e., full endogenous connectivity), and the driving inputs consisting of emotionally negative and neutral images entered the V1. The models then differed in terms of connections modulated by negative emotional stimuli. DCM, dynamic causal modelling; OFC, orbitofrontal cortex; PHG, parahippocampal gyrus; V1, primary visual cortex.
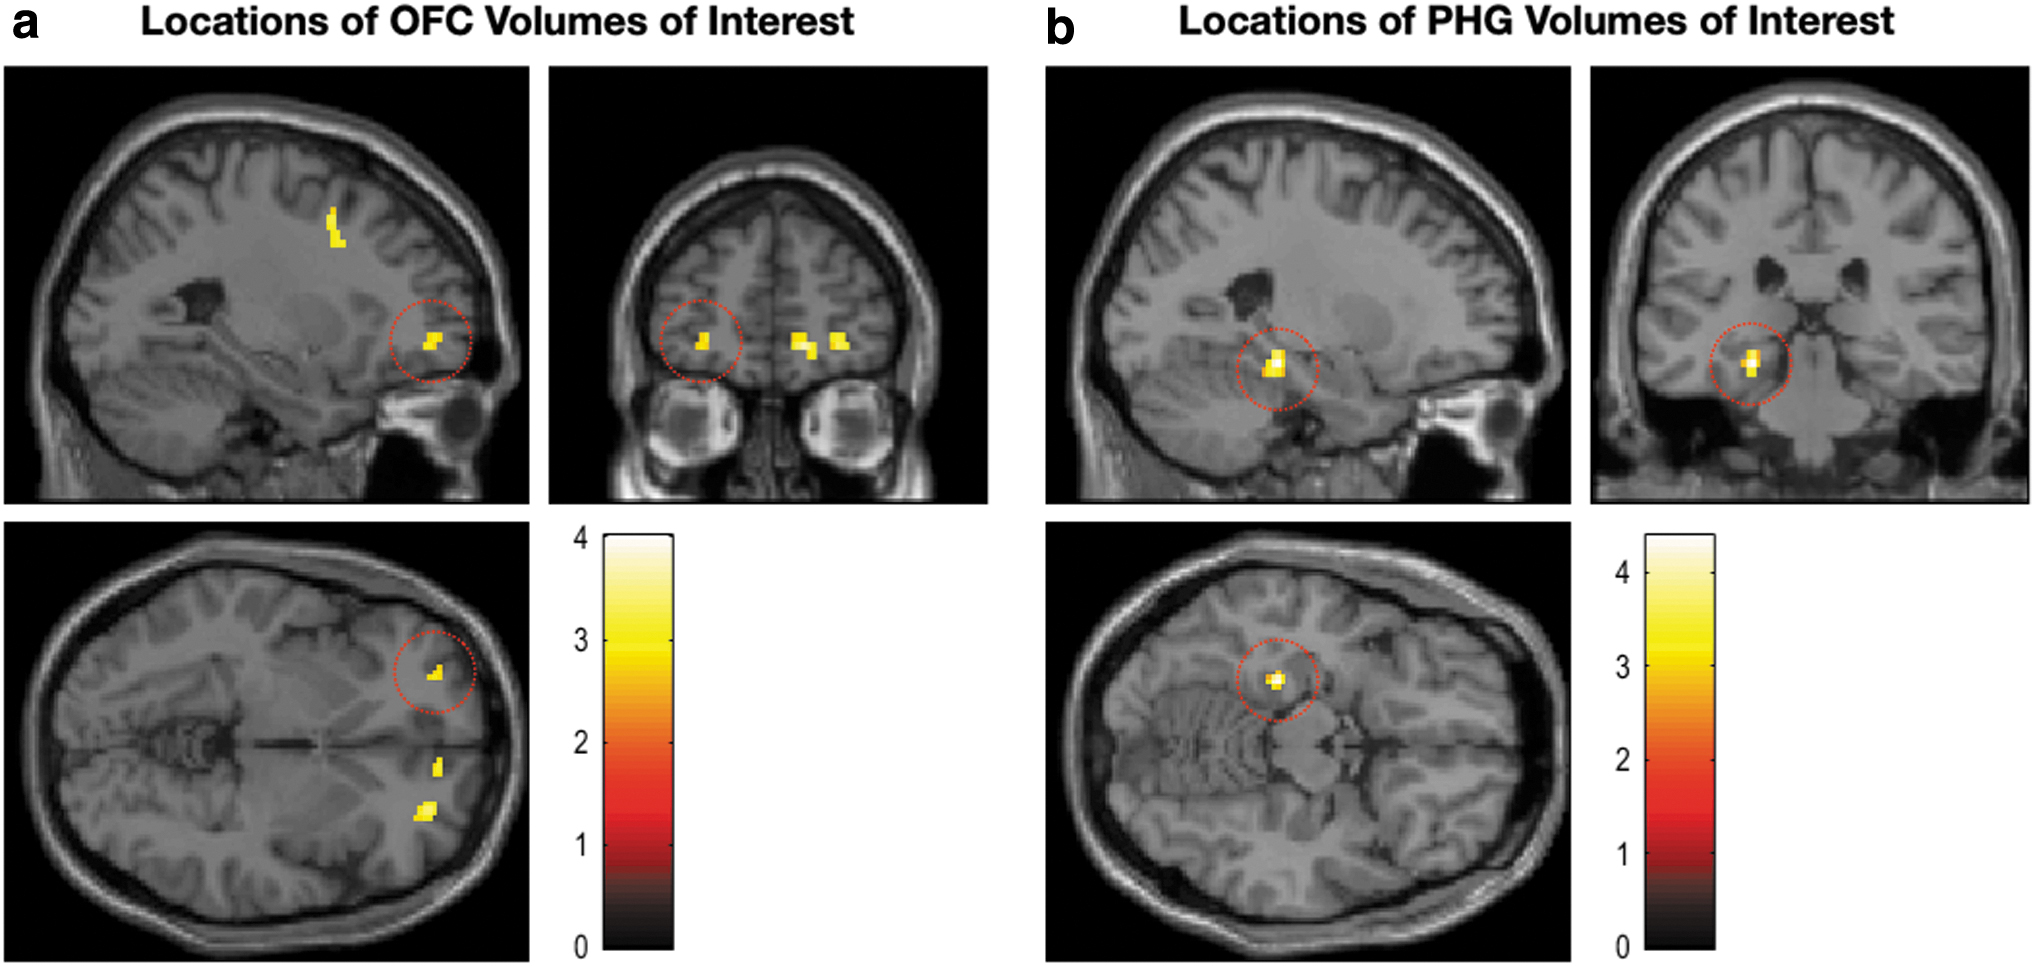
Time series for each subject were estimated from each ROI with the first principal component of all voxels within a 6-mm radius sphere, centered on the group peak coordinates but masked with the individual activation areas in the SPM results (Seghier et al., 2010). Specifically, the group peak coordinates of the ROIs were determined as follows: The group peak coordinates of the PHG were identified as the local maxima of regions within the anatomical region, with activation that was greater in participants with MDD than in HC. In contrast, the group peak coordinates of the OFC were selected as the local maxima of regions within the anatomical region that showed less activation in participants with MDD than in HC. In addition, the group peak coordinates of the V1, which received the driving inputs, were selected as the local maxima of the activation map from the conjunction analysis (Negative ∩ Neutral) within the anatomical region.
Once the model structure for the DCM analysis was specified, the posterior distribution over the model parameters, and log model evidence for each subject and model were estimated by using a variational Laplace method (Friston et al., 2007). Inference on the model structure at the group level was then performed by using Bayesian model selection (BMS) based on a random-effects analysis (Penny et al., 2010; Stephan et al., 2010). The random-effects analysis accounts for the heterogeneity of model structure across subjects and provides posterior model probabilities and exceedance probabilities (Penny et al., 2010). Therefore, the best connectivity structure for a population of HC and patients with MDD was identified separately, by comparing model exceedance probabilities with a family of models.
Finally, group-level inference on the model parameters (i.e., effective connectivity changes) was performed by using Bayesian model averaging (BMA) followed by Bayesian parameter averaging over subjects (Friston et al., 2016; Penny et al., 2010). The BMA provides the posterior density of the connectivity parameters averaged across the subset of models and groups of subjects. We, therefore, used the posterior mean of the parameters for evaluating the strength of endogenous or modulatory connectivity at the group level. The significance of each connectivity parameter was then assessed by the posterior probability p—the probability that samples for each connection differ from zero. Connections that were above the Bayesian criterion of p > 0.9 were judged to be significantly present or modulated by experimental inputs, in line with previous studies (Richardson et al., 2011; Seghier et al., 2012; Woodhead et al., 2013, 2014).
Results
Participant characteristics
Table 1 shows the demographic and clinical characteristics of the female participants with MDD and HC. Two sample t-tests assuming unequal variance were performed to test for differences between the two groups on subject characteristics. The two groups of participants did not differ with respect to age (t = 0.19, p = 0.85; MDD = 24.5 ± 2.8; HC = 24.4 ± 2.6 years), education (t = 0.68, p = 0.5; MDD = 14.5 ± 1.7; HC = 14.3 ± 1.4 years), and gender composition (all participants were women). The MDD participants had significantly higher BDI-2 (t = 19.28, p < 0.001; MDD = 33.7 ± 7.1, HC = 5.7 ± 4.0) and HAM-D scores (t = 14.45, p < 0.001; MDD = 19.9 ± 6.1, HC = 3.0 ± 2.6) than the HC participants.
Demographic and Clinical Characteristics of the Participants
Data are expressed as mean ± standard deviation. Two-sample t-tests assuming unequal variance were performed to test for differences between groups on subject characteristics.
BDI-2, Beck depression inventory-2; HAM-D, Hamilton depression rating scale; MDD, major depressive disorder.
Regional activity SPM analysis
Figure 3 shows the sectional view of selected brain regions that have significant activations of the contrast (negative emotional > neutral images) in each of the two groups of individuals: HC and patients with MDD. Details of the whole-brain statistical results are summarized in Table 2. The resulting SPMs were thresholded at uncorrected p < 0.001. We observed significant clusters containing the medial superior frontal gyrus, medial OFC, superior temporal gyrus, amygdala, PHG, fusiform gyrus, superior parietal lobule, and precuneus in HC. Patients with MDD had significant clusters of the fusiform gyrus, medial superior frontal gyrus, PHG, amygdala, superior parietal lobule, superior temporal gyrus, hippocampus, thalamus, and precuneus. Maximum t-values in these clusters were higher than thresholds according to false discovery rate adjusted p-value <0.05 (Benjamini and Yekutieli, 2001; Genovese et al., 2002). The areas of activation were consistent with findings of previous studies (Diener et al., 2012; Fitzgerald et al., 2008; Geissberger et al., 2020).
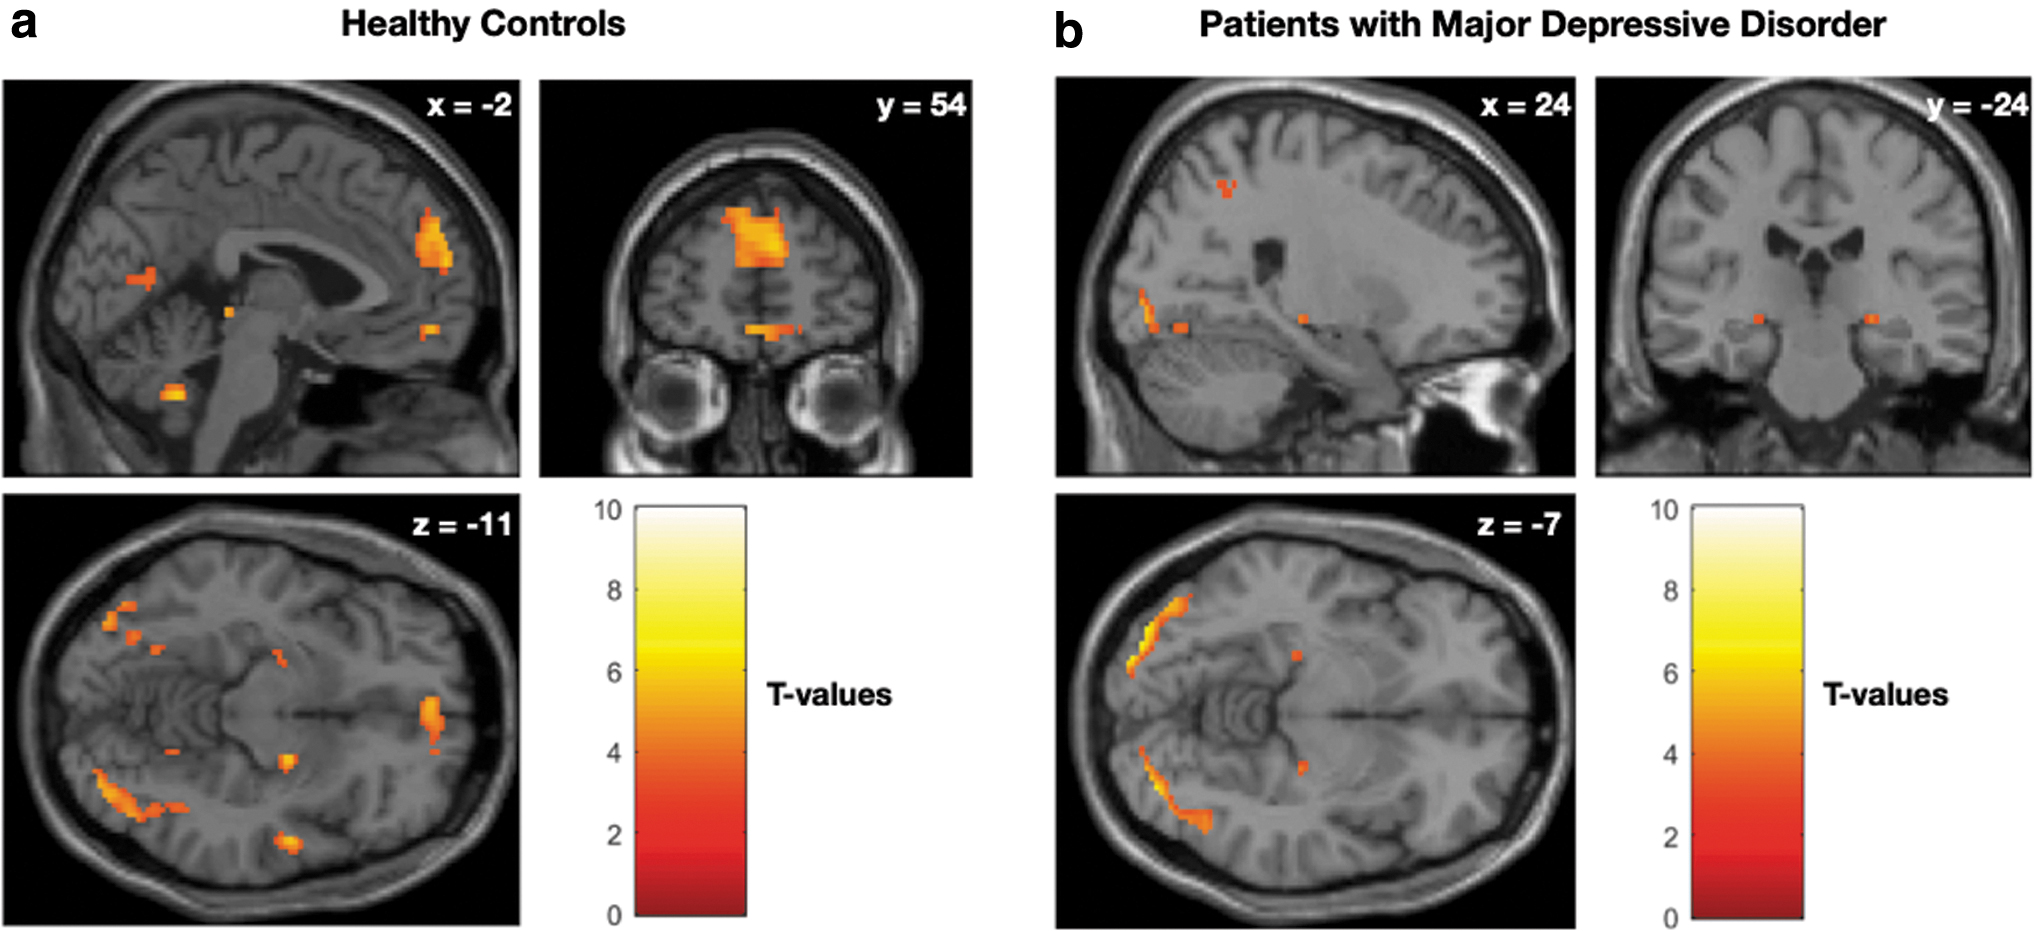
Sectional view of selected brain regions that have significant activations of the contrast (negative emotional > neutral images) in each of the two groups of individuals:
Statistical Parametric Mapping Results for Each of the Two Groups of Individuals: Healthy Controls and Patients with Major Depressive Disorder, Showing Increased Brain Activation in Response to Negative Emotional Versus Neutral Images (i.e., The Contrast of the Main Effect, Negative Emotional > Neutral Images)
The resulting SPM were thresholded at uncorrected p < 0.001. We reported the brain region, the maximum t-value, the corresponding p-value, and the number of voxels in each cluster. The anatomical labels were determined by using xjView toolbox.
Uncorrected p < 0.001.
False discovery rate adjusted p < 0.05.
MNI, Montreal Neurological Institute; OFC, orbitofrontal cortex; PHG, parahippocampal gyrus; SPM, Statistical Parametric Mapping.
Figure 4 shows the regions having significant group differences in activations in response to the negative versus neutral images. The SPMs of the t-statistic were thresholded at uncorrected p < 0.005 with extent size >10 voxels (Lieberman and Cunningham, 2009). The corresponding statistical results are summarized in Table 3.
Group differences in BOLD activation in response to negative versus neutral images. Group effects for responses to the negative versus neutral images were identified by using a two-sample t-test design at the second level to investigate group differences between MDD and HC participants. Statistical parametric maps of the T-statistic were thresholded at uncorrected p < 0.005 with extent size >10 voxels. In terms of the frontal and limbic regions, MDD patients had greater activation of the left PHG but less activation of the bilateral OFC than the HC. These results correspond to the findings of previous studies. Red circles in
Statistical Parametric Mapping Results
Differences of regional activity between MDD patients and healthy subjects on exposure to the negative versus neutral images.
When responses to negative emotional pictures were contrasted with neutral stimuli, significant activations were observed in the pre-specified ROIs; patients with MDD had greater activation of the left PHG (t = 4.38, p = 0.00002), but less activation of the bilateral OFC than those of HC (left: t = 2.93, p = 0.0024; right: t = 3.38, p = 0.0006). The MNI coordinates of the local maxima of the ROIs were: PHG [−24, −30, −14], OFC [−26, −52, −3.5], and V1 [−4, −84, 0]. These regions were used for extracting time series for each subject in a subsequent DCM analysis.
Although a relatively liberal threshold was used for testing significance of regional activation, the main focus of this approach was to constrain the DCM nodes. It is generally accepted that less conservative criteria can be used when brain activations are used for determining DCM nodes (Friston et al., 2003; Ma et al., 2000). However, we addressed the potential limitation of the height threshold used in this study in the Discussion section in detail.
Effective connectivity DCM analysis
The DCM was then fitted to the fMRI-BOLD response. Among the set of DCM parameters, we were primarily interested in the best connectivity model structure for the MDD and HC participants, and the Bayesian parameter average estimates of endogenous and modulatory connectivity changes. Figure 5 shows results of the BMS based on a random-effects analysis for each group. This BMS analysis provided the exceedance probability, which corresponds to the belief that a particular model is more likely than any other model given the group data (Penny et al., 2010). For the HC participants, the best model structure of the 64 tested models was model 64, in which all the connections between V1, OFC, and PHG could be modulated by the negative emotional condition. For the patients with MDD, the best model structure was model 61. Compared with HC, the best fitting model for MDD did not include significantly modulated connections from the V1 to the OFC and from the PHG to the OFC. Using the family-level inference (Penny et al., 2010), we further tested the significance of particular modulatory connections (from the V1 and PHG to the OFC) that may be present in other models of the patients with MDD. Figure 5c and d confirmed that no modulatory connections from the V1 to the OFC and from the PHG to the OFC were the best explanation of the MDD data with exceedance probabilities of 0.99 and 0.72, respectively.
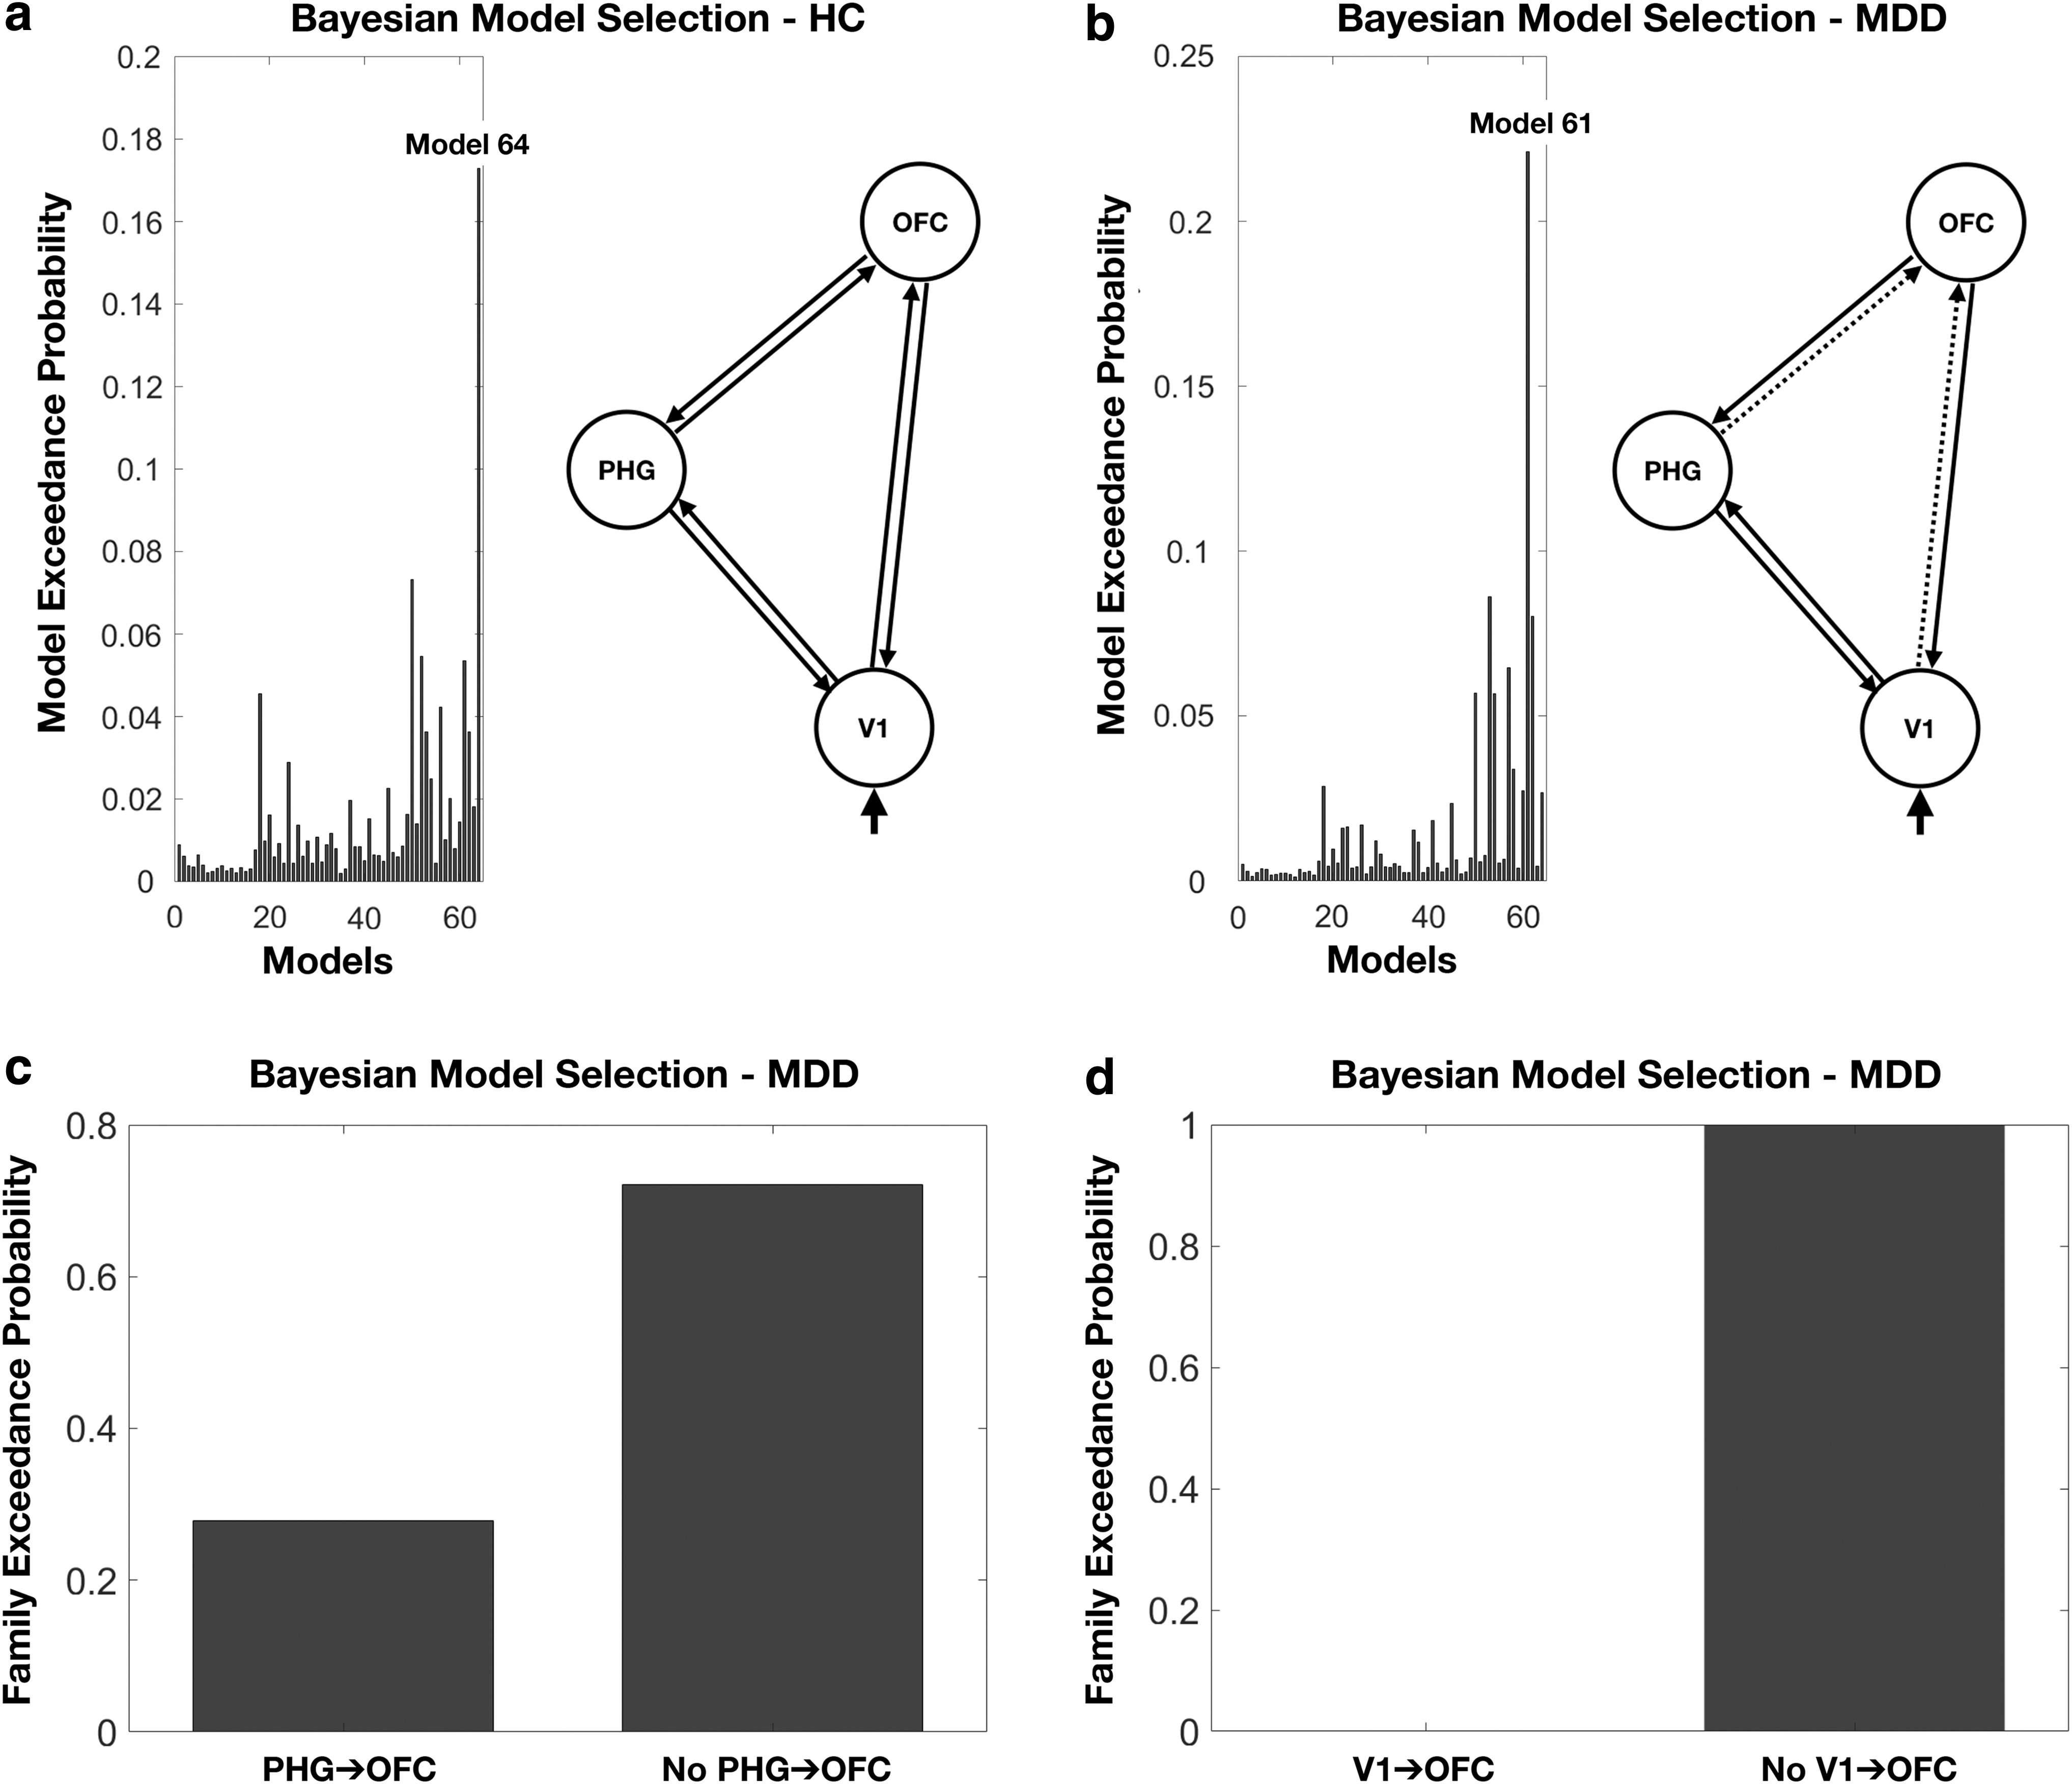
Results of Bayesian model selection based on a random-effects analysis for each group.
Figure 6 shows the posterior mean of the endogenous and condition-specific connectivity changes for the best model structure in the HC and MDD participants. The posterior means of connections that were above the Bayesian significance criterion of p > 0.9 and p > 0.95 were indicated as * and **, respectively. A positive connectivity parameter means that an increase in activity in one region causes an increased rate of change in the activity of another region. A negative connectivity parameter means that increased activity in one region causes a decreased rate of changes in the activity of another region (Friston et al., 2003; Seghier et al., 2010).
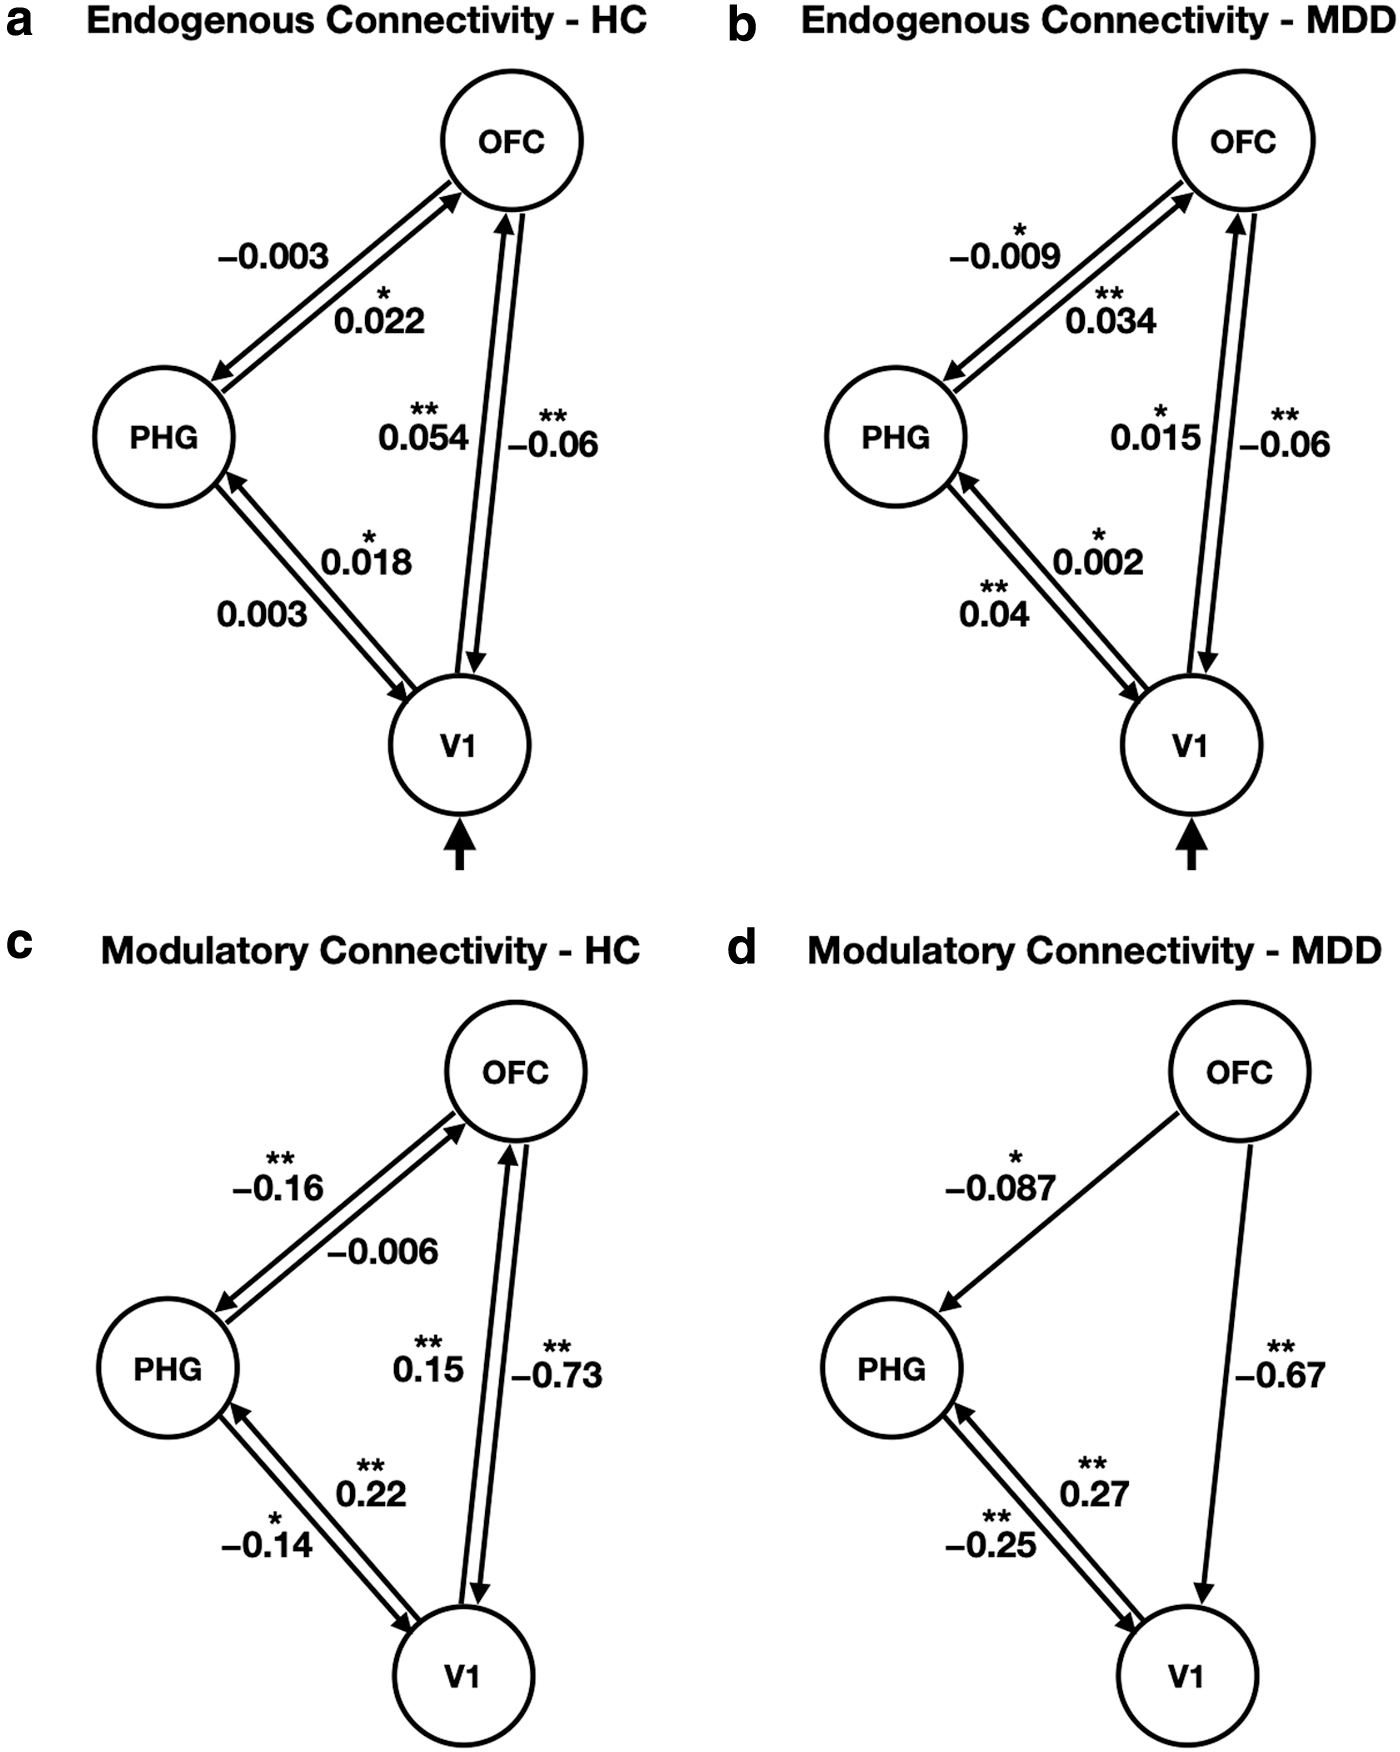
The group-level posterior mean of
In the MDD participants, the strength of endogenous connection from the V1 to the OFC (0.015) was much less than that of the HC (0.054). Moreover, significant modulatory effects on the connection from the V1 to the OFC were not observed in the patients with MDD, whereas the connection of the HC was positively modulated by a value of 0.15 during negative emotional processing. These effective connectivity results explain the hypoactivation of the OFC, which may lead to decreased regulation of emotional response in patients with MDD.
Regarding limbic activity, the MDD participants had increased positive modulation of the PHG from V1 and diminished negative modulation of PHG from OFC during negative emotional processing, compared with HC participants (from the V1 to the PHG, HC: 0.22, MDD: 0.27; from the OFC to the PHG, HC: −0.16, MDD: −0.087). Although opposite patterns of endogenous connections were observed in both groups, the strength of endogenous connections toward the PHG was lower than that of modulatory connections. Therefore, the influence of modulatory connections toward the PHG contributes to hyperactivity of the PHG, which may explain the amplified emotional response in MDD.
Discussion
In this study, we investigated effective connectivity changes in the fronto-limbic circuit in response to negative emotional stimuli, to understand disrupted emotional processing in MDD. The ROIs of the OFC, PHG, and V1 for both MDD and HC were selected empirically. Then, using DCM on 7T fMRI, we found that patients with MDD had no significant modulatory connection from the V1 on the OFC, and they had reduced negative (suppressive) influence from the OFC on the PHG and increased positive effects from the V1 on the PHG, while viewing emotionally negative pictures. These results suggested that disrupted connectivity changes in patients with MDD may contribute to hypoactivation of the OFC and hyperactivation of the PHG regions, which are associated with abnormal regulation and generation of emotional responses, respectively.
Several studies have used DCM on fMRI to explore abnormalities in effective connectivity during the processing of emotions and cognitive tasks in patients with MDD (Almeida et al., 2009b; Davey et al., 2017; Desseilles et al., 2011; Goulden et al., 2012; Musgrove et al., 2015; Schlösser et al., 2008). Overall, studies focused on fronto-cingulate (Schlösser et al., 2008), visuo-attentional (Desseilles et al., 2011), frontotemporal connectivity (Almeida et al., 2009b; Goulden et al., 2012; Musgrove et al., 2015), and default mode network (Davey et al., 2017). However, to our knowledge, this is the first study to use DCM-7T fMRI in investigating fronto-limbic effective connectivity in unmedicated MDD patients, with reduced uncertainty of parameter estimates. In previous studies performed at 7T fMRI, Sladky et al. (2013) showed increased signal changes in ventral brain areas during a facial emotion discrimination task, compared with 3T fMRI. Kraus et al. (2019) found that patients with MDD had higher baseline activity in the pulvinar and medial thalamus during an electrical painful stimulation task, compared with HC and remitted MDD patients. These elevated baseline thalamic activity was reduced as an antidepressant treatment effect. Together with these findings, our study may add the potential benefit of 7T fMRI in DCM studies of emotional tasks, and provide a link between abnormal changes of regional activity and effective connectivity in patients with MDD. The next section will address the conceptual and clinical implications of our findings in more detail.
In this study, SPM analysis showed that MDD participants had decreased activity in the OFC compared with HC. Both functional and structural abnormalities of the OFC have been consistently reported in previous studies (Bremner et al., 2002; Fitzgerald et al., 2008; Keedwell et al., 2005; Lacerda et al., 2004; Sheline et al., 2009). Specifically, several studies have shown that OFC activity levels were significantly decreased in patients with MDD, in response to emotionally negative faces or images (Fitzgerald et al., 2008; Keedwell et al., 2005; Sheline et al., 2009). Reduced gray matter volumes of the OFC have also been observed in patients with MDD (Bremner et al., 2002; Lacerda et al., 2004). The OFC has been associated with the evaluation of the emotional significance of a sensory stimulus and inhibitory control in emotional processing (Dias et al., 1996). Therefore, the reduced OFC activity in patients with MDD may contribute to the attenuated regulation of negative stimuli through effective connectivity.
Regarding limbic regions, our results showed that patients with MDD had greater activation of the PHG than HC in response to negative emotional stimuli. Although the PHG has been traditionally associated with episodic memory and visuospatial processing (Aminoff et al., 2013; Zola-Morgan et al., 1989), it is also involved in emotional processing and reciprocally connected with the amygdala (Stefanacci et al., 1996). Previous findings support this conjecture (Blood et al., 1999; Diener et al., 2012; Groenewold et al., 2013; Koelsch et al., 2006; Lane et al., 1997; Sheline et al., 2009; Stuhrmann et al., 2011; Surguladze et al., 2005). Specifically, unpleasant emotions evoked by either pictures or music have been shown to increase cerebral blood flow (Blood et al., 1999; Lane et al., 1997) and BOLD responses (Koelsch et al., 2006) in the PHG. Moreover, higher activity in the PHG has been observed in patients with MDD (Diener et al., 2012; Groenewold et al., 2013; Sheline et al., 2009; Stuhrmann et al., 2011; Surguladze et al., 2005). Particularly, using a meta-analysis of functional neuroimaging data, Diener et al. (2012) demonstrated that the PHG had hyperresponsivity when negative emotional stimuli were presented to patients with MDD. Therefore, greater activation of the PHG observed in our study is consistent with the findings of previous studies, and it might be associated with amplified (negative) emotional responsiveness in patients with MDD.
This section will address how regional activities in the OFC and the PHG are caused by interactions between these regions and how these connectivity changes are related to the pathophysiology of MDD. First, we found that the endogenous and condition-specific changes in connectivity between the V1 and the OFC were significantly reduced in the MDD participants. The HC had positive endogenous and modulatory connections during negative emotional processing, whereas MDD participants had relatively weak endogenous connections and less significant effects on modulatory connections. These effective connectivity changes in MDD may be associated with anatomical connectivity changes. It has been shown that the OFC receives visual information from the ventral visual pathway, which follows the inferior longitudinal fasciculus (Liao et al., 2013). A meta-analysis of diffusion tensor imaging studies reported that fractional anisotropy of the inferior longitudinal fasciculus was significantly decreased in patients with MDD (Liao et al., 2013). Therefore, reduced positive influence from the V1 to the OFC, in response to negative stimuli, may arise from the impaired anatomical connections of the inferior longitudinal fasciculus. This leads to interruptions in receiving visual information in the OFC. These effects may then contribute to the hypoactivation of the OFC in patients with MDD.
Second, we found that modulatory connections from the OFC and V1 to the PHG differed between MDD and HC participants. The MDD participants had decreased suppressive influence from the OFC to the PHG but had increased effects from the V1 to the PHG during negative emotional processing, compared with the HC. As mentioned earlier, these effects of effective connectivity are linked to the higher regional activity of the PHG region, which explains the higher responsiveness in the patients with MDD for the negative emotional pictures. In particular, the PHG in conjunction with the OFC appears as a critical brain area involved in emotional understanding and expectation of our environment (Aminoff et al., 2013; Gosselin et al., 2006). For example, Gosselin et al. (2006) showed that patients with substantial resections of the PHG had a diminished sensitivity to unpleasant music and had highly abnormal judgments to unpleasant music. Therefore, as a result of disrupted emotional processing, hyperactivation of the PHG in patients with MDD may reflect increased sensitivity to judgment and understanding of negative emotions.
This study has several limitations that need to be addressed. The threshold used for declaring statistical significance of regional activation (uncorrected p < 0.001, p < 0.005 with a 10-voxel extent) was relatively liberal, in comparison to the corrected p-value for multiple comparisons. Although Lieberman and Cunningham (2009) reported simulations demonstrating that uncorrected p < 0.005 with extent size >10 voxels can produce an appropriate balance between Type I (false alarms) and Type II (missing true effects) error rates, a more conservative threshold based on the family-wise error rate would further decrease the likelihood of detecting false positives. 7T fMRI has been known to suffer from an increase in susceptibility-related field inhomogeneities and physiological noises, compared with 3T fMRI (Bandettini et al., 2012; Triantafyllou et al., 2005). However, a recent study mitigated these challenges by using an imaging protocol that provided high spatial resolution (voxel size: 1.5 × 1.5 × 1 mm3) and nuisance regressors for physiological noise correction, and reliably detected significant activation of the amygdala from 7T fMRI (Geissberger et al., 2020). Therefore, for future applications of 7T fMRI-DCM in clinical neuroscience studies, we will focus on improving the spatial resolution (particularly to achieve thinner slices) and incorporating physiological noise components into the current GLM framework.
Another potential limitation of this study was that our ROIs of DCM analysis were restricted to empirically derived regions of the OFC, the PHG, and the V1. The DCM is a framework for fitting state models of neuronal activity to brain imaging data by using Bayesian inference (Friston et al., 2003). In particular, the classical DCM used in this study is restricted to connectivity models composed of a small number of regions to keep model inversion computationally feasible (Friston et al., 2003). Thus, it was difficult to make a large-scale connectivity model for understanding negative emotional processing for patients with MDD. Future work will be required to assess effective connectivity in the whole-brain network of patients with MDD, using regression DCM that allows for fast inference of effective connectivity (Frässle et al., 2017).
The third potential limitation was that we used the same dataset to define and test the ROI for DCM analysis. The main objective in this study was to investigate a link between effective connectivity and abnormal regional activations observed in patients with MDD during negative emotional processing. Therefore, we first identified brain regions whose activities were driven by experimental conditions using SPM analysis. The DCM analysis was then used on the same dataset to test the specific hypothesis regarding effective connectivity. These procedures correspond to the classical DCM analysis used in previous studies (Friston et al., 2003). Nonetheless, a cross-validation scheme such as a leave-one-out scheme would be required to assess the generalizability of the models or to test whether group membership can be accurately recovered (Friston et al., 2016; Schwartenbeck and Friston, 2016). This is beyond the scope of this study, but it will be the focus of our future studies.
Lastly, our study cohort was limited to females aged 20–31 years. There are gender-specific differences in the incidence of MDD. Previous studies (Holsen et al., 2011; Kessler, 2003) have shown that women are twice as likely to develop MDD compared with men. We, therefore, chose all-female subjects group with MDD and healthy participants as controls, to minimize intersubject variability. Nevertheless, the interpretation of the results should be restricted to female subjects, and caution should be exercised when generalizing the results of our study to the general population.
Conclusion
In this study, we showed that in comparison to HC, patients with MDD had hypoactivation in the OFC and hyperactivation in the PHG while viewing negative emotional stimuli. In particular, using DCM on 7T fMRI, we found that these regional changes were associated with attenuated positive effects from V1 to the OFC and reduced suppressive effects from the OFC to the PHG. The increased positive influence from the V1 to the PHG further contributed to hyperactivation in the PHG. Our findings suggest that dysfunction in the fronto-limbic network of the OFC and PHG may contribute to dysregulation of negative emotional processing in depression, leading to amplified emotional responses in patients with MDD.
Footnotes
Authors' Contributions
S.T.: conceptualization, formal analysis, data curation, investigation, writing—original draft, writing—review and editing. S.L.: formal analysis, investigation, writing—original draft, writing—review and editing. C.-A.P.: investigation, data curation, writing—review and editing. E.-N.C.: investigation, data curation, writing—review and editing. J.-W.S.: resources, data curation, writing—review and editing. J.-H.S.: resources, investigation, project administration, writing—original draft, writing—review and editing. C.C.: conceptualization, resources, investigation, project administration, funding acquisition, writing—original draft, writing—review and editing.
Author Disclosure Statement
All authors report no competing financial interests or potential conflicts of interest.
Funding Information
This work is supported by grants from the Korea Basic Science Institute (T38800 and C010300 to C.C. and T38609 to S.T.) and from the National Research Foundation of Korea (2017R1A2B4012546 to C.C.).