
Abstract
Repetitive transcranial magnetic stimulation (rTMS) has been used in experimental protocols to treat mal de debarquement syndrome (MdDS), a neurological condition that represents a maladaptive brain state resulting from entrainment to external oscillating motion. Medical treatments and biomarkers for MdDS remain limited but neuromodulation with rTMS has shown evidence for therapeutic effects. This study took a neuroimaging approach to examine the neuromodulatory effect of rTMS on MdDS. Twenty individuals with MdDS underwent five daily treatments of rTMS over bilateral dorsolateral prefrontal cortex (DLPFC). Participants received 1 Hz over right DLPFC (1200 pulses) followed by 10 Hz over left DLPFC (2000 pulses). Resting state functional magnetic resonance imaging was acquired before and after treatments to determine functional connectivity changes associated with a positive treatment effect. A single-subject-based analysis protocol was developed to capture the degree of resting state functional connectivity (RSFC) between the rTMS target and the entorhinal cortex (EC), an area previously shown to be hypermetabolic in MdDS. Our results showed that rocking motion perception in subjects was modulated by rTMS over the DLPFC. Improvements in symptoms correlated most strongly with a post-rTMS reduction in functional connectivity between the left EC and the precuneus, right inferior parietal lobule, and the contralateral EC, which are part of the posterior default mode network. Positive response to rTMS correlated with higher baseline RSFC between the DLPFC and the EC. Our findings suggest that baseline prefrontal-limbic functional connectivity may serve as a predictor of treatment response to prefrontal stimulation in MdDS and that RSFC may serve as a dynamic biomarker of symptom status.
Introduction
E
Standard clinical structural brain imaging and vestibular function testing are normal in MdDS. However, a previous functional imaging study with fluorodeoxyglucose positron emission tomography showed that the left entorhinal cortex (lEC)–amygdala junction is hypermetabolic in MdDS, which is significant because this region has widespread connectivity with large portions of the neocortex, receiving sensory input from posterior parietal and occipital cortices and being regulated by the prefrontal cortex (Cha, 2012; Coutureau and Di Scalam, 2009; Dickson et al., 2000; Van Hoesen et al., 1972). A theory for the cause for MdDS has been developed that the entorhinal cortex (EC) may be tuned by external neural input; entrainment to persistent oscillating sensory input through vestibular and somatosensory cortices may change the latent activity of the EC (Jacob et al., 2014; Kajiwara et al., 2003). EC neurons have previously been shown to exhibit graded persistent activity that changes in a step-wise rather than continuous manner (Egorov et al., 2002). This suggests that sensory inputs to the EC might allow it to switch, like a toggle, between higher and lower states of synchronization (Dupret and Csicsvari, 2012; Hasselmo et al., 2000; Tahvildari et al., 2007). This is consistent with the clinical behavior of the disorder in which symptoms can quickly shut off over the course of a day but then come back on as quickly. We hypothesized that such synchronization might be directly manipulated by inducing external oscillating input in the form of transcranial magnetic stimulation (TMS), and that the manipulation of neuronal synchronization may correlate with symptom status.
Repetitive TMS (rTMS) has proven to be effective in treating various neurological and neuropsychiatric conditions (Hallett, 2007). TMS induces electrical currents in cortical tissue targeted by the configuration of the stimulation coils. Pulses of stimulation can modulate cortical excitability using either inhibitory low-frequency (≤1 Hz) or facilitatory high-frequency stimulation (≥5 Hz) (Di Lazzaro et al., 2011; Hallett, 2007; Noh et al., 2012). The response to stimulation can be observed not only in local stimulated areas but also in remote sites that are anatomically and/or functionally connected. Moreover, rTMS has proven to be effective in inducing lasting therapeutic effects in disease conditions. One of the first Food and Drug Administration-approved therapeutic indications for rTMS was high-frequency stimulation to the left dorsolateral prefrontal cortex (lDLPFC) for the treatment of medication-resistant depression. It has been hypothesized that dorsolateral prefrontal cortex (DLPFC) rTMS might have distributed effects on deeper limbic regions (George et al., 1995, 1997; Padberg and George, 2009), although combined TMS and neuroimaging studies designed to investigate this hypothesis have produced conflicting results regarding the nature of such effects (George et al., 1999; Knoch et al., 2006; Li et al., 2004; Speer et al., 2000).
Using high-density electroencephalograms (EEGs) and an algorithm developed to quantify electrophysiological functional connectivity with independent component analyses, Ding and associates showed that rTMS of the DLPFC in individuals with MdDS led to symptom improvement, correlating with a reduction in a measure of synchrony called the independent component phase coherence (ICPC) (Ding et al., 2014; Shou et al., 2014). ICPC is a measure of intrinsic functional connectivity calculated within specific frequency bands in EEG data and is a marker of the degree of synchronization between brain regions. Individuals with MdDS who improved with rTMS showed a reduction in global coherence as well as a decrease in ICPC between specific nodes within posterior parietal and occipital lobes (Ding et al., 2014). This was consistent with the theory of the acquisition of MdDS that exposure to oscillating motion sets up a process of abnormal oversynchronization and that a return to a healthy brain state involves reducing abnormal functional connectivity (Cha, 2015). However, it remains unknown whether or how rTMS manipulates the connectivity with maladaptive limbic regions that have been previously shown to be hypermetabolic (Cha, 2012).
Functional magnetic resonance imaging (fMRI) of the brain during rest reveals large-amplitude spontaneous low-frequency (<0.1 Hz) fluctuations that are temporally correlated across functionally related areas (Biswal et al., 1995). These correlations, referred to as resting state functional connectivity (RSFC), yield detailed maps of complex neural systems (Biswal et al., 2010). RSFC has also been suggested as sensitive measurements to reflect neuromodulatory effects (Fox et al., 2012a; Yuan et al., 2014). Thus, the rationale for this study was to determine whether functional connectivity with the EC increases or decreases as a function of symptom improvement after brain stimulation in MdDS. Second, if these functional connectivity measures are relevant to symptom change, there may also be baseline functional connectivity markers that might predict response to brain stimulation. This study builds on prior work using rTMS to induce symptom changes in MdDS by targeting DLPFC (Cha et al., 2013, 2016; Ding et al., 2014) but also includes pre- and post-rTMS functional imaging to assess RSFC changes as a result of treatment response.
Materials and Methods
Informed consent
Study procedures were completed according to Declaration of Helsinki guidelines and approved through Western IRB (
Inclusion and exclusion criteria
Criteria for inclusion were the following: (1) chronic perception of rocking vertigo that started within 2 days after disembarking from water, air, or land-based travel, (2) symptoms lasting at least 6 months, (3) no other cause for symptoms after evaluation by a neurologist or otolaryngologist with appropriate testing for peripheral inner ear or other central nervous system causes for symptoms. Exclusion criteria include the following: (1) an unstable medical or psychiatric condition, including a history of bipolar disorder or psychosis, (2) pregnant or planning to become pregnant during the course of the study, (3) contraindications to receiving rTMS or MRI, including medications known to reduce seizure threshold, (4) an unclear history of the onset of symptoms, and (5) an inability to complete all study-related testing.
Participant characteristics
Twenty right-handed individuals with MdDS started and completed all 5 days of the protocol. Although the study was open to either gender, only female participants volunteered for the study. This was consistent with the much higher female than male prevalence in MdDS (Cha, 2012). The mean age at the time of the study was 52.9 ± 12.6 years, median of 56.5 years, and a range of 28–68 years. The duration of illness had a mean of 35.2 ± 24.2 months, median 30 months, and a range of 8–96 months. Motion exposures preceding the onset of MdDS included ocean/sea travel in 11, air travel in 4, and land-based (car or train) travel in 5.
Magnetic resonance imaging
Functional and structural magnetic resonance images were collected using a General Electric Discovery MR750 whole-body 3-Tesla MRI scanner (GE Healthcare, Milwaukee, WI). A brain-dedicated receive-only 32-element coil array (Nova Medical, Inc., Wilmington, MA), optimized for parallel imaging, was used for MRI signal reception. A single-shot gradient-recalled echo-planar imaging (EPI) sequence with sensitivity encoding depicting blood-oxygenation-level-dependent (BOLD) contrast was used for functional scans. The following EPI parameters were used: field of view/slice/gap = 220/3.0/0 mm, axial slices per volume = 42, acquisition matrix = 64 × 64, repetition/echo time = 2000/30 msec, acceleration factor R = 2 in the phase encoding (anterior–posterior) direction, flip angle = 90
Repetitive transcranial magnetic stimulation
Each participant underwent five sessions of rTMS on consecutive days, typically at the same time each day. The Localite TMS Navigator (Localite GmBH, Germany) frameless stereotaxy system was used for neuronavigation to identify the center of the DLPFC as the anterior portion of the middle of the middle frontal gyrus. rTMS was performed with the Magventure MagPro X100 stimulator with a cooled figure-of-eight coil in biphasic mode and the handle back at a 45° angle relative to the midsagittal plane. Motor thresholds (MTs) were determined each day with independent measurements made for the hand areas in both right and left primary motor cortices before each treatment session. Each motor hand area (the “hand knob”) was identified with subject-specific neuronavigation. MTs were defined as the percentage intensity of the stimulator output that generated a 50 μV motor evoked potential in the contralateral abductor pollicis brevis muscle in 5 out of 10 trials. rTMS sessions consisted of 1 Hz right DLPFC (rDLPFC) stimulation at 110% of MT for 1200 pulses followed by 10 Hz lDLPFC stimulation at 110% MT for 2000 pulses. The right MT was used for the rDLPFC treatment and the left MT was used for the lDLPFC treatment. The 10 Hz protocol was administered as trains of 40 pulses over 4 sec followed by 26 sec of rest. The slightly lower intensity of 110% compared with standard 120% MT intensity was used to accommodate participant tolerability.
Symptom measures
The participants rated their symptom change on a visual analogue scale (VAS) of 0–100, in which 0 represented a symptom-free state and 100 represented rocking vertigo so severe that they could not ambulate. Study procedures occurred over a 5-day period with fMRI performed on day 1 and day 5 with the rTMS sessions scheduled in between. The change of the VAS score from day 1 to day 5 was calculated with a minimum change of 10 points on the scale required for significance. The minimum 10-point criterion was chosen because it best correlated with the participants' own perceptions of whether their symptoms had changed. Participants whose symptoms decreased by 10 points or more were considered to be positive responders (improved), those whose scores increased by 10 points or more were considered to be negative responders (worsened), and those with scores in-between were considered to be neutral.
Resting state fMRI data analysis
The fMRI data preprocessing was performed using AFNIs (analysis of functional neuroimages). The fMRI data of each subject were spatially coregistered to high-resolution anatomical images, and the first five volumes of each run were excluded from analysis to allow the BOLD signal to reach steady state. Major processing steps included respiration- and pulse-associated noise reduction using RETROICOR (Glover et al., 2000), slice timing and rigid-body motion correction, spatial smoothing with a Gaussian kernel (Full Width Half Maximum = 6 mm), and temporal filtering with a band-pass filter (0.005–0.1 Hz). In addition, the low-frequency changes in respiration volume (Birn et al., 2006), six affine motion parameters, signal from a ventricular region of interest (ROI), and signal from a region centered in the white matter were regressed out from the data set. Data points of excessive motion (root mean square of displacement in three dimensions is larger than 0.3 mm) were excluded from regression and correlation analysis using the censoring option were implemented in AFNIs
RSFC was computed as Pearson's correlation with regard to a seed region (Biswal et al., 1995). Two anatomical regions were investigated, the EC and the stimulated site within the DLPFC, both identified in individuals' anatomical images. We only examined the RSFC seeded in the lEC or rEC. Coordinates of individual EC locations were manually determined on high-solution structural MR images acquired in the coronal plane using anatomical guidelines by Insausti and associates (1998). The seed region of EC was a 2.5-mm-radius sphere centered at the lEC and rEC in each individual's anatomical space, medial to the collateral sulcus, and lateral to the amygdala in the coronal plane. Each ROI was examined to ensure that none of the EC seeds contained any voxels overlapping with the subarachnoid space. Coordinates for the ROIs for each DLPFC (right and left) that were stimulated were determined in individuals' anatomical space according to the Localite navigation system used during treatment. The DLPFC ROIs were a 7-mm-radii centered in the anterior portion of the middle of the middle frontal gyrus for each hemisphere. DLPFC ROIs were further masked in conjunction with the cortical areas. Correlation maps were produced by extracting the preprocessed BOLD time courses from the seed region, averaging the signals from within the seed region, then computing the correlation coefficients between the seed time course and the time course from all other brain voxels. Correlation maps were computed in single-subject-based space and then converted to normalized space for group-level analysis.
For statistical tests and group analyses, correlation coefficients were converted to a normal distribution by Fisher's z transform. These values were converted to z scores (i.e., zero mean, unit variance, Gaussian distributions) by dividing the Fisher-transformed correlation coefficient by the square root of the variance, that is, 1/sqrt (n − 3), in which n is the degree of freedom in the measurements. The degrees of freedom were corrected for the temporal dependence across consecutive time points (Fox et al., 2005). Individuals' structural anatomical images were spatially coregistered to the Talairach and Tournoux (1988) template brain with aid of the Advanced Normalization Tools (
RSFC correlation with symptom response
We next determined whether there is a correlation between clinical response and whole-brain functional connectivity changes to the EC. Specifically, the individual pre-TMS z-score maps were subtracted from the post-TMS z-score maps and whole-brain analysis was performed to test whether post-versus-pre connectivity changes differed in accordance with individual symptom changes measured by VAS scores. First, the participants were categorized, based on VAS score changes, into positive (reduced at least 10 points), neutral (less than 10 points), and negative groups (increased at least 10 points). This categorization was based on the consideration that the VAS scores are subjective reflections of participants' symptoms and their values may not follow a Gaussian distribution. Thus, the connectivity changes were compared according to their categorized responses (positive: 1, neutral: 0, and negative: −1) in a general linear model, instead of being compared with the VAS values as a continuous variable. The significance criterion for detecting activation was set at p corrected <0.05, which was determined using the AFNI program 3dClustSim (cluster size >30 voxels, thresholded at the voxel level at p < 0.005). Positive activation indicated that effective reduction of symptoms is associated with a decrease of RSFC and that exacerbation of symptoms is associated with an increase of RSFC. Individual connectivity scores were also extracted from the activation regions and averaged according to their response categorization.
RSFC prediction of treatment response
Considering that our current stimulation protocol targeted DLPFC, our next analysis was to determine whether the RSFC between the stimulated sites and the EC could predict treatment response. Thus, in the prediction analyses, we examined only the RSFC in the pretreatment baseline data. Our rationale was that the therapeutic effect induced by stimulation might modify the functional connectivity between DLFPC and the EC, given prior connectivity and metabolic differences between these areas in individuals with MdDS compared with controls (Cha et al., 2012). Thus, we examined whether the pretreatment connectivity between DLPFC and the EC was related to the responses among all participants. DLPFC targets were identified in individual anatomical space on the first day of treatment and were consistently used for repeated stimulation for all 5 days. With seeds in the lEC and rEC, the connectivity with the ipsilateral DLPFC ROIs was averaged. Since study participants received bilateral TMS (inhibitory stimulation of the rDLPFC and excitatory stimulation at the lDLPFC) with the goal of manipulating DLPFC–EC connectivity (by allowing release of interhemispheric inhibition from the ipsilateral side), the separate unilateral RSFC measurements between DLPFC and EC (rDLPFC–rEC, lDLPFC–lEC, rDLPFC–lEC, and lDLPFC–rEC) were explored. The DLPFC–EC connectivity measurements from the pre-TMS data were compared with the symptom responses using linear regression. Furthermore, we tested whether in any of the responder groups, the pre-TMS baseline connectivity was significantly different from 0.
Results
Twenty individuals completed the study with no dropouts. Although headache was the most common side effect reported, no subject had to stop stimulation because of headache. One subject who had a history of migraine headaches developed a migraine headache after one session but was able to avoid further headaches by taking prophylactic ibuprofen. Changes in the magnitude of rocking dizziness from day 1 to day 5 are depicted in Figure 1. Among the 20 participants, 6 improved by 10 points or more (positive responders), 6 worsened by 10 points or more (negative responders), and 8 remained unchanged (neutral responders). Although the overall magnitude of change in symptoms was greater for improvement than for worsening, for the purposes of analyses, we treated the data as categorical variables in subsequent regression analyses.
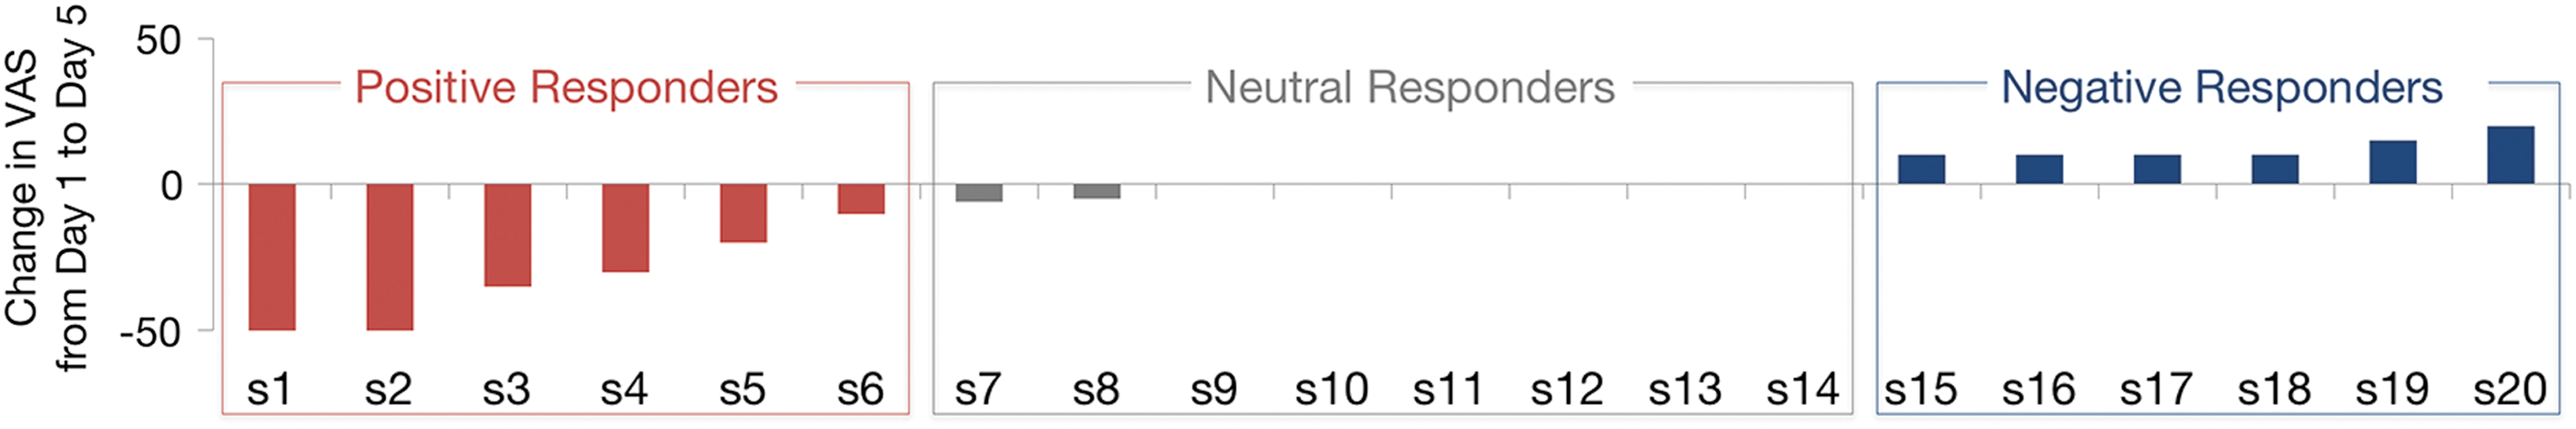
VAS changes from day 1 to day 5 of treatment. Spread of responses to rTMS on a 0–100 VAS. Subjects S1–S6 represent positive responders whose symptoms decreased with rTMS; S7–S14 showed no response; S15–S20 worsened with treatment. rTMS, repetitive transcranial magnetic stimulation; VAS, visual analogue scale. Color images available online at
We further tested the hypothesis of whether the post-versus-pre connectivity changes were related to the symptom outcomes. Whole-brain analysis of RSFC to the lEC showed that connectivity between this region and the rEC, the right inferior parietal lobule, and the left precuneus was significantly modulated by rTMS over DLPFC (Fig. 2). These regions comprise the posterior default mode network.
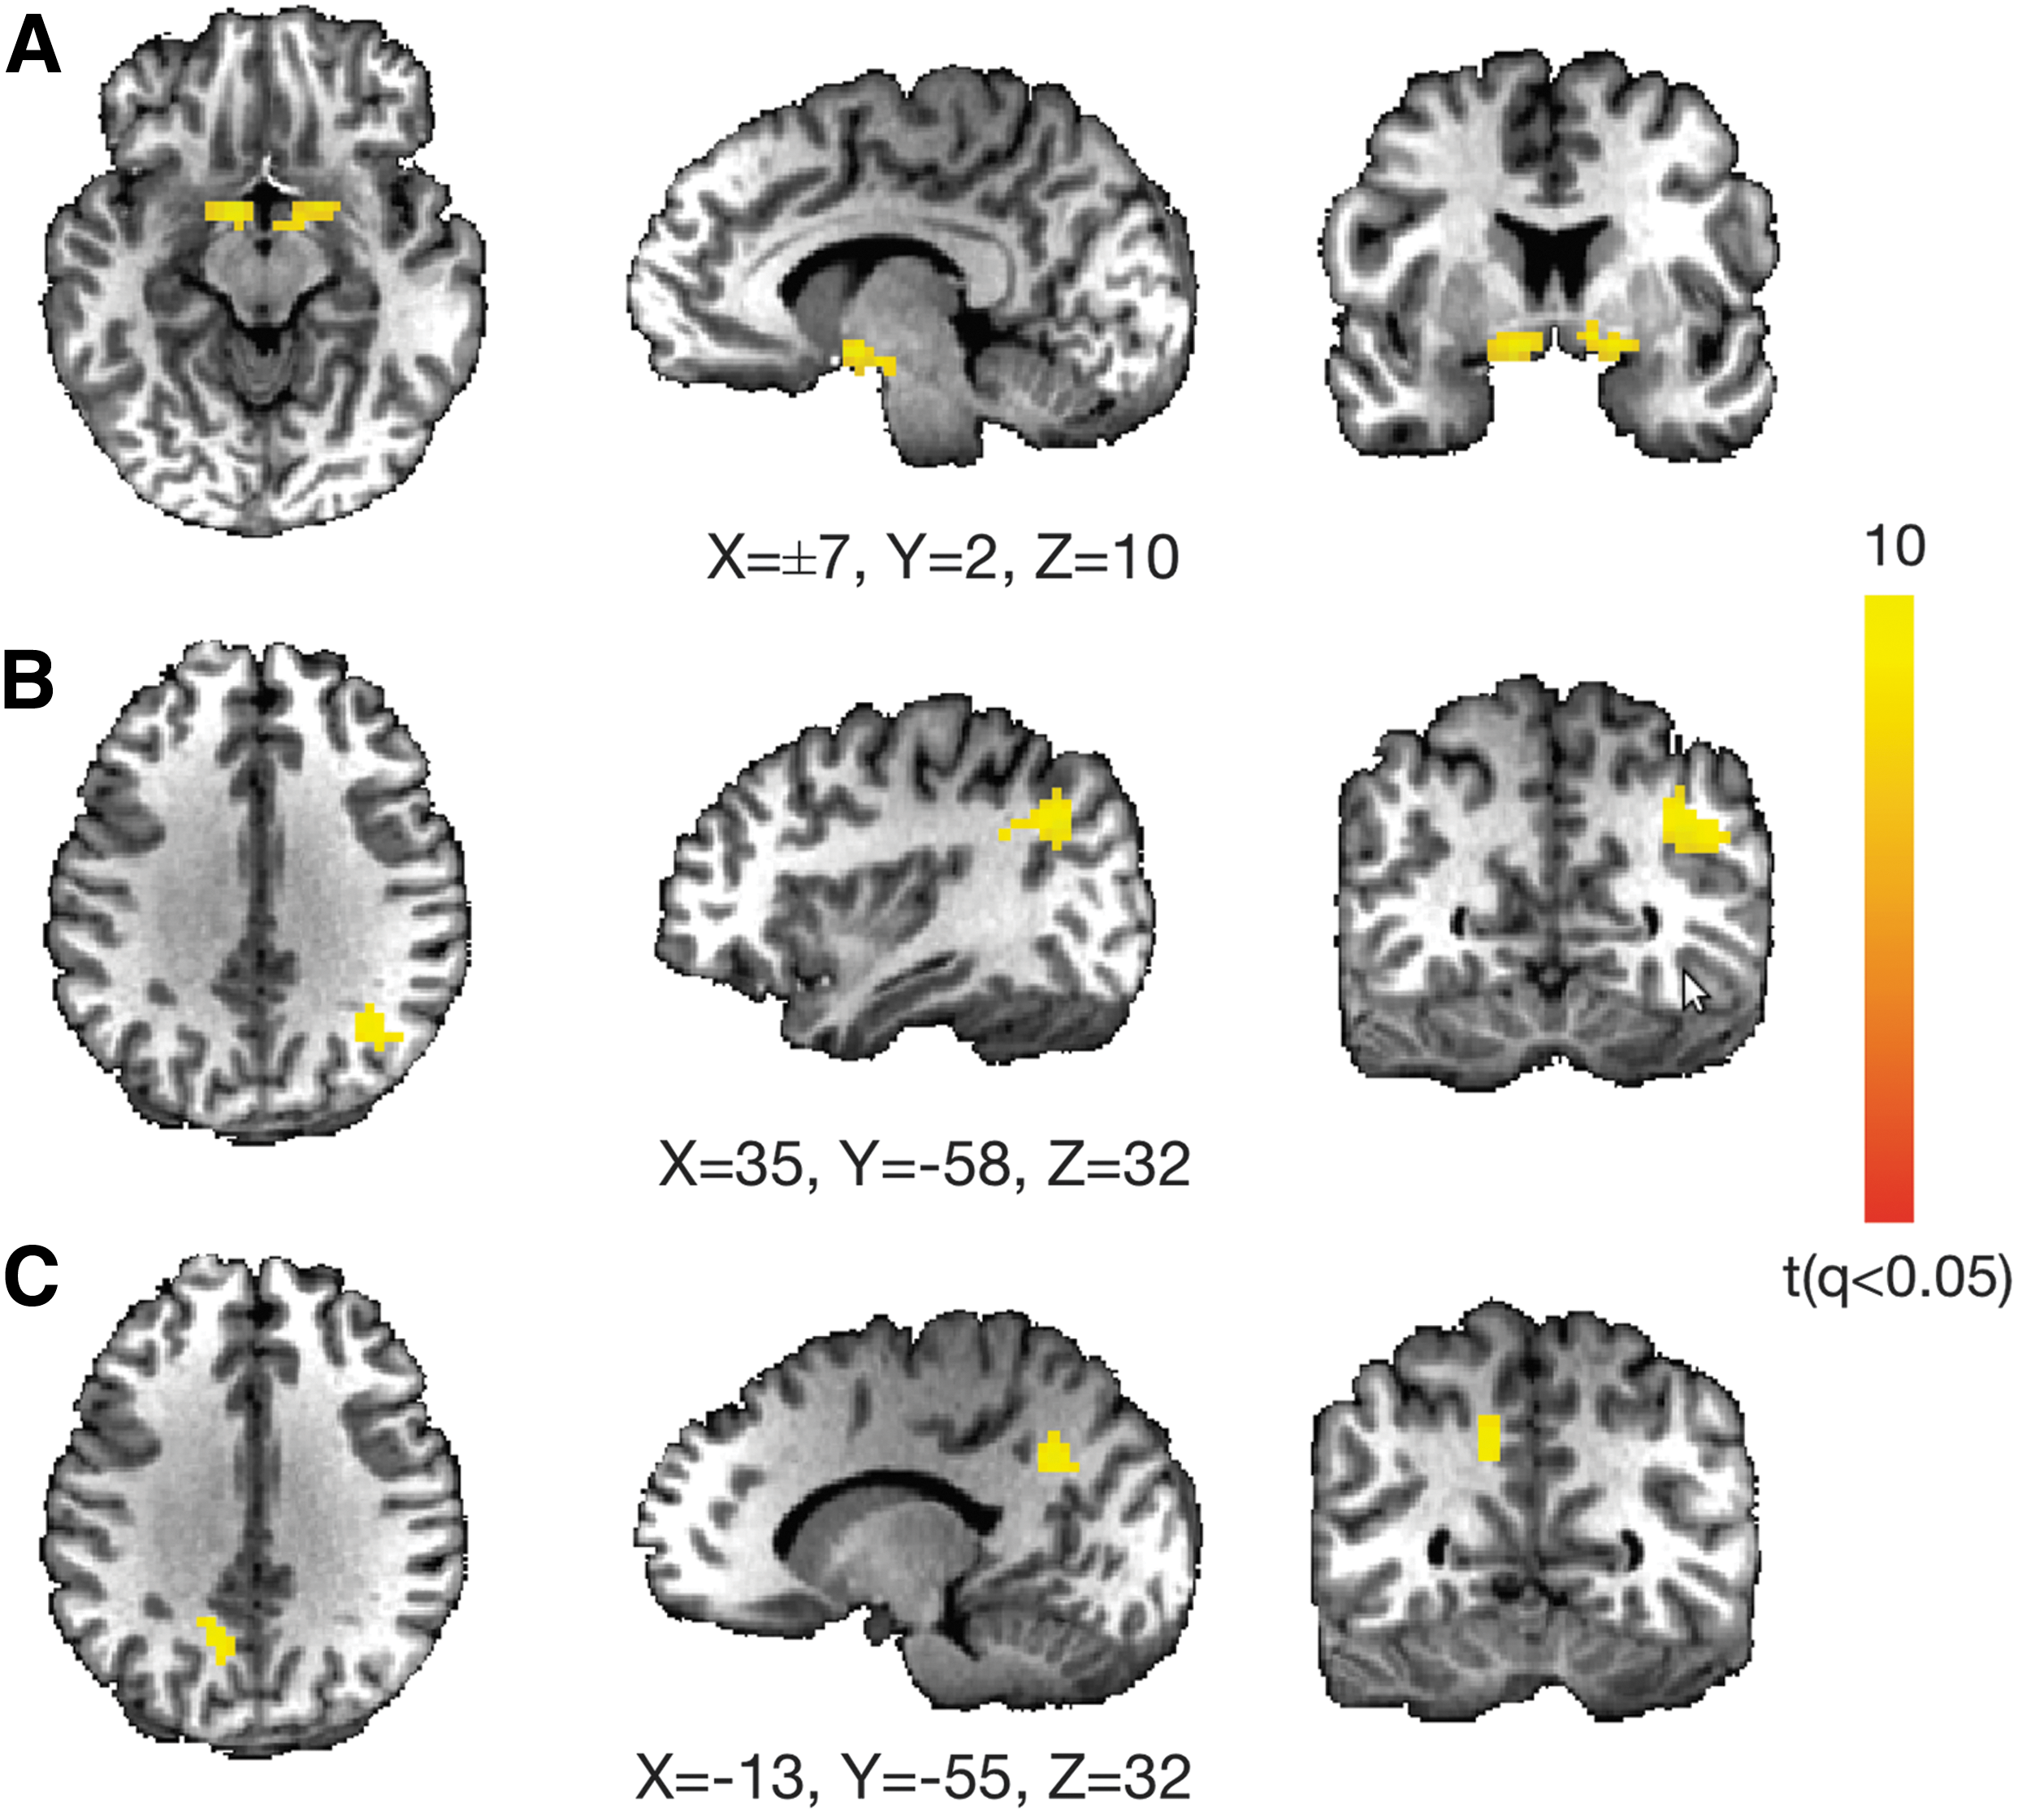
Connectivity changes before and after rTMS are related to symptom changes in MdDS patients. Whole-brain analysis showing brain areas in which functional connectivity to the lEC changes as a function of symptom change after rTMS. The main dynamic areas are
To determine the directionality of the effects of rTMS on RSFC, we extracted the connectivity scores in the activation regions (Fig. 2), and examined the connectivity changes averaged by response categorization. Specifically, individuals who responded positively to treatment and had symptom reduction exhibited a decrease in functional connectivity between these nodes and the EC, whereas those with no response or worsened symptoms showed an increase in connectivity, showing a directional relationship between functional connectivity and symptoms (Fig. 3). In the region of the right inferior parietal lobule, the group of positive responders showed a significant decrease of connectivity with the lEC (p = 0.04, two-sided t test). However, a significant increase in connectivity was observed in the group of negative (p = 0.007, two-sided t test) and neutral responders (p = 0.02, two-sided t test) with the precuneus.
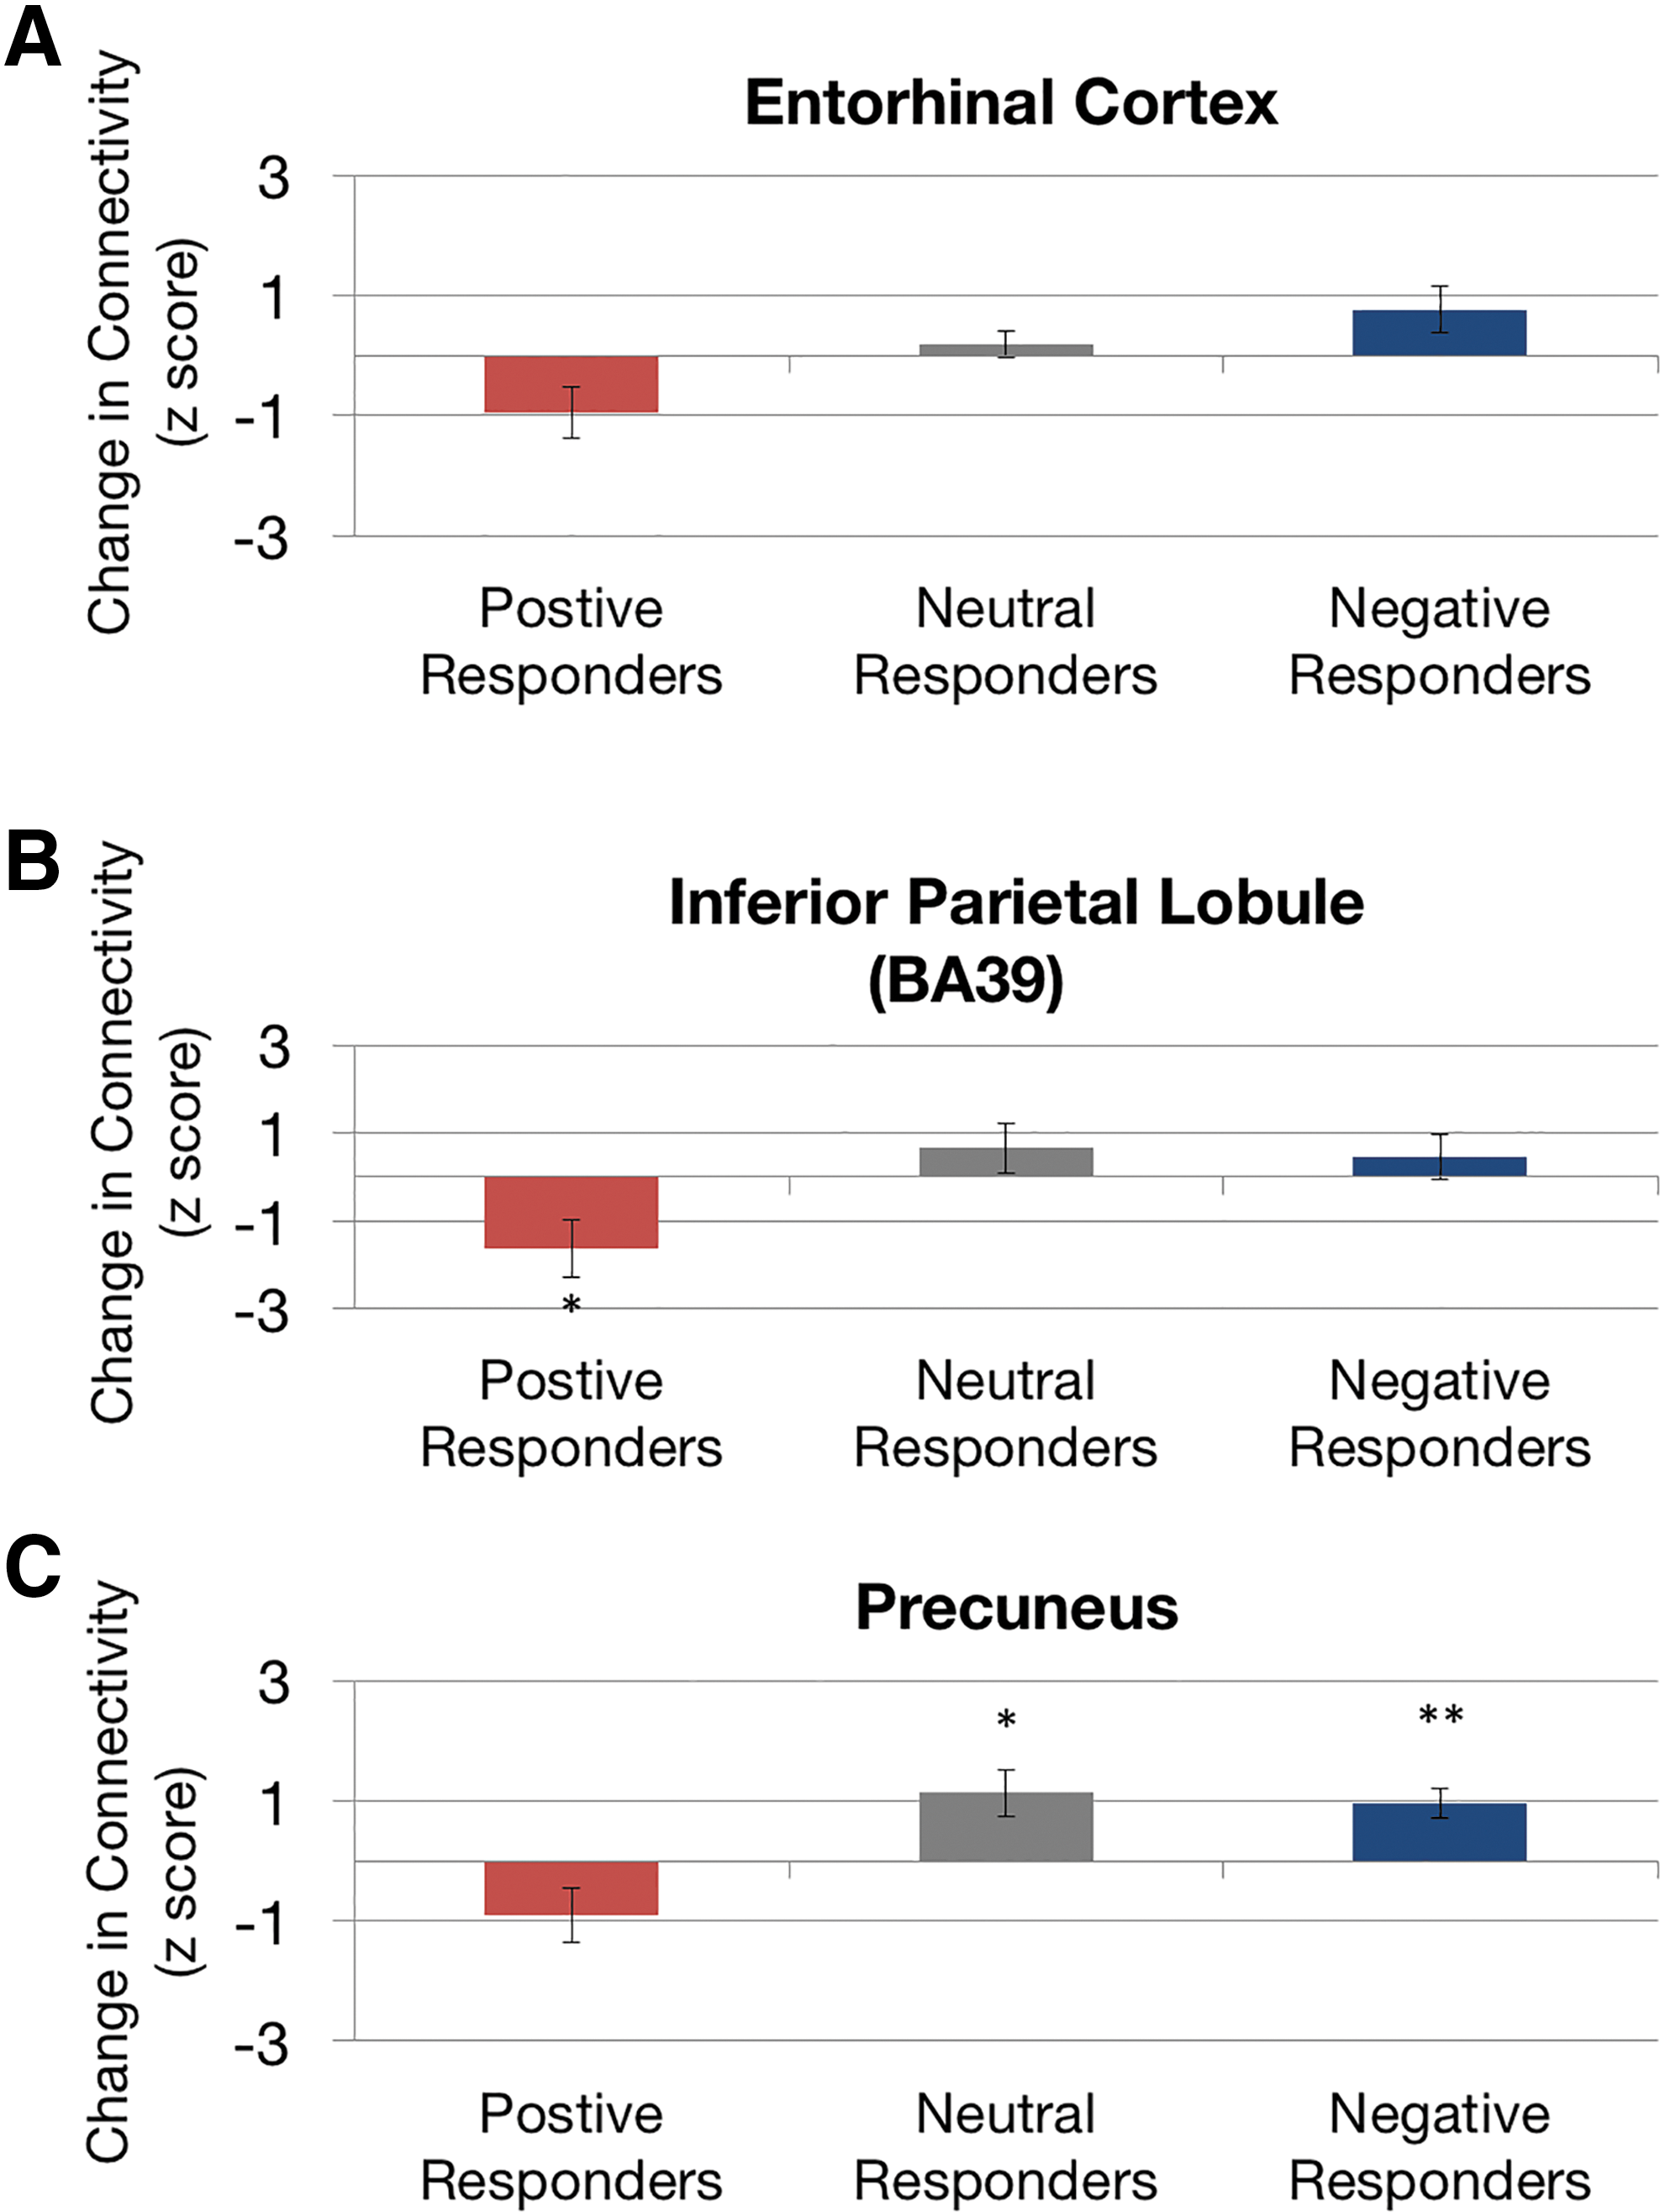
Directional effect of functional connectivity changes relative to symptom change. Within regions that showed dynamic functional connectivity changes with the lEC [
Pre-rTMS connectivity was then examined to determine how the baseline connectivity between the DLPFC targets and the EC could predict treatment response after rTMS. Figure 4A shows the extent of overlap of the DLPFC ROIs after alignment of all individual DLPFCs into normalized space. Note that there only exists a moderate level of overlap among individuals once the DLPFC was transformed into the standard space. Functional connectivity between DLPFC and EC was calculated from individual ROIs for each region. Baseline functional connectivity between rDLPFC and rEC (r = −0.65, p = 0.002) as well as lDLPFC and lEC (r = −0.57, p = 0.008) was found to be significantly correlated with symptom reductions after rTMS as shown in Figure 4B. Other unilateral connectivities between DLPFC and EC (lDLPFC–rEC, rDLPFC–lEC) were examined separately and all showed a significant negative correlation with symptom changes after rTMS (all p < 0.01, r ≤ −0.57, Supplementary Fig. S1; Supplementary Data are available online at
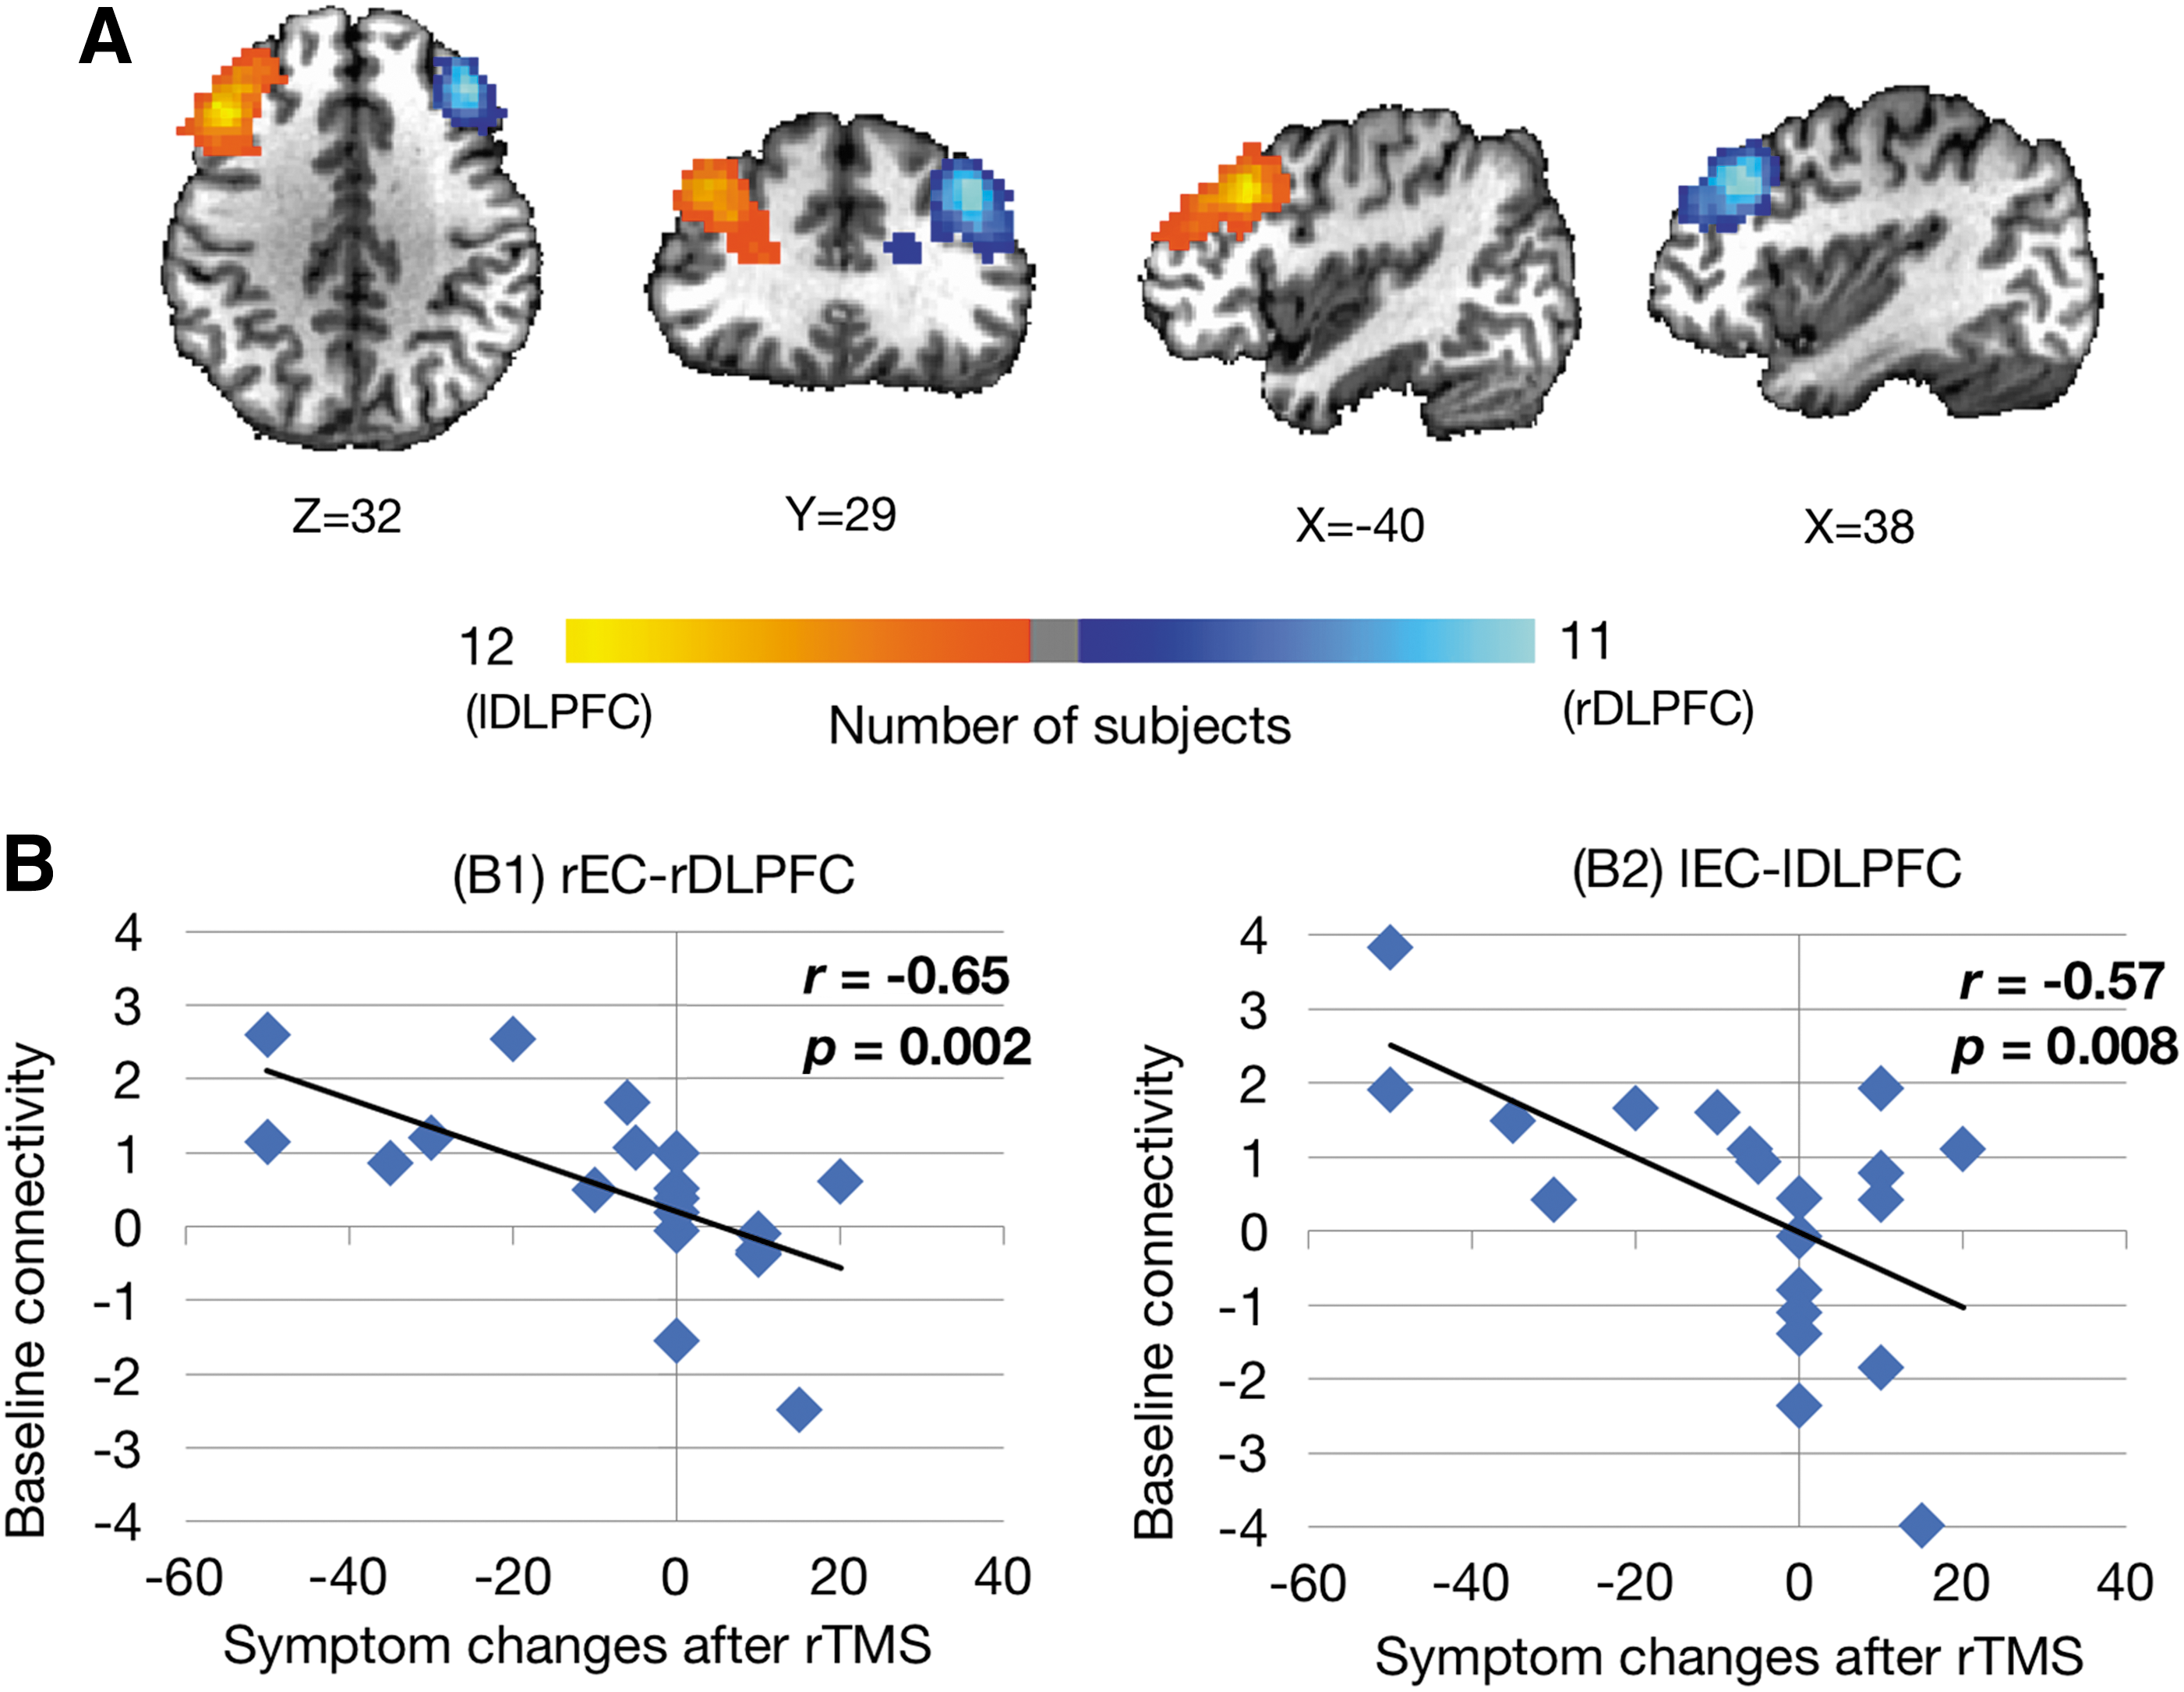
Correlation between baseline EC–DLPFC functional connectivity and treatment response.
Furthermore, we tested whether in any of the responder group the pre-TMS baseline connectivity was significantly different from 0. Our results indicated that only in the group of positive responders was baseline connectivity found to be significantly positive (two-sided t test: p = 0.002 for the rDLPFC–rEC connectivity, p = 0.002 for the lDLPFC–lEC connectivity, p = 0.02 for lDPFC–rEC connectivity, but p > 0.05 for rDPFC–lEC connectivity), indicating that positive (higher) baseline functional connectivity was associated with effective treatment.
Discussion
Our study has shown that noninvasive brain stimulation with rTMS over DLPFC can be used as a therapeutic tool to alter the perception of self-motion in MdDS. This intervention yielded therapeutic changes that have an RSFC signature. Specifically, improvement in symptom severity was correlated with a reduction in RSFC between the posterior default mode network regions and the EC, an area previously determined to be hypermetabolic in MdDS (Cha et al., 2012). In addition, treatment responses could be predicted to some degree by baseline RSFC between the stimulated area and the EC.
The protocol implemented in the study combined both 1 Hz rDLPFC and 10 Hz lDLPFC stimulation with an initial expectation that clinical improvement would be attributed to the DLPFC–EC–RSFC. Both protocols had been used separately in pilot studies with both showing the potential to induce therapeutic responses (Cha et al., 2013, 2016). As left prefrontal EC RSFC was shown to be lower in MdDS than in healthy controls (Cha et al., 2012), we tested the hypothesis that DLPFC stimulation might normalize any baseline connectivity deficits. Instead, we determined that DLPFC stimulation did not lead to increased connectivity between DLPFC and EC, but that DLPFC stimulation lead to decreased connectivity between posterior default mode network and the EC, likely through another pathway. This finding was consistent with our previous data showing that MdDS is also associated with elevated posterior parietal and occipital RSFC to EC compared with healthy controls (Cha et al., 2012), suggesting that rTMS intervenes by normalizing the maladaptive hyperconnectivity.
The fMRI connectivity results of our current investigation are related to our previous investigations using EEG, which both reported a reduction of synchrony in posterior occipital and parietal areas (Ding et.al 2014). In our previous study, a decrease in post-rTMS synchrony (i.e., reduction in ICPC) in the theta and alpha frequency bands was observed as a function of symptom improvement (Ding et al., 2014). Nodes with reduced synchrony (as reflected by EEG) resided over the precuneus and correlated with our finding of precuneus-EC functional connectivity reductions related to symptom improvement. The finding that TMS modulates connectivity between the target site and distal areas is corroborated in other studies that used EEG (Chen et al., 2003; Oliviero et al., 2003). The coupled changes of EEG synchrony and fMRI network are also consistent with the findings of direct coupling relationship between resting state EEG and BOLD fMRI signals (Mantini et al., 2007; Yuan et al., 2012, 2013).
The EC, as part of the hippocampal formation, has been recognized as an integral part of the default mode network. In the resting state, the spontaneous activity of entorhinal cortical neurons is coherently connected to other core regions within the default mode network, that is, posterior cingulate gyrus and precuneus, the inferior parietal lobule, ventral medial prefrontal cortex, dorsal medial prefrontal cortex, and lateral temporal cortex (Valenti and Grace, 2009; Van Hoesen et al., 1972). The EC has been shown to generate sustained activity in the absence of continuous neocortical input, making it a biologically plausible nidus for the generation of persistent abnormal motion perception (Dupret and Csicsvari, 2012; Hahn et al., 2012). The medial EC is spatially tuned and receives information from large regions of the neocortex, particularly the somatosensory association cortex, and is the main gateway of neocortical information entering the hippocampus (Coutureau and Di Scala, 2009; Jones and Powell, 1970; Van Hoesen et al., 1972).
Our study is related to other rTMS studies for the indication of major depression, since we employed a common DLPFC stimulation protocol used in an off-label manner. Recent neuroimaging studies suggest that the neuromodulatory effect of rTMS is related to the manipulation of RSFC, which characterizes the resting state synchrony between two discrete regions. The RSFC in response to focal rTMS stimulation has been found in a largely distributed manner. For example, in a population of depressed individuals studied by Liston and associates (2014), stronger clinical responses (reduction of symptoms) were found to be correlated with a reduction of connectivity between the subgenual anterior cingulate cortex (sgACC) and the default mode network. The RSFC before rTMS treatment was found to be abnormally elevated between the sgACC and the default mode network. Interestingly, patients with higher baseline connectivity between sgACC and the default mode network were also those stronger responders to rTMS. Thus, it was suggested that the therapeutic mechanism of rTMS was to effectively normalize functional connectivity. The finding that TMS acts by modulating functional connectivity within cortical networks is corroborated by studies employing rTMS in depression (Kozel et al., 2011), essential tremor (Popa et al., 2013), stroke (Volz et al., 2016), and other behavior modification (Li et al., 2017). Our findings are consistent with these studies such that in MdDS, reduction of symptoms after rTMS treatment was associated with a decrease of RSFC, particularly between the EC and the default mode network.
In addition, we found that baseline RSFC is an important predictor of rTMS response, as higher baseline connectivity was found to predict subsequent clinical improvement. Nevertheless, the nature of connectivity patterns pertinent to the rTMS stimulation site in general has been elusive, ranging from positive correlations to negative correlations. In the study by Liston and associates (2014), positive baseline connectivity between sgACC and a central executive network (containing the stimulation site) was found to be predictive of effective treatment. In biotyping depression according to functional connectivity patterns, individuals with higher RSFC between dorsomedial prefrontal cortex, amygdala, DLPFC, bilateral orbitofrontal cortex, and posterior cingulate cortex responded significantly better to rTMS (82.5% vs. 25%) than those with lower connectivity (Downar et al., 2014; Drysdale et al., 2017).
However, another study by Fox and associates (2012b) examined the RSFC with respect to direct DLPFC targets in different targeting schemes that were previously reported to reflect differences in clinical efficacy. The connectivity results revealed that DLPFC rTMS sites with better clinical efficacy were more negatively correlated (anticorrelated) with the subgenual cingulate. In addition, even though the lDLPFC exhibits rich connections to many cortical and subcortical regions, including positive correlations with several key regions of the default model network (Fox et al., 2012b), baseline connectivity with regard to the DLPFC simulation site alone is not predictive of treatment (Liston et al., 2014).
In a similar manner, our current study also investigated whether the pre-TMS baseline RSFC was related to clinical response. A significant predictive effect was found for the pre-rTMS RSFC across individuals. Interestingly, the results were consistent with depression studies in showing that baseline RSFC may predict rTMS treatment response. In Liston and associates (2014), positive, higher baseline connectivity between the rTMS-targeted area (lDLPFC) and the intended network (default mode network) was associated with stronger responders. Similarly, in our study, positive baseline connectivity between the rTMS targets (DLPFC in the off-label usage) and the intended target (EC, also considered part of the default model network) was found to be associated with a positive response, that is, greater presimulation connectivity was associated with greater responses.
A limitation to our study is that we did not have a sham rTMS arm of the study. However, by using response to rTMS as a categorical variable, we were able to use nonresponders and individuals who worsened after rTMS as a control group to determine whether there was a directional relationship between symptom change and RSFC, that is, if symptoms went up with one functional change, it should go down with the opposite change. We determined that individuals whose symptoms improved had a greater magnitude of symptom change than individuals who showed no effect, however. Moreover, the functional connectivity patterns in the responder group were distinct from those in the neutral and negative responder groups in that they had significantly higher baseline connectivity between DLPFC and the EC than in either of the other groups.
MdDS is a natural model of environmental entrainment effects on the human brain, which by all measures to date have been consistent with an oversynchronization of neural networks. That a chronic symptom can be switched off with noninvasive brain stimulation, and often with very limited amounts of exposure, is support for aberrant functional connectivity, itself being the basis of clinical symptoms. Our program of study has used both EEG and fMRI RSFC biomarkers to both measure and predict treatment response. We hope that this study will contribute to the growing body of literature that supports the use of these functional neuroimaging tools to enhance treatment of human functional brain disorders. Our recent work (Yuan et al., 2016) has shown that electrophysiological networks, including the default mode node work, can be reconstructed from EEG data alone, which also resemble those fMRI network counterparts in terms of spatial patterns as well as temporal dynamics. The capability of imaging resting state network connectivity in multimodal data opens new avenues of integrating neuroimaging and neuromodulation.
Conclusion
This study shows that persistent feelings of self-motion triggered by entrainment to an external oscillating environment causing the clinical syndrome of MdDS can be reduced with noninvasive brain stimulation and that symptom reduction correlates with functional connectivity reductions between the stimulated site and the EC. Our investigation revealed that individuals with symptom improvement to rTMS exhibit decreased lEC connectivity with the contralateral EC, as well as with the right inferior parietal lobule and precuneus. We also showed that baseline connectivity between the EC and the DLPFC can predict response to treatment. These data have been used to develop more focused and effective neuromodulation treatments for MdDS.
Footnotes
Acknowledgments
This work was supported by the Laureate Institute for Brain Research, the William K. Warren Foundation, NIH/NIDCD R03 DC010451 (Y.H.C.), an equipment grant from the MdDS Balance Disorders Foundation (Y.H.C.), and an award through NSF EPSCoR RII Track-2 #1539068 (H.Y., L.D., Y.H.C.).
Author Disclosure Statement
No competing financial interests exist.
References
Supplementary Material
Please find the following supplemental material available below.
For Open Access articles published under a Creative Commons License, all supplemental material carries the same license as the article it is associated with.
For non-Open Access articles published, all supplemental material carries a non-exclusive license, and permission requests for re-use of supplemental material or any part of supplemental material shall be sent directly to the copyright owner as specified in the copyright notice associated with the article.