
Abstract
We investigated how the structure of the brain network relates to the stability of perceptual alternation in binocular rivalry. Historically, binocular rivalry has provided important new insights to our understandings in neuroscience. Although various relationships between the local regions of the human brain structure and perceptual switching phenomena have been shown in previous researches, the global organization of the human brain structural network relating to this phenomenon has not yet been addressed. To approach this issue, we reconstructed fiber-tract bundles using diffusion tensor imaging and then evaluated the correlations between the speeds of perceptual alternation and fractional anisotropy (FA) values in each fiber-tract bundle integrating among 84 brain regions. The resulting comparison revealed that the distribution of the global organization of the structural brain network showed positive or negative correlations between the speeds of perceptual alternation and the FA values. First, the connections between the subcortical regions stably were negatively correlated. Second, the connections between the cortical regions mainly showed positive correlations. Third, almost all other cortical connections that showed negative correlations were located in one central cluster of the subcortical connections. This contrast between the contribution of the cortical regions to destabilization and the contribution of the subcortical regions to stabilization of perceptual alternation provides important information as to how the global architecture of the brain structural network supports the phenomenon of binocular rivalry.
Introduction
B
Before recording technologies were used to study this phenomenon, some researchers hypothesized that a perceptual alternation happened when activity of the neuron pool corresponding to a dominant perception decayed (Grossberg, 1987; Hock et al., 1997; Kohler, 1940). Further, for several decades, psychophysical researches questioned where the competing neuron pool is located in the brain. Specifically, they believed that either low-level visual regions, such as the primary visual cortex or lateral geniculate nucleus (LGN), or high-level visual regions, such as the extrastriate visual regions, may be the center of competition (Blake, 1989; Kovacs, et al., 1996; Lehky, 1998; Logothetis et al., 1996; Matsuoka, 1984; Sugie, 1982).
An example supporting the low-level visual processing hypothesis is the traveling wave, a phenomenon of visual alternation starting from partial patches in the visual field expanding to the full image. In the traveling wave, the interaction between visual information occurred along the retinotopically adjacent visual fields, and retinotopic maps exist on the early visual field more clearly (Wilson et al., 2001).
An example supporting this high-level visual processing hypothesis is the demonstration that when two visual stimuli are rapidly alternated between the two eyes, the temporal dynamics of perceptual alternation are similar as when the stimuli were not alternated (Logothetis et al., 1996). This hypothesis is also supported by evidence showing that intraocular interactions exist (Kovacs et al., 1996). Psychophysical experiments in monkeys and functional magnetic resonance-imaging (fMRI) studies in humans demonstrated that the highest correlation of brain activity occurs within the extrastriate visual cortex (Leopold and Logothetis, 1996; Logothetis and Schall, 1989; Tong et al., 1998).
More-detailed observations of these same psychophysical experiments showed the replication and limitations of both hypotheses (Lee and Blake, 1999, 2004). Recently, the relationship between the neural activity in V1 and the LGN has also been observed (Haynes et al., 2005; Lee et al., 2007; Lehky, 1988; Winderlich et al., 2005).
Whether low-level regions or high-level regions are the center of competition underlying binocular rivalry is still in debate, and the mutual combinational theory has also been proposed, which is based on a hierarchical model with sequential competitions in both the low-level and in the high-level layers of the visual cortex. Based on this theory, both layers would contribute to the perceptual alternation phenomenon, even though their properties are very different (Blake and Logothetis, 2002; Nguyen et al., 2001; Ooi and He, 2003; Tong et al., 2006).
In a wider view, several fMRI studies have found that the right prefrontal region and the parietal region become active at the times when perceptual alternations happened (Kleinschmidt et al., 1998; Knapen et al., 2011; Lumer and Friston, 1998; Sterzer and Kleischmdt, 2007). In studies of volume-based morphometry and diffusion tensor imaging (DTI), using the parietal cortex structure, it is possible to predict the differences in stability of perceptual alternation (Kanai et al., 2010a). For example, an fMRI study showed that the parietal and frontal regions play a central role in intentional stabilization and alternation of perceptions (Shimono et al., 2011a; Sterzer and Kleischmidt, 2007). A study of patients with brain injury showed that the prefrontal cortex is important for the acceleration of perceptual alternation (Windmann et al., 2006). Although many studies have reported that various brain regions, such as the primary visual cortex, extrastriate visual cortex, parietal cortex, frontal cortex, and thalamus, contribute to different aspects of the perceptual alternation phenomenon, the whole-brain interactions are not fully understood.
Based on these previous findings, we asked what structural brain networks support the dynamic interactions between various brain regions. In particular, previous studies did not examine the global organization of the structural brain network. The effectiveness of this network-based approach has previously been demonstrated (Bullmore and Sporns, 2009; Sporns et al., 2005) in characterizing the default-mode network of the general global brain architecture (Hagmann et al., 2007, 2008), and in the pathognomonic status and specific cognitive ability (Hanggi, et al., 2011; Lynall et al., 2010). Although the interaction among many brain regions is reported frequently in studies of synchronization of EEG signals recorded from head surfaces, there has been no study reporting direct comparisons between anatomical networks in perceptual behavior (Doesburg et al., 2005, 2009; Hipp et al., 2011; Struber et al., 2000; Varela et al., 2001).
In this study, we recorded both behavioral data in binocular rivalry experiments and DTI data from participants. Then, we extracted the important fiber-tract bundles based on whether mean fractional anisotropy (FA) values show significant positive or negative correlation with the alternation speeds. FA value is thought to reflect the information transmission efficiency on each fiber tract (Head et al., 2004; Klingberg et al., 2000; Pfefferbaum et al., 2002). The spatial mapping of fiber-tract bundles having negative or positive correlations revealed that global modules such as groups of the cortical or subcortical regions are responsible for stability of perception in binocular rivalry. Therefore, the significant positive or negative correlations of fiber-tract bundles indicate the high information transmission efficiency relating to acceleration or deceleration of perceptual alternation.
Materials and Methods
Participants
Seventeen healthy, right-handed volunteers (aged from 20 to 29 years; 10 men and 7 women) were recruited for the experiment. Participants did not have a history of neurological or psychiatric disorders. All participants had normal or corrected-to-normal vision. All procedures were approved by the AIST MRI safety and ethics committee, and informed consent was obtained from all participants before the experiment was conducted. We performed DTI recordings and the psychophysical experiments in the MRI room on the first day. Approximately 3 weeks later, 12 of the participants participated in the psychophysical experiment to evaluate the stability of speeds of the perceptual alternation.
General scheme of data processing
Analysis consisted of four procedures (Fig. 1). First, we performed preprocessing of diffusion-weighed images to reduce noise and coregistration, and calculated the three-dimensional maps of FA values. Second, we segmented the brain into 68 cortical regions and 16 subcortical regions. Third, we reconstructed the fiber tracts connecting among these regions by tracking the vector map of FA values. We then defined the weight of each fiber-tract bundle based on the mean FA value of all voxels in each of the fiber-tract bundle. Fourth, we compared the architecture of reconstructed networks with the results of psychophysical experiments.
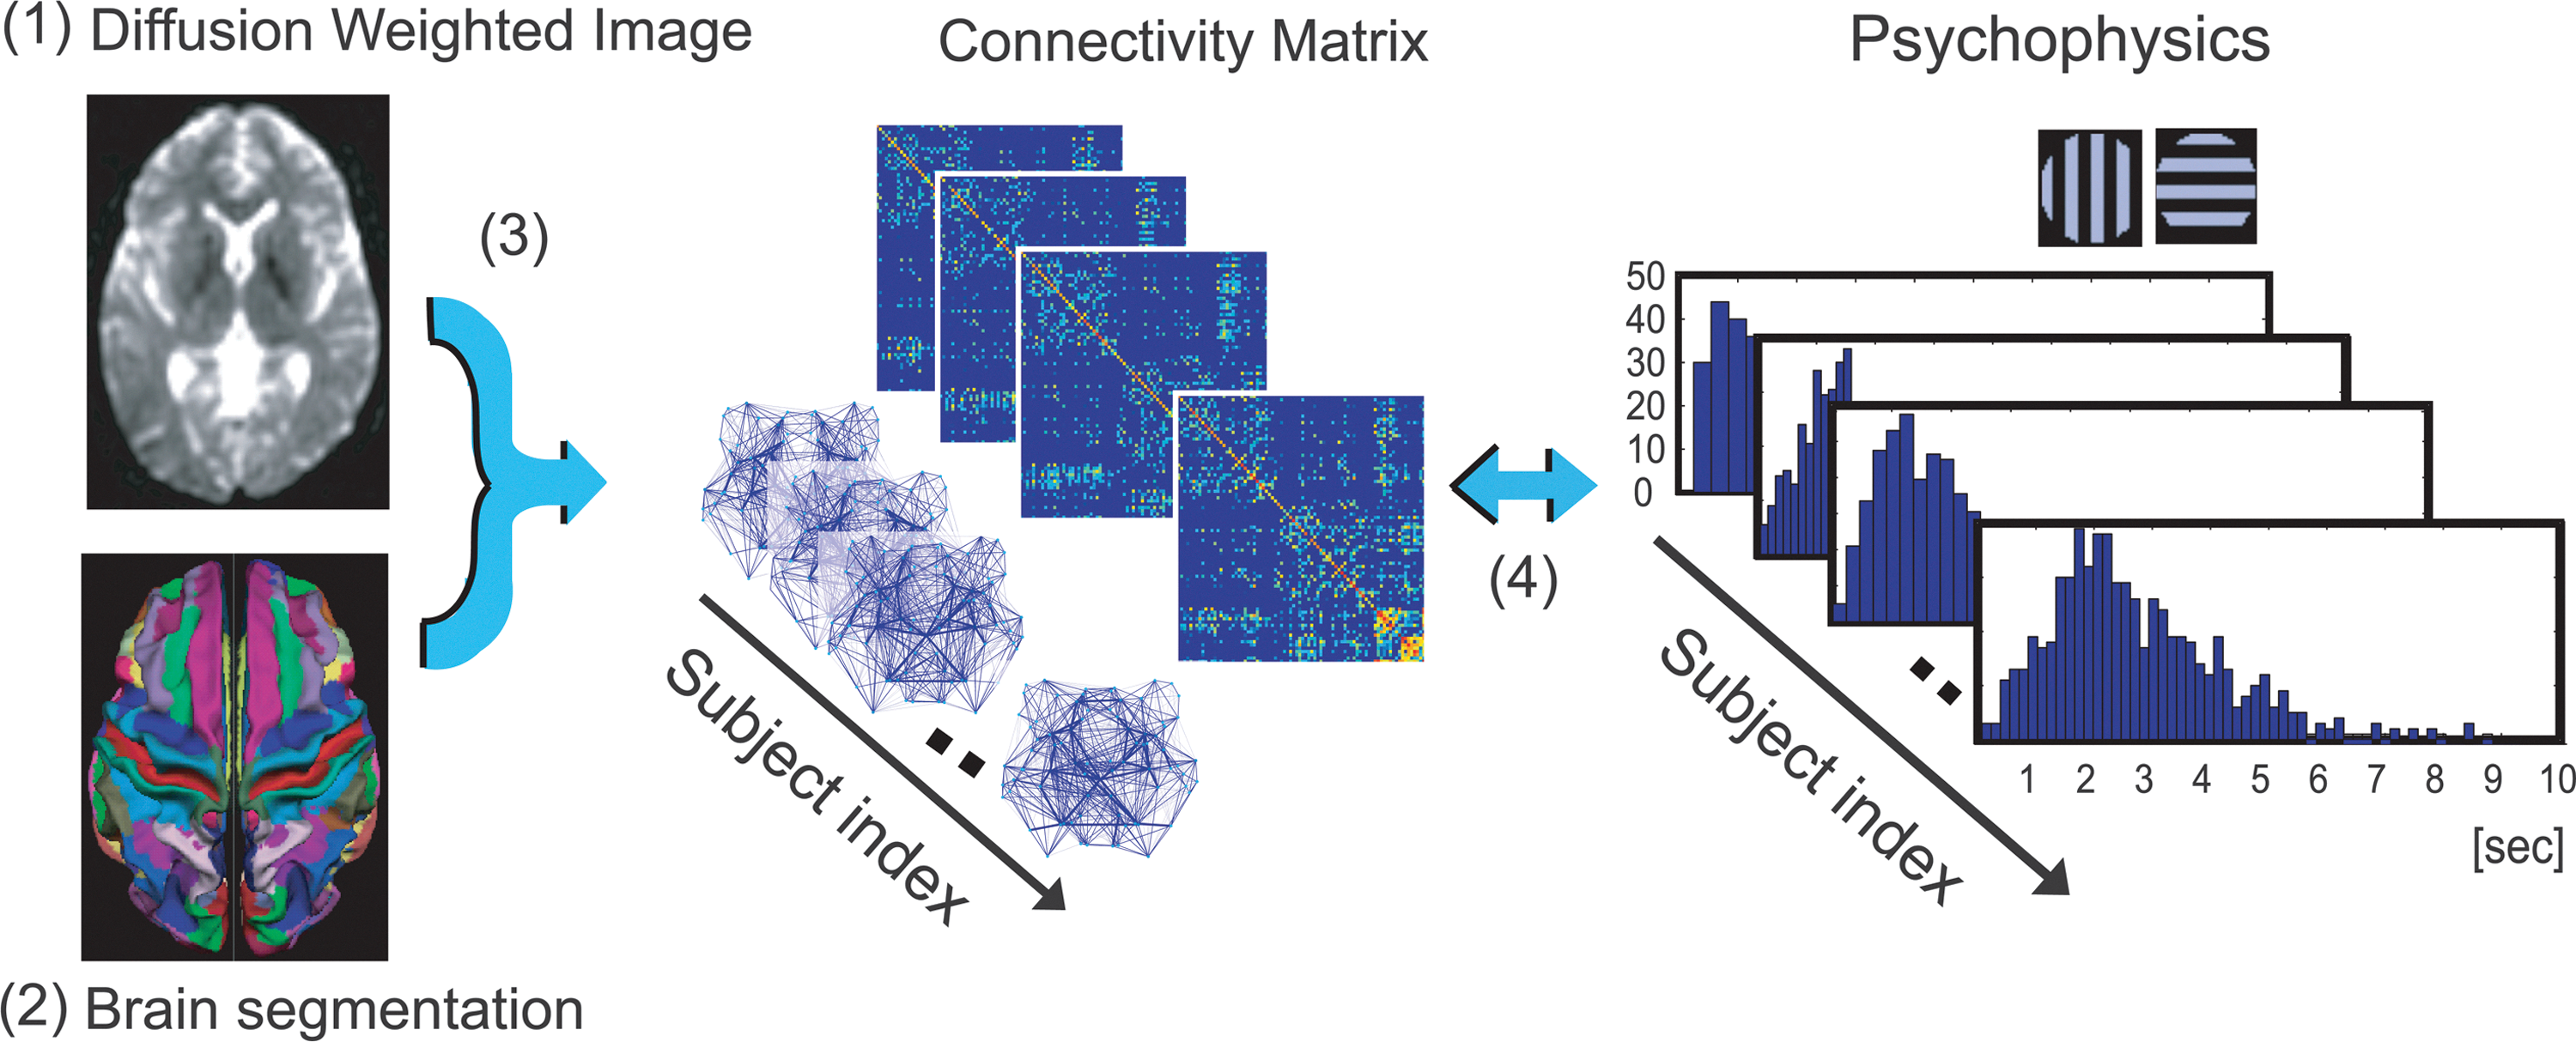
Scheme of data analysis.
MRI acquisition
All scanning was performed on a 3.0 T MRI Scanner (3T Signa LX; General Electric Medical Systems, Milwaukee, MN) equipped with an echo-planar imaging (EPI) capability and a standard head coil. During scanning, subjects remained supine with their heads immobilized with cushioned supports, wearing earplugs to weaken the MRI-gradient noise.
Diffusion-weighed imaging was acquired using a single-shot EPI spin-echo (EPI-SE) pulse sequence with the following parameters: 51 axial slices, TR 16 sec, TE 8.83 milliseconds, number of excitations (NEX) 1, FOV 320 mm (covering the whole cerebrum), acquisition matrix 128×128, reconstructed to 256×256, and 2.5-mm slice thickness using no interslice gap. Diffusion-sensitizing gradients were applied along 33 directions with a diffusion sensitivity of b=0 and 1000 s/mm2. The studies also included the fast spin-echo (FSE) T2-weighed (TR: 500, TE: 9.8, FA: 90, NEX: 1) and gradient Echo T1-weighed (TR: 1.07, FA: 0.3, FA: 30, NEX: 1) sequences.
Preprocessing of diffusion-weighed images
The FMRIB Software Library of FSL (
All images were corrected for eddy current distortions and head motion specifically by aligning all volumes to the first b0 image. Their diffusion tensors were fitted independently to each voxel in the corrected image, and were used to calculate the FA maps (Basser et al., 1994; Jenkinson and Smith, 2001). The FA value can indirectly quantify the coherence of the orientations of white-matter fiber tracts in the brain (Basser et al., 1994; Le Bihan et al., 2001). High FA values represent more-organized tissues (anisotropic diffusion), and low FA values indicate a lack of directional tissue (isotropic diffusion). In other words, the FA value evaluates the microstructural integrity of white matter tissue (Head et al., 2004; Klingberg et al., 2000; Pfefferbaum et al., 2002). By tracking the principle direction of the diffusion of FA values, we can also reconstruct fiber tracts.
Brain segmentations and nodes of networks
The cortical surface was parcelled by using the template (fsaverage) of FreeSurfer Software (
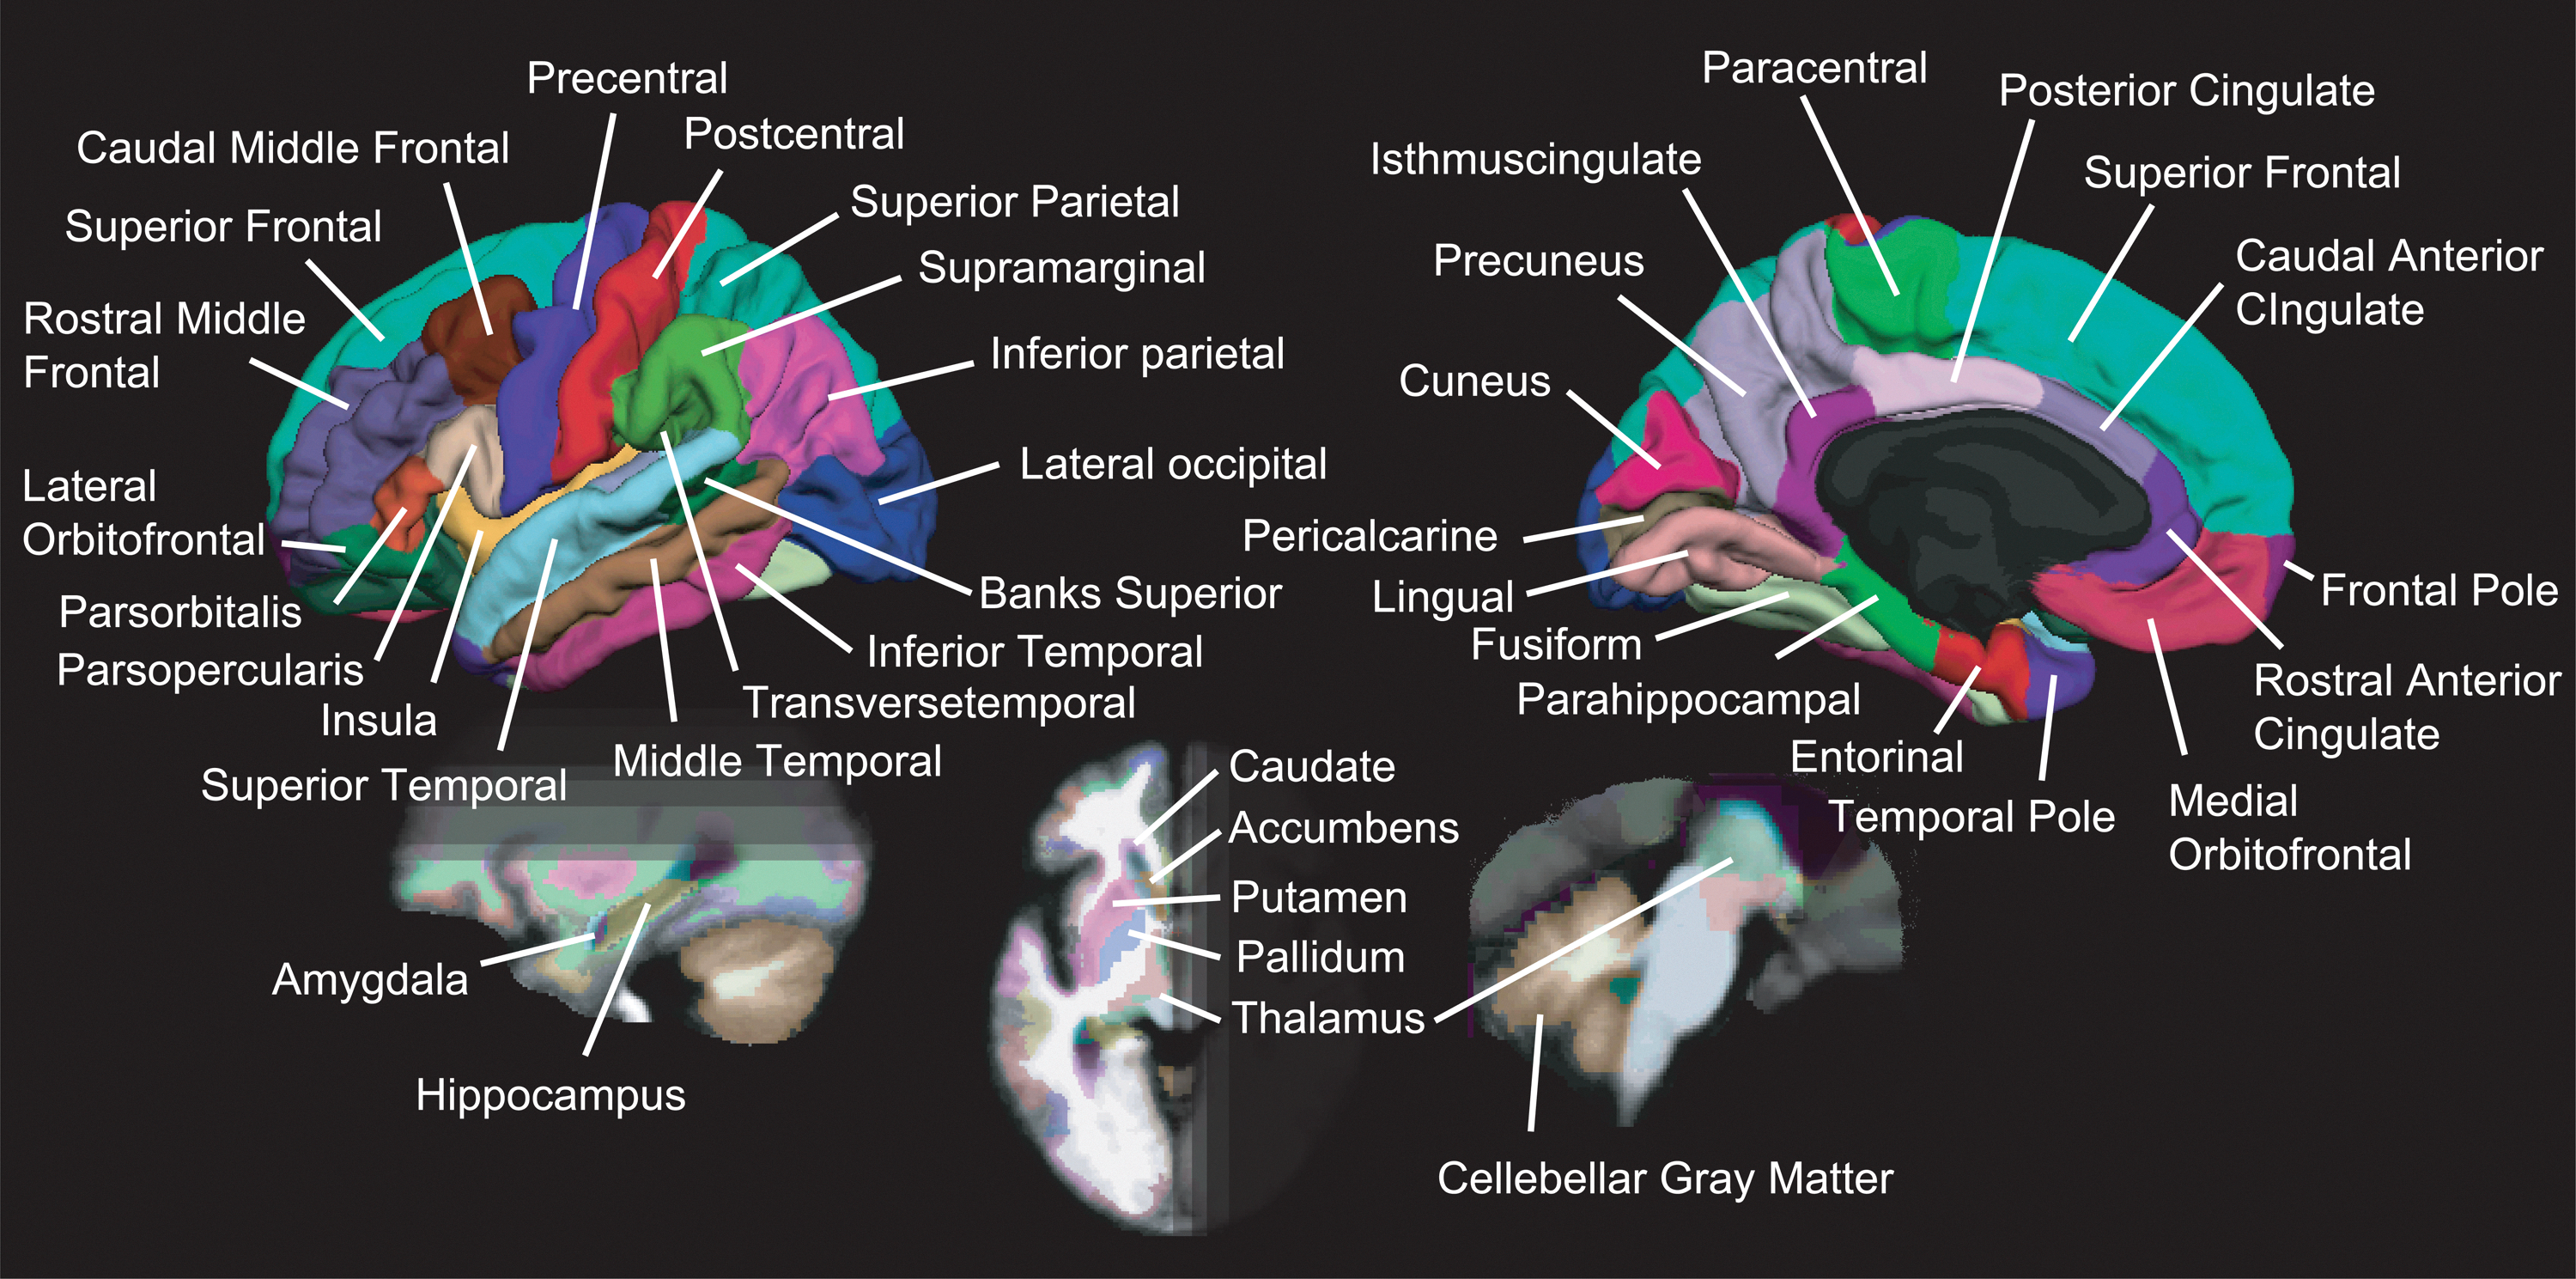
The map of segmented brain regions. The segmentation map includes 68 cortical and 16 subcortical regions of interest (ROIs).
T1-weighed images were spatially normalized according to the Montreal Neurological Institute template brain. The resulting normalization parameters were subsequently applied to the individual diffusion-weighed images and FA images for reorienting the gradient directions using SPM8 (
Before calculating the correlation between FA values in ROIs and variables representing psychophysical properties, we changed FA values outside of the brain region to zero.
Fiber tracking and links of networks
FA values can characterize the preferred direction of the white matter running through each voxel (Le Bihan, 2001). Based on this calculation, we reconstructed white-matter fiber tracts using the FACT fiber-tracking algorithm between each pair of ROIs (Mori and Barker, 1999; Mori and van Zijl, 2002; Xue et al., 1999) by using Camino software (
From the reconstructed fiber-tract bundle, we created connectivity matrices for each individual participant. In the connectivity matrices, we regarded one pair of nodes as being connected if there was at least one streamline, and we defined weighed factors of each connection using each mean FA value in voxels constituting each fiber-tract bundle connecting between two regions. Then, we excluded the voxels included in ROIs, which were used as edges of these networks.
Psychophysical experiments
The psychophysical experiment on each day consisted of four 15-min sessions (Fig. 3). During each session, participants viewed stimuli consisting of a superimposed vertical and horizontal grating (2.66 cycle/deg) within a circle region (3.0° diameter) around a fixation cross (two perpendicular lines, each 0.4° long and 0.2° wide) through stereoscopic glasses that caused the binocular rivalry phenomenon. The contrast of all gratings was 20%, and their average luminance was 23.5 cd/m2. The color of either vertical or horizontal visual-grating stimulus was red, and the opposite was green. Stereoscopic glasses were green and red (Fig. 3). The filters of the stereoscopic glasses transmitted <3% of the unmatched versus matched luminance color (Tong, et al., 1998). Therefore, each of the participant's eyes received only one of the vertical and horizontal grating information at a time. The participants were instructed to maintain steady fixation, and to press one of two keys corresponding to one of the two perceptions as soon as the dominantly perceived direction of gratings changed. The relationship between perceptions and finger indications were counterbalanced among the participants. The participants were also instructed not to control perception intentionally and to view stimuli passively.
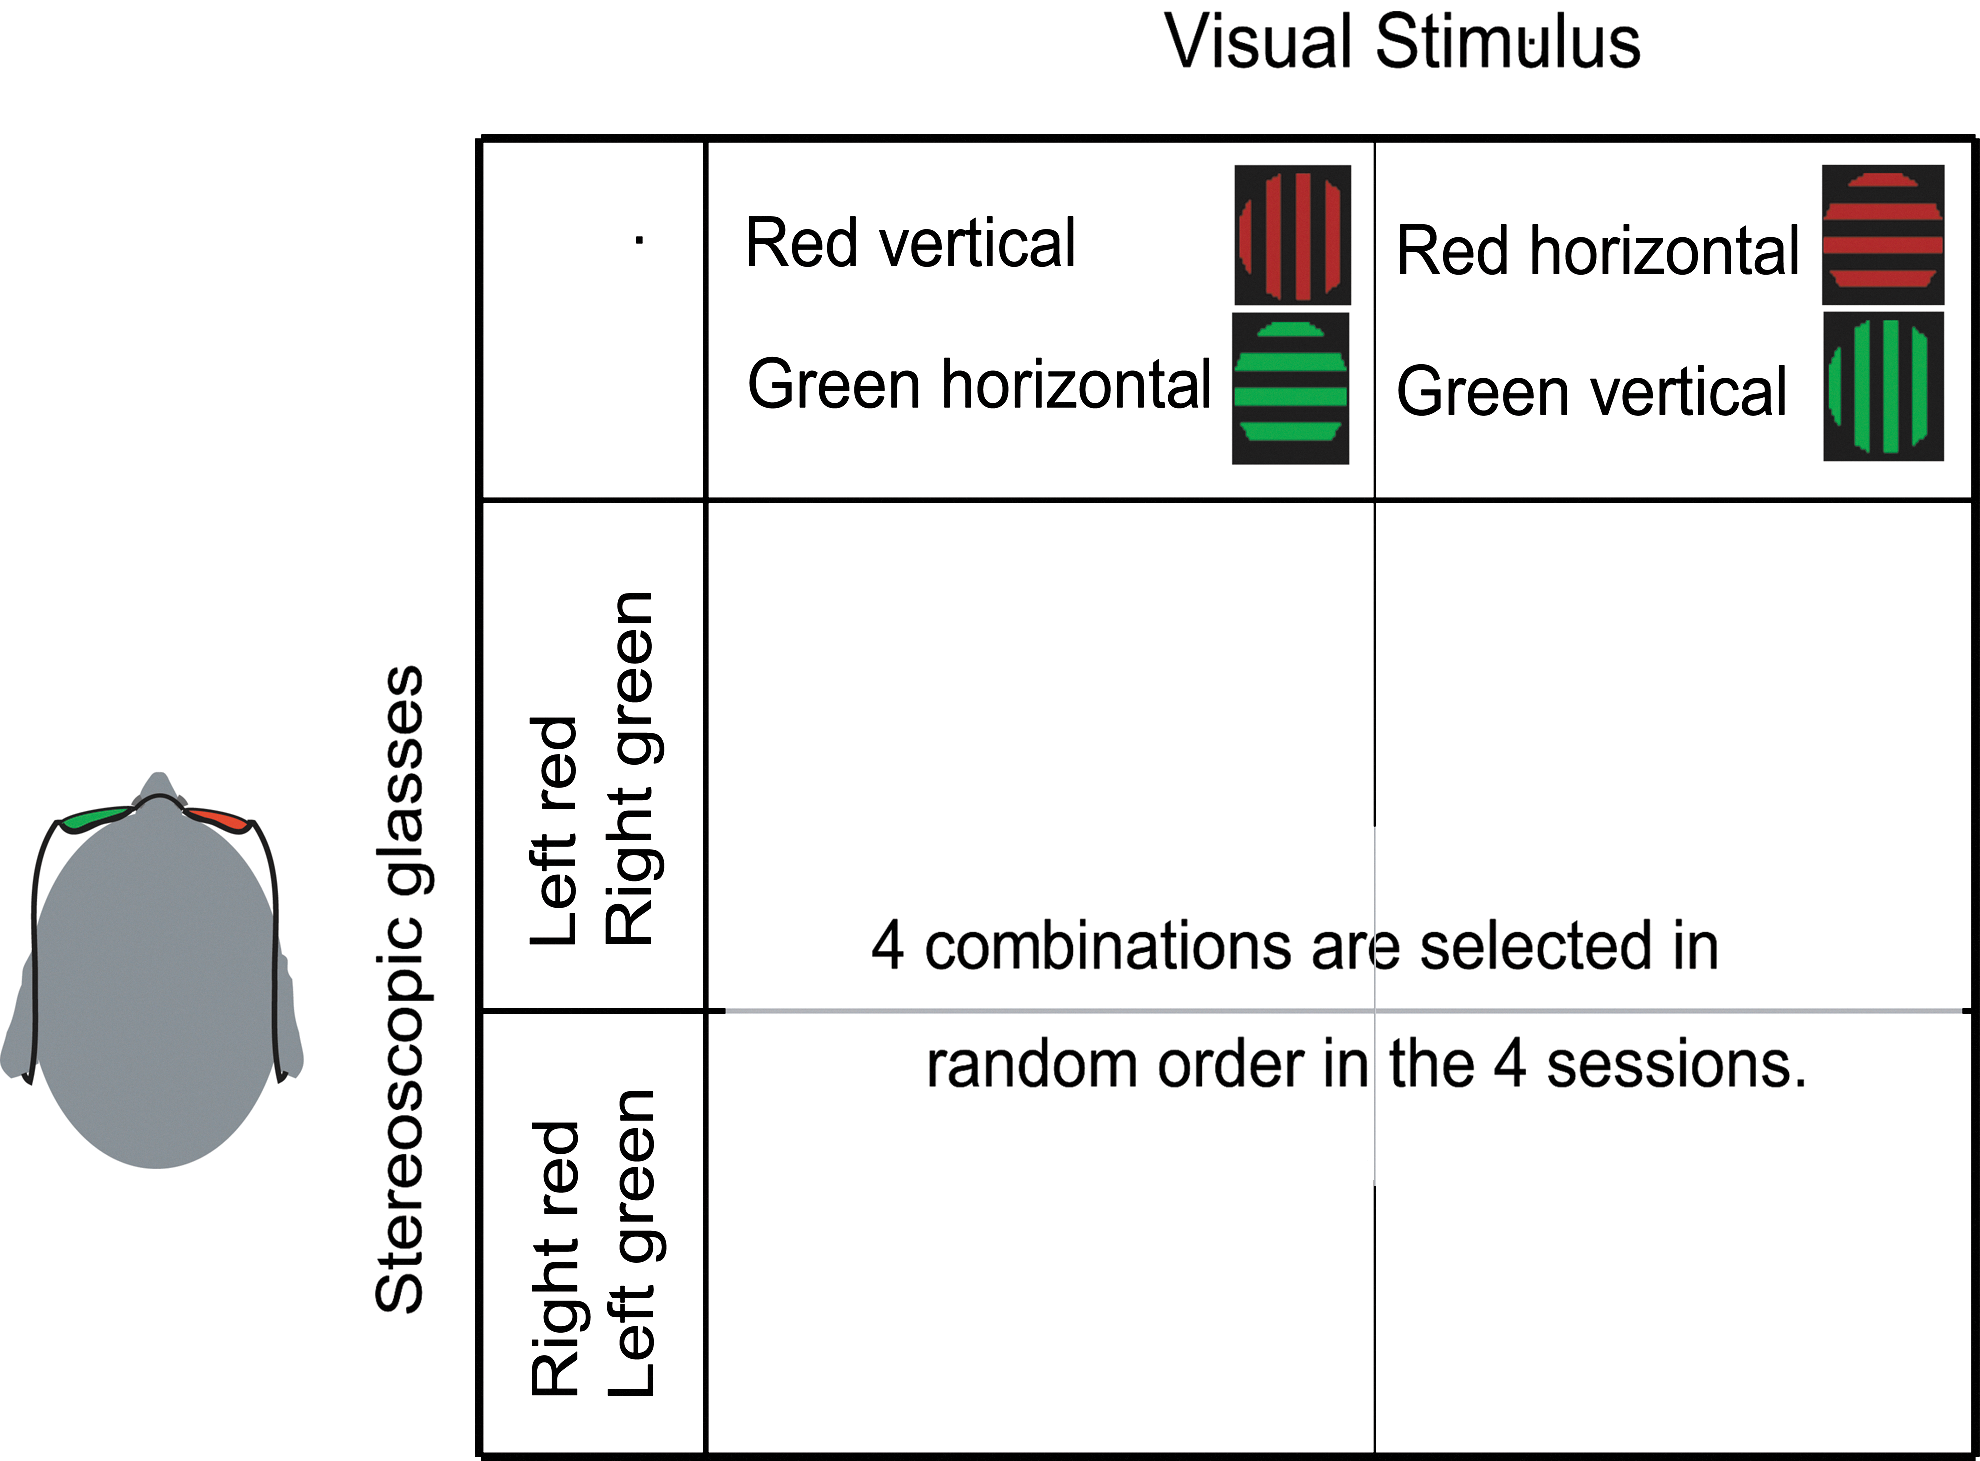
Design of the binocular rivalry experiment. Only red grating is visible by one eye through a green filter, and only green grating is visible by the other eye through a red filter. Across the first two sessions, the red stimulus was a horizontal grating, and the green stimulus was a vertical grating. In the remaining two sessions, the colors of two directions of grating were exchanged, and within each pair of sessions, the colors of filters were exchanged. Participants experienced these four kinds of combinations of visual stimuli and visual filters in a random order within 1 day.
As shown in Figure 3, the green and red lenses of the stereoscopic glasses were exchanged after 2nd session and the colors of the vertical and the horizontal grating were exchanged at the end of 1st and 3rd sessions to counterbalance the biases toward certain colors of glasses in the preferred eye of the participants. All visual stimuli were projected on a translucent screen (visual angle of 30°×40°) using a digital processing light projector, and were generated using the psychophysics toolbox in MatLab (Brainard, 1997). The participants' eye movements were carefully monitored during the experiment using a SensoMotoric Instruments Eyelink System (Teltow, Germany). In the evaluation of psychophysical results, we used speeds of perceptual alternation, which were defined as the inverse of the mean value of duration of the time length of perceptual alternations (histogram at right side of Fig. 1). The definition was used here because the parameter showed a significant stability between two psychophysical experiments within each participant (Fig. 4; Aafjes et al., 1966; George, 1936; McDougall, 1906).
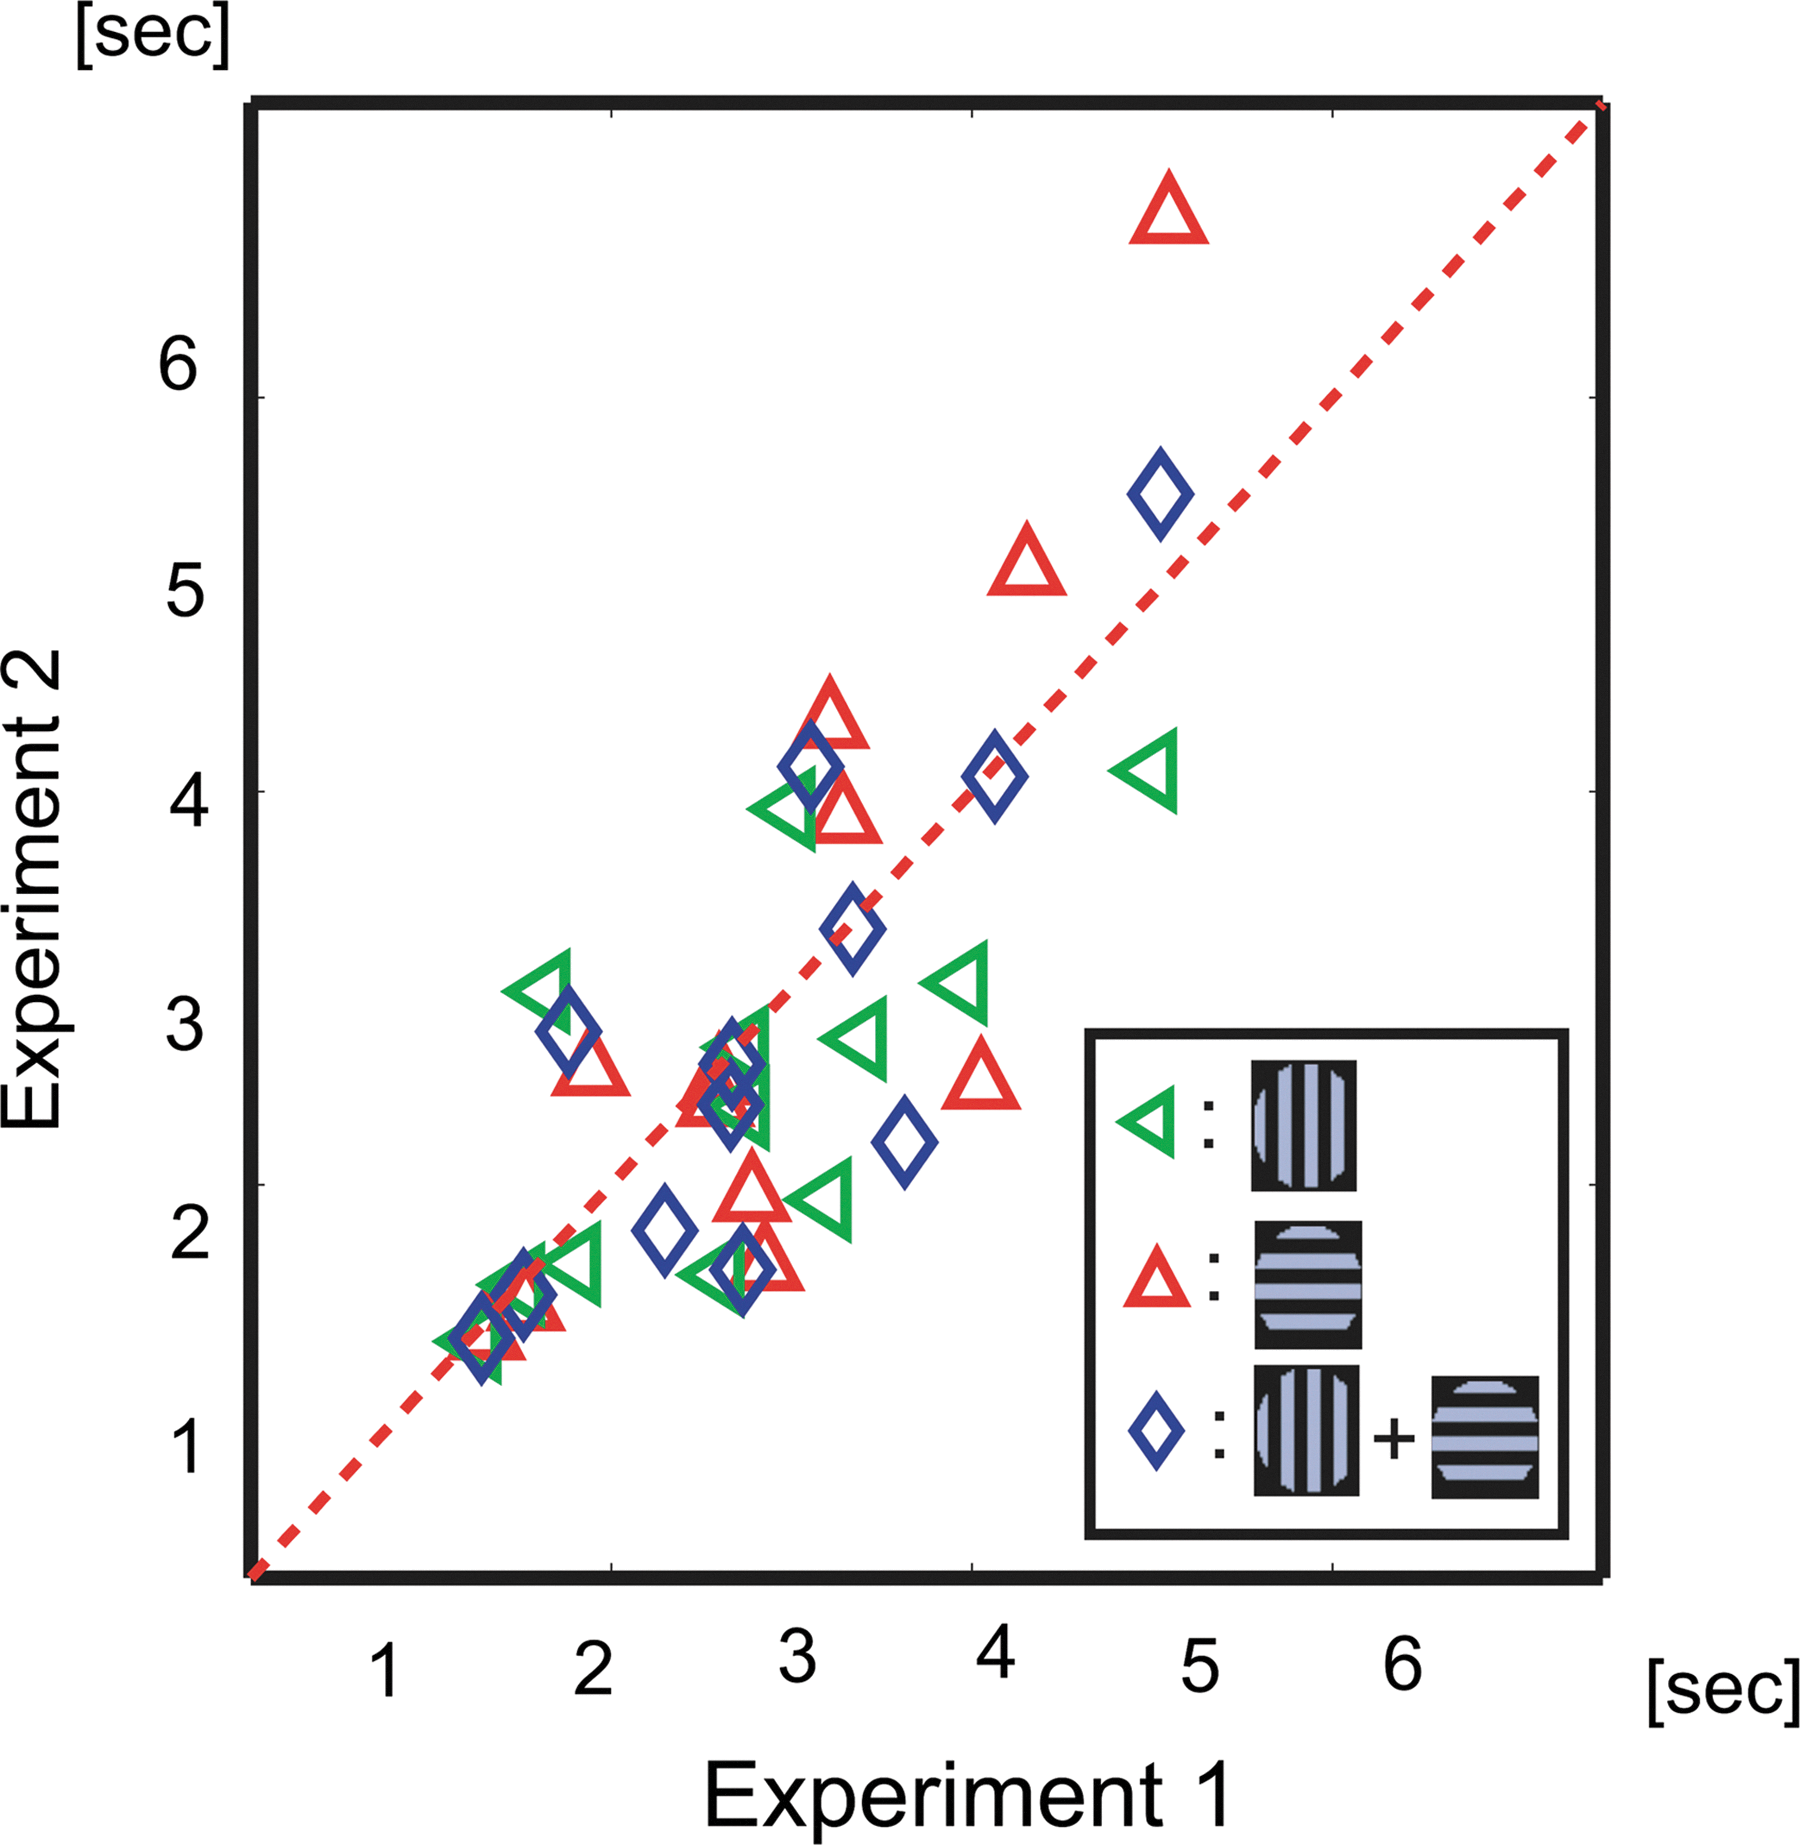
Stability of alternation speed of perceptual switching. Twelve of the 17 participants completed both phases of the psychophysical experiment. The interval between the two experiments was longer than 3 weeks. Green triangles indicate the average duration in time of vertical grating perception; red triangles indicate the average duration in time of horizontal grating perception; and blue indicates the average duration in time of all perceptual alternations. The correlation between the two experiments was 0.71 (p<0.01).
Comparison between perceptual properties and corresponding brain structures
To compare between the brain structures and psychophysical properties, we calculated the correlation between the differences among the mean FA values in individuals' brain structures and the differences among individuals' speeds of perceptual alternation. After fiber tracking, we compared the mean FA values in all voxels consisting fiber-tract bundles with the psychophysical parameter. We used nonparametric Spearman's rank tests of the correlation coefficients between the averaged FA values in each fiber-tract bundle using MatLab. The fiber-tract bundle, in which averaged FA value showed positive correlation with the speed of perceptual alternation, was referred to as positive correlation networks (CNs), and the fiber-tract bundle, in which the averaged FA value showed negative correlation with the speed of perceptual alternation, was referred to as negative CNs.
Results
Stability in psychophysical measures
In the psychophysical experiment, we recorded the time sequence of the perceptual alternation between vertical and horizontal gratings. Figure 4 shows the comparison between the mean values of duration of the time lengths of the two experiments. The two experiments were separated by a space of longer than 3 weeks. Comparing these two experiments, the results clearly demonstrate significant stability for each individual participant (R=0.71, p<0.01, t-test).
Perceptual bias and network architecture
To observe the interaction among various brain regions, we mapped the structural network architecture of the whole human brain. In Figure 5, each line indicates a bundle of fiber tracts connected to a pair of brain regions. The color of the line indicates signs (blue lines are positive CNs and red lines are negative CNs) of correlations among each averaged FA value of each fiber tract and each participants' speed of perceptual alternation. Thick lines represent significantly strong connections; a correlation value of 0.7 corresponds with a p-value 0.01 in Spearman's rank test, and the corresponding expected value of false discovery rate (FDR) is <0.05 (Benjamini and Hochberg, 1995). Therefore, for this threshold, multiple comparisons were sufficiently avoided by using FDR.
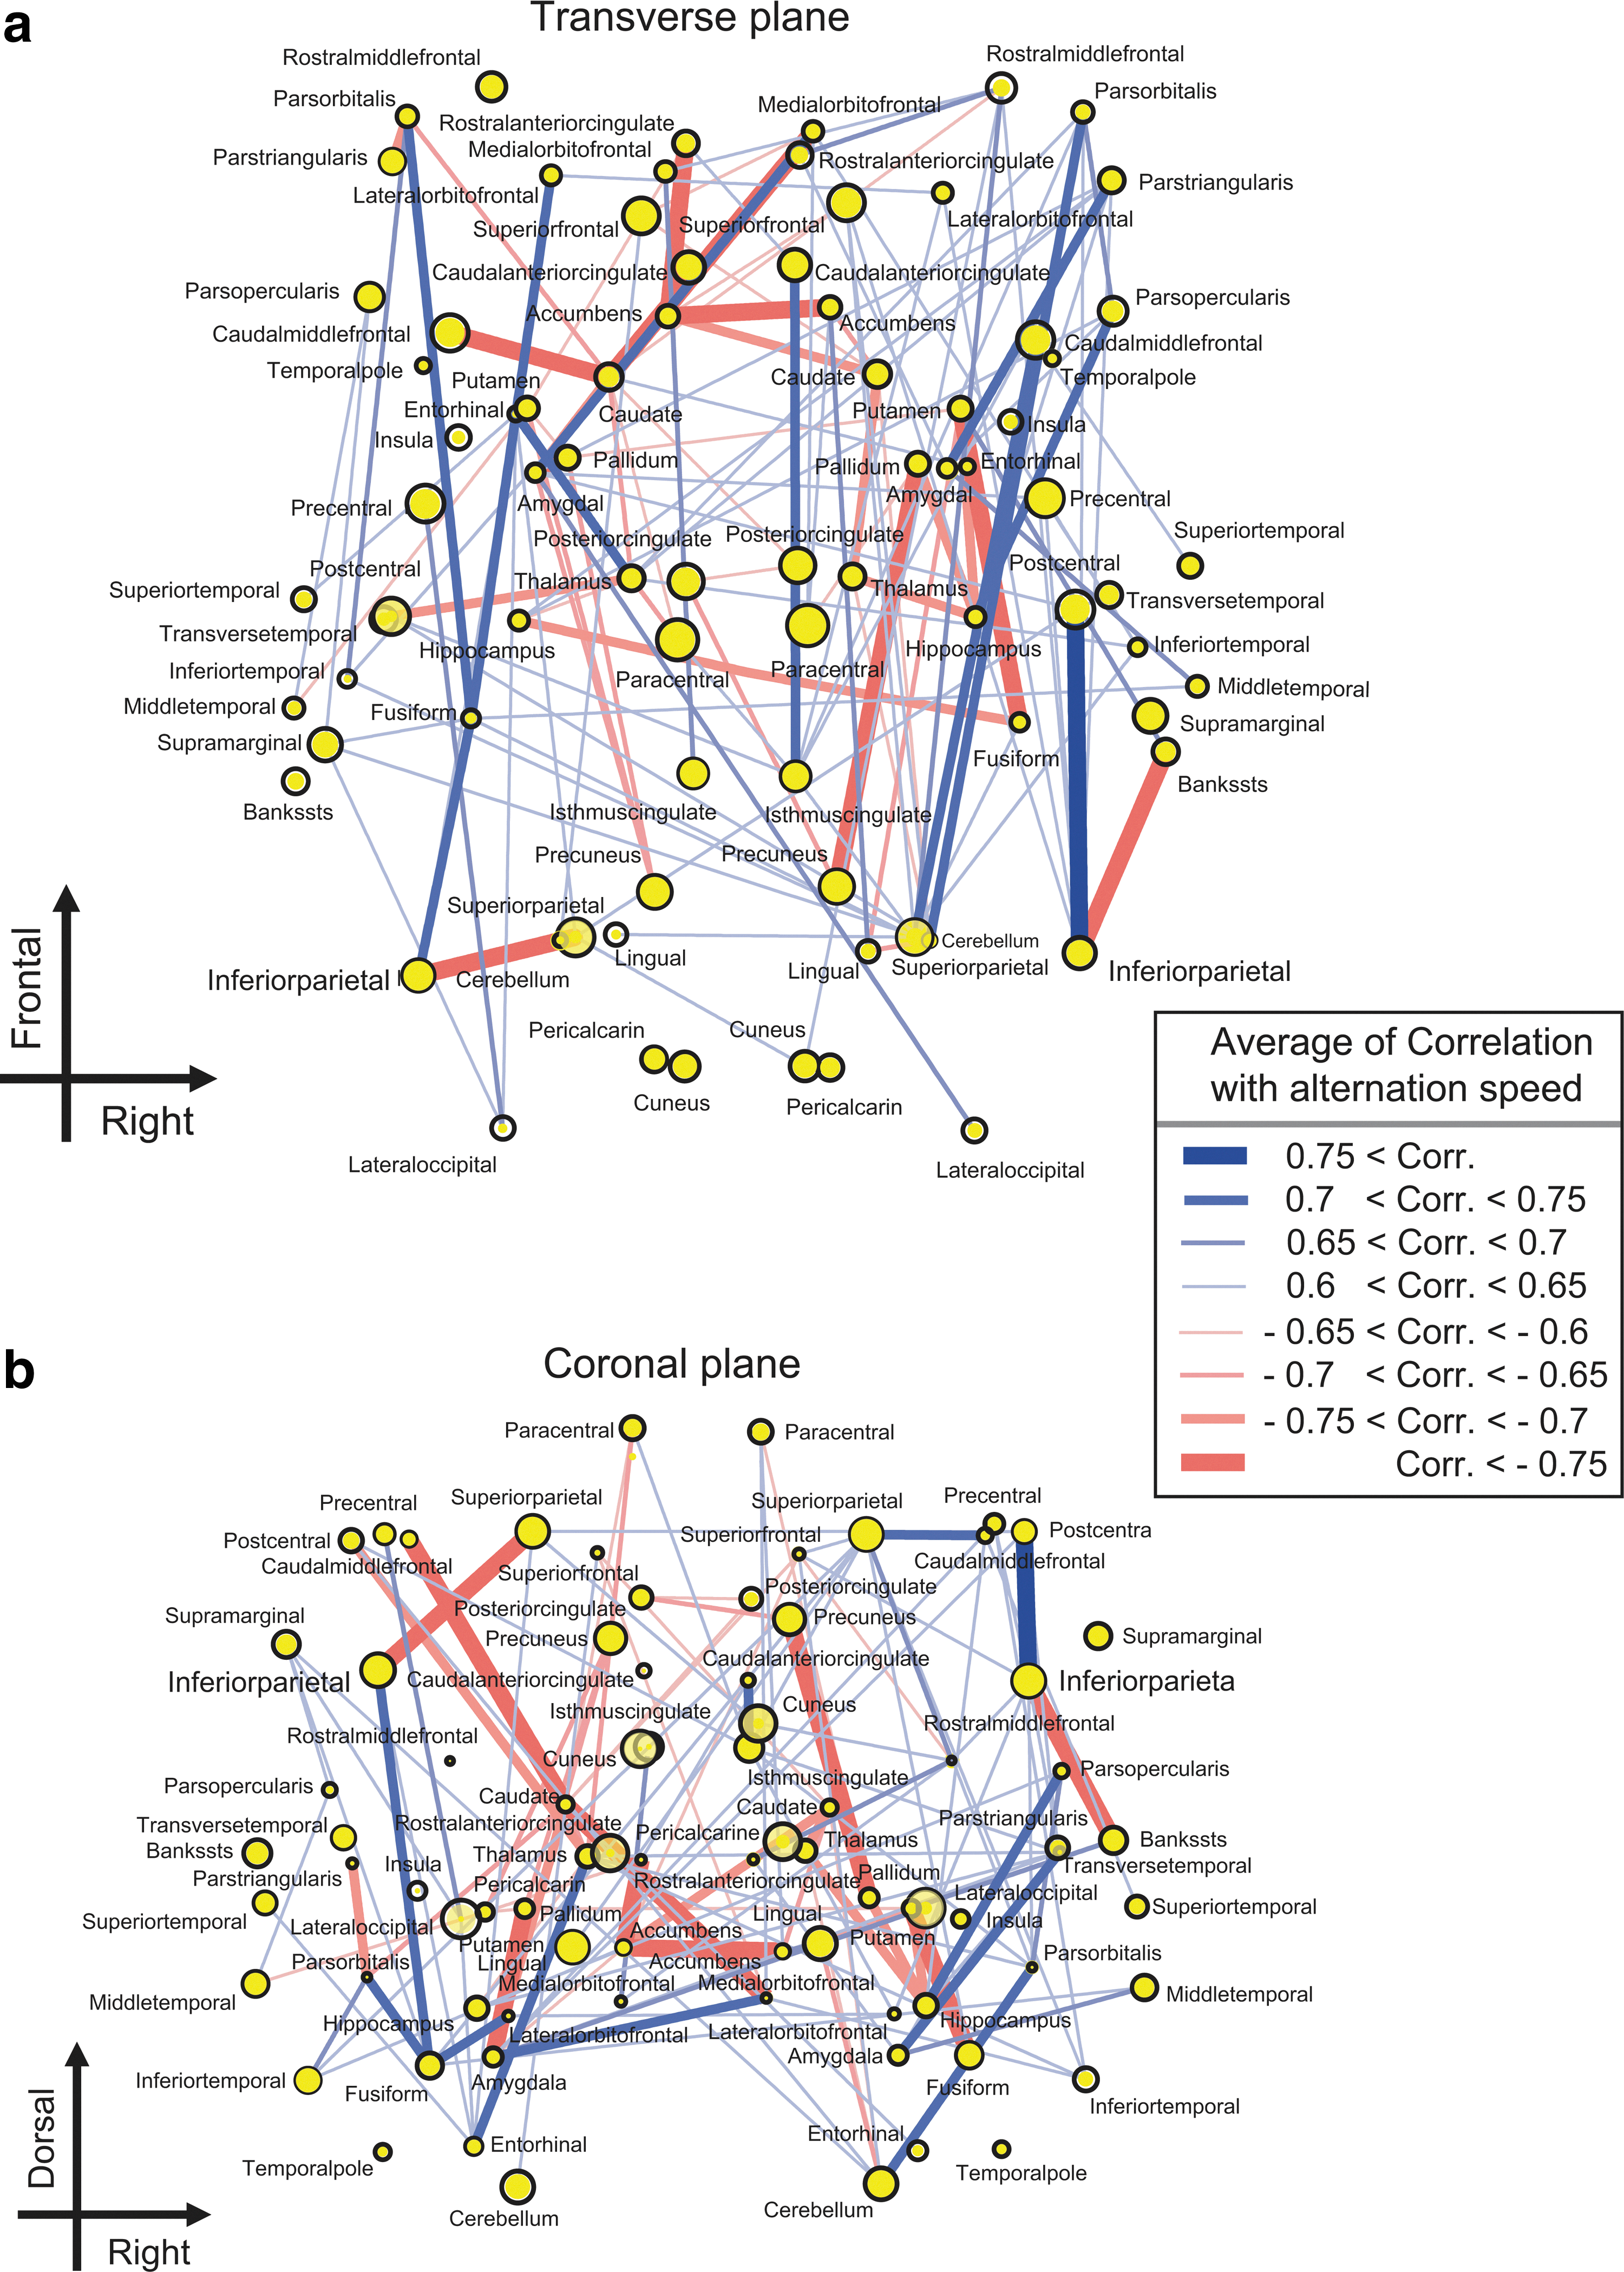
Positive and negative correlation networks (CNs)
This result showed that these two types of fiber-tract bundles were entangled each other. To understand the topological organization by disentangling it, we performed the following analysis.
Key properties of positive CNs and negative CNs
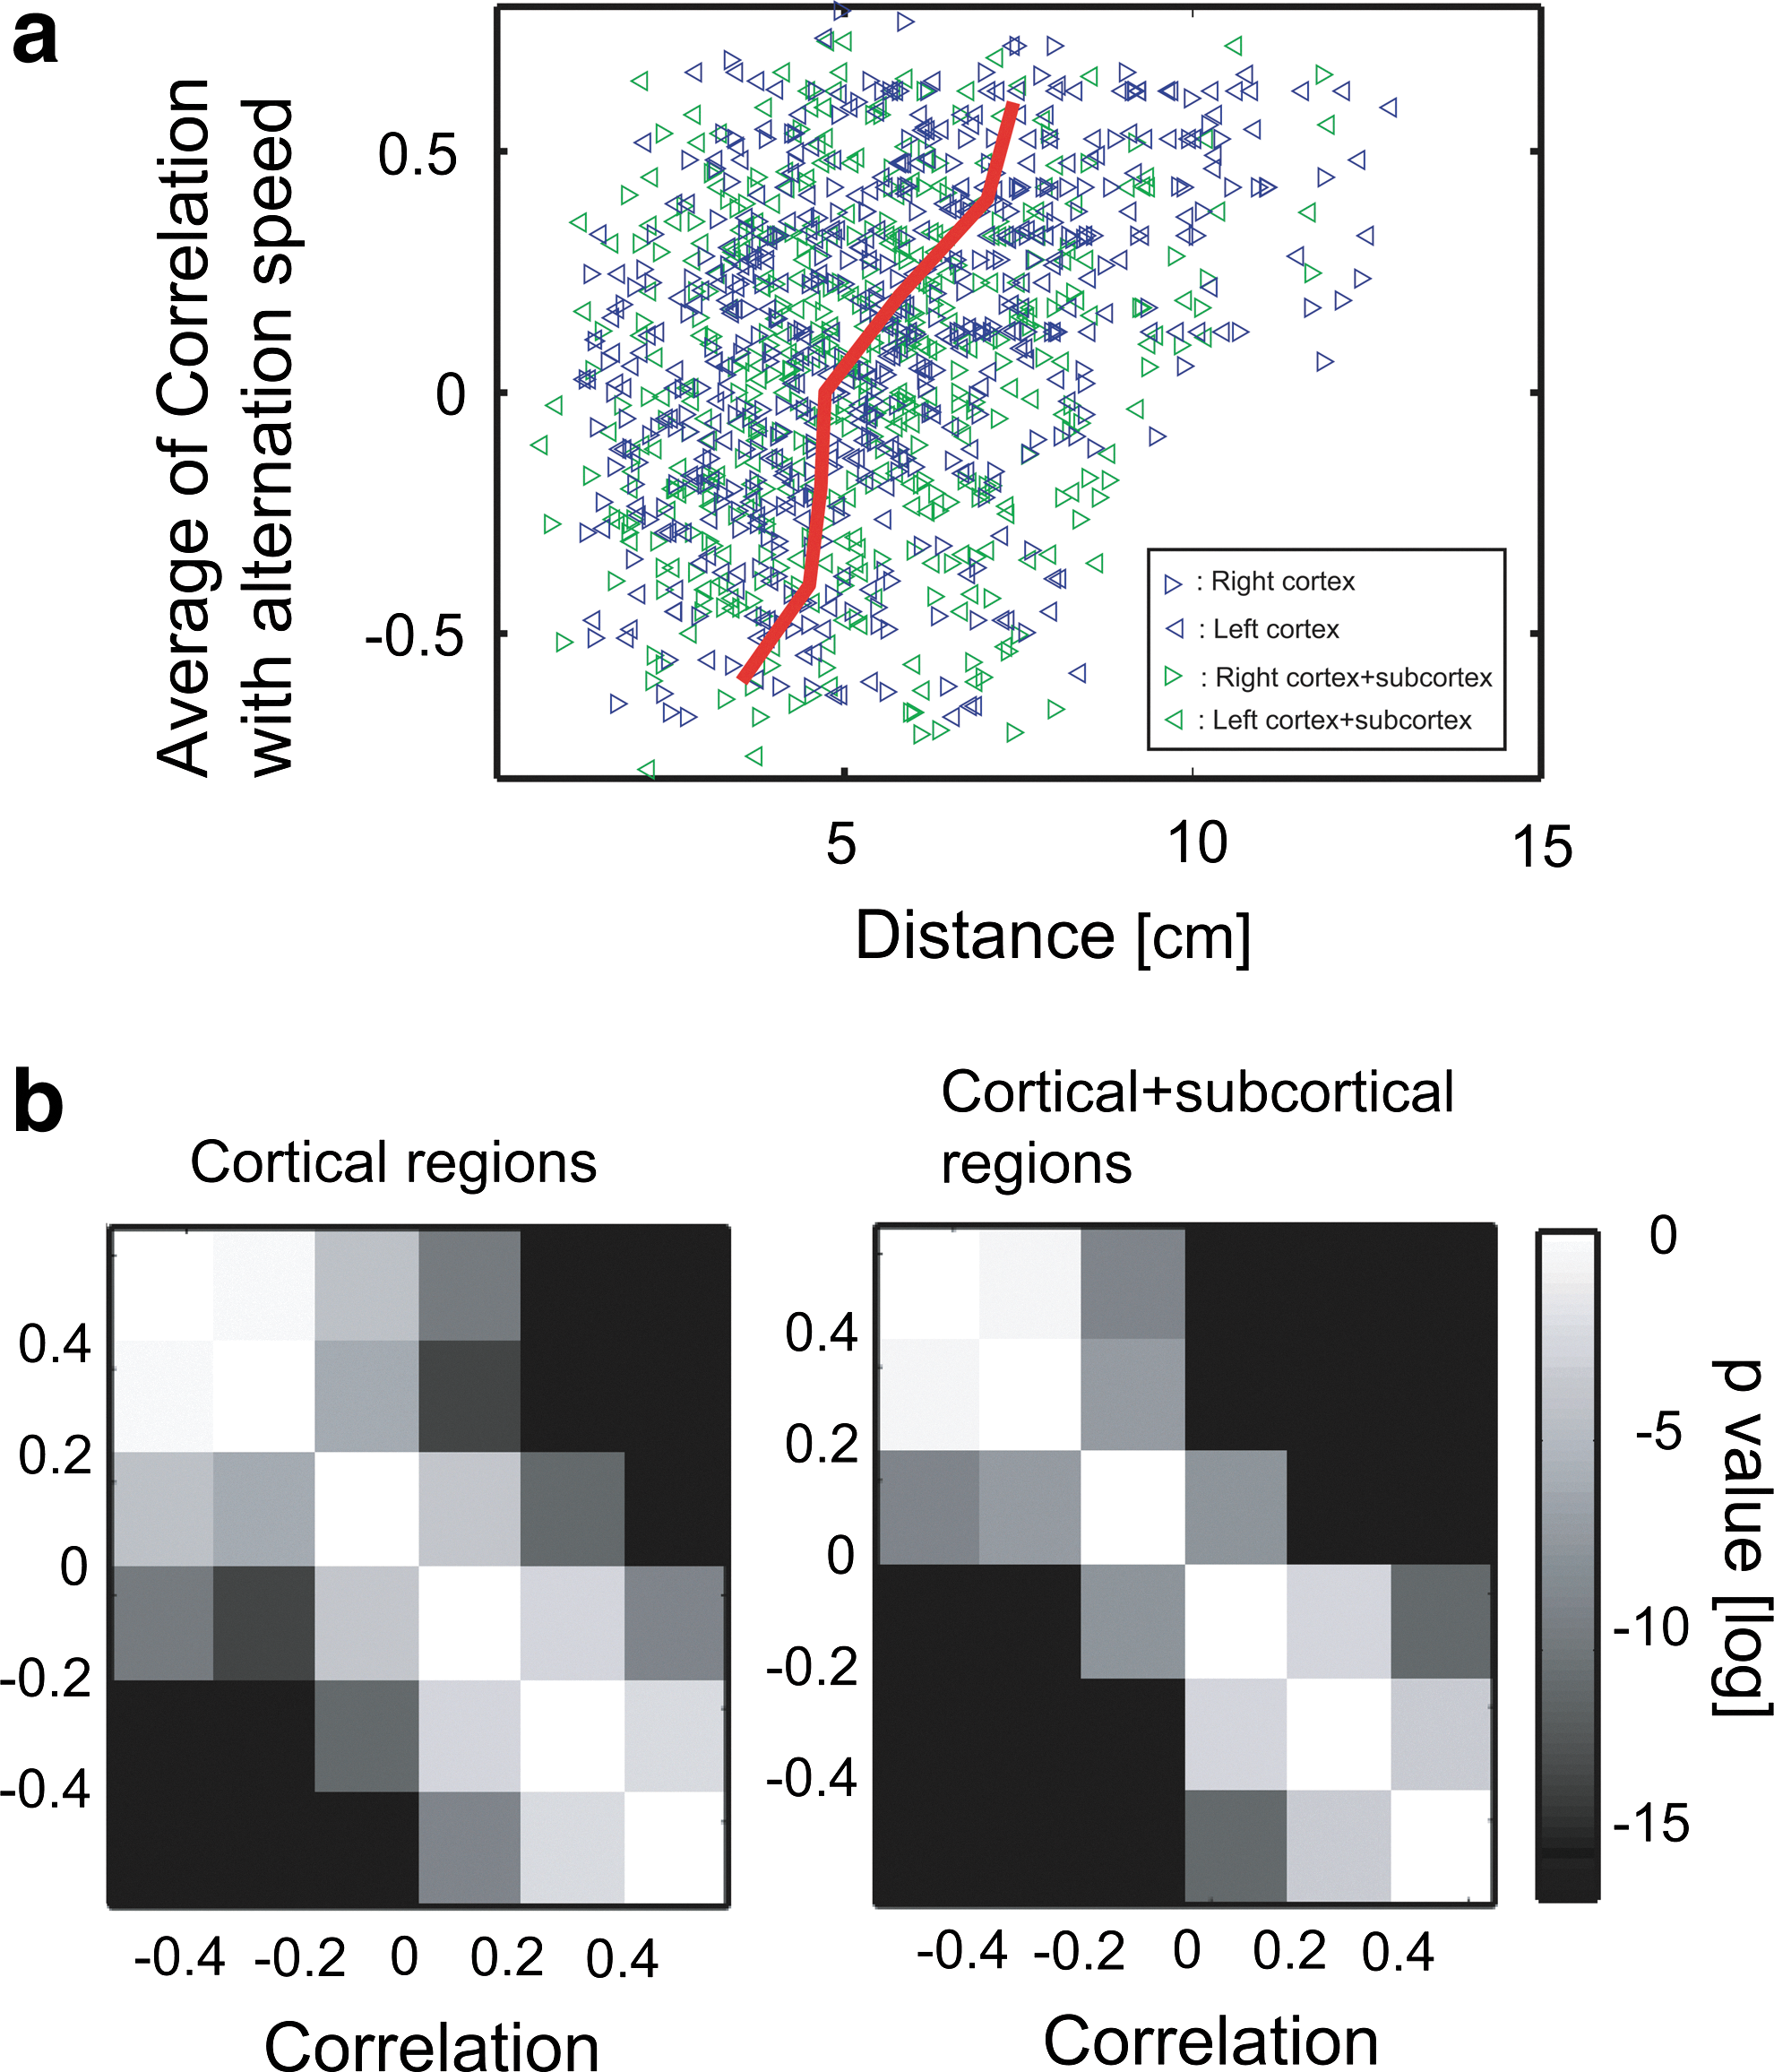
We evaluated how the distances of the fiber-tract bundles changed in relation to the correlation changes between individuals' differences of FA values and their differences of speeds of perceptual alternation. In other words, we observed how widely positive CNs and negative CNs distribute (Fig. 6). The distribution of these two types of fiber-tract bundles showed significantly different sizes of distributions: negative CNs were significantly more localized than the positive CNs in both the hemispheres (Fig. 6a, b). Their p-values of 1-sided t-test are shown in Figure 6c and d.
Localization of negative CNs: Figure
To determine where the localized regions connect with densely distributed negative CNs, we reorganized the spatial mapping of the networks, as shown in Figure 5a. In Figure 7, the y-axis was changed from a spatial location to the total value of correlations between the averages of FA values of the fiber tracts connecting to each brain region and speeds of perceptual alternation. This distribution shows a clear pattern, which is wider at the top and narrower at the bottom. Therefore, many negative CNs are localized around the central region of the brain. However, among brain regions whose averaged correlation was positive (distributing in the upper side of Fig. 7), only connections from the bilateral inferior parietal regions were connected with a strong negative CN. This result suggests that the inferior parietal regions are special regions for competition between acceleration and deceleration of perceptual alternation. This finding is consistent with a previous study based on individual brain regions. In this study, we tried to think more about the important new finding that many negative CNs are localized around the central region of the brain.
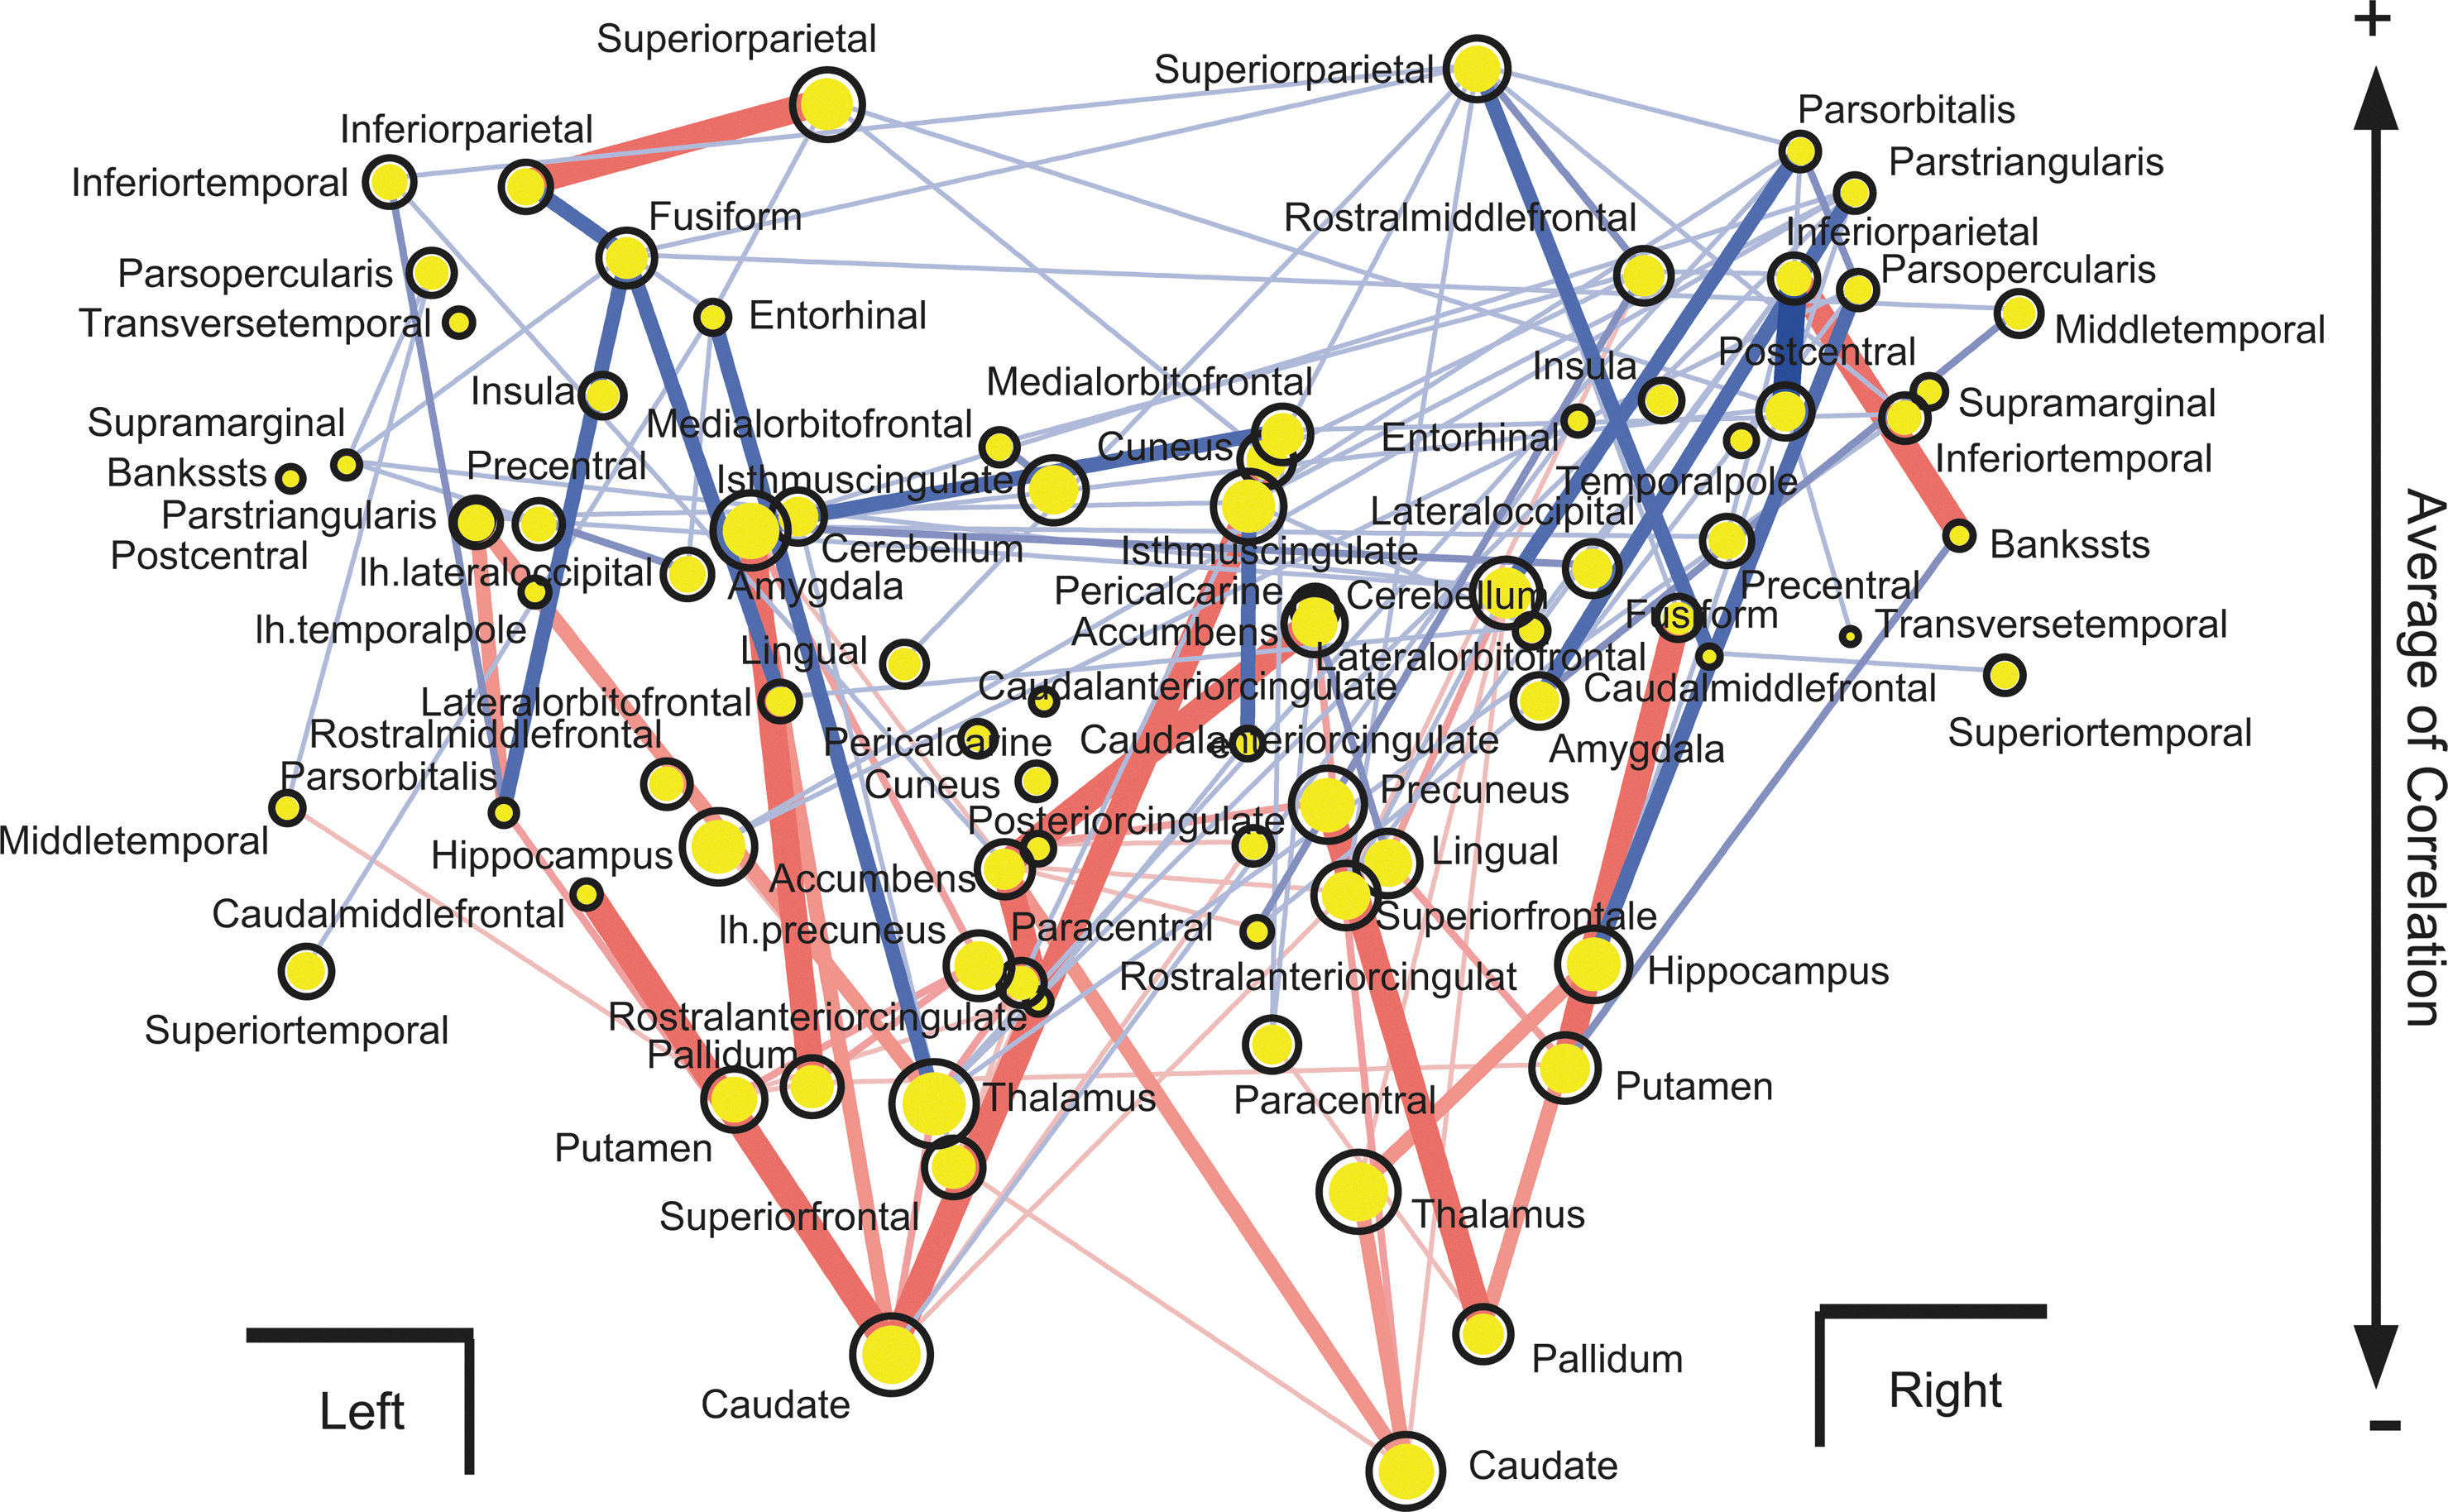
Reorganization of positive and negative CNs. The x-axis is same as in Figure 6a, but the y-axis was changed to be the averaged value of correlations between mean FA values included in bundle of fiber tracts and alternation speed of perception. Correlations were averaged for all bundles of fiber tracts connecting with each node. The sizes of all yellow circles show the averages of absolute values of correlations.
Next, we calculated the difference of correlations between FA values and speed of perceptual alternation separately for the cortical regions and for the subcortical regions.
Figure 8a depicts the average of the correlations in fiber-tract bundles connected to each cortical region. Figure 8b depicts the averaged correlation in fiber-tract bundles connecting with each subcortical region. Figure 8c is the comparison between results of the cortex and the subcortices.
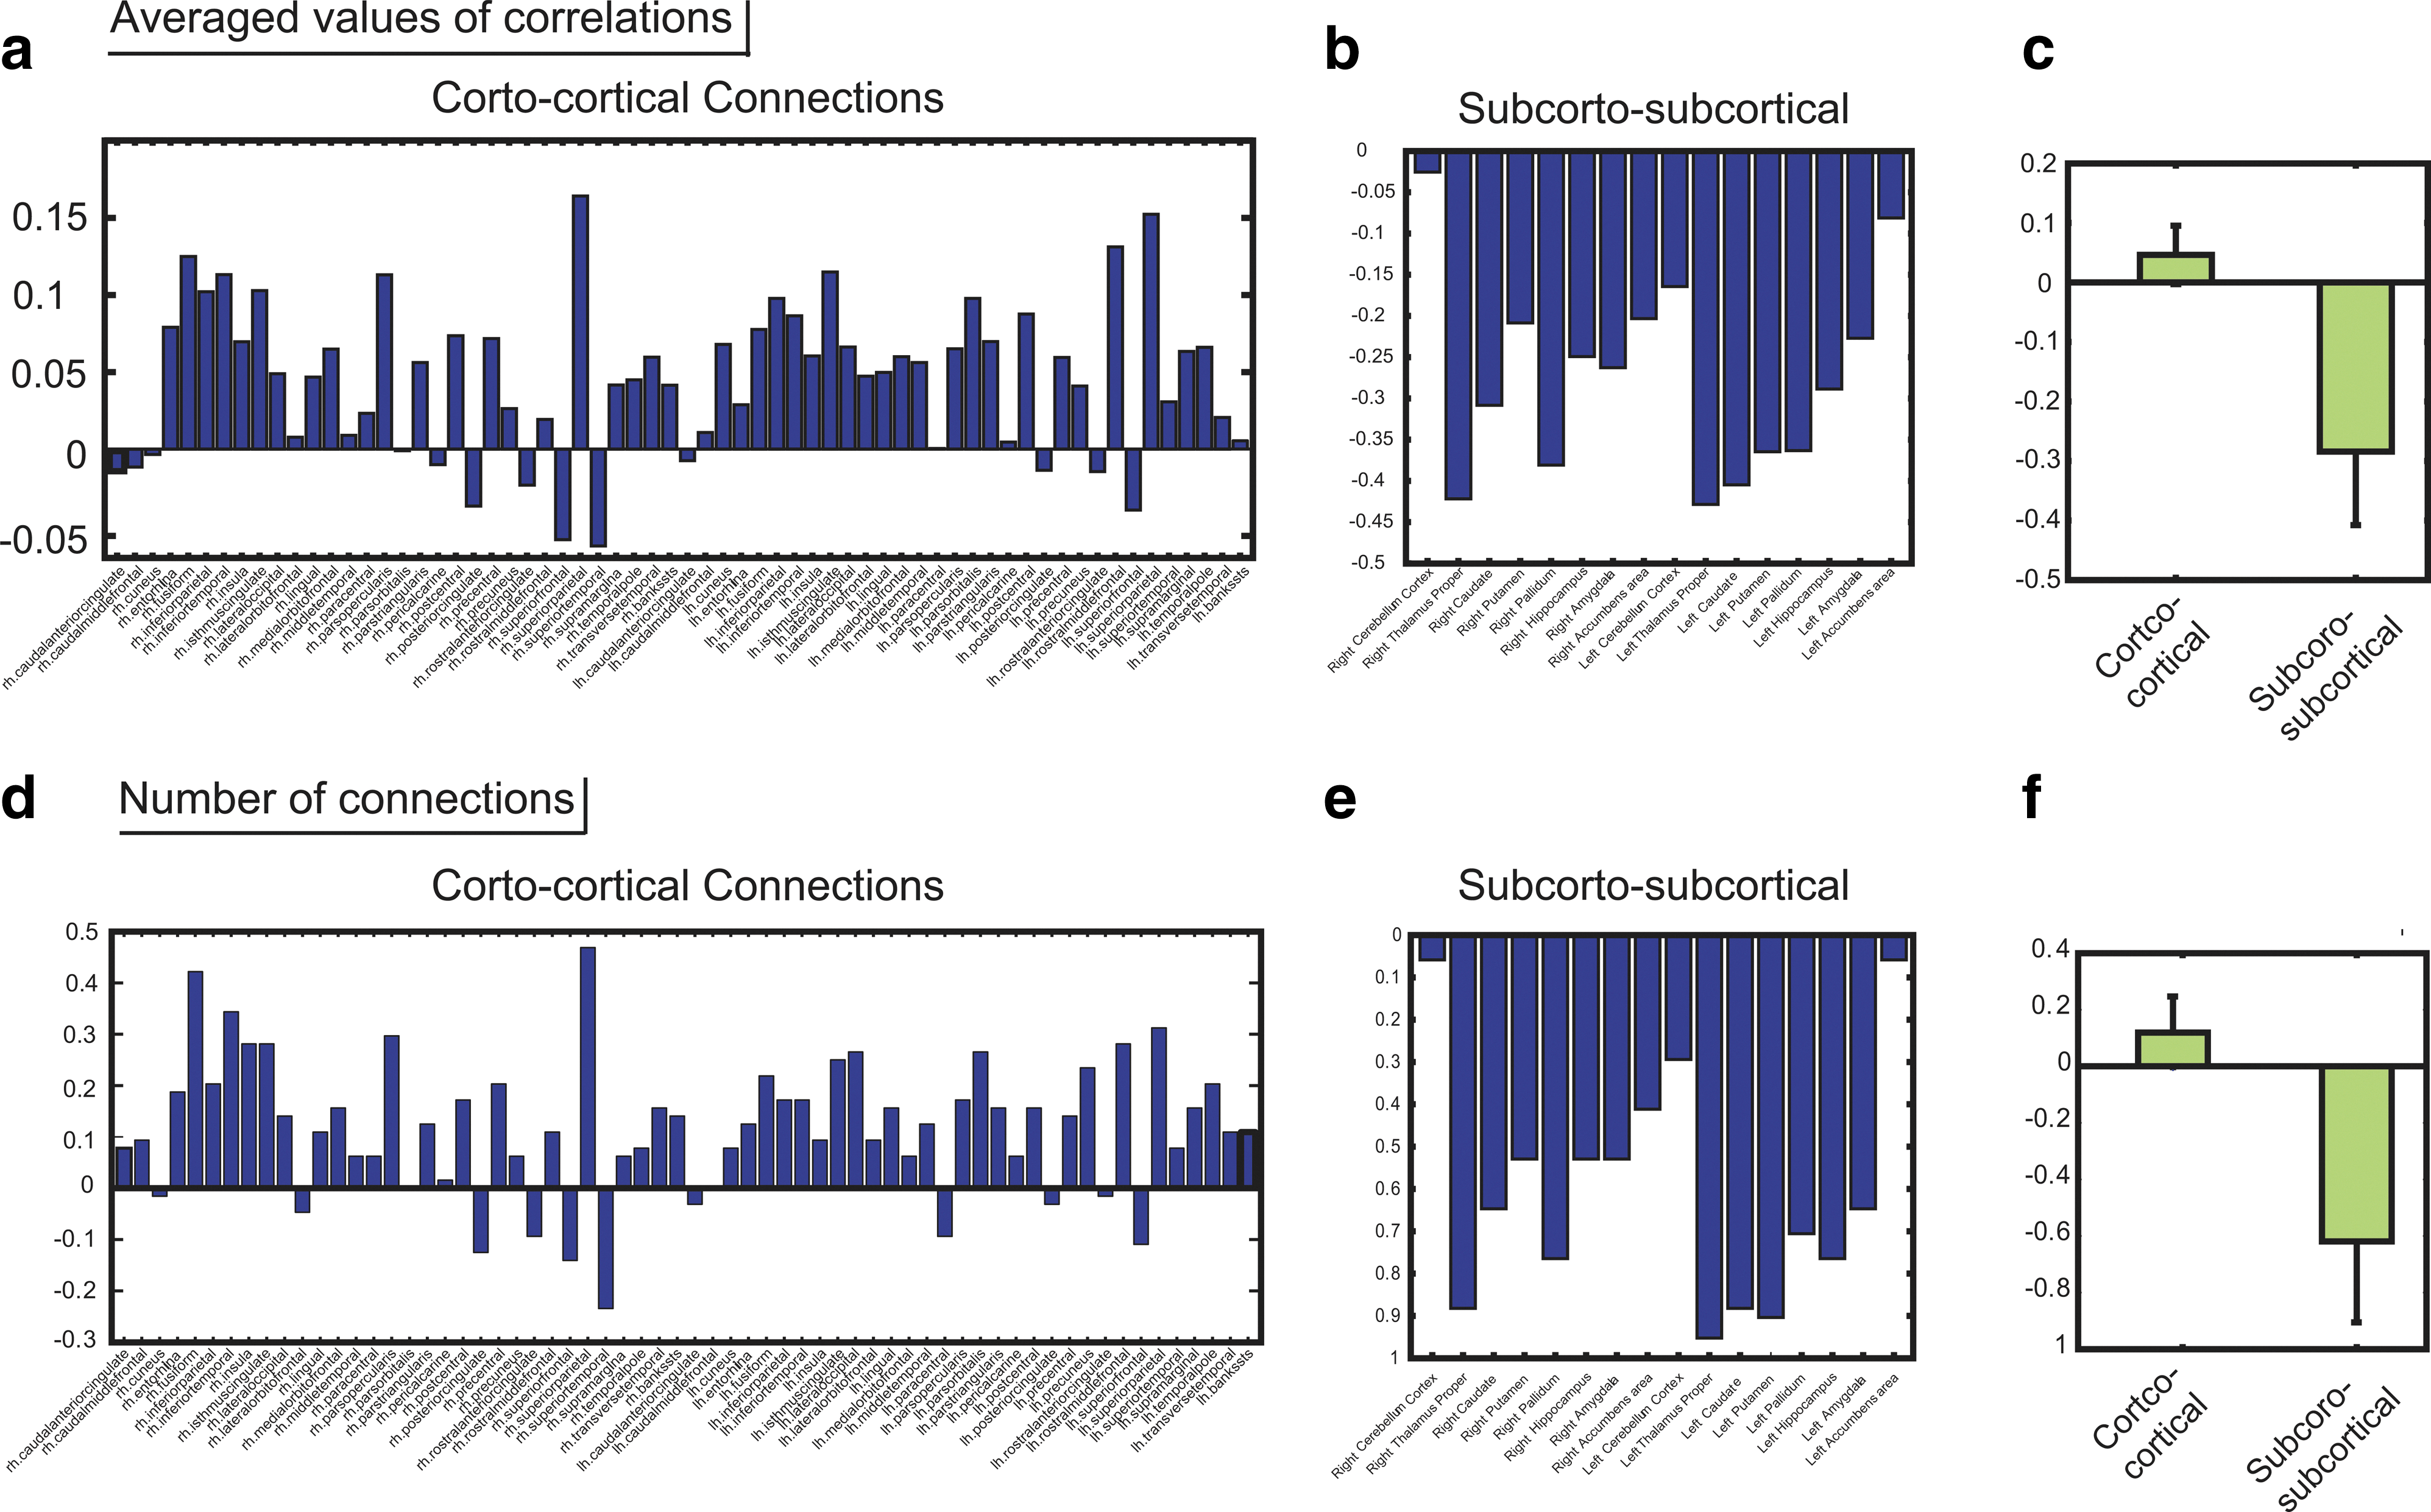
Comparison between cortical regions and subcortical regions.
Figure 8d was generated using (N +CN −N −CN )/N all , where N +CN is the number of positive CNs; N −CN is the number of negative CNs; and Nall is the number of all networks within the cortex. Figure 8e uses the same values in Figure 8d for connections within the subcortex, and Figure 8f depicts the comparison between results of the cortex and of the subcortices. These values represent the ratio of positive CNs to negative CNs for each node within the whole-brain network.
Remarkably, all subcortical regions showed negative values both in the average of the correlations and in the ratio of positive CNs to negative CNs within the network. In contrast, almost all cortical regions showed positive values in both cases. This result demonstrates the general property of the network, where all subcortical regions often strongly connect with negative CNs, and many cortical regions often strongly connect with positive CNs.
In addition, we determined if the significant correlation between the FA values and stabilities of perceptual alternations is caused by the overlapping of the fiber-tract bundles. One possible result is that correlations for two fiber-tract bundles should be closer when the number of overlapped voxels is larger. To evaluate how much more often two fibers are overlapped than an occasional case, we used the overlap index. The overlap index evaluates how much more often two fibers are overlapped than in the occasional case:
Here, Ntract 1 indicates number of voxels of a fiber-tract bundle (tract 1); Ntract 2 indicates number of voxels of another fiber-tract bundle (tract 2); Noverlap indicates number of voxels of overlapped regions of two fiber-tract bundles, N indicates total number of voxels of the whole brain; and Ntract 1/N or Ntract 2/N indicates the probability that voxels are included in tract 1 or tract 2 occasionally, and Ntract 1/N also indicates the probability that overlaps really occurred, as (Ntract 1/N) (Ntract 2/N) indicates the probability that an occasional overlap happens when voxels for tract 1 and tract 2 were selected randomly. The overlap index evaluates how much more often two fibers are overlapped than in the occasional case.
Figure 9 shows the contour map of the overlap index between two fiber-tract bundles. If the similarity of correlations between two fiber-tract bundles is caused by overlaps between two fibers, the white regions indicating a high overlap index may congregate around the diagonal line. However, the actual results showed no clear bias to diagonal components.
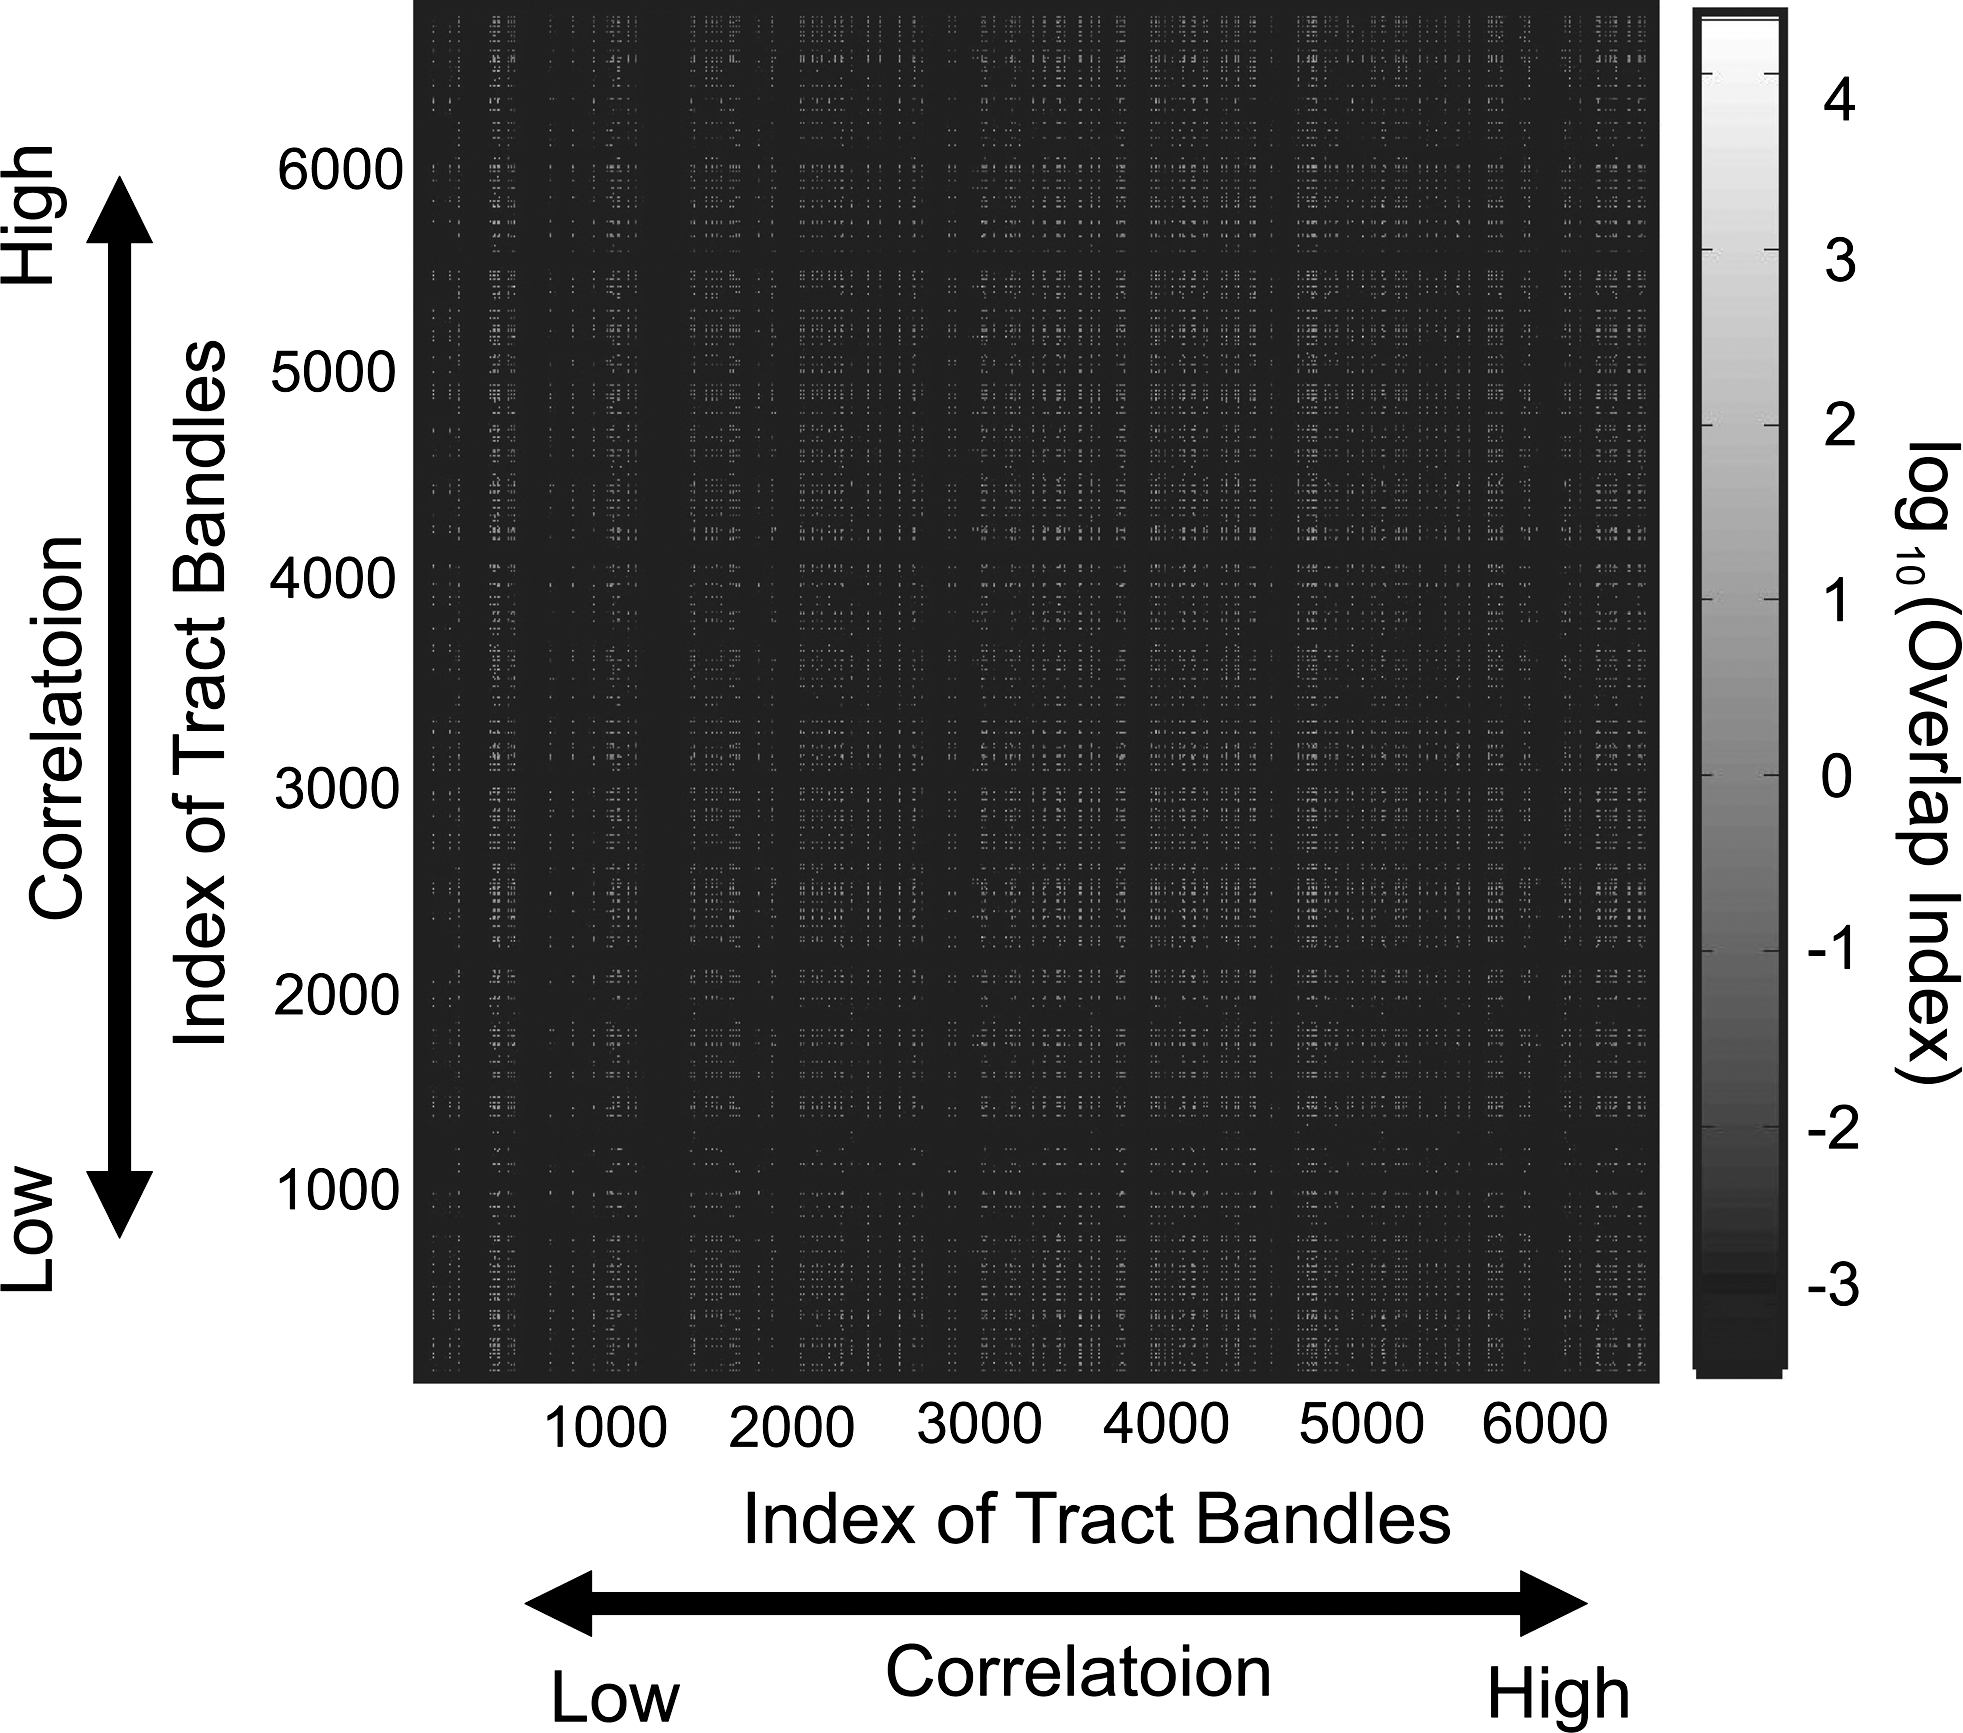
Color map of the overlap index between two fiber-tract bundles. The x- and y-axes correspond with correlations between the FA values of these two fiber-tract bundles and the stability of perceptual alternation. If the overlap is causing the artificial correlations, then the overlap index would be high around the diagonal regions.
Discussion
Summary of main findings
In this study, we asked how the structural brain network relates to the perceptual alternation in binocular rivalry. Three new trends of spatial mapping of the global architecture of the whole-brain structural network were revealed from evaluation of positive or negative correlations between averaged FA values on fiber tracts connecting between 84 brain structures and speeds of perceptual alternations. First, all averaged FA values of networks connecting between the subcortical regions showed stable negative correlations with alternation speed. Second, networks within almost all cortical regions showed positive correlations. Third, almost all other fiber-tract bundles showing negative correlation belonged to one central cluster of networks within the subcortical networks (Fig. 7). In the following subsections, we discuss the relationship of these findings to the global organization of the whole-brain structural network.
Cortical regions
In previous studies, the importance of the prefrontal and parietal regions in stabilization and acceleration of perceptual alternation has been reported (Kanai et al., 2010a; Sterzer and Kleischmidt, 2007; Windmann et al., 2006). Our study showed a significant correlation of connections between the prefrontal cortex and parietal cortex in relation to the speed of perceptual alternation. In the left hemisphere, the medial orbitoral cortex was found to be connected to the inferior parietal cortex through a strong negatively correlated network, and in the right hemisphere, the caudal medial frontal cortex was found to be connected with to the superior parietal cortex. These results suggested that the network can stabilize or destabilize by switching between negative or positive interconnections between the prefrontal cortex and the parietal cortex. In addition to these findings, our research showed that almost all the cortical regions are mainly connected with positive CNs (Fig. 8a, d). Further, we also found that almost all remaining negative CNs, which connected with the cortical regions, created one large cluster of connections with negative CNs that connect within the subcortical regions (Fig. 7).
Only one exception to these results was found in the bilateral inferior parietal regions; although the bilateral inferior parietal regions mainly connect with positive CNs, they also connect with strong negative CNs. (Fig. 7). These results are supported by previous findings from a region-based study (Kanai et al., 2010b). Although our network approach is new for visual perception, this network-based approach can detect the findings consistent with classical region-based analyses. The negative CNs of the inferior parietal regions did not connect with the big cluster of negative CNs that mainly consisted of the subcortical regions. This new finding suggests that the inferior parietal regions may be a locus within the cortex responsible for conflicts between bias toward stabilization and bias toward destabilization of perceptual alternation.
Subcortical regions
As demonstrated in 4.1., the subcortical regions are mainly connected with negative CNs. Within the global organization in the subcortical networks relating to stabilization, the thalamus connected most frequently with negative CNs and showed the largest negative averaged value of correlations (Fig. 8b, e). In previous studies, the importance of the thalamus in perceptual alternation has been reported (Haynes et al., 2005; Shimono, et al., 2011b; Winderlich, et al., 2005); however, high negative correlations and a high rate of connection with negative CNs were also found in the caudate, putaman, and pallidum etc. (Fig. 8b, e). All of these brain regions connect with each other as one large cluster (Fig. 7). Future studies may provide new opportunities for a deeper understanding of whole information processing of the perceptual alternation phenomenon through interconnections between these various subcortical regions.
Further evaluation of DTI
In Figure 9, we show how the number of overlaps existing between two fiber tracts influences their correlations. If the overlaps caused similarities of correlations between two fiber-tract bundles, then a high overlap index should be observed around the diagonal regions. However, the densities of overlaps at nondiagonal regions were similar to the densities around the diagonal regions. Therefore, the significant correlations between FA values and stability of perceptual alternations were caused by overlaps between fiber-tract bundles. The mean diffusivity (MD) values were also evaluated using the same method used in this report. However, the MD did not show stable results between the two separated experiments performed on each of the individual participants (data not shown).
Although FA values are often used to represent the information transmission efficiency or integrity of white-matter fibers, it is not completely understood what the FA value physiologically represents, because the FA value is influenced by many physiological factors, such as myelination, axon diameter, axon density, and ultrastructure (Beaulieu, 2002).
Remarks and perspectives
This study revealed, for the first time, the global organization of the brain networks relating to stabilization and destabilization of perceptual alternation. An understanding of the general contrast between the contribution of the cortical regions to destabilization and the contribution of the subcortical regions to stabilization of perceptual alternation will lead to a clearer understanding of interactions of many local brain regions. The approach of directly treating the global organization of the networks interconnecting various parts of the brain will be effective in understanding the complex organization of the brain related to various cognitive tasks.
Footnotes
Acknowledgments
M.S. is grateful to Olaf Sporns for important comments on this document, Ryusuke Hayashi to his fruitful discussion, Daich Nozaki for his many supports to accomplish this research, and Doris Zakian for fruitful comments in writing this document. This research was supported by Grants-in-Aid for JSPS fellow to M.S. and Grants-in-Aid for Scientific Research (20240026) to K.N.
Author Disclosure Statement
No competing financial interests exist.