
Abstract
Owing to conflicting results of the association between body composition and bone mineral density (BMD), we investigated the relationship between fat mass (FM), lean mass (LM), and BMD in New Zealand postmenopausal women. We hypothesized that increased LM will indicate a higher BMD. A cross-sectional study was performed examining the associations between body composition, anthropometric measures, activity energy expenditure, and bone health status (using dual-energy X-ray absorptiometry [DXA]). A total of 127 healthy postmenopausal women aged between 54 and 81 years. Both FM and LM were significantly associated with BMD at all sites. However, LM, not FM, was the strongest predictor of femoral neck (FN) BMD (β = 0.497, p < 0.001), hip BMD (β = 0.495, p < 0.001), spine BMD (β = 0.449, p < 0.001), and whole body BMD (β = 0.406, p < 0.001). Age was negatively associated with FN and hip BMD. LM was positively associated with FN, spine, hip, and whole body BMD. Our findings suggest the need to increase LM rather than FM highlighting the importance of physical activity for this age group.
Introduction
Postmenopausal osteoporosis is a disease of public health concern and due to its debilitating nature affects the aged, especially elderly women. Osteoporosis in postmenopausal women is associated with a reduction in estrogen levels, which consequently results in the acceleration of bone fragility and fracture. 1 The World Health Organization (WHO) defines osteoporosis as a disease that is characterized by low bone mass and microarchitectural deterioration of bone tissues, leading to bone fragility and increased fracture risk. The diagnosis of osteoporosis according to WHO may be obtained from one or more of the following regions: total hip, femoral neck (FN), and lumbar spine (LS). 2
The disease state may result in fracture, which could subsequently lead to lack of independence and mobility. Body composition is an important part in the determination of bone mineral density (BMD) and bone mineral content (BMC) as well as osteoporotic status. Body weight tends to have the capacity to elevate bone mineral status due to its ability to exact mechanical force and action on the host. Lean mass (LM), fat mass (FM), and bone mass are the three components of body weight found to be associated with bone status. 3 LM, FM, bone mass, and water together accounts for ∼90–95% of the body weight. 4
Many epidemiological studies have reported and suggested that both FM and LM may affect bone mass status especially in the aged group.5,6 Adipose tissue is metabolically active; therefore, its effects on the bone or skeleton may be regulated by the weight-bearing effect as well as nonweight-bearing effects. 5 Examples of the nonweight-bearing effect include the hormonal metabolism of the adipocytes, such as leptin, insulin-like growth factor 1, and several cytokines. It has thus been reported to a degree of conclusion that weight-bearing and resistance-type physical activity has a positive effect and can serve as a measure for the prevention of osteoporosis.5,7
Studies have had a controversial report on whether being overweight and obese results in a detrimental or protective effect on bone health. Both fat and bone cells originate from the same bone marrow stem cells,8,9 and it is well known that physical inactivity and ageing induces both obesity and osteoporosis. 10 In addition, these two disorders synergistically induce functional impairments and physical disabilities, which suggest a complex effect of obesity on bone health. The protective effect of obesity on bone mass has, therefore, been termed “obesity paradox” or “reverse epidemiology.”5,11
The comparative contribution of the body fat and LM (or fat-free mass) to BMD variation has been controversial based on the original research findings available. Some studies12–14 have reported that LM, not FM, is associated with bone mass, whereas others5,15 have found that FM, not LM, is important in the determination of BMD. Whereas some have indicated that both FM and LM can equally serve as a predicting factor for BMD. 16 Furthermore, some studies have reported that LM is of more importance than FM in premenopausal women and FM is more significant than LM in postmenopausal women.17,18 However, other studies have shown that LM was associated with BMD in both pre- and postmenopausal women.8,19 Furthermore, some studies made an observation that FM was associated with BMD in men <50 years; meanwhile, this was not the case in women and men >50 years. 5 The inconsistency in the findings may be due relatively to methodology and inadequately powered study design. Altogether, Ho-Pham et al. 6 suggested that age, ethnic group, and gender play a major role in the relative contribution of body composition parameters to BMD as well as the site of measurement.
Owing to the presence of conflicting findings in the relationship between body composition and bone density, this study will shed light in terms of New Zealand postmenopausal women's perspective. Two research questions guided this study: (1) How are body composition measures such as fat or LM related to regional and whole body measures such as femoral, hip, spine, and whole body BMDs? (2) How does these regional and whole body measures relate to anthropometric variables such as weight and body mass index (BMI) as well as quantitative ultrasound sonometry (QUS) T-score and the activity energy expenditure (AEE)?
Materials and Methods
Study design
A total of 127 postmenopausal women aged between 54 and 81 years participated in the “Bugs‘n’Bones” study that took place in the Human Nutrition Research Unit of Massey University, Palmerston North campus from June to December 2017. Sample size was calculated using G*Power software version 3.0.10 and 88 subjects were required for a 90% power and an α of 5% for t-test. A total of 150 was required based on osteoporosis incidence ratio of 3:1 in women. In this cross-sectional study, two subjects were excluded from the study, one due to a ketogenic diet and the other due to health conditions. Subjects were recruited by advertisement on campus, the Whanganui Chronicle, and by using a recruitment agency, Trial Facts (https://trialfacts.com/). The inclusion criteria were confirmed as menopause of at least 5 years based on no menstruation. Exclusion criteria were presence of any systemic disease, food intolerances that affect the gastrointestinal tract, smokers, and high intake of alcohol. Subjects with significant weight loss or weight gain within the past year were excluded. All participants completed the New Zealand Physical Activity Questionnaire (NZPAQ) 20 and the AEE was calculated. All subjects were free living and apparently healthy. Written informed consent was obtained from subjects before commencing data collection. The study was registered with the Australian New Zealand Clinical Trials Registry with the number ACTRN12617000802303. This study was also approved by Massey University Human Ethics Committee: Southern A, Application 17/17, following the Helsinki Declaration of 1975, as revised in 2008.
Anthropometric and body composition measurements of the subjects
Body weight of subjects was measured using the Detecto 437 eye-level weigh beam physician scale to the nearest 0.2 kg and standing height was measured using a stadiometer to the nearest 0.1 cm wearing light clothes and no shoes on. The BMI was calculated as weight divided by height squared (kg/m 2 ). Waist to hip ratio was determined by measuring the waist circumference (WC) and hip circumference (HC) to the nearest 0.1 cm using a nonstretchable tape. Waist to hip ratio was calculated as a marker of abdominal obesity. Stiffness index, QUS T-score, and Z-score of the nondominant heel scan were measured using the GE Lunar Achilles II Portable Bone Densitometer.
Body composition measurements, FM, LM, and fat percentage were measured and analyzed using the Hologic QDR series Discovery A Bone densitometry (dual-energy X-ray absorptiometry [DXA]). BMD was measured at the FN, LS (L1–L4), trochanter, Ward's triangle, and total hip. The DXA machine was calibrated every morning for all the measurements and at the end of each day. The in vivo reproducibility of the coefficient of variation ranged between 0.34% and 0.70% for all measured sites. The reported BMD values were calculated as means of four measured values from L1 to L4. Apex System Software version 4.5.3 was used for analyzing the DXA scans. Osteoporosis was defined as a T-score ≤2 · 5 and osteopenia as T-score between −1.0 and −2.5 according to the WHO criteria. 2
Statistical analyses
IBM SPSS version 25 (IBM Company, Armonk, NY) was used for all statistical analyses. The outcome variables used were BMD of whole body and at skeletal sites. The values of all variables for the whole body and regional sites were presented as mean (M) ± standard deviation (SD). Comparisons of the mean values of two groups of healthy and osteopenic/osteoporotic subjects classified according to their spine T-scores were analyzed by independent t-test as parametric variables. The mean difference of other groups of subjects with BMI <25 kg/m 2 and BMI ≥25 kg/m 2 were compared using independent t-test. Correlation analyses of the whole body, regional sites BMD, and T-scores with the independent variables such as age, weight, BMI, AEE, and QUS T-score were performed to obtain the Pearson's correlations. Stepwise multiple linear regression analysis was used to obtain the determinants/predictors for the outcome variables. All p-values were reported significant at 0.05 or less.
Results
Table 1 shows the demography, body composition, and lifestyle characteristics of the 125 women studied. The BMI of the women ranged from 14.9 to 44.0 kg/m 2 . According to the WHO classification, 2.4% of the women were underweight, 34.4% were of normal weight, 48% were overweight, and 15.2% were obese.
AEE, activity energy expenditure; BMC, bone mineral content; BMD, bone mineral density; BMI, body mass index; FN, femoral neck; HC, hip circumference; Max, maximum; Min, minimum; QUS, quantitative ultrasound sonometry; SD, standard deviation; TFM, total fat mass; TLM, total lean mass; WC, waist circumference.
Figures 1–3 show the spine BMD, hip BMD, and stiffness index with respect to the quartile distributions of LM. The BMD and stiffness index increased linearly with an increase in LM in all the three instances.

Relationship between spine BMD and LM tertiles. BMD, bone mineral density; CI, confidence interval; LM, lean mass.

Relationship between hip BMD and LM tertiles.
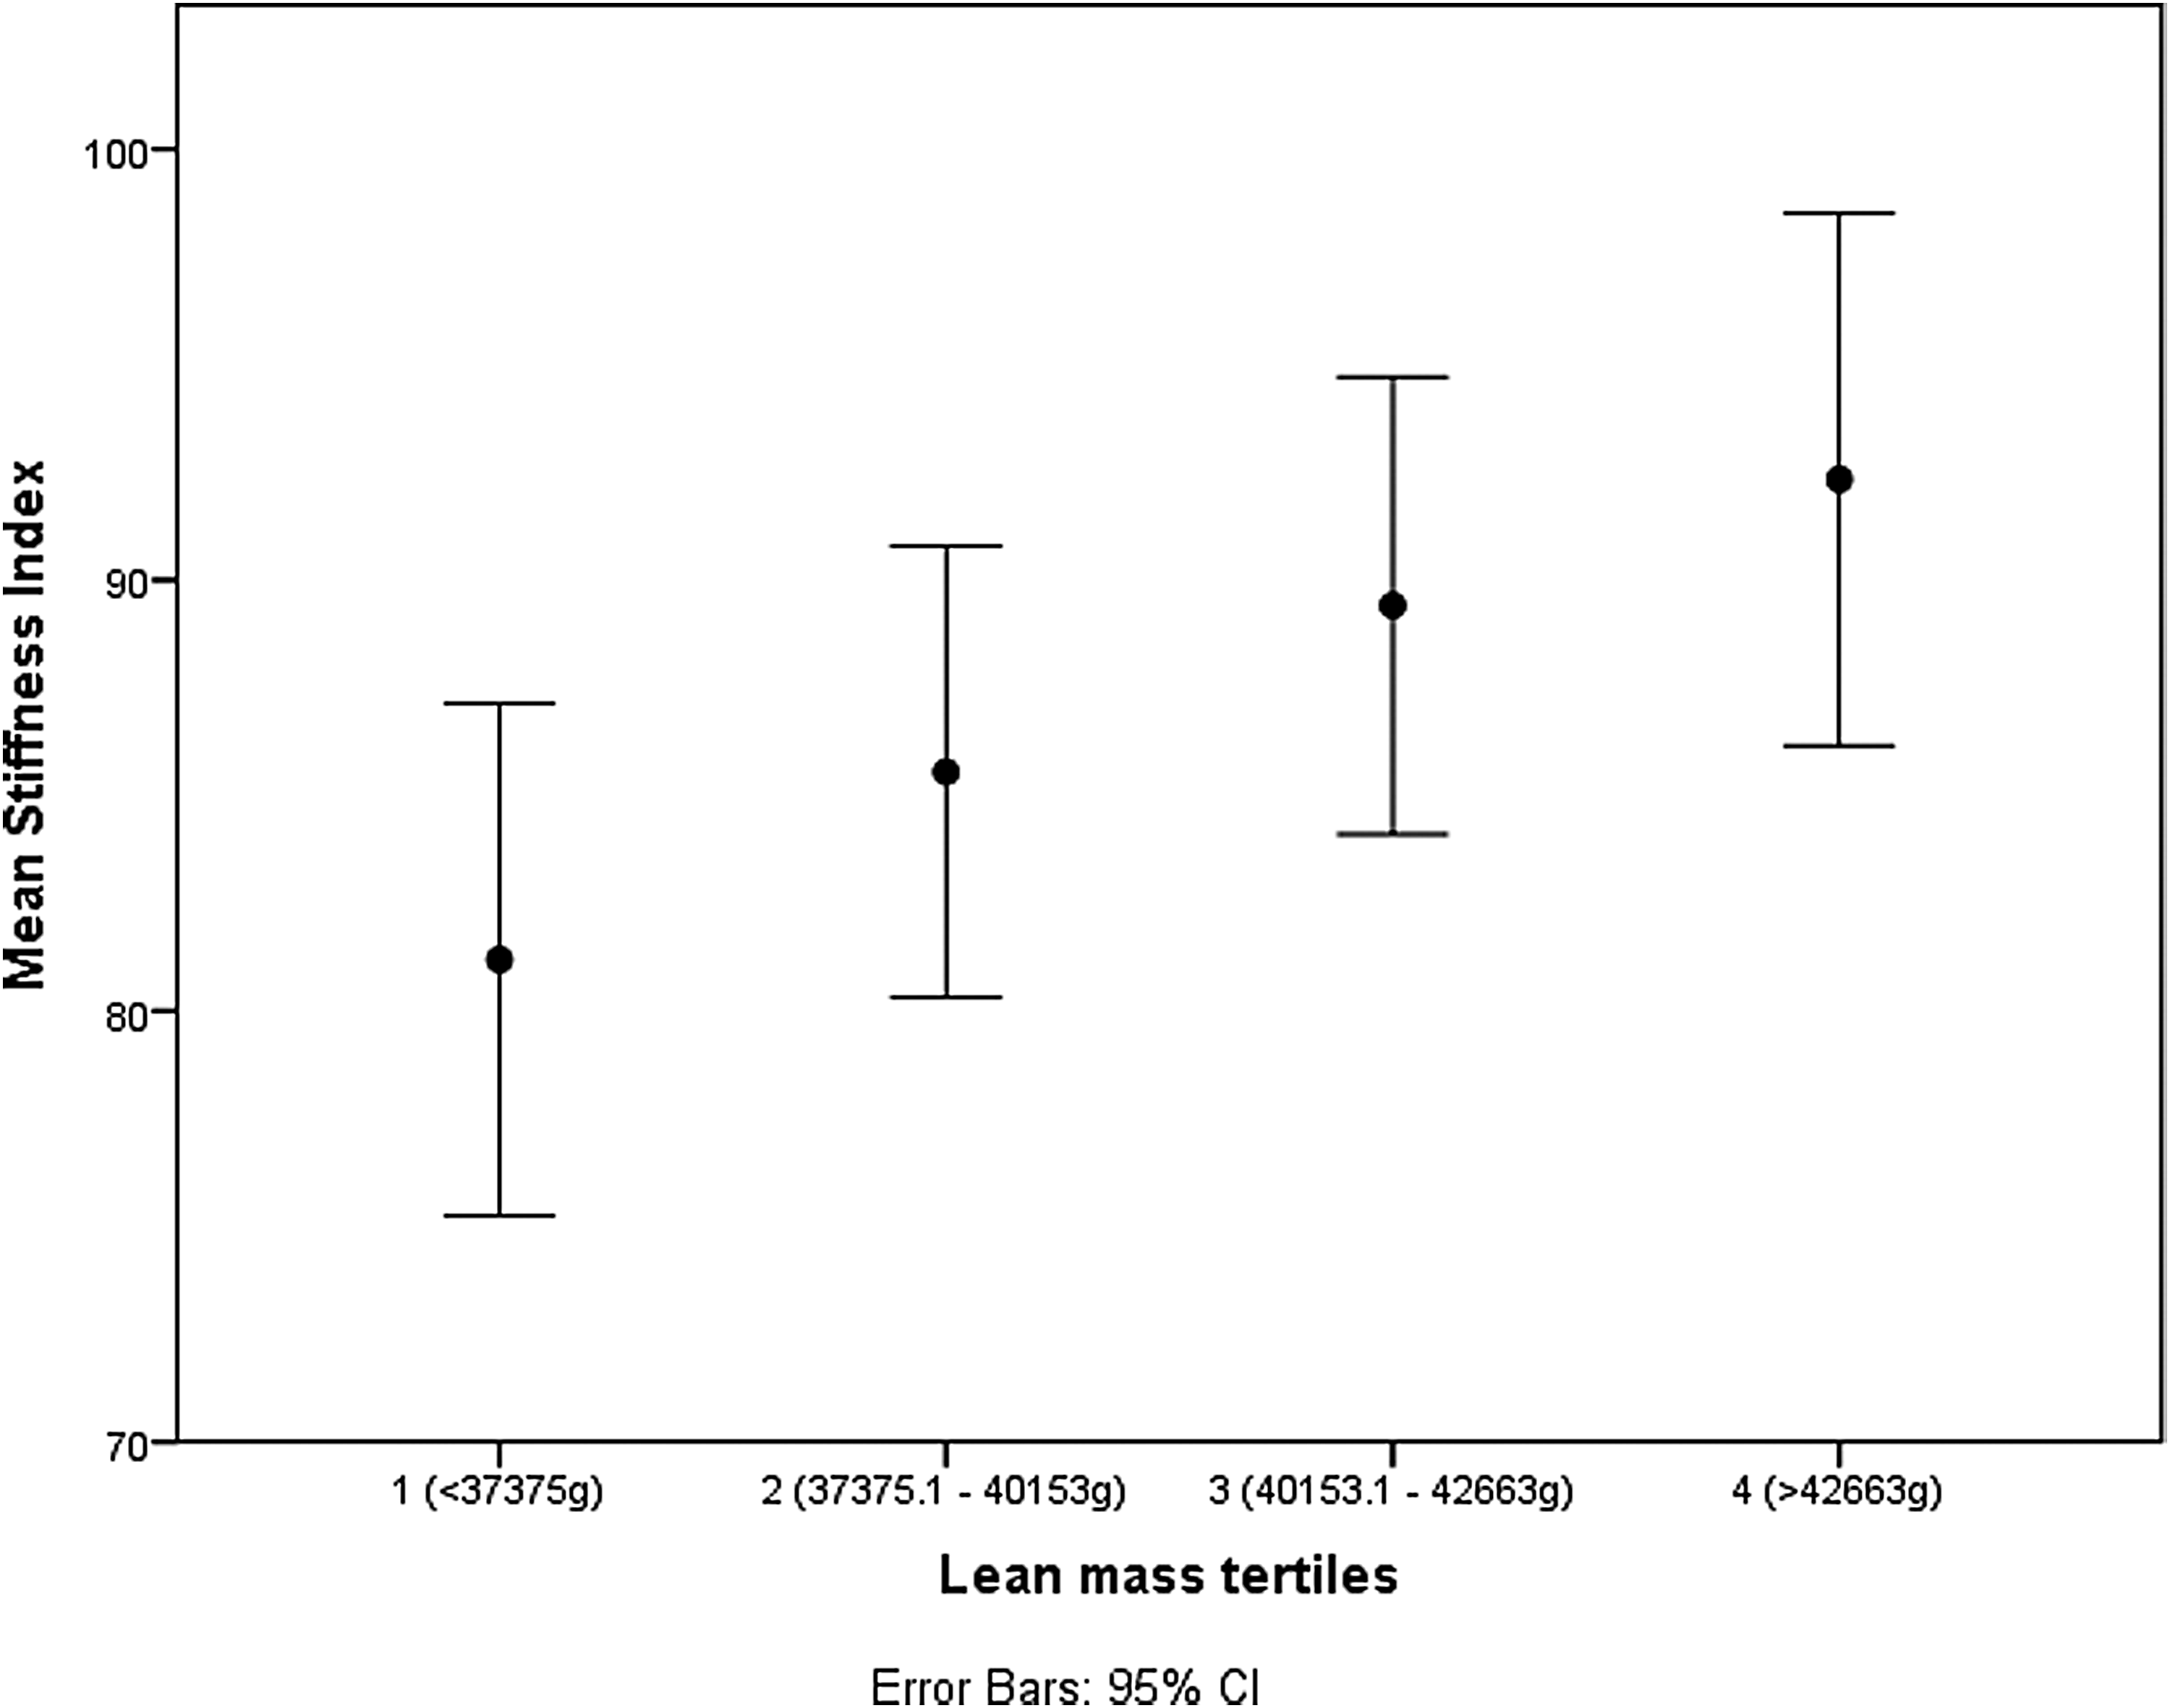
Relationship between stiffness index and LM tertiles.
In Table 2, to test the hypothesis that osteopenic/osteoporotic and women with normal bone mass have equal mean body compositions, an independent t-test was performed. In this selected population, based on the T-score, there were 60 women with normal bone mass (T-score ≥ −1.0) and 65 women with osteopenia/osteoporosis (T-score < −1.0). The osteopenic/osteoporotic group of women were slightly older, shorter, and thinner. They had lower BMC, BMD, bone area, body mass, body mass components, and AEE than the healthy women (Table 2). Osteopenic/osteoporotic women (M = 62.9, SD = 4.0) and those with normal bone mass (M = 62.3, SD = 5.0) did not differ significantly according to their age (t[123] = −0.74, p = 0.463). Conversely, concerning FM and LM, osteopenic/osteoporotic women (M = 26.7, SD = 7.6 and M = 38.8, SD = 3.6) and women with normal bone mass (M = 32.2, SD = 8.2 and M = 42.6, SD = 4.6) were significantly different; t(123) = 3.87, p < 0.001 and t(123) = 5.11, p < 0.001, respectively.
Similar to Table 2, a t-test was performed to observe the contribution of BMI to LM and FM. A total of 79 women with BMI ≥25 kg/m2 had significantly higher weight, BMI, WC, HC, BMC, BMD, and T-score but lower AEE than those with a BMI <25 kg/m2 (n = 46) as can be observed in Table 3. Women with BMI ≥25 kg/m2 (FM [M = 33.9, SD = 6.2] and LM [42.0, SD = 4.3]) had significantly higher body compositions than those with BMI <25 kg/m2 (FM [M = 21.5, SD = 4.9] and LM [M = 38.3, SD = 4.0]); FM, t(123) = −11.50, p < 0.001 and LM, t(123) = −4.72, p < 0.001 (Table 3).
In Table 4, there were positive correlations between the body composition variables and all the BMD measures at different sites as well as the QUS T-score. Negative correlations were observed with the women's age and all the BMD measurements and QUS T-score. In contrast, LM had higher significant positive correlations with BMD at all sites than FM. Likewise, high significant positive correlations were observed for weight and all BMD sites.
p < 0.05; **p < 0.01; ***p < 0.001 (one tailed).
FM, fat mass; LM, lean mass; ns, not significant.
Finally, to test if LM, FM, age, BMI, and AEE significantly predicted BMD at all sites in Table 5, multiple regression was used. The analysis shows that LM accounts for 24.7% of the variation in FN BMD (F[1, 123] = 40.3, p < 0.001). Furthermore, the introduction of age explains an additional 5.4% of the variation (F[2, 122] = 26.3, p < 0.001). For hip BMD, observations in Table 5 show that three predictors explained 35.5% of the variance (F[3, 121] = 22.2, p < 0.001). It was found that LM significantly predicted hip BMD (β = 0.348, p < 0.001) as did FM (β = 0.275, p < 0.01) and age (β = −0.219, p < 0.01). Similarly, three predictors explained 28.5% of the variation for the spine BMD (F[3, 121] = 16.0, p < 0.001). LM significantly predicted spine BMD (β = 0.243, p < 0.05) as well as BMI (β = 0.325, p < 0.01) and AEE (β = 0.196, p < 0.05). Conversely, only LM explained 16.5% of the variability in whole body BMD (F[1, 123] = 24.3, p < 0.001). The LM significantly predicted whole body BMD (β = 0.406, p < 0.001).
CI, confidence interval; SE, standard error of the coefficient.
Discussion
The results from this study indicate that there is a strong positive correlation between weight, BMI, and regional (FN, hip, and spine BMD), whole body BMD as well as the QUS T-score. Similarly, AEE was positively correlated with QUS T-score but not with the regional and whole body BMDs. LM, not FM, was found to be the strongest predictor of BMD at the regional sites and whole body. The multiple regression analysis showed that LM had significant positive regression weights, indicating that individuals with higher LM will be expected to have higher BMDs at all regional sites and whole body even after controlling for other variables in the model.
The BMI of the participants in this study is comparable to that of “A Focus on Nutrition: Key Findings of the 2008/09 New Zealand Adult Nutrition Survey.” 21 According to WHO, 29.6% of adult females in Western Pacific are overweight compared to 24.1% in Southeast Asia and 60.9% in the Americas. 22 In comparison with corresponding statistics, 29% of women in India, 27% in Oceania, and 12.1–17.6% in Latin America are osteoporotic. 23 Although the populations need to be considered, the trend shows people with lower BMI are more likely to have bone health issues.
In this study, obesity was positively associated with bone mass. Meanwhile, age was identified as a copredictor for FN and hip BMD, likewise BMI and AEE for spine BMD. Similarly, Salamat et al. 24 found a positive correlation between BMD and BMI indicators, giving additional evidence for the obesity paradox. Some studies have reported that obesity is positively associated with high bone mass25,26 probably as a result of the increased levels of hormones such as leptin, insulin, and estrogen that are known to induce bone growth and inhibit the bone remodeling process. Other studies, however, have reported that obesity was negatively associated with bone mass,5,27 possibly due to the differences in patterns and occurrence of obesity, fat distribution, and osteoporosis in men and women, and between pre- and postmenopausal women. 6
Furthermore, the results of this study show that LM alone accounts for 24.7% of FN, 24.5% of hip, and 20.2% of the spine BMDs' variability. These findings are similar to that of Casale et al. 13 and Sotunde et al. 12 in Pacific Island and black South African women, respectively, indicating that LM is the strongest predictor of BMD. Our result also suggests that LM is more positively correlated with bone mass than the adipose tissue. A study by Povoroznyuk et al. 28 in Ukraine presented a similar result showing a positive correlation between the total lean mass (TLM) and FN and spine BMD for women in the middle and late postmenopausal period. In addition, a study of postmenopausal women by Gnudi et al. 7 shows that TLM and total fat mass were associated with BMD, BMC, and height-independent BMD in postmenopausal women. Similar results were also observed in a study by Wang et al. 29 ; they found LM had a greater effect on BMD than FM in young women.
However, results of this study are contrary to previous studies by Reid et al.,30–32 suggesting that the relationship between LM and BMD are artifacts. The differences in these results, however, could be explained by the meta-analysis of Khosla et al., 8 which found that both lean body mass and fat body mass have important effects on bone mass, depending on the bone mass parameter used, the skeletal site measured, and menopausal status.
Limitations of this study include its cross-sectional design and setting, thus preventing causal relationships and generalization. The method of assessing physical activity was NZPAQ; however, bone-specific physical activity questionnaire has current and past bone-related exercises. Furthermore, there was lack of other contributors and predictors of bone status such as diet, nutrients, and vitamin D.
Conclusion
In conclusion, our findings suggest that LM is the strongest predictor of BMD at all sites. It is important that when considering prevention and/or management of osteoporosis, LM should be the target for improvement rather than FM reduction. In addition, it emphasizes the significance of the accumulation of LM rather than FM in this age group. These findings will bring about further novel clinical research on the mechanisms by which LM regulates bone mass.
Footnotes
Acknowledgments
The authors thank the supporting staff (Anne Broomfield, Shampa De, and Gabby Plimmer), the participants of the “Bugs‘n’Bones” study, and particularly the funders: (1) Riddet CoRE; the scholarship of B.L.I.-O. and this research was supported by the Riddet Institute, a New Zealand Centre of Research Excellence, funded by the Tertiary Education Commission, and (2) Palmerston North Medical Research Foundation.
Author Disclosure Statement
No competing financial interests exist.