
Abstract
The genes coding for human (h) chorionic somatomammotropin (CS), hCS-A and hCS-B, and placental growth hormone (GH-V), hGH-V, are located at a single locus on chromosome 17. Efficient expression of these placental genes has been linked to local regulatory (5′ P and 3′ enhancer) sequences and a remote locus control region (LCR), in part, through gene transfer in placental and nonplacental tumor cells. However, low levels of endogenous hCS/GH-V transcripts are reported in the same cells compared with term placenta, suggesting that chromatin structure, or regulatory region accessibility, versus transcription factor availability contributes to the relatively low levels. To assess individual hCS-A, CS-B, and GH-V gene expression in placental and nonplacental tumor cells and the effect of increasing chromatin accessibility by inhibiting DNA methylation and histone deacetylation using 5-aza-2′-deoxycytidine (azadC) and trichostatin A (TSA). Low levels of hCS-A, CS-B, and GH-V were detected in placental and nonplacental tumor cells compared with term placenta. A significant >5-fold increase in activity was seen in placental, but not nonplacental, cells transfected with hybrid hCS promoter luciferase genes containing 3′ enhancer sequences. Pretreatment of placental JEG-3 cells with azadC resulted in a >10-fold increase in hCS-A, CS-B, and GH-V RNA levels with TSA treatment compared with TSA treatment alone. This effect was specific as reversing the treatment regimen did not have the same effect. An assessment of hyperacetylated H3/H4 in JEG-3 cells treated with azadC and TSA versus TSA alone revealed significant increases consistent with a more open chromatin structure, including the hCS 3′ enhancer sequences and LCR. These observations suggest that accessibility of remote and local regulatory regions required for efficient placental hGH/CS expression can be restricted by DNA methylation and histone acetylation status. This includes restricting access of the hCS 3′ enhancer sequences to available placental enhancer transcription factors.
Introduction
Eukaryotic gene expression is affected by changes in chromatin configuration through histone and DNA modifications.1,2 Activation of placental members of the human (h) growth hormone (GH) and chorionic somatomammotropin (CS) gene family during placental development is facilitated by histone H3 and H4 (H3/H4) hyperacetylation as well as distal regulatory elements and a remote locus control region (LCR) that possesses enhancer activity.3–7 An assessment of DNA methylation in the hGH/CS gene locus suggested that undermethylation may also play a role in hGH/CS gene expression in placental versus nonplacental leukocytes. 8
The four placental GH/CS genes (hGH-V, hCS-A, hCS-B, and hCS-L) are located at a single locus on chromosome 17 with the pituitary GH gene (hGH-N); they share greater than 90% nucleotide sequence similarity. 9 The hGH-V gene codes for placental GH, and both hCS-A and hCS-B independently code for the same polypeptide hormone, CS (or placental lactogen), while hCS-L is a pseudogene.10–12 Both hCS and hGH-V are synthesized and secreted by syncytiotrophoblasts of the placental villi. 11 Expression of the hCS/GH genes in placental cells has been linked to multiple regulatory regions, including hypersensitive sites (HS) III–V located remotely upstream in the LCR, P sequences located distally upstream of all four hCS/GH-V genes, and enhancer (3′-Enh) sequences located downstream of each hCS gene.7,13–18 Expression of hCS is high during pregnancy (grams of protein/day in the latter stages), and it has been reported that the genes can be differentially expressed during pregnancy.12,19 Levels of hCS/GH-V correlate with placental development and mass during pregnancy, and these pregnancy-specific hormones may help to control insulin sensitivity in normal pregnancies through positive effects on pancreatic β-cell mass.20–22
Assessment of hCS/GH-V gene regulatory regions has depended largely on the availability and use of human placental JEG-3, JAR, and BeWo choriocarcinoma cell lines. These cells express the hCS/GH-V genes, but at much lower levels relative to human term placenta.23,24 This correlates with a more open chromatin configuration of the hCS/GH-V gene locus in term placenta based on nuclease sensitivity studies. 25
Hyperacetylation of histones and demethylation of DNA are often linked to a more open chromatin configuration. 2 This increases accessibility and recruitment of transcription factors, including RNA polymerase II, and as a consequence gene expression. 26 The effect of histone deacetylase (HDAC) or DNA methyltransferase inhibition on GH/CS RNA levels has not been reported; however, HDAC inhibitor, trichostatin A (TSA), and the hypomethylating agent, 5-aza-2′-deoxycytidine (azadC), have been used to promote an open chromatin configuration and look at effects on gene expression in placental cells and explants.27–31 There is also evidence of ectopic production of hGH/CS transcripts in nonplacental tissues and tumor cell lines, including from the breast.32–37 However, the identity of the specific hGH/CS genes expressed and the basis for expression is not well understood.
In this study, we compare individual hCS-A, hCS-B, and hGH-V RNA levels in placental and nonplacental cell lines relative to term placenta. We also use azadC and TSA to explore the possibility that changes in DNA methylation and/or histone acetylation status can differentially affect hGH/CS gene expression in placental and nonplacental cells.
Materials and Methods
Human term placenta samples
Human term placenta (HTP) samples were obtained after approval of the Health Research Ethics Board at the University of Manitoba from women with a body–mass index (BMI) of 20–25 kg/m2. BMI was assessed based on the prepregnancy weight.
Cell culture and treatment with inhibitors
Human placental BeWo, JAR, and JEG-3 cells, as well as mammary gland MCF-7, and T47D, cervical HeLa, endometrial HEC-1-A, and brain U-87 tumor cells were obtained from the American Type Culture Collection. Cells were grown in monolayer on 100-mm culture dishes in RPMI 1640 (JEG-3, JAR, BeWo) or DMEM (MCF-7, T47D, HEC-1-A, HeLa, U-87) supplemented with 10% (v/v) fetal bovine serum and antibiotics (10 IU/mL penicillin, 10 mg/mL streptomycin). Cells were incubated in humidified atmosphere of 95% air and 5% CO2. For nontreatment studies, cells were normally harvested when 80% confluent.
For DNA methylation and/or HDAC inhibition, cells (3 × 10⁵/35-mm plate) were grown for 24 h, then fed with medium containing 5–50 μM azadC or 10–100 nM TSA for 24 and 18 h, respectively, before harvesting. For sequential treatment, cells were fed the medium with either (1) 50 μM azadC for 24 h, then refed with medium containing 100 nM TSA for 18 h; or (2) 100 nM TSA for 18 h, and then refed with medium containing 50 μM azadC for 24 h. As controls, cells were treated with a corresponding dose of dimethyl sulfoxide (DMSO) vehicle for comparison in all cases, or for single treatments with 50 μM azadC or 100 nM TSA, for the corresponding period during the sequential treatment regimens.
RNA analysis
Total RNA was extracted using the QIAshredder and RNeasy Plus Mini kit (Qiagen). For reverse transcriptase–polymerase chain reaction (RT-PCR), 1 μg of RNA per reaction was reverse transcribed by the QuantiTect Reverse Transcription kit according to the manufacturer's instructions (Qiagen). Minus RT reactions were also done to assess genomic DNA contamination. For PCR, 4% (HTP) or 40% (cell lines) of RT reaction mixture was used with specific primers (Table 1). Detection of a 250 bp product common to all five members of the hGH/CS family was assessed using specific primers spanning exon 3 and exon 4 (Table 1) at an annealing temperature of 47°C for 30 cycles, as described. 23 The presence of unspliced hGH/CS transcript or genomic DNA is detected as a 341–343 bp PCR product 23 by agarose gel electrophoresis and ethidium bromide staining.
Identification and quantitation of individual hCS-A, hCS-B, and hGH-V RNAs were done by real-time RT-PCR (qPCR) using specific primers (Table 1). 7 Minus RT reactions were also done using the same primers as a control for genomic DNA. Specific amplifications were identified with a single peak in the melting curve and routine verification of a single PCR product by agarose gel electrophoresis. Gene expression was calculated relative to that of human glyceraldehyde-3-dehydrogenase (GAPDH). For azadC and TSA treatments, β-glucuronidase was used for normalization as its expression is less sensitive to azadC and TSA treatments under the conditions tested.
Gene transfer and the luciferase assay
Cells were plated (1.5 × 10⁵/35-mm well) and 24 h later transfected with hybrid luciferase (Luc) genes (1 μg) using TransIT® -2020 transfection reagent (Mirus). Plasmids containing hybrid hCS-A promoter (496 bp) and firefly luciferase (Luc) reporter genes without (CSp.Luc) 38 or with upstream 263 bp P (263P.CSp.Luc) 38 and downstream 241 bp hCS-B enhancer sequences (CSp.Luc.241Enh) were used. For CSp.Luc.241Enh, the hCS-B 241 bp enhancer fragment was amplified using SV40pCAT-CSB enhancer plasmid DNA as a template, 39 using primers containing an AatII restriction enzyme site (CSB-Enh-Forward: AGCTGCGACGTCGTCTACATTTCAGCTCATCAACTTGG, and CSB-Enh-Reverse: AGCTCGGACGTCCAGCTGTGAACACATGGGTCTCATCT. The amplicon was digested with AatII and ligated into the AatII site of CSpLuc and downstream of the luciferase gene. The construct was confirmed by sequencing. Cells were cotransfected with 20 ng/well of a hybrid Renilla luciferase gene (RLuc) directed by a minimal thymidine kinase promoter (Promega Corp.). Cells were harvested 18 h post-transfection, and luciferase activity (Luc/RLuc) was measured after cell lysis using the Dual-Luciferase® Reporter (DLR™) Assay System (Promega Corp.).
Chromatin immunoprecipitation assay
Chromatin immunoprecipitation (ChIP) was done by Zymo Research Corp. Briefly, cells were formaldehyde cross-linked and sonicated (200–700 bp fragments), and ChIP assay (n = 3) was done on each chromatin sample (27 μg) with 5 μg of antibodies (anti-H3, Abcam, ab1719; anti-H3ac, Millipore, 06-599; anti-H4ac, Millipore, 06-598). Normal rabbit immunoglobulin (IgG) polyclonal antibodies were used as a control (#PP64B, Millipore). The relative abundance of regions of the hGH/CS locus in immunoprecipitated and input DNA was quantified by qPCR (Table 2). Values for both H3/H4 hyperacetylation and IgG were normalized to values for H3, and data for hyperacetylated H3/H4 binding events are presented relative to IgG control values.
Statistical analysis
Studies were done in triplicate unless stated otherwise, with at least two determinations per sample. Statistical analysis was done using Prism® software. For two-category comparisons, unpaired t-tests were used, and for multiple comparisons, one-way analysis of variance (ANOVA) was used with a post hoc Tukey–Kramer test as appropriate. A value of p < 0.05 is considered statistically significant and is represented in figures as follows: * or #, p < 0.05; ** or ##, p < 0.01; and *** or ###, p < 0.001.
Results
Detection of hCS/GH-V transcripts in placental and nonplacental tumor cells
Total RNA was isolated from HTP as well as from placental BeWo, JAR, and JEG-3 tumor cells and nonplacental breast (MCF-7, T47D), uterine (Hec1A), cervical (HeLa), and brain/glial (U-87) tumor cell lines. Transcripts common to hGH/CS genes and combining exon 3 and 4 sequences, as well as human GAPDH RNA, were assessed by RT-PCR (Fig. 1A). Relative to HTP, the presence of low levels of hGH/CS transcripts was confirmed (Fig. 1A), with the exception of U-87 glioma cells where hGH/CS transcripts were not detected under equivalent conditions.

Assessment of total human (h)GH/CS RNA and relative levels of hCS-A, CS-B, and GH-V transcripts in placental and nonplacental tumor cell lines.
Individual hCS-A, hCS-B, and hGH-V expression was investigated in placental and nonplacental tumor cells by qPCR (Fig. 1B). For quantitation, values for hCS/GH-V transcripts were normalized to hGAPDH RNA levels and presented relative to JEG-3 cell levels, which are arbitrarily set to 1.0 (Fig. 1C). Expression of hCS/GH-V genes was detected in all cell lines, but this was a fraction of that observed in HTP based on a comparison with levels in JEG-3 cells. Relative levels of individual hCS/GH-V transcripts were all significantly greater in BeWo and JAR versus JEG-3 cells. However, a more variable pattern of relative expression was seen with JEG-3 when compared with nonplacental tumor cells; while hCS-A RNA levels were greater in HeLa and MCF-7 cells, hCS-B transcripts were greater only in HeLa cells and hGH-V transcripts were greater in MCF-7 cells alone (Fig. 1C). There was also no significant difference in individual hCS-A, hCS-B, and hGH-V RNA levels between JEG-3 and U-87 cells.
The downstream CS enhancer region shows preferential activity in placental versus nonplacental tumor cells
Expression of hCS genes has been linked, in part, to local upstream P and downstream enhancer (3′-Enh) sequences and their associated factors. 7 Activity of these regions and related availability of regulatory factors were assessed in transfected BeWo, JEG-3, MCF-7, and U-87 cells, using Luc reporter genes directed by a minimal hCS promoter with or without P or hCS-B 3′-Enh sequences (Fig. 2). There were modest (∼1.5-fold increase or decrease) effects of P sequences on hCS promoter activity in JEG-3, BeWo, MCF-7, and U-87 cells. A modest increase was also seen with 3′-Enh sequences in nonplacental MCF-7, but not U-87 cells. By contrast, a significant and more robust 5- to 12-fold increase in activity was observed with 3′-Enh sequences in JEG-3 and BeWo cells (Fig. 2). These data raise the possibility that placental enhancer factors are present in BeWo and JEG-3 cells, but unlike in the transfected Luc reporter gene, the cis-elements in the endogenous hCS genes are not accessible in the context of chromatin.
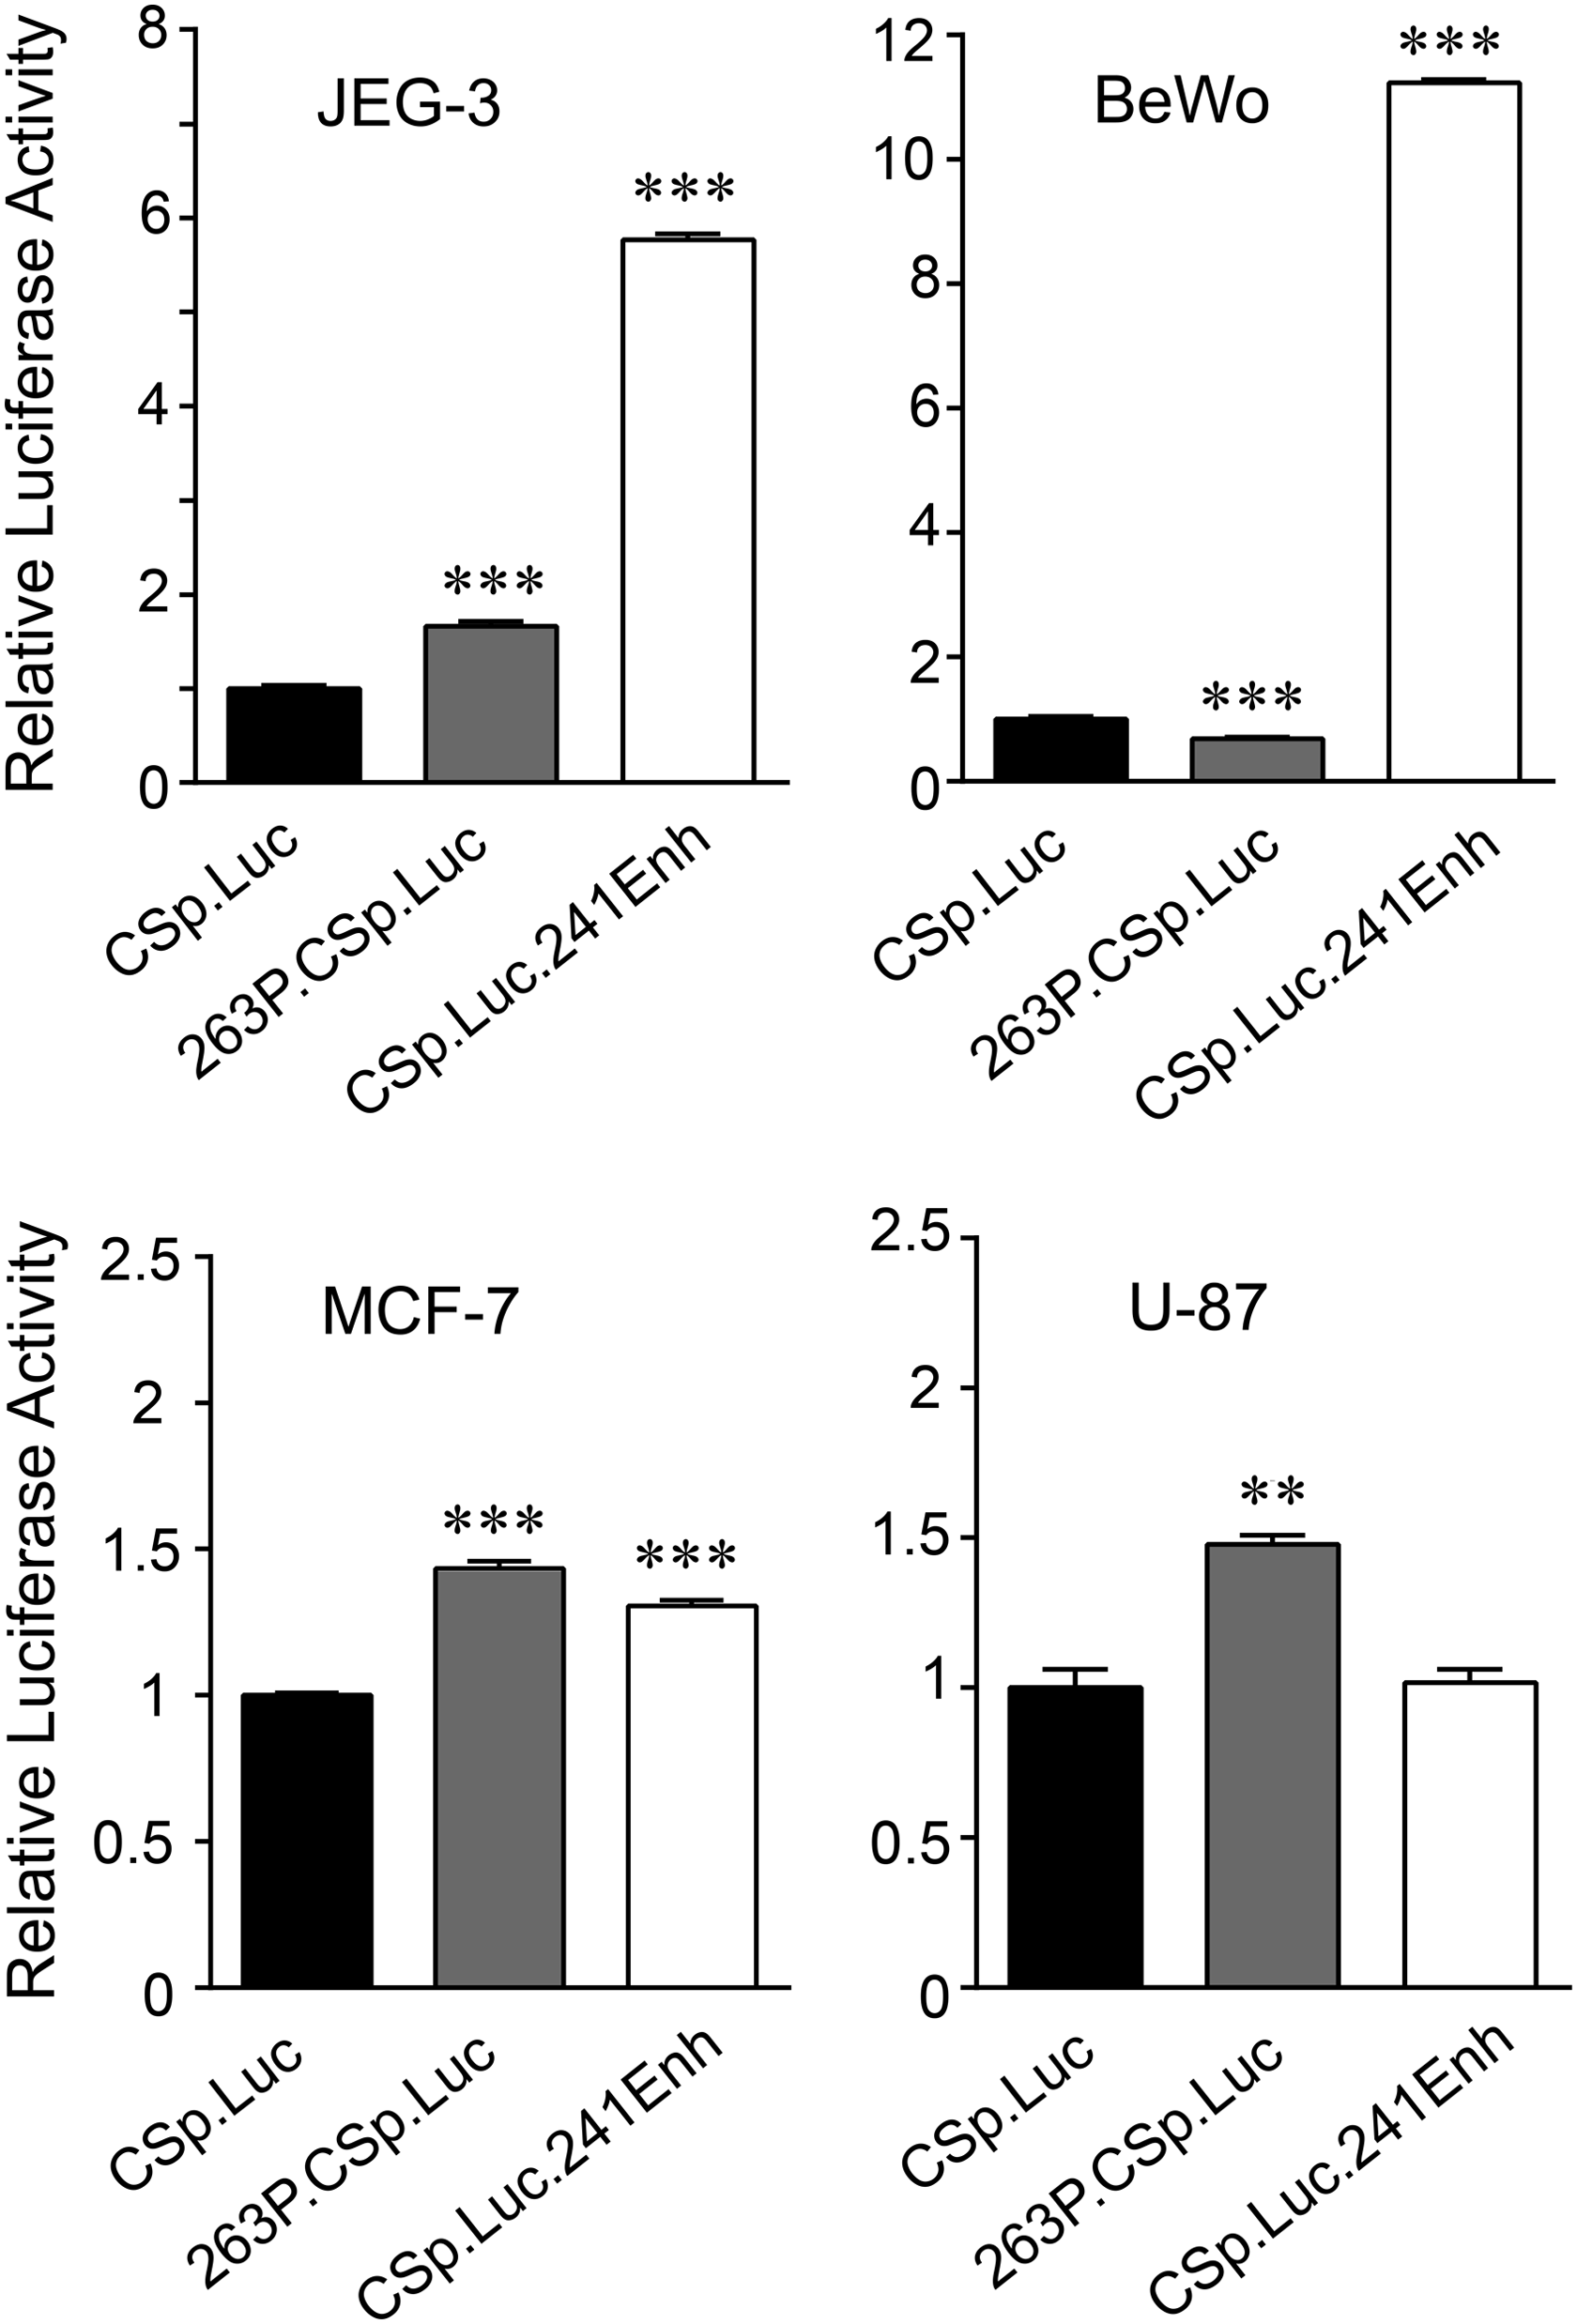
The downstream hCS enhancer region shows preferential activity in transfected placental versus nonplacental tumor cells. Hybrid hCS-A promoter (CSp)/luciferase (Luc) genes without (CSp.Luc) or with the 263 bp P sequence element (263P.CSp.Luc) or 241 bp hCS-B downstream enhancer element (CSp.Luc.241Enh) were used to transiently transfect placental (JEG-3, BeWo) and nonplacental (MCF-7, U-87) cells. To control for DNA uptake, cells were cotransfected with a hybrid Renilla luciferase gene (RLuc). Results are expressed as mean values (Luc/RLuc) relative to CSp.Luc activity, which was arbitrarily set to 1, and error bars represent standard error of the mean (n = 6). The mean values for CSp.Luc in JEG-3, BeWo, MCF-7, and U-87 were 1.895 ± 0.066, 0.788 ± 0.039, 3.110 ± 0.033, and 2.356 ± 0.148, respectively. Results for promoter activity were analyzed by one-way ANOVA with post Tukey–Kramer Multiple Comparisons test (**p < 0.01, ***p < 0.001).
Differential effects of DNA demethylase and HDAC inhibition on hCS/GH-V RNA levels
To remodel chromatin and potentially increase transcription factor(s) accessibility, JEG-3 cells were treated with increasing concentrations of either azadC for 24 h or TSA for 18 h and levels of hCS/GH-V RNA assessed by qPCR (Fig. 3). For controls, cells were treated with DMSO vehicle under identical conditions for each treatment group, and RNA levels were normalized relative to β-glucuronidase transcripts. Treatment with 25 μM azadC or greater resulted in modest but significant and consistent increases in hCS-B and hGH-V, but not hCS-A, RNA levels in JEG-3 cells (Fig. 3A). Human GH-V transcripts showed greater sensitivity to TSA than hCS-A and B as levels were increased ∼2-fold with 10 and 20 nM TSA treatments. However, hGH-V as well as hCS-A and hCS-B RNA levels were all significantly increased ∼5-fold with 50 nM TSA, and a further increase (equivalent to 7- to 15-fold) was seen with 100 nM TSA treatment (Fig. 3B).
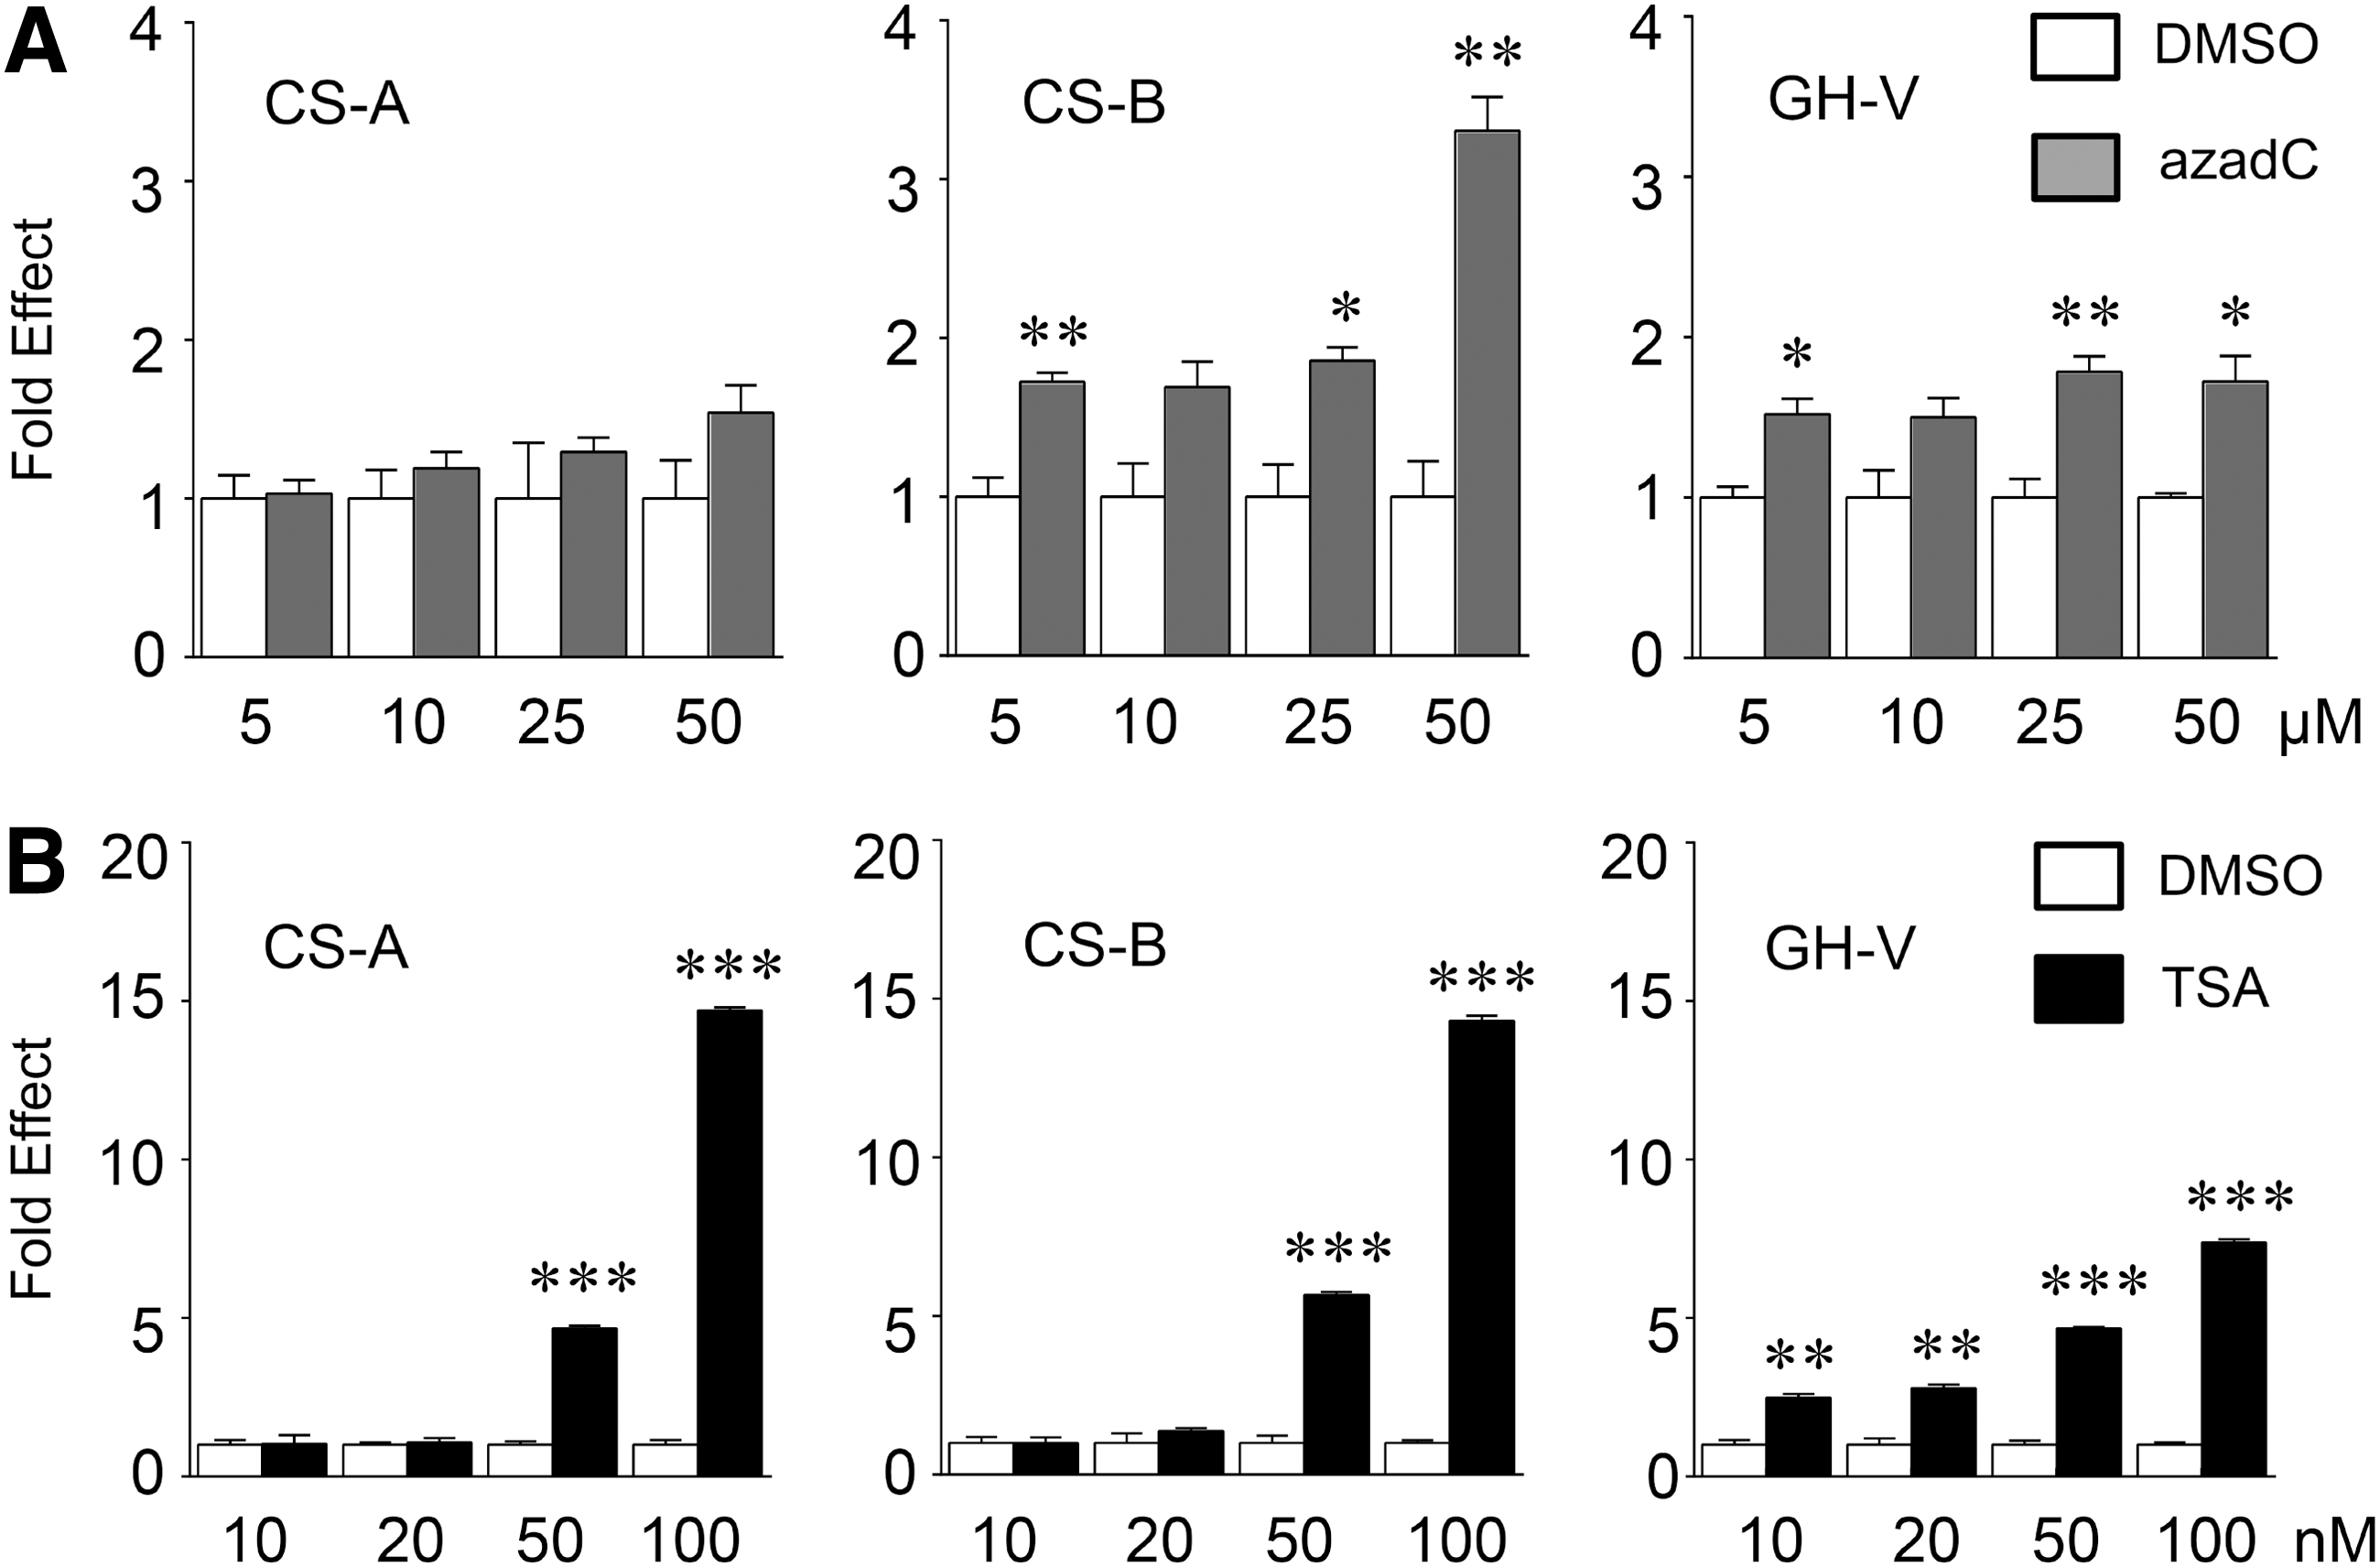
Differential effects of DNA demethylase and histone deacetylase (HDAC) inhibition on hCS-A, CS-B, and GH-V RNA levels. Placental JEG-3 cells were treated with increasing concentrations of the
Levels of hCS/GH-V transcripts are increased with sequential azadC and TSA treatments in JEG-3 cells
The effect of sequential azadC and TSA treatments on hCS/GH-V transcripts in JEG-3 and MCF-7 cells was assessed by qPCR, given the individual effects of DNA demethylase and HDAC inhibition in JEG-3 cells. Significant increases in hCS-A (∼37-fold), hCS-B (∼44-fold), and hGH-V (∼15-fold) RNA levels were observed in JEG-3 cells treated with azadC and TSA versus TSA alone (Fig. 4A). By contrast, more modest (∼3-fold) increases in hCS-A and hCS-B were seen in MCF-7 cells (Fig. 4B), while hGH-V RNA levels were not increased, but rather decreased by ∼50% (Fig. 4B). To assess the specificity of the response, the study was repeated with reversal of the sequential treatment regimen (TSA, then azadC). By contrast to the effect of pretreatment with azadC, post-treatment with azadC mutes the stimulatory effects of TSA on hCS/GH-V transcripts (Fig. 4C).

Human CS-A, CS-B, and GH-V RNA levels are increased specifically in placental JEG-3 cells with sequential azadC and TSA treatments.
Based on the preferential response of the hCS 3′-Enh sequences in JEG-3 cells (Fig. 2), their H3/H4 hyperacetylation status was assessed in JEG-3 cell chromatin in response to sequential azadC and TSA versus TSA treatments by ChIP assay (Fig. 5). Primers were selected to assess the hCS/GH-V P and promoter sequences, HS III, HS IV, and HS V from the hGH/CS LCR, as well as (combined) hCSA,B,L 3′-Enh, regions (Table 2). A trend toward increased H3/H4 hyperacetylation of the hGH/CS gene locus was suggested with TSA as well as sequential azadC and TSA treatments. However, significant increases in hyperacetylated H3/H4 in the hCSA,B,L 3′-Enh sequences and the hCS-A and hGH-V promoters were observed with sequential treatments (Fig. 5). Increased histone hyperacetylation was also detected for the HS III and IV, but not HS V, regions of the hGH/CS LCR.
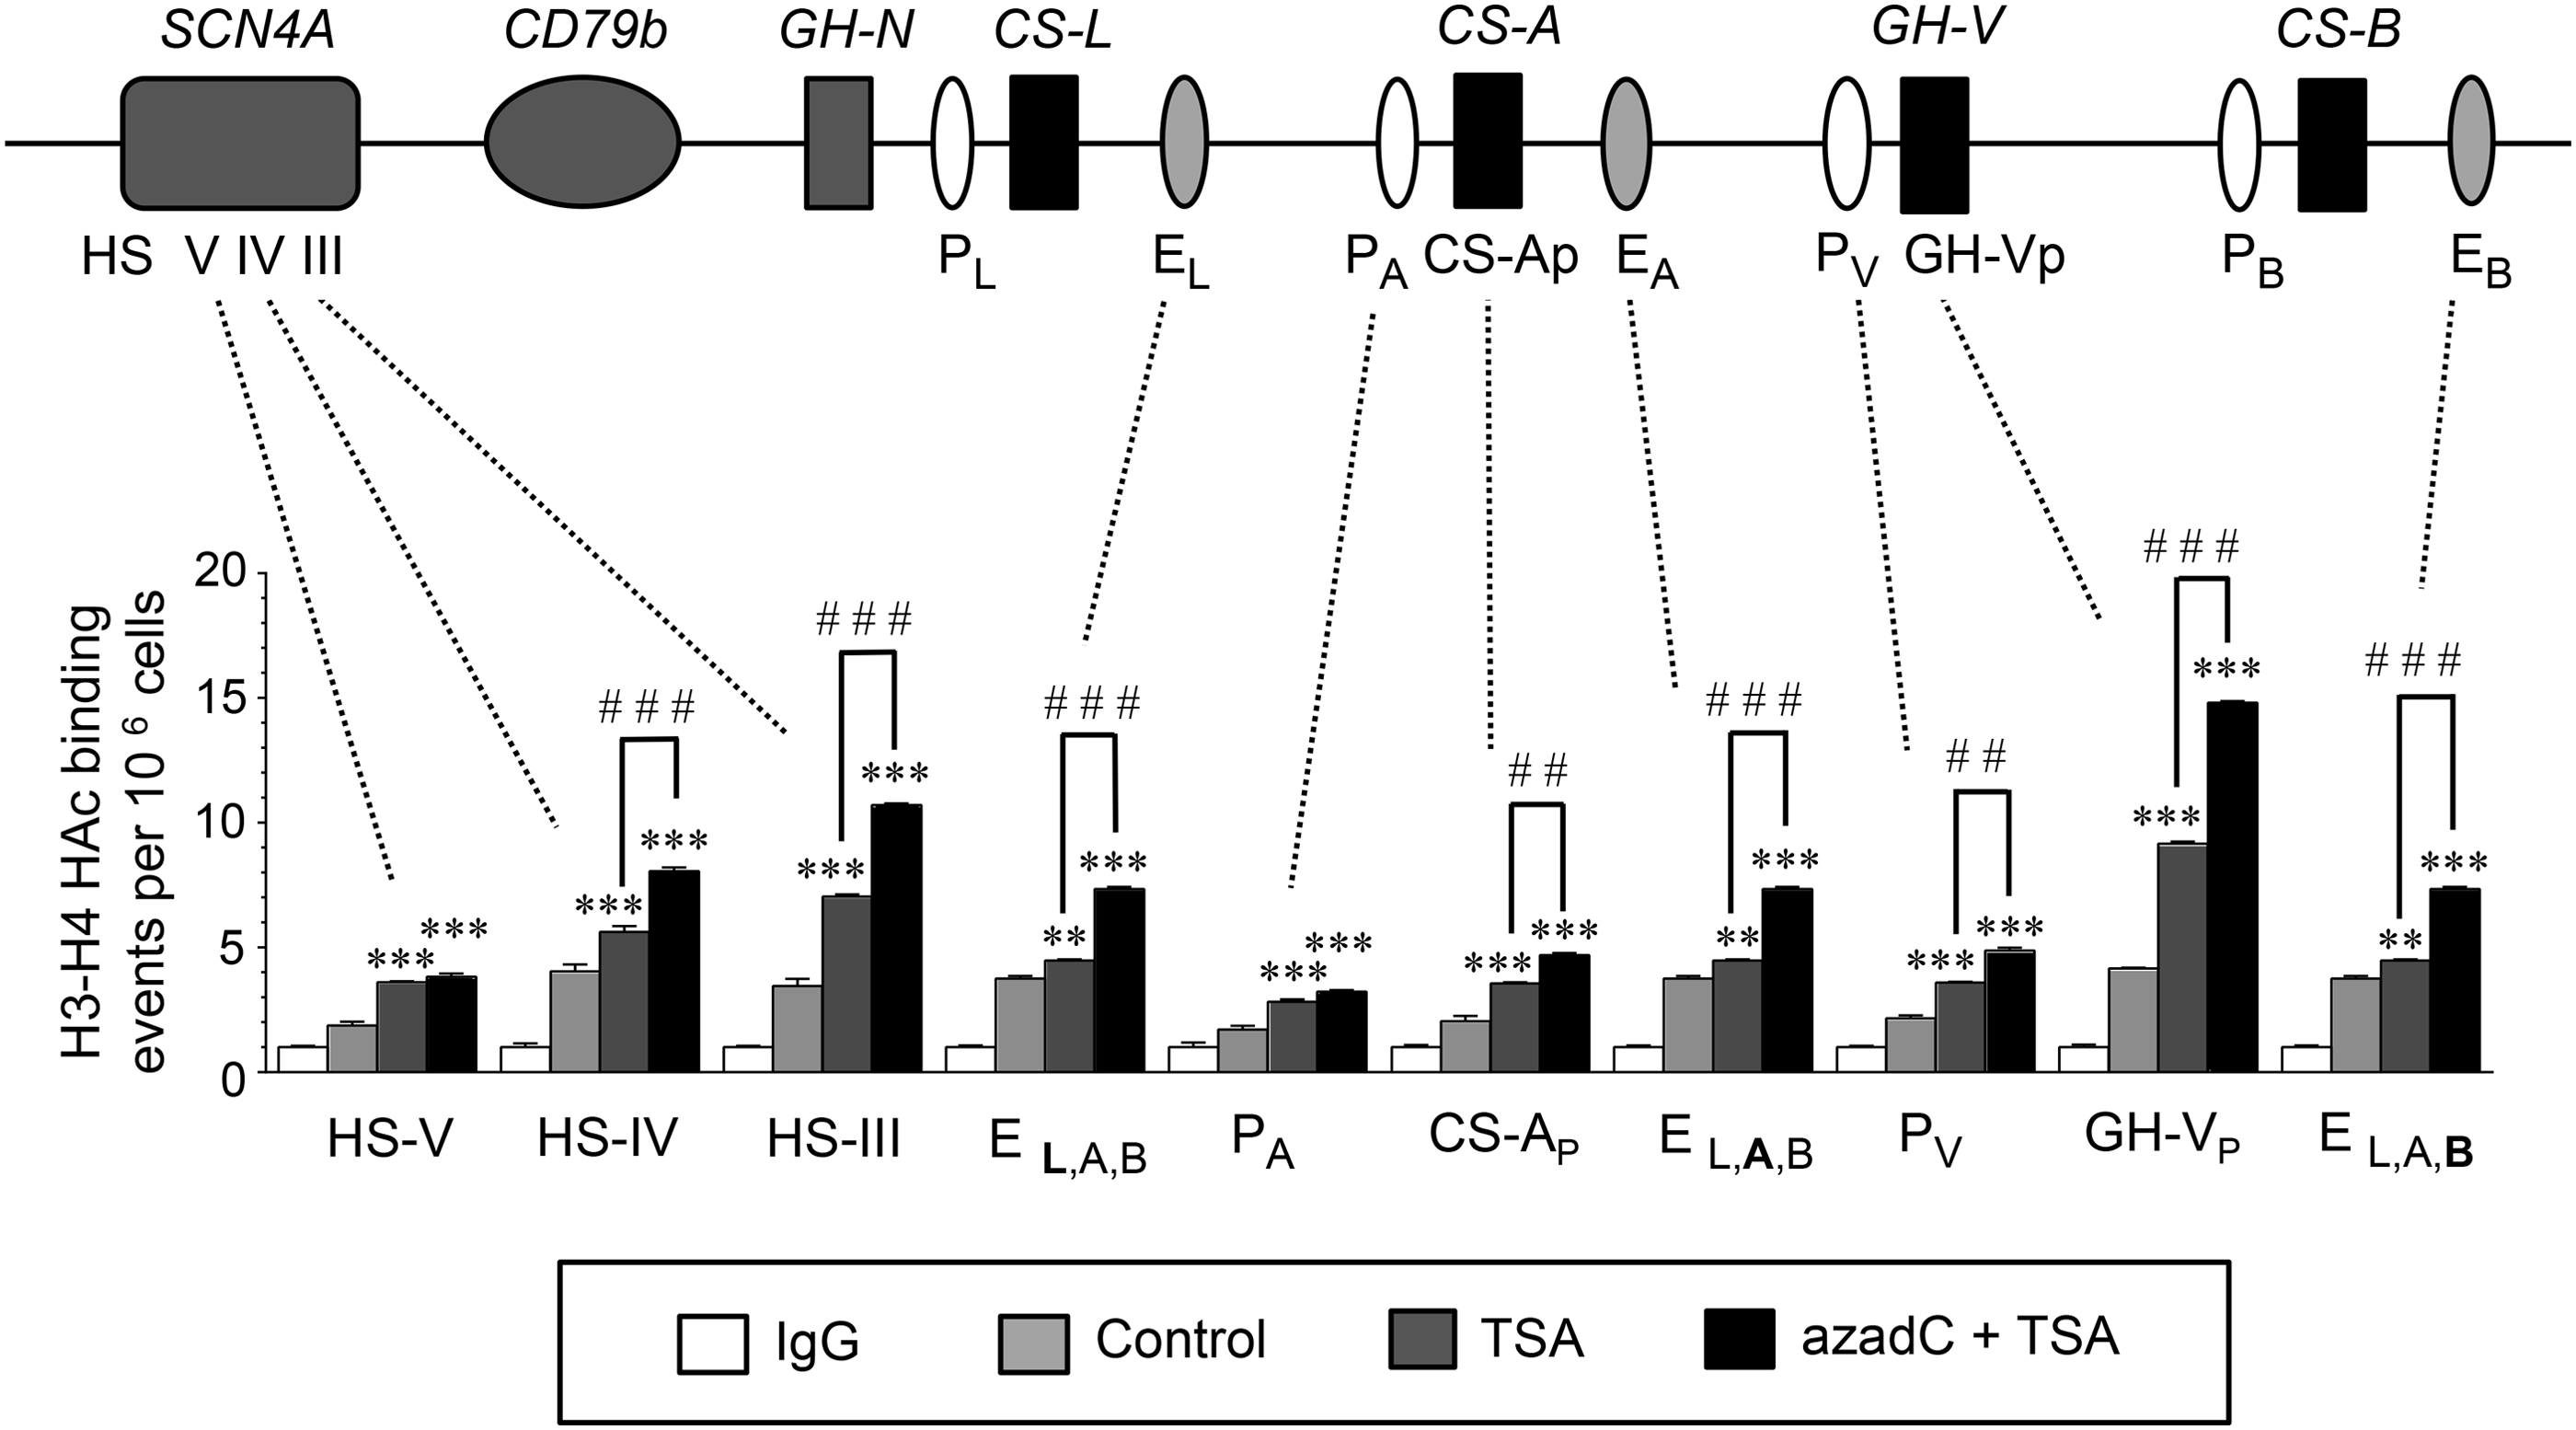
Histone H3/H4 hyperacetylation increases across the hGH/CS locus in situ with sequential azadC/TSA treatment of JEG-3 cells. ChIP assay was performed with antibodies specific to hyperacetylated (HAc) H3/H4 on chromatin isolated from JEG-3 cells treated without (Control) or with 100 nM TSA for 18 h, or 50 μM 5-aza-2′-deoxycytidine (azadC) for 24 h, then TSA for 18 h (azadC+TSA). Quantitative PCR was performed on both input and immunoprecipitated (bound) chromatin fractions (n = 3) with primer sets designed to detect regions of the hGH/CS locus control region (LCR) (hypersensitive sites [HS] III, IV, and V), downstream enhancer regions common to hCS-L, CS-A, and CS-B (EL,A,B), P sequences upstream of hCS-A (PA) and hGH-V (PV), and the proximal promoter regions for hCS-A (CS-Ap) and hGH-V (GH-Vp). Results are presented as HAc H3–H4 binding events relative to the immunoglobulin (IgG) control values for each primer set, which are arbitrarily set to 1. Values for HAc H3/H4 and IgG were all normalized to values for H3. Statistical analysis was performed compared with the control value for each primer set by one-way ANOVA with the post Tukey–Kramer Multiple Comparisons test (**p < 0.01 and ***p < 0.001). Comparison TSA and azadC+TSA for each primer pair was assessed by t-test; ##p < 0.01 and ###p < 0.001.
Discussion
Relatively low levels of hGH/CS transcripts were observed in three placental and four of five nonplacental tumor cell lines as assessed by RT-PCR. Our detection of low levels of hGH/CS gene expression is consistent with previous studies.23,24,32,40 However, assessment was extended here to include individual hCS-A, hCS-B, and hGH-V RNAs in placental versus nonplacental tumor cells by qPCR. The results support low levels of expression in tumor cells versus HTP and are also consistent with BeWo and JAR cells displaying preferential placental expression of individual hCS/GH-V genes when compared with nonplacental HeLa, MCF-7, and U-87 cells.23,24,32
By contrast, the more similar levels of hCS and hGH-V transcripts in placental JEG-3 and nonplacental cells, including MCF-7 cells, would without further analysis suggest that JEG-3 cells do not support a mechanism for preferential placental gene expression compared with either BeWo or JAR cells. However, ectopic hCS expression is reported in MCF-7 cells 32 and transfection of JEG-3 cells with hCS promoter/luciferase genes supports a mechanism for preferential placental cell expression. This included genes with and without regulatory P and 3′-Enh sequences that have been associated with placental hGH/CS gene expression.3,14,15 A differential response between placental and nonplacental cells was not observed with P sequences. However, a modest ∼1.5-fold increase and decrease in hCS promoter activity was seen in JEG-3 and BeWo cells, respectively. The significance of this difference is unclear, particularly as no effect or a slight decrease in the effect of P sequences on hCS promoter activity was reported previously in transfected JEG-3 cells. 16 Thus, regardless of the direction of the response, these studies suggest the capacity of this region to respond to available transcription factors.
Preferential stimulation of hCS promoter activity was seen in JEG-3 and BeWo (but not MCF-7 and U-87) cells with inclusion of an hCS 3′-Enh element; this differential response was not observed with P sequences. Thus, this is consistent with the availability of trans-acting factors in placental tumor (but not nonplacental MCF-7) cells that can access the hCS 3′-Enh region, which presumably has a relatively open (chromatin) configuration in the context of transfected plasmid DNA, but cannot access the equivalent sequences in the endogenous hCS gene loci. A difference in the chromatin organization of the hCS/GH-V genes that affects accessibility of regulatory regions, including 3′-Enh sequences, could also contribute to the lower levels of expression detected in human choriocarcinoma cells versus HTP.
Changes in both DNA methylation and histone hyperacetylation status been linked to placental expression of the hGH/CS family.3,8,41 DNA hypomethylation and histone hyperacetylation are features of an open chromatin structure.42–47 Treatment with an inhibitor of histone deacetylation (TSA) resulted in an increase in hCS/GH-V RNA levels, but this was increased >10-fold when JEG-3 cells were treated first with a DNA hypomethylating agent (azadC) before inhibition of histone deacetylation. By contrast, a decrease in hGH-V and a more modest <2-fold overall stimulation in hCS RNA were seen with MCF-7 cells with sequential treatment. The specificity of the response in JEG-3 cells is indicated by the loss of this stimulation with prior azadC treatment when the treatment order was reversed and azadC is given post-TSA treatment. Although coordinated changes in DNA methylation and TSA-induced histone modifications have been reported for the luteinizing hormone receptor gene in JAR cells, TSA treatment was done in the continued presence of azadC; treatments were not sequential or reversed for comparison. 31
The failure to see the same increases in hCS/GH-V RNA levels when TSA was used before treatment with azadC in JEG-3 cells suggests that specific (azadC-related) demethylation provides a preferred basis for efficient histone hyperacetylation and sequence availability. TSA decreases global DNA methylation, but in a manner distinct from azadC. 48 Thus, the stimulatory effect on hCS/GH-V transcripts in JEG-3 cells is consistent with prior azadC treatment, enhancing the effect of TSA by interfering with the ability of methylcytosine-binding proteins to recruit HDACs to methylated regions.2,49,50
The specific increased hCS/GH-V gene expression with sequential treatment is associated with significant increases in hyperacetylation at hCS 3′-Enh sequences, the hCS-A/hGH-V promoters, as well as HS III and IV of the LCR. Multiple transcription factors have been linked to these regions through gene transfer and/or binding studies. Loss of C/EBPβ binding to 3′-Enh sequences correlates with a decreased hCS promoter activity with maternal obesity. 7 DNA elements for FOXF1 in the proximal hGH-V promoter region and ETS-domain transcription factor family members in the HS III sequences have been linked to efficient activity.4,51 Furthermore, binding of AP-2 to HS III sequences correlates with H4 hyperacetylation in HTP, 4 and CTCF sites are present within the LCR and gene locus.52,53 These observations do not rule out other regions and associated factors, rather they suggest that accessibility of remote and local regulatory regions linked to enhanced placental expression is restricted by DNA methylation and histone acetylation status in JEG-3 cells. This presumably contributes to the low levels of hCS/GH-V in choriocarcinoma versus HTP cells and comparable levels in nonplacental tumor cells. Based on our transfections with hCS 3′-Enh sequences, this occurs despite the availability of cognate trans-acting factors, including those required for preferential placental enhancer activity in human choriocarcinoma cells. This presumably contributes to the low relative levels of hCS/GH-V gene expression in JEG-3 cells and hence similarity to those detected in nonplacental tumor cells, where appropriate levels of regulatory factors are not available even when sequences were made accessible as with azadC and TSA treatments of MCF-7 cells.
Footnotes
Acknowledgment
This work was supported by a grant from the Canadian Institutes of Health Research.
Author Disclosure Statement
No competing financial interests exist.