
Abstract
Culture conditions that preserve a stable chondrocyte phenotype are desirable in cell-based cartilage repair to maximize efficacy and clinical outcome. This study investigates whether low-glucose conditions will preserve the chondrocyte phenotype during culture expansion. Articular chondrocytes were culture-expanded in media supplemented with either low (1 mM) or high (10 mM) glucose. The metabolic phenotype, reactive oxygen species generation, and mRNA expression of markers of differentiation or catabolism were assessed by reverse-transcription quantitative polymerase chain reaction after four population doublings (PDs) and subsequent tissue formation capacity determined using pellet cultures. Continuous monolayer culture was used to determine the population doubling limit. After expansion in monolayer for four PDs, chondrocytes expanded in low-glucose conditions exhibited higher expression of the differentiation markers SOX9 and COL2A1 and reduced expression of the catabolic metalloproteinase matrix metallopeptidase 13. When chondrocytes expanded in low glucose were cultured in micropellets, they consistently generated more cartilaginous extracellular matrix than those expanded in high glucose, as evaluated by wet weight, sulfated glycosaminoglycan content, and hydroxyproline assay for collagen content. The same pattern was observed whether high or low glucose was used during the pellet culture. During expansion, chondrocytes in high-glucose generated 50% more reactive oxygen species than low-glucose conditions, despite a lower dependence on oxidative phosphorylation for energy. Furthermore low-glucose cells exhibited >30% increased population doubling limit. These data suggests that low-glucose expansion conditions better preserve the expression of differentiation markers by chondrocytes and enhance their subsequent capacity to form cartilage in vitro. Therefore, low glucose levels should be considered for the expansion of chondrocytes intended for tissue engineering applications.
Introduction
It is estimated that annually in the United Kingdom, ∼10,000 patients suffer cartilage damage warranting repair. 1 The ex vivo expansion of chondrocyte populations via proliferation in monolayer is a fundamental part of cell based cartilage repair strategies, including autologous chondrocyte implantation (ACI), a clinically established technique to repair chronic symptomatic isolated chondral defects. 2 To obtain sufficient cell numbers, chondrocytes recovered by biopsy are typically cultured for three to four population doublings before re-implantation at high density to the damaged area.2,3 The success of these procedures is dependent on the capacity of the implanted cells to form cartilage once implanted in vivo.4,5
Chondrocytes lose their expression of differentiation markers upon serial passaging, a phenomenon described as “dedifferentiation.”4,6,7 Importantly, dedifferentiation is associated with lost capacity of chondrocytes to regenerate cartilage when implanted in vivo and with a worse clinical outcome of ACI both in terms of structural repair and symptoms.4,6–9 Specific gene expression profiles, including a robust expression of the extracellular matrix (ECM) constituent collagen type 2, can predict the subsequent regenerative capacity of expanded chondrocytes.4,10,11 It is well established that type II collagen and aggrecan are direct transcriptional targets of SOX9.12,13 Thus optimal cell processing techniques for ACI should aim to sustain the expression of these genes within expanded cells, without unduly compromising proliferation.
Typical monolayer expansion involves culture for several weeks under atmospheric oxygen conditions in a high glucose media (10–25 mM glucose). By contrast, the native environment is scarce in oxygen and glucose.14–17 The environment experienced by chondrocytes is critical to their behavior, and it is well known that reduced oxygen conditions, more comparable to the native niche, can support the chondrocyte phenotype and promotes redifferentiation of monolayer expanded chondrocytes.18–22
Estimates predict that glucose concentrations may reach as low as 1 mM within articular cartilage in vivo 16 and chondrocytes appear well adapted to effectively obtain glucose from this extracellular environment.16,23,24 Interestingly, oxygen consumption of differentiated articular chondrocytes is determined by glucose availability and is suppressed above a threshold of about 5 mM,25–28 indicating that these cells are also metabolically sensitive to an altered glucose environment. Therefore, this study investigates the effect of glucose concentration on the preservation of chondrocyte differentiation markers throughout expansion and their potential to produce a cartilaginous ECM. Furthermore, we test whether any difference induced by expansion in low-glucose conditions is a stable feature or is transient.
Methods
Chondrocyte isolation and culture
Full-depth cartilage was dissected from bovine metacarpalphalangeal joints of 18- to 24-month-old animals under sterile conditions. Chondrocytes were isolated from the ECM by sequential incubation at 37°C in Dulbecco's modified Eagle's medium (DMEM) supplemented with 16 mM HEPES buffer, 1.6 mM L-glutamine, 120 mg/L ascorbic acid, and 16% (v/v) fetal calf serum (FCS) (DMEM+16% FCS) with 5.7 mg/mL pronase for 1 h followed by incubation in DMEM+16% FCS with 100 U/mL collagenase for 12 h. All reagents were from Sigma-Aldrich (Poole, United Kingdom).
Freshly isolated chondrocytes isolated from at least four animals were seeded into culture flasks at a density of 2×10⁴ cells/cm2 and cultured under standard conditions of 20% (v/v) O2 and 5% CO2 with glucose-free DMEM+10% (v/v) FBS, supplemented with 2 mM L-glutamine, 18 mM HEPES buffer, 88 U/mL penicillin, and 88 mg/mL streptomycin (all from Sigma-Aldrich). Cells obtained from the different animals were not pooled. The DMEM of half the flasks from each donor was supplemented with 10 mM glucose (high-glucose medium) and the remaining half with 1 mM glucose (low-glucose medium). Galactose (9 mM) was added to the low glucose media, ensuring osmotic balance.
Cell proliferation was monitored by manually counting the cells in situ daily from representative fields of view from each flask, captured with a microscope-mounted camera. Once four population doublings were achieved, the cells were detached with trypsin-EDTA (Sigma-Aldrich) and resuspended in fresh culture media. A portion of the cell suspension was used immediately for metabolic analysis, the determination of reactive oxygen species (ROS) generation, or tissue-forming potential (pellet culture). Gene expression following expansion for four population doublings was determined by quantitative polymerase chain reaction (qPCR), described below. Additional monolayer cultures were maintained continuously in either low- or high-glucose media for over 200 days to examine long-term proliferation characteristics. For the long-term culture the flasks were passaged as they reached 90% confluence using 1:8 split ratio.
Metabolic analysis
The cellular rates of glycolysis and oxidative phosphorylation were calculated from the rate of lactate release and oligomycin-sensitive oxygen consumption, respectively. A fluorescence-based oxygen biosensor with a 96-well plate format (BD Biosciences, Oxford, United Kingdom) was used to monitor the dissolved oxygen concentration in cell suspensions over time, using a method adapted from the suppliers and described in detail previously. 28 The oxygen consumption rate of each sample was calculated from the gradient of the oxygen–time curve and normalized to cell number. Additional cell samples were treated with 2 mg/mL oligomycin (Sigma-Aldrich) to determine the F1F0 coupled oxygen consumption rate, representative of oxidative phosphorylation.
The lactate released by the cells in suspension was determined from media samples collected at 30-min intervals, as described in a previous study 29 and summarized here. β nicotinamide adenine dinucleotide+(βNAD) was reconstituted with 0.2 mL of glycine buffer, 0.4 mL of water, and 0.01 mL of lactate dehydrogenase suspension (1000 U/mL, Sigma L3916) per milligram of βNAD (Sigma-Aldrich). Two hundred eighty microliters of the reconstituted βNAD+reagent was added to 20 μL of each sample and standards in duplicate with incubation at 37°C for 30 min. The concentration of lactate in the samples was calculated by comparison of the absorbance at 340 nm to lactate standards ranging in concentration from 0 to 5 mM.
ROS generation
Cells were suspended at 1×10⁶ cells/mL in phosphate-buffered saline containing 10 μM dihydroethidium (Invitrogen) and supplemented with either low or high glucose according to the expansion conditions. Cellular fluorescence (320-nm excitation, 590-nm emission) was monitored at 5-min intervals for 30 min using a BMG fluostar optima fluorimeter, during which the cells were incubated at 37°C and mixed by orbital shaking. The rate of fluorescence increase was recorded as a measure of ROS generation and xanthine/xanthine oxidase (100 μM/10 mU/mL) used as a positive control for superoxide generation.
Gene expression (RNA extraction, reverse transcription, and qPCR)
Gene expression was performed on cells cultured in monolayer to four population doublings (PDs). Total RNA of monolayer cells was extracted using TRIzol reagent (Invitrogen) according to the manufacturer's instructions, and RNA yield was assessed using a NanoDrop spectrophotometer. Five hundred nanograms of total RNA from each sample was reverse transcribed to cDNA using Thermoscript Reverse transcription kit (Invitrogen) with oligo dT primer according to the manufacturer's instructions. Quantitative PCR was performed using a MX3000P thermal cycler (Stratagene, La Jolla, CA) with 1 μL of cDNA (or water control) in a 10-μL final reaction volume using hot-start DNA polymerase (Qiagen, Crawley, United Kingdom) in the presence of SYBR green (Sigma-Aldrich), ROX dye (Invitrogen), and 0.25 μM of specific primers with melt curve analysis of the final product. Details of the primers are available in Table 1. Gene expression was assessed using a standard curve prepared by serial dilution of cDNA of freshly isolated chondrocytes with normalization to the geometric mean of β-actin and β2 microglobulin (B2M) controls. Collagen, type X, alpha 1 (COL10A1) and matrix metallopeptidase 13 (MMP13) are expected to have low expression in freshly isolated cells, and therefore the standards were prepared by dilution series of a preliminary PCR amplification.
Primer Sequences Used for Quantitative Gene Expression Analysis
B2M, β2 microglobulin; COL2A1, collagen, type II, alpha 1; MMP13, matrix metallopeptidase 13; COL10A1, collagen, type X, alpha 1; PTGS2, prostaglandin-endoperoxide synthase 2.
Pellet cultures
One million cells were centrifuged at 380 g in a 15-mL tube to form a cell pellet and cultured in 4 mL of either low- or high-glucose media (described previously) with loose caps under standard CO2 incubator conditions for 6 weeks, with medium replacement on alternate days. After this time the wet weight of the cell pellets was recorded, and the pellets were either frozen prior to biochemical analysis or fixed in 4% formaldehyde overnight for histological analysis of ECM constituents. Samples for biochemical analysis were digested with papain as described previously, 30 prior to the dimethylmethylene blue assay for quantification of sulfated glycosaminoglycans 31 and hydroxyproline assay, for estimation of collagen content. 32 Fixed samples were embedded in paraffin wax and sectioned to 2 μm for staining with Alcian blue (pH 2.5) for sulfated glycosaminoglycans or Sirius red for collagen content using standard protocols.
Statistical tests
Data was collected from at least four donor animals, which were maintained separately during culture. Statistical comparisons were made by two-factor analysis of variance (ANOVA) and subsequently two-tail t-tests, with Bonferroni correction for multiple comparisons where appropriate.
Results
Expansion in low glucose resulted in a marginally longer population doubling time
Chondrocytes lose their differentiated traits during culture expansion in vitro.4,6,8 Therefore, the effect of glucose concentration on the rate and extent of chondrocyte expansion in monolayer was determined. Population expansion progressed marginally, but consistently, more slowly in low-glucose media compared with high-glucose cultures (Fig. 1A, B). Low-glucose cultures exhibited an extended lag phase of 5.1 days compared with 4.3 days in high glucose (Fig. 1C). The low-glucose cultures also exhibited an increased population doubling (PD) time of 2 days in comparison with 1.6 days in high glucose, such that four PDs (considered a standard expansion for cell products used in ACI procedures) were achieved by day 13 and day 11, respectively (Fig. 1D). Interestingly, however, replicative potential was consistently greater with long-term expansion in the low-glucose condition, while chondrocytes cultured in high glucose stopped dividing after approximately 30 PDs (Supplementary Fig. S1), a potential indication of cumulative cell stress.33,34

Population expansion kinetics and morphology. Cell morphology at different time points in either 1 mM glucose or 10 mM glucose media
Glucose conditions determine chondrocyte oxygen metabolism and ROS throughout culture expansion
The metabolic phenotype of differentiated chondrocytes is known to be responsive to glucose concentration, with oxidative phosphorylation being suppressed by high-glucose conditions (Crabtree effect).25–28 To confirm that low-glucose conditions effectively modified the metabolism of chondrocytes in the present study, rates of glycolysis, aerobic metabolism, and ROS levels were investigated following four PDs, which was considered a relevant time point because it is a typical expansion required for ACI. Both oxidative phosphorylation and glycolysis (Fig. 2A, B) increased following expansion compared to freshly isolated cells, in keeping with previous reports. 29 Chondrocytes exhibited significantly greater oxidative phosphorylation in 1 mM glucose compared with 10 mM glucose, both at day 0 and after four PDs (Fig. 2). We calculate, using an ATP to O2 ratio of 5 (as reported by Brand et al. 35 ) and an ATP to lactate ratio of 1, that the cells expanded in low glucose derived 57% of their ATP from aerobic metabolism, compared with 23% in high glucose (Fig. 2C). Increased ROS generation was observed following monolayer culture expansion compared to day 0 cells, and statistically significantly greater ROS levels were observed following culture in high-glucose than in low-glucose conditions (Fig. 2D), despite a lower dependence on aerobic metabolism for ATP.

Chondrocyte metabolic phenotype is sensitive to glucose level. Oxidative phosphorylation
The stability of the acquired metabolic phenotype was then investigated. If, after four PDs in low glucose, chondrocytes were switched to high glucose conditions and vice versa, the metabolic differences observed between the expansion conditions were mostly reversible (Fig. 3A–D). In particular, chondrocytes expanded in 10 mM glucose and resuspended in 1 mM glucose prior to analysis derived the same proportion of ATP from aerobic metabolism (57%) as continuous culture in 1 mM glucose (Fig. 3C). Again, this switch towards oxidative metabolism on transfer to 1 mM glucose was accompanied with decreasing ROS generation (Fig. 3D).

The effect of glucose level on chondrocyte metabolic phenotype is largely reversible. Oxidative phosphorylation
High-glucose conditions resulted in increased chondrocyte dedifferentiation and irreversibly decreased capacity to form cartilage tissue in three-dimensional culture in vitro
To investigate whether high- or low-glucose conditions during culture expansion affected chondrocyte phenotype, gene expression of key chondrocyte markers was compared at the end of a 4-PD expansion period. As expected,4,6 the mRNA expression of the differentiation markers SOX9, collagen, type II, alpha 1 (COL2A1), and aggrecan all decreased with culture expansion. However, after four PDs (the typical expansion length for ACI), COL2A1 and SOX9 were more expressed in chondrocytes that had been expanded in low-glucose conditions (Fig. 4A). In addition, the expression of MMP13, a proteolytic enzyme involved in ECM catabolism, was significantly lower following expansion in low glucose compared to the high-glucose expansion conditions (Fig. 4B). The expression of COL10A1 (a marker of chondrocyte hypertrophic differentiation) and prostaglandin-endoperoxide synthase 2 (PTGS2), involved in the synthesis of prostaglandin E2) were not significantly affected by expansion glucose level.

mRNA expression of phenotypic and catabolic markers after four population doublings. The mRNA expression of three phenotypic markers SOX9, COL2A1, and Aggrecan following four population doublings in 1 mM glucose is compared to expansion in 10 mM glucose
To investigate whether this difference in the chondrocyte gene expression profile also resulted in increased cartilage formation in vitro, chondrocytes expanded in either high- or low-glucose condition for 4 PDs were replated in three-dimensional (3D) pellets, a condition known to promote the formation of cartilage organoids,8,36 all of them in high-glucose medium. Consistent with the higher expression of differentiation markers at the end of the expansion phase, cartilage tissue formation in pellet culture was more efficient when the chondrocytes had been expanded in low glucose, exhibiting 48% greater wet weight and significantly greater GAG and collagen per pellet (Figs. 5A–C, 6A) compared to cells expanded in high glucose. Histochemical staining supported the presence of cartilaginous ECM within the pellets, with Alcian blue staining for sulfated GAGs, and Sirius red for fibrillar collagens (Fig. 6). Differences in the GAG and hydroxyproline content of the pellets were not significant (two-way ANOVA) when expressed as percent wet weight, indicating a greater amount of qualitatively similar matrix in the two groups.
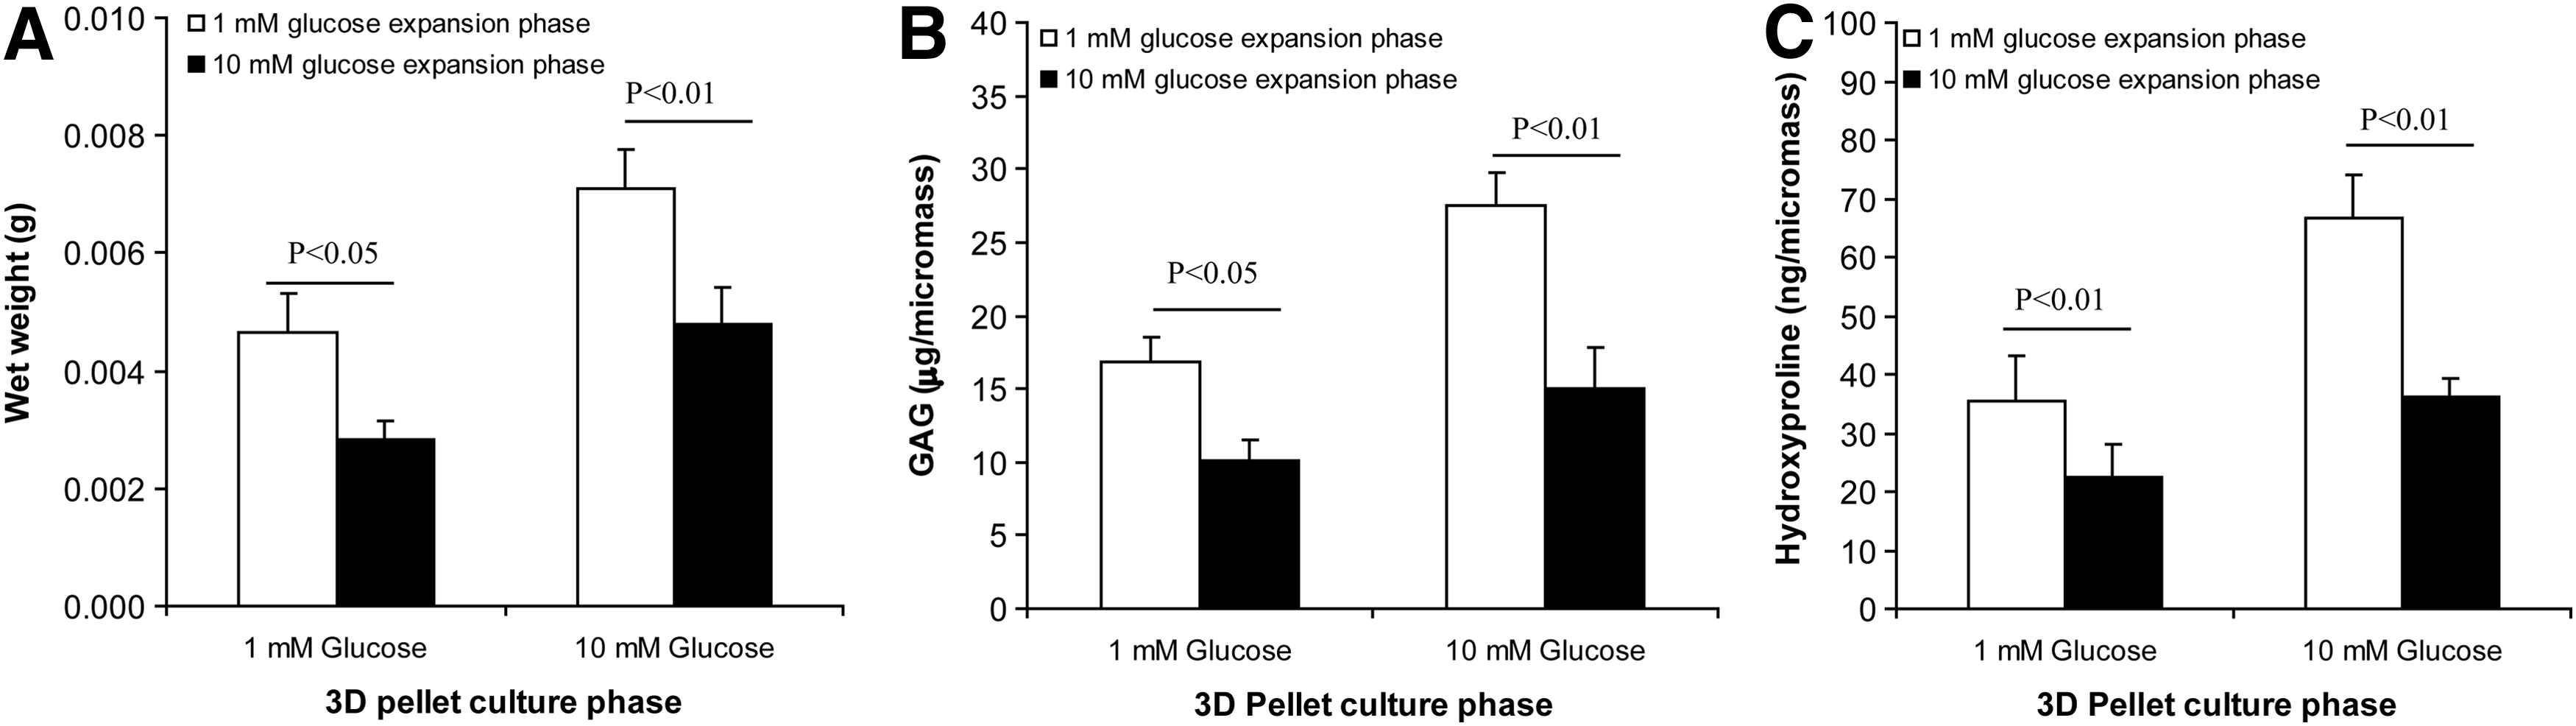
The glucose level during the culture expansion phase irreversibly affects subsequent tissue formation in pellet culture. Chondrocytes expanded in 1 mM glucose produced micropellets with greater wet weight

Gross morphology and histological analysis of cartilage tissue formation in cell pellet cultures. Pellets produced from chondrocytes derived from four donors are illustrated in
In ACI, in vitro expanded chondrocytes are implanted into the joint defect where they face different conditions during engraftment and cartilage formation. Therefore, the preservation of the differentiation and capacity to form cartilage achieved by expansion in low-glucose conditions must be retained in different conditions to maintain clinical relevance. To test the reversibility of the phenotype and of the cartilage formation capacity, chondrocytes were first expanded in either high or low glucose, but then cultured as pellets in low glucose. Also in this case, chondrocytes expanded in high glucose were associated with poorer cartilage formation in pellet culture under these conditions (Fig. 5A–C). Thus, high-glucose conditions during the expansion phase irreversibly reduced the potential for cartilage formation in pellet culture. However, once in pellet culture, high-glucose conditions favored cartilage formation (greater wet weight, total GAG and collagen, ANOVA p<0.01), in keeping with previous reports. 37 To summarize the data so far, during the expansion phase, low-glucose conditions better and irreversibly preserved the expression of chondrocyte differentiation markers and increased subsequent cartilage formation in 3D pellet culture; however, once in pellet culture, high-glucose conditions favored the formation of ECM.
Discussion
Culture expansion is a necessary step in ACI, but it is associated with a loss of the differentiated chondrocyte phenotype known as dedifferentiation,6,7 a reduced capacity to form stable cartilage in vivo4,12,13,38 and ultimately with a poorer clinical outcome of ACI.10,11 In this study we have demonstrated that expanded chondrocytes are metabolically sensitive to glucose concentration, undergoing a transient suppression of oxidative phosphorylation and increased ROS production in high glucose. This was followed by a reduced expression of chondrocyte differentiation markers at the end of the expansion phase compared with low-glucose conditions and an irreversible loss of cartilage formation capacity in 3D pellet culture.
Chondrocytes expanded in low glucose media took 2 days longer to reach 4 PDs (Fig. 1D). Despite this additional time in vitro required to reach four PDs, the low-glucose samples exhibited superior chondrogenic potential in comparison to high-glucose conditions. Therefore, the additional culture time seems an acceptable cost considering that enhanced cell quality would reduce treatment failure rates and thus requirement for re-interventions.4,10,11 Indeed, in a trial in which retention of chondrocyte differentiation markers was used as a quality control, 11.8% of the patients (6 patients out of 57) could not receive the treatment because the chondrocytes had insufficient retention of phenotypic traits.9,39 These patients had already received surgery in order to obtain a cartilage biopsy and start chondrocyte expansion, such that an additional 2 days required to achieve the same level of cell expansion while preserving chondrocyte quality seemed worthwhile in terms of patient benefit and resources.
It is interesting to note that although the chondrocytes in high-glucose conditions initially proliferated faster, they subsequently stopped dividing at around 30 PDs, whereas chondrocytes in low-glucose conditions still displayed a nearly linear growth curve at 80 PDs (Supplementary Fig. S1). Although this is not relevant to chondrocyte expansion for tissue engineering applications since chondrocytes are expanded for much shorter time, such a reduced population doubling limit is often a feature of cumulative cell stress,33,34,40 which may have biological consequences during the long remodeling that the repair tissue undergoes in vivo prior to maturation. 41 For example, oxidative stress may reduce the anabolic response of human articular chondrocytes to insulin-like growth factor-1 42 or induce a hypertrophic phenotype.43,44 Furthermore, the difference in longevity in vitro may be taken into account for the expansion of mesenchymal stem cells for which low-glucose conditions may warrant higher expansion capacity.
In this study, monolayer expansion in 1 mM glucose had favorable effects on phenotypic expression profiles (increased SOX9, COL2A1) and reduced expression of catabolic MMP13 compared to typical 10 mM glucose media. An association between levels of these differentiation markers in monolayer and subsequent cartilage formation in 3D has been examined previously.4,11,45 However, existing literature regarding the optimal glucose environment for retention of such phenotypic expression profiles in vitro is scarce and predominantly focuses on the effects of short-term exposure to exceptionally high glucose levels, such as found in hyperglycemia. For example, Rosa et al. 46 examined the effect of media containing 30 mM glucose on human chondrocyte phenotype in comparison to 10 mM glucose. By contrast, this study examines physiological glucose levels compared to typical culture media used in ACI. To put the values used in our study in context, the glucose concentration in synovial fluid is 1.4 mM lower than arterial plasma, which is regulated between 4 and 6 mM in healthy humans15,47,48 and is estimated to reach levels as low as ∼1 mM deep within the cartilage.15,16
Expansion in low glucose represents an effective, safe, and inexpensive option to increase the quality of repair in ACI. Our findings may be further exploited in alternative tissue engineering practices where the cells are seeded into a scaffold and cultured for a further period in vitro (where glucose can be controlled and monitored). Here, our findings indicate an optimal protocol would be a combination of low-glucose conditions during expansion followed by high glucose during the 3D phase.
Two caveats are important in terms of relevance to chondrocyte transplantation. In this study we used bovine chondrocytes, which may experience lower glucose levels in vivo 49 and altered uptake kinetics16,50 compared with human chondrocytes such that glucose concentrations cannot be directly extrapolated to human chondrocytes. The 3D pellet culture system we used in this study is not directly validated to predict efficacy in ACI in humans. Therefore, our results warrant further substantiation in appropriate validated in vivo models such as the cartilage formation assay in nude mice described by Dell'Accio et al.4,9,39
In our study, the preservation of the cartilage phenotype and increased cartilage formation associated with expansion in low-glucose conditions was also associated with relatively increased oxidative phosphorylation and lower ROS production measured during the expansion phase (Fig. 2). However, while the effects of glucose concentration on oxygen metabolism and ROS generation were mostly transient (they were not retained following media switch-over, Fig. 3), the loss of cartilage-forming capacity on transfer to pellet culture was persistent (Fig. 4). Thus glucose conditions, specifically in the expansion phase, may induce modifications that condition subsequent cartilage formation in pellet culture. This is consistent with epigenetic modification during proliferation.51–53
Footnotes
Acknowledgments
We thank Em Fitzgerald (Islington, London, United Kingdom) for photography of chondrocyte pellet specimens. This study was funded by the Medical Research Council/Engineering and Physical Sciences Research Council (EPSRC) discipline bridging initiative grant PPA026, EPSRC Platform Grant EP/E046975/1; Human Frontier Science Program Grant RGP0025/2009-C and Arthritis Research U.K. grants 19654 and 19344.
Author Disclosure Statement
No competing financial interests exist.
Abbreviations Used
References
Supplementary Material
Please find the following supplemental material available below.
For Open Access articles published under a Creative Commons License, all supplemental material carries the same license as the article it is associated with.
For non-Open Access articles published, all supplemental material carries a non-exclusive license, and permission requests for re-use of supplemental material or any part of supplemental material shall be sent directly to the copyright owner as specified in the copyright notice associated with the article.