
Abstract
Twenty hemophiliacs (HPs) were found to have human immunodeficiency virus type-1 (HIV-1) 1–2 years after exposure to Factor IX manufactured in Korea in late 1989. Plasma samples collected from donors O and P during their pre-seroconversion acute infection stage were used to manufacture clotting factors, including Factor IX, to treat these patients. To assess whether a genetic relationship exists between the viruses infecting HIV-1-positive HPs and those infecting plasma donors, we evaluated the nef sequences in 216 individuals. Frozen-stored serum samples obtained 1–3 years after the diagnosis of HIV-1 in the 20 HPs were used for amplification of the nef gene by reverse transcriptase–polymerase chain reaction, and amplicons were subjected to direct sequencing. Phylogenetic analysis revealed that the nef sequences from 143 of the samples belonged to the Korean subclade of HIV-1 subtype B (KSB). Sequences of the nef gene from donors O and P and the 20 HPs comprised two subclusters within KSB together with several local control (LC) sequences. In addition, signature pattern analysis revealed the presence of conserved nucleotides at eight positions in donors O and P compared with LCs (p<0.01). These nationwide and comprehensive nef data support the previous conclusion that HPs were infected with HIV-1 from the clotting factor, although the stringency of nef is weaker than for the pol and vif genes.
Introduction
Phylogenetics and signature pattern analysis have been employed to provide evidence for human immunodeficiency virus type-1 (HIV-1) transmission events, not only for epidemiological purposes but also for resolution of legal cases.1–9 Previous studies in patients with short time lag intervals from HIV infection to diagnosis have been performed via the detection of the env and gag genes,3,4,9 since pol is the most highly conserved of the nine HIV genes. 10 Recently, we used a similar method to determine the genetic relatedness of the pol and vif genes between plasma donors and hemophiliacs (HPs).11,12 These studies showed that pol and vif gene analyses are more suitable in cases with significant time lags between primary infection and sampling because these gene regions evolve more slowly than env and are subjected to less individual patient-specific selection pressures. On September 29, 2011, the Supreme Court of Korea ruled that Company X was responsible for the infection with HIV-1 of Korean HPs B after reviewing our studies on pol and vif genes (Case no. 2008 Da16776).11,12 At present, cash-paid plasma donation is not permitted by law, and heat inactivation is not included in the original procedure, even though RNA from the Hepatitis A virus was amplified in vials of Factors VIII and IX from 1998 to 1999. 13
In our present study, we amplified the nef genes by reverse transcriptase–polymerase chain reaction (PCR) using serum samples obtained 1–3 years after the diagnosis of HIV in 216 patients, including 20 HPs and 4 plasma donors, and compared the nef sequence identity with previously detected pol and vif genes.11,12 The use of plasma donors complements the findings of previous studies that lacked plasma donor O sequences. 14 It is suspected that viruses from donors O and P contributed to HIV-1 infections in HPs in Korea.9,11,12 We performed phylogenetic and signature pattern analyses to the samples to investigate the genetic relationships in the nef sequences among plasma donors, HPs, and local controls (LCs), and compared the results with those of previous analyses that used the pol and vif genes. Although analyses of nef gene sequences are weaker than those of other genes used in previous reports, this nationwide and comprehensive nef gene analysis supports previous findings that two of the four identified HIV-infected plasma donors were the most likely sources of viral infection in the 20 HPs.
Materials and Methods
Plasma donors O and P: sources of HIV-1
In 1989, cash-paid plasma donations were performed at several plasma centers run by Company X, which manufactures various blood products. Four HIV-1-seropositive plasma donors, O, P, Q, and R, were found to have HIV-1 during seroconversion. Details of these patients are described in Table 1.9,11,12
Characteristics of Clotting Factor IX and Four Cash-Paid Plasma Donors
First FIX had been manufactured from 1986 (NMC Medical record showed that HP13 got injected with two vials of FIX on 7 March 1987). Second FIX has been manufactured since November 1989. Lot number 9005 was manufactured on 12 December 1989. Lot numbers 9001–9004 were not described in the report by Company X.
FIX, Clotting Factor 9; ZDV, zidovudine; KRG, Korean red ginseng.
HIV-1-infected HPs and LCs
Twenty HPs, designated HP1–HP20, tested positive for HIV-1 between 1990 and 1994 (Table 2).9,11,12 In addition, 196 patients (including 4 plasma donors, 3 [HP21–23] infected outside Korea, and 44 with non-subtype B) were included in the analysis (Table 3). Finally, 37 HIV-1 patients diagnosed before 1991 were presumed to be infected with Korean subclade of HIV-1 subtype B (KSB), 11 of which 27 were included in our study. Of the 20 HPs in our cohort, 4 died. Two of these deaths occurred before the implementation of highly active antiretroviral therapy (HAART), HP8 owing to poor compliance and intracranial hemorrhage in August 2011, and HP18 from full-blown AIDS in December 2011. Written informed consent was obtained from the 16 living HP patients who remained to participate in this study.
Date of Diagnosis and Sampling in Hemophilia Patients and Plasma Donors
GenBank accession no. from the earliest sample.
Samples obtained after 2000 were used for three people with hemophilia.
HIV-1, human immunodeficiency virus type-1; HP, hemophiliac; HAART, highly active antiretroviral therapy.
Distribution of 216 Human Immunodeficiency Virus Type-1 Infected Persons with nef Gene Sequenced
Western B includes three hemophiliacs (HP21–HP23) infected outside Korea.
KSB, Korean subclade B of subtype B.
RNA preparation and nef gene amplification
Total RNA was extracted from 300 μL serum samples using a QIAamp Ultra sense Viral RNA kit (Qiagen, Hilden, Germany), as described previously.11,12 The nef gene was amplified via nested PCR with TaKaRa Taq™ (Takara Biotechnology, Dalian, China). First and second PCRs were performed in 20 and 50 μL reaction mixtures, respectively.11,12 Subsequent amplicons were directly sequenced using Applied Biosystems 3730XL (Macrogen, Inc., Seoul, Korea)
Sequences of the nef gene
The GenBank accession numbers for the genes investigated in this study are as follows: AF063921, AF462696, AF462699, AF462702, AF462704, AF462708, AF462717, AF462723, AF462726, AF462767, AF462770, AF462780, AF462788, AF462791, AY121440, AY121441, AY121446, FJ615009, AY121477, AY121478, AY260782, AY363365, AY584754, AY584800, AY899350, AF063918, AY899359, AY899370, AY899371, AY899379, AY899382, AY899391, AY899401, AY899378, AY899402, DQ121756, DQ121762, DQ121819, DQ121870, DQ121882, DQ121886, DQ121902, DQ121912, DQ121926-DQ121933, DQ121957, DQ121963, DQ121965, DQ121984, DQ121986, DQ121987, DQ121991, DQ121999, DQ122019, DQ122023, DQ122026, DQ122029, DQ122041, DQ122044, DQ122045, DQ122058, DQ122061, DQ122069, DQ122071, DQ122075, DQ122083, DQ122088, DQ122093, DQ122096, DQ122098, DQ122100, DQ122102, DQ122108, DQ122110, DQ122114, DQ122116, DQ122118, DQ122122, DQ400965, DQ400967, FJ615085, HM237141-HM237162, HM369811, HM369938, JQ007433-JQ007505, JN247463-JN247541, and JN377681-JN377703.
Phylogenetic analysis
Sequences obtained from the earliest serum available from each donor, patient, and LC were aligned to the HIV-1 subtype reference set from the HIV Sequence Database (http://hiv-web.lanl.gov/content/hiv-db/Subtype_REF/align.html). Phylogenetic trees were built using the DNAML Maximum Likelihood method based on a data-specific model, 15 PAUP maximum parsimony, and PhyML programs. 16 Trees generated using each of these methods produced the same donor O and donor P subclades, which were, in turn, within the KSB of HIV-1 subtype B.
Viral signature pattern analysis
The VESPA (www.hiv.lanl.gov/content/sequence/VESPA/vespa.html) program was used to identify sites that were distinct within each group of sequences. 7
Statistical analysis
Data are expressed as means±standard deviations. Statistical significance was estimated using the Student's two-tailed t-test, Chi-square test, and Fisher's exact test, using SPSS package version 12.0. Statistical significance was defined as p<0.05.
Results
Origin of the KSB
A total of 327 HIV-1-infected patients were diagnosed in Korea before 1994. 11 On the basis of epidemiological data, 172 of these cases were domestically infected within Korea. 11 The main local circulating virus was classified as KSB, which had already begun to be transmitted in 1988. The earliest pol and vif genes were isolated from a patient diagnosed in 1988 (HQ026557 and JF957897, respectively).11,12
Molecular epidemiologic data on the nef gene
We determined the nef sequences in 216 patients, including 189 LCs, 4 cash-paid plasma donors, 20 HP patients (HP1–HP20) infected with KSB (Table 2), and 3 (HP21–HP23) infected outside Korea. Phylogenetic analysis revealed that 143 sequences were positive for KSB (Fig. 1), and 73 sequences were non-KSB. The 143 KSB sequences were subdivided into two clusters (marked “cluster O” and “cluster P” in Fig. 1) through their similarity to plasma donors O and P, respectively. We did not include bootstrap values in the phylogenetic tree because there is low bootstrap support for each subclade within KSB, which is already a subclade of subtype B. 12
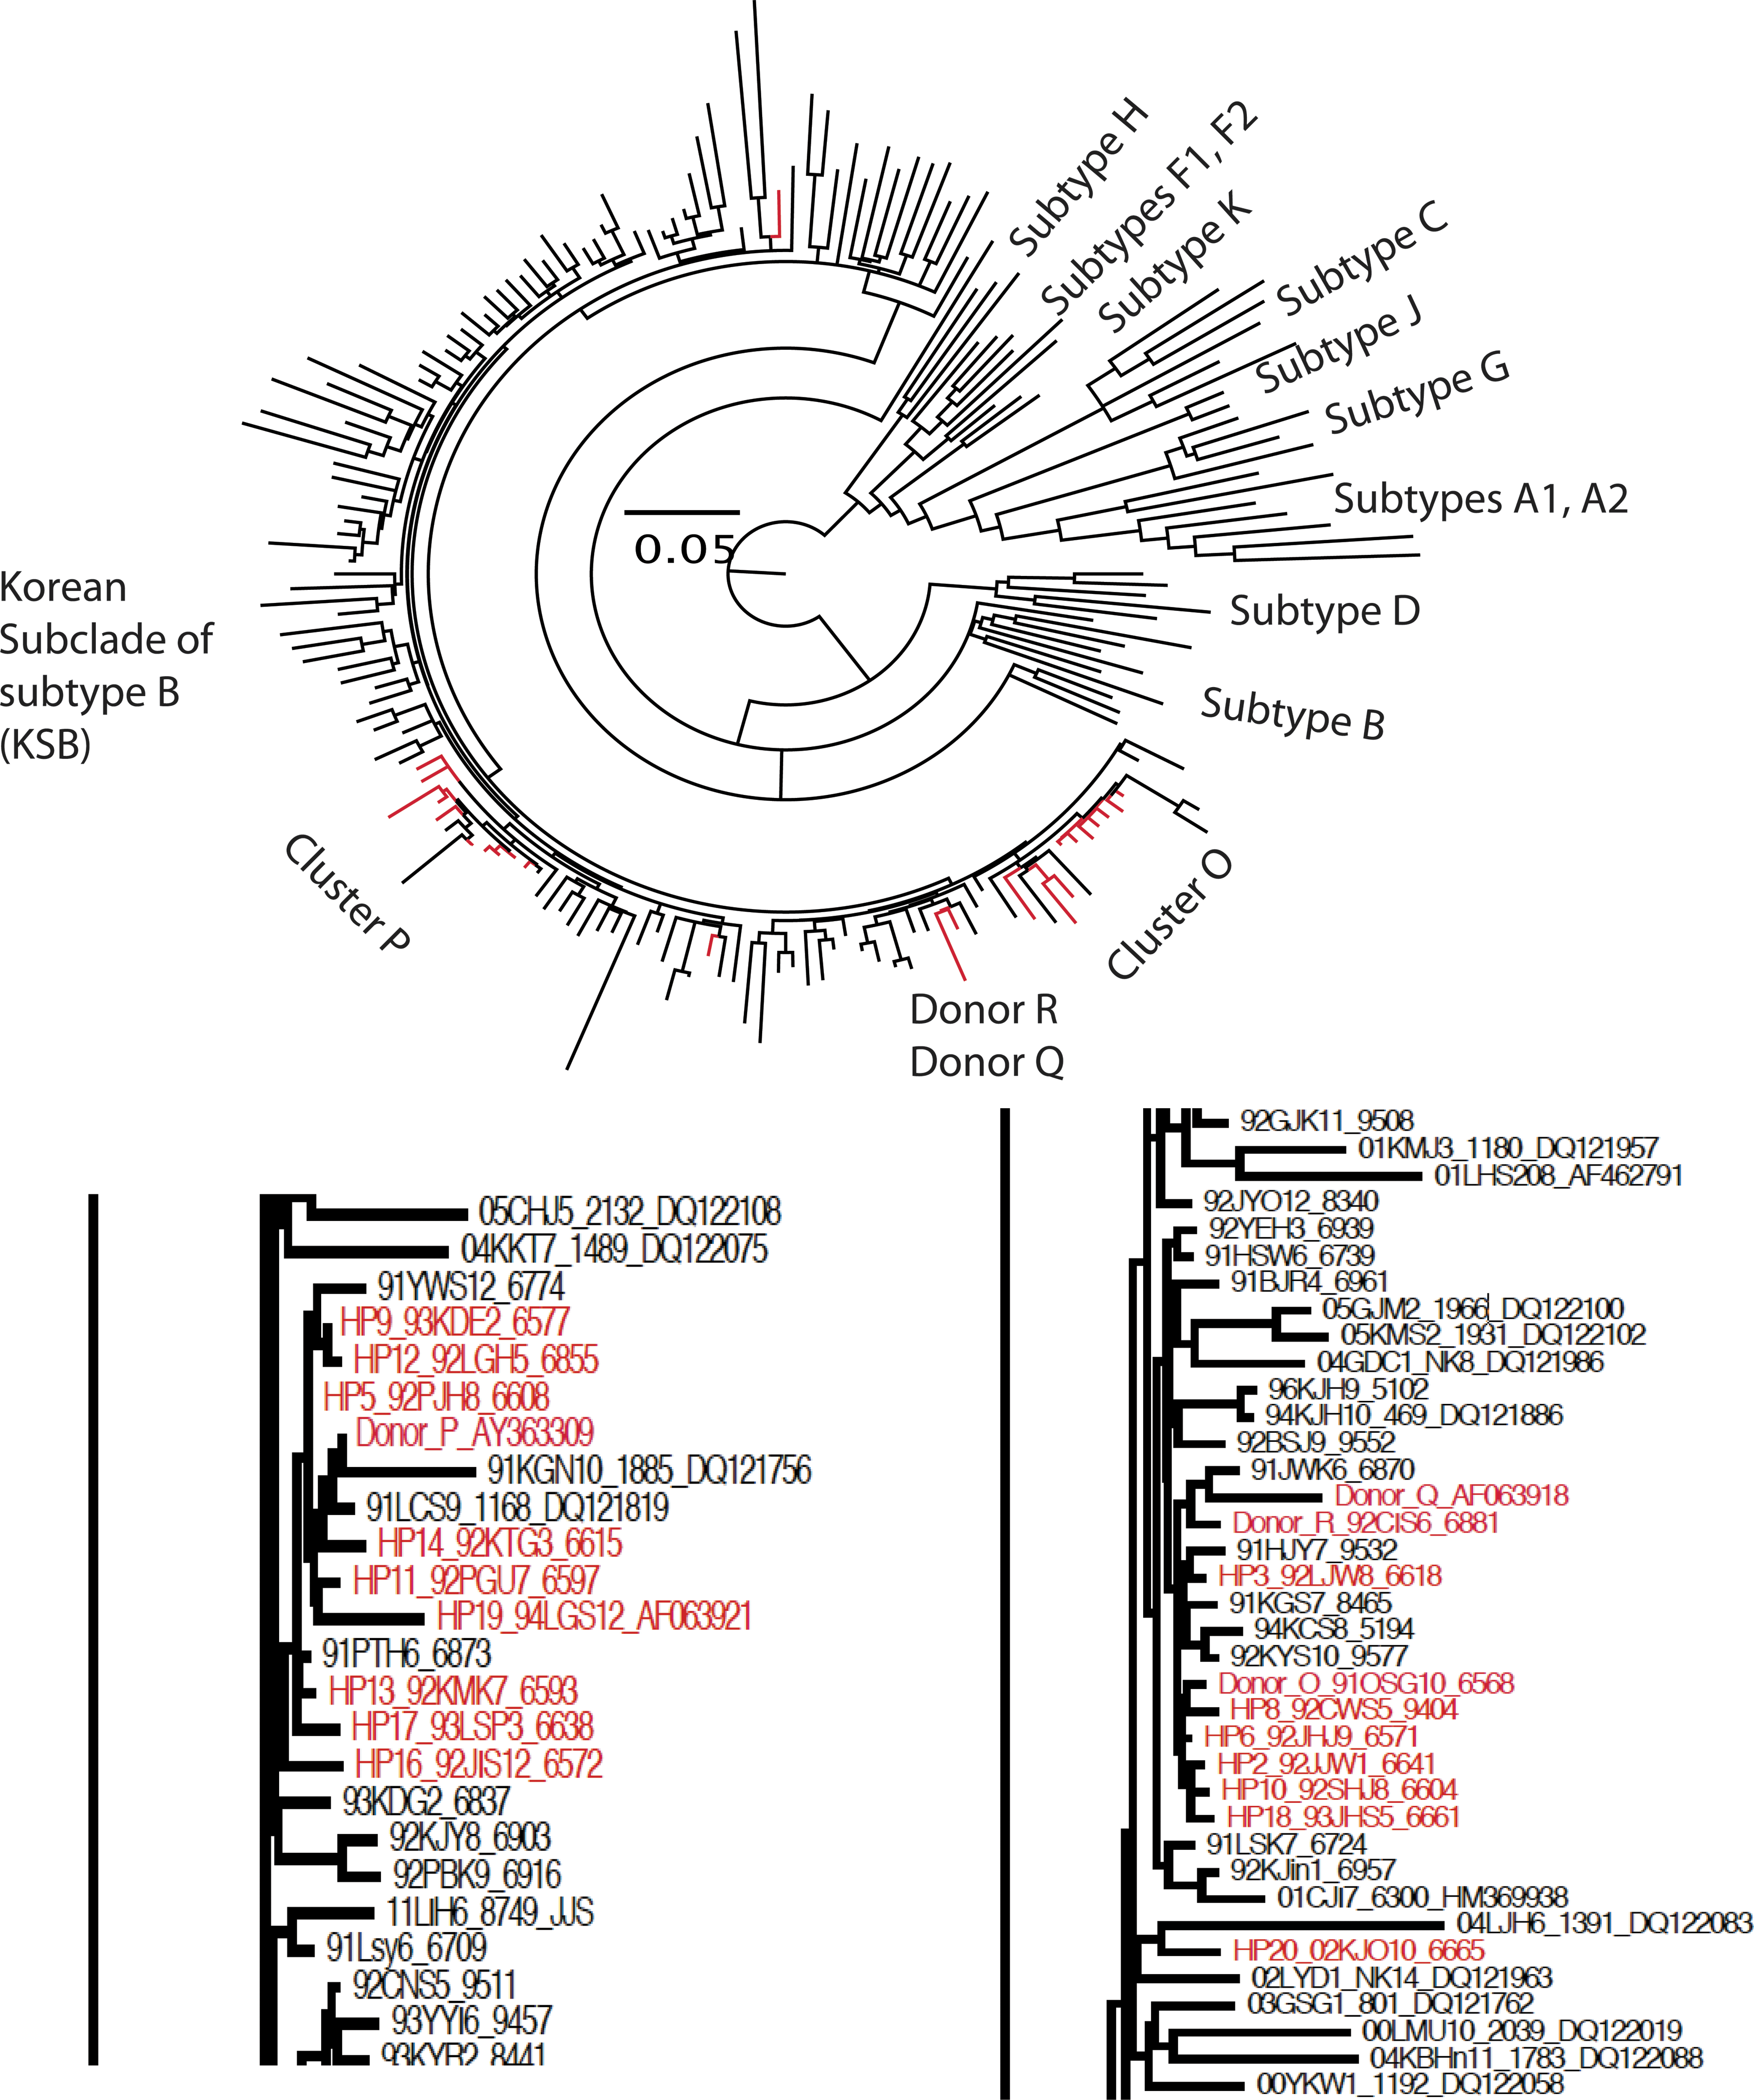
Molecular phylogenetic analysis using the maximum likelihood method. The evolutionary history was inferred using the maximum likelihood method based on the data-specific model. The tree with the highest log likelihood (−15860.8756) is shown. The percentage of trees in which the associated taxa clustered together is shown next to the branches. Initial trees for the heuristic search were obtained automatically as follows. When the number of common sites was <100 or <1/4 of the total number of sites, the maximum parsimony method was used; otherwise, the BIO neighbor-joining method with maximum composite likelihood distance matrix was used. A discrete Gamma distribution was used to model evolutionary rate differences among sites (eight categories;+G, parameter=0.4391). The rate variation model allowed for some sites to be evolutionarily invariable ([+I], 4.6206% sites). The tree is drawn to scale, with branch lengths measured in the number of substitutions per site. The analysis involved 190 nucleotide sequences from 20 HPs, plasma donors O, P, Q, and R, 119 LC patients infected with KSB (n=143), and 46 reference strains. Codon positions included were 1st+2nd+3rd+noncoding. All positions containing gaps and missing data were eliminated. There were a total of 526 positions in the final dataset. Evolutionary analyses were conducted in MEGA5. The resulting tree file was rendered as a radial tree to show all taxa and as a phylogram to zoom in on the O and P subclusters, using FigTree. Two clusters, O and P, were broadly clustered with intervening of some LCs infected with KSB. The two digits after the number (1–20) of HPs represent the year of sampling. HPs, hemophiliacs; KSB, Korean subclade of human immunodeficiency virus type-1 subtype B; LCs, local controls.
Nucleotide/amino acid signature patterns
Assessment of signature pattern nucleotides in clusters O and P revealed that eight positions showed statistically significant relationships with nucleotide sequences in 127 and 131 LCs (p<0.01), respectively, along with a significant difference between the two clusters (p<0.01; Table 4). Nucleotide changes at five positions were nonsynonymous, whereas those at three positions were synonymous, compared with the consensus nucleotide sequences of the LCs (Table 4). Among the five nonsynonymous changes, two and three positions were in clusters O (I113V and V145T) and P (I165V, C174S, and V194E), respectively (p<0.01) (Fig. 2).
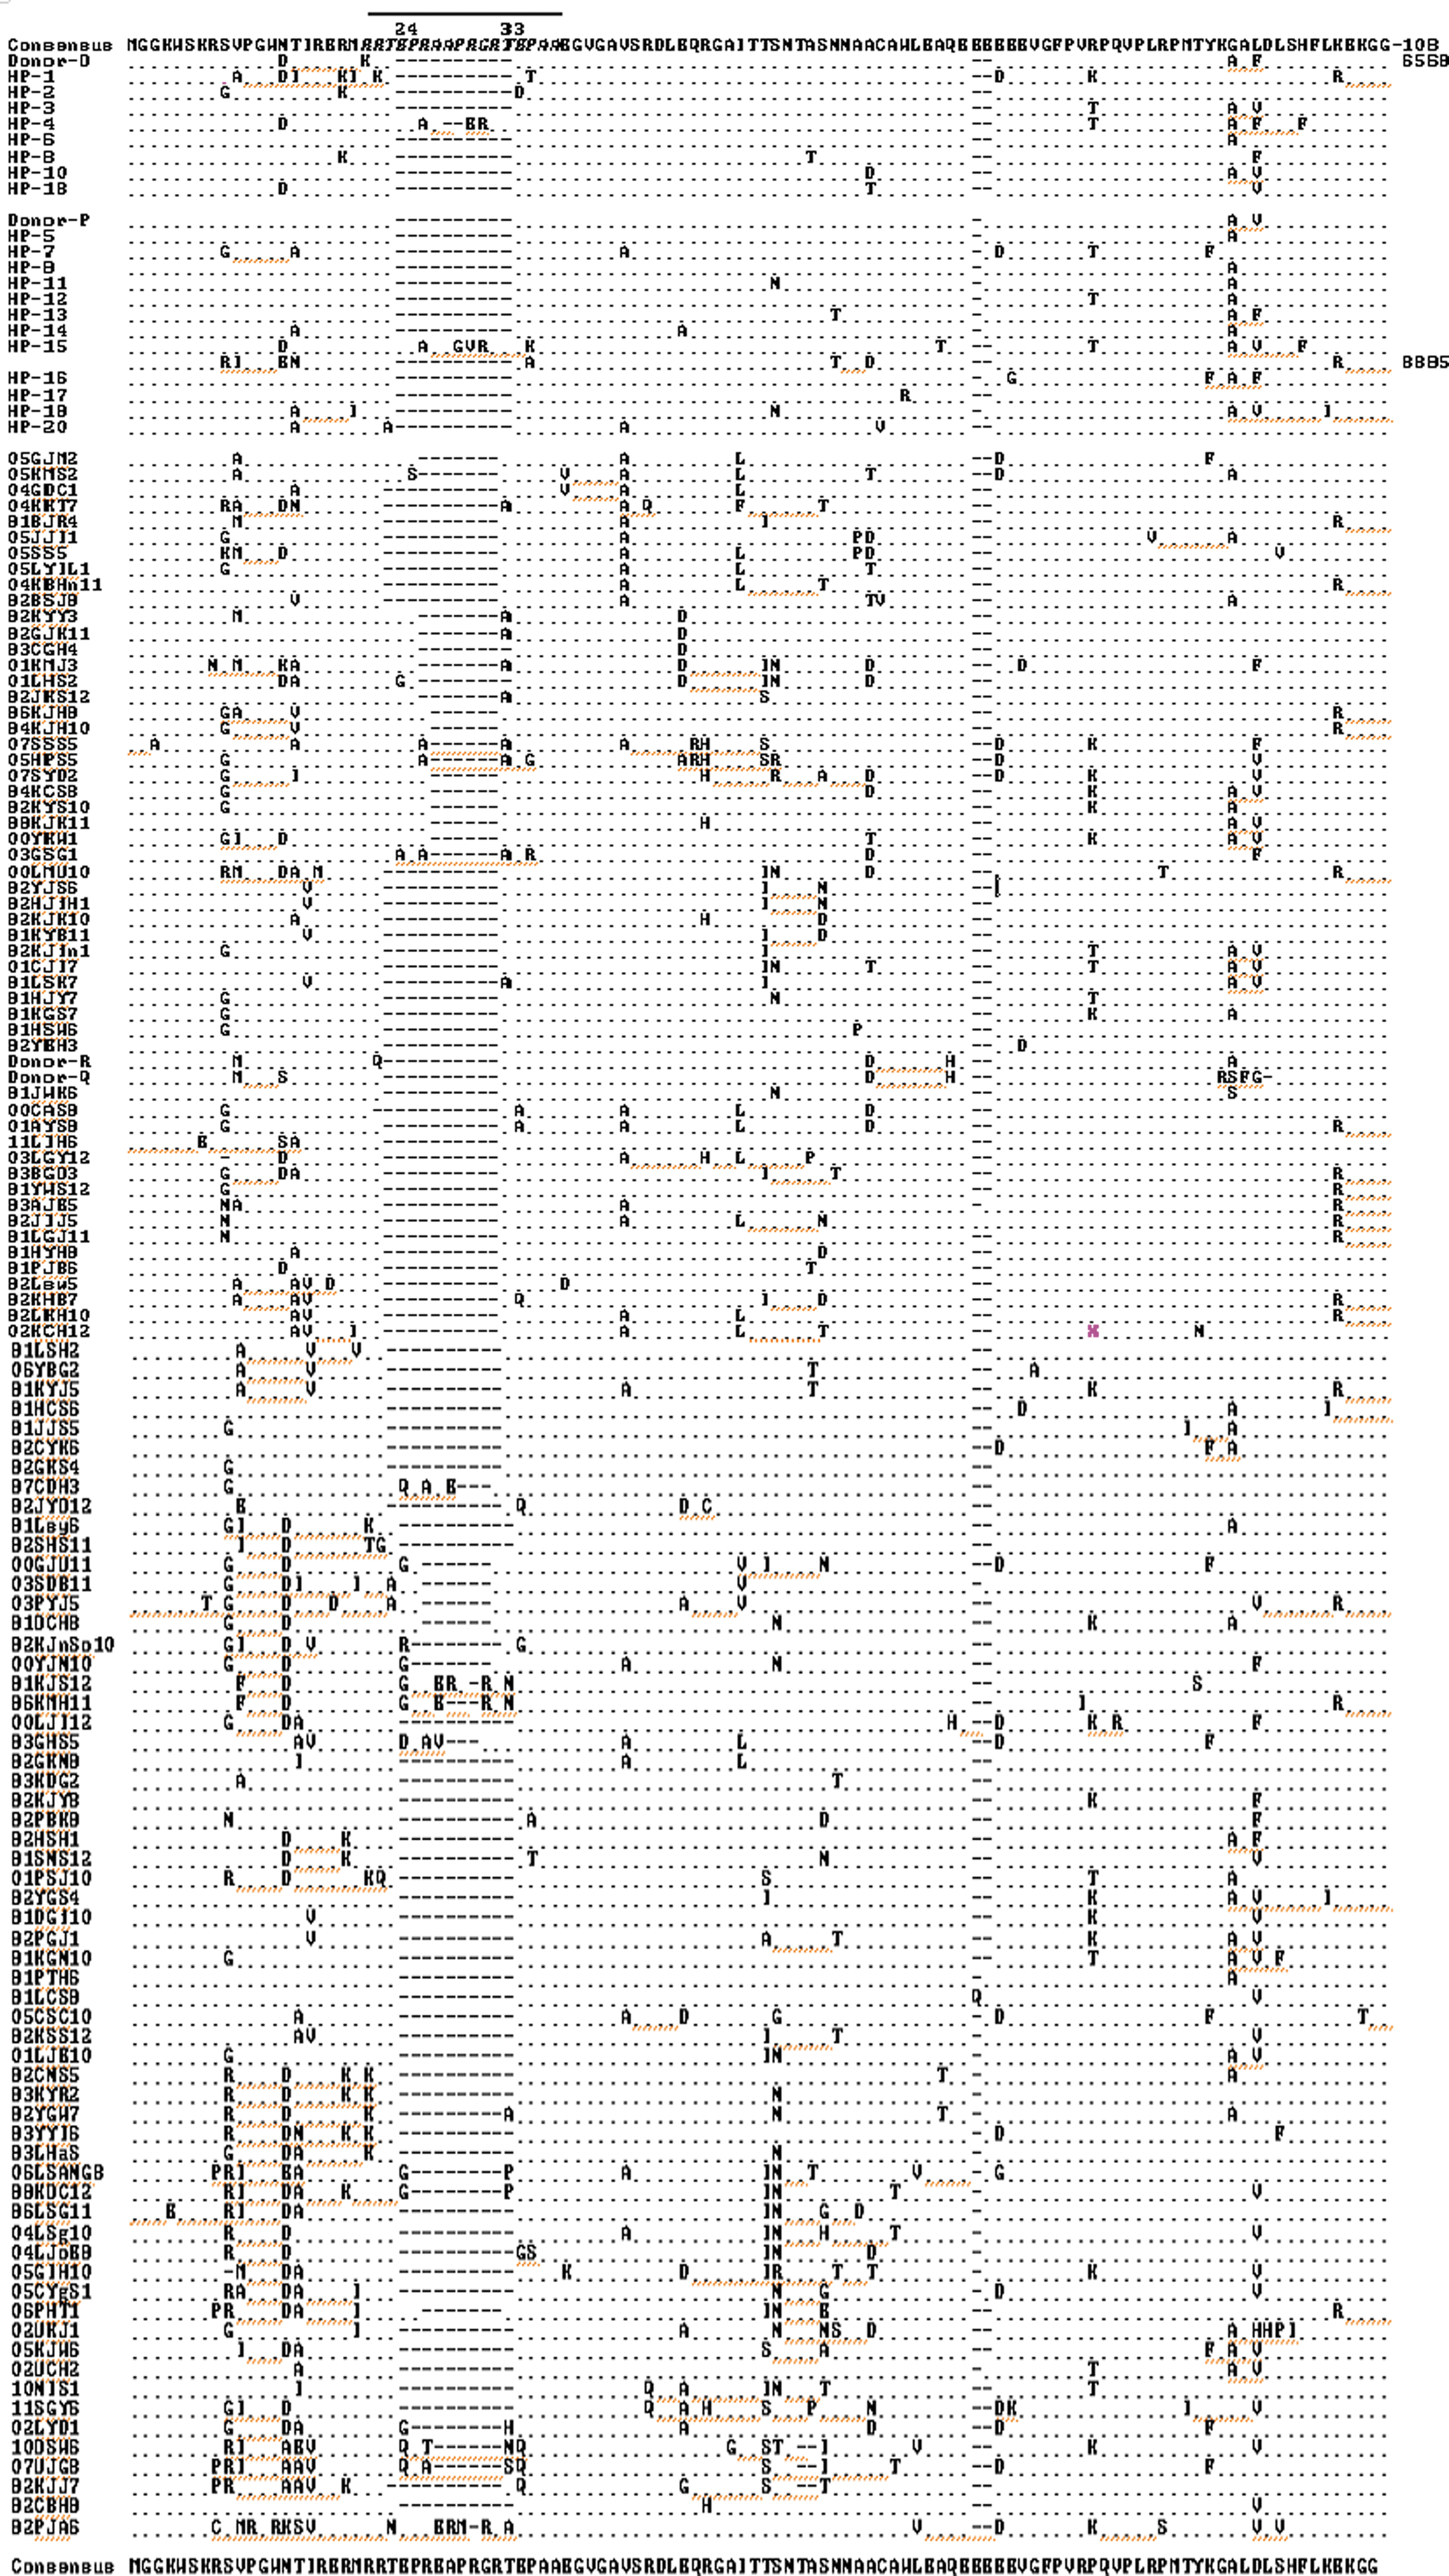
Alignment of Nef protein sequences from 20 HPs, 4 plasma donors, and 116 LCs infected with KSB (LCs). Three sequences from three LC patients with premature stop codons were excluded. Significantly high frequencies of amino acids at four positions in cluster O and at four in cluster P were observed, compared with the earliest sequences in 126 and 130 LCs, respectively (p<0.001 for all). The dot indicates the same sequence from Korean consensus sequences. The hyphen denotes deletions. Italic characters (RRTEPRAAPRGRTEPAA) indicate the variable region.
Frequency of Signature Pattern Nucleotides from Plasma Donors O and P
Signature patterns in clusters O (Oct 1991) and P (Sep 1991 and Feb 1993) show sets of four and six nucleotides, respectively, that were the most common, but atypical in background sequences (a majority signature). A1.00 at 8850 and T1.00 at 9113 denote A and T at 4 of 4 and 6 of 6 sequences, respectively. Lines from cluster O and P depict the frequencies of these nucleotides among viral sequences of 8 and 12 people with hemophilia, respectively. Each four of eight nucleotide positions revealed significantly higher frequency in clusters O or P, compared with background (p<0.01 for all). Five positions with nonsynonymous changes are presented in bold. Three sequences were excluded from this analysis.
NS change, nonsynonymous change in amino acid.
Sequence identities of donors O and P
We sequenced 37 and 9 nef genes in seven and three samples from donors O and P, respectively. In donor O, the intrapersonal sequence identities between four amplicons obtained in October 1991 were 99.2 to 98.6%, and decreased to 96.0–94.7% between October 1991 and January 2002. In donor P, the intrapersonal identity between two amplicons in September 1991 and between four amplicons in October 1993 was 100% and 100 to 99.5%, respectively, and decreased to 99.0–99.4% between September 1991 and October 1993. The nef sequence obtained from donor O in October 1991 displayed 97.62±1.6% identity to that of cluster O (range, 98.71–93.55%), and that (AY363309) from Donor P in September 1991 displayed 97.34±2.1% identity to that of cluster P (range, 99.19–91.35%). Four patients (HP4, HP15, HP17, and HP20) revealed insertion of nucleotides (24, 27, 3, and 3 base pairs, respectively) compared with donors O and P.
BLAST search
We searched in BLAST for the earliest sequences from donors O (AY363309) and P (AY363309), respectively. Sequences from six HPs (in order: HP8, HP6, HP2, HP18, HP3, and HP10) and four HPs (HP12, HP5, HP11, and HP9) most highly matched donors O and P, respectively.
Correlation between sampling intervals and number of nucleotide differences
We determined the correlation between sampling intervals from the exposure (presumed January 1990) and number of nucleotide differences, compared with that in the corresponding plasma donor (HM237144 in October 1991 and AY363309 in September 1991). Three patients for whom the first sampling was performed in 2002 or 2003 displayed the highest difference of >25 nucleotides (range, 5–54; mean, 30), with a correlation coefficient, γ, of 0.74 (p<0.0001; Fig. 3).

Correlation between months from the exposure (around January 1990) to the sample being used and the number of nucleotide differences in the 20 HPs, compared with corresponding plasma donors. Three patients (HP4, HP15, and HP20) who provided serum samples after 2002 displayed the highest nucleotide differences with ≥25 nucleotide changes. The correlation coefficient, γ, was 0.74 (p<0.0001).
Intra-patient variation between the earliest and latest detection of nef genes in 22 patients (20 HPs plus 2 plasma donors) was 0.039±0.023 over 90±57 months prior to HAART. The correlation coefficient, γ, for intra-patient sequence divergence between the earliest and latest detection of nef genes in these patients was 0.588 (p<0.01).
Presence of premature stop codons
Three sequences from three LC patients infected with KSB (two in DQ122083-04LJH6, two in DQ122116-05Lsh5, and one in DQ122108-05CHJ5) revealed premature stop codons. These sequences are excluded from Figure 2.
Comparison of sequence variation of the nef gene with vif and pol genes
We compared the sequence identity among three genes how much each gene varied from each donors. Sequence identity among patients was highest (>99.07%) for the pol gene, followed by vif (>98.80%). Despite the use of an earlier sample for nef compared with pol and vif genes (Table 1), the sequence identity of the nef gene between two donors and within each cluster was the lowest (<98.0%; Table 5). There was no significant difference in sequence identity for the pol and vif genes among patients in clusters O and P. In contrast, a significant difference between nef and pol or vif genes was noted between clusters (Table 5).
Comparison of Sequence Identity with Donors O and P Within Each Cluster
Cluster based on pol and vif genes.
p<0.01 in cluster P only.
p<0.05 between pol and nef genes in cluster O and between vif and nef genes in both clusters.
Evidence of the highly variable nef gene compared with pol and vif genes
In regard to insertions, HP4 and HP15 revealed similar insertions of 8 and 10 amino acids, respectively, compared with consensus sequences at the same variable region of the Nef protein (Fig. 2). Many sequences from HP4 revealed the same insertion of eight amino acids (24-EPAAERRT) although two sequences (AY221684 and FJ201810) revealed the wild-type sequence without insertion of 24 base pairs. All three sequences from HP15 revealed the same insertion of 10 amino acids (24-EPAAAGVRRT-33). In addition, donors O and P did not reveal variable sequences in the variable region. This may be because insertions may originate from the wild-type nef gene. In contrast, there were no insertions in the pol gene, and there was an amino acid insertion in the vif gene in one patient.
Absence of discordant subtypes among paired pol, vif, and nef genes
In previous studies, we determined the pol 11 and vif 12 gene sequences in 109 and 169 patients, respectively, all of whom are included in the present study. No discordant subtypes were detected among the three genes.
Discussion
In our present study, we amplified the nef gene in sera obtained earlier than the peripheral blood mononuclear cell samples used in previous studies,9,13 thereby facilitating extension of the follow-up period from 1991. Within these KSB cases with highly limited variations, donors O and P formed two clusters designated O and P, respectively. Both O and P were cash-paid donors who sold plasma for the production of clotting factors, and HPs seroconverted within a few years after using the Korean-made factor. KSB forms a distinct monophyletic clade that is not related to any of the international sequences from Los Alamos Database described in December 2010.11,12
Owing to the higher degree of genetic conservation of pol and vif compared with other genes, 10 our previous studies on pol and vif revealed three and two nucleotide positions that were 100% conserved in clusters O and P, respectively, and 0% conserved in LCs. However, there was no such conserved nucleotide position in the nef gene. In other words, the significance of statistics in the frequency was less in the nef gene than in the pol and vif genes, although eight nucleotide positions revealed statistical significance in the frequency between clusters O or P and LCs. Despite the absence of a conserved nucleotide position, showing a contrast of 100% versus 0%, epidemiologically linked sequences were weakly clustered in the two groups (Fig. 1). In the four patients, sampling was performed after 2002, suggesting a long lag between primary infection and sampling. Therefore, significant divergence may have occurred.
Thus, in the phylogenetic analysis, the pol gene showed two strongly demarcated clusters (O and P) that included only 8 and 12 HPs, respectively. The vif gene also revealed two strong clusters with only 7 and 12 HPs, respectively. However, the nef gene analysis revealed some dispersion in the LCs included in the analysis. Thus, several sequences (HP4, 6, 7, 15, and 20) did not belong to clusters O or P (Fig. 1), differing from the distribution seen for the pol and vif genes.
To date, the discordant subtypes or subclades of HIV-1 in Korean patients have not been identified. Therefore, the separations in the phylogenetic tree between cluster O and HP4 and between cluster P and HP7, HP15, and HP20, are natural due to the long time lag (>11 years except HP7) between primary infection and sampling (after 2002). In the same context, a genetic relationship between gag and env could not be established in another study in which specimens were collected >3 years after transmission. 16 Our data suggest that using a viral gene that undergoes rapid mutation may not be the best choice to use in epidemiological analyses, especially with samples that were collected from patients in whom viral infection occurred many years ago. Therefore, appropriate selection of the target viral gene is important in epidemiological studies for HIV-1 transmission evidence.
Footnotes
Acknowledgments
This work was supported by grants from the Korea Hemophilia Association (2009) and the Korean Society of Ginseng funded by the Korea Ginseng Corporation (2010–2011).
Author Disclosure Statement
The authors have no competing interests to disclose.