
Abstract
Although there are millions of formalin-fixed paraffin-embedded (FFPE) tissue blocks potentially available for scientific research, many are of questionable quality, partly due to unknown fixation conditions. We analyzed FFPE tissue biospecimens as part of the NCI Biospecimen Preanalytical Variables (BPV) program to identify microRNA (miRNA) markers for fixation time. miRNA was extracted from kidney and ovary tumor FFPE blocks (19 patients, cold ischemia ≤2 hours) with 6, 12, 24, and 72 hours fixation times, then analyzed using the WaferGen SmartChip platform (miRNA chip with 1036 miRNA targets). For fixation time, principal component analysis of miRNA chip expression data separated 72 hours fixed samples from 6 to 24 hours fixed samples. A set of small nuclear RNA (snRNA) targets was identified that best determines fixation time and was validated using a second independent cohort of seven different tissue types. A customized assay was then developed, based on a set of 24 miRNA and snRNA targets, and a simple “snoRNA score” defined. This score detects FFPE tissue samples with fixation for 72 hours or more, with 79% sensitivity and 80% specificity. It can therefore be used to assess the fitness-for-purpose of FFPE samples for DNA or RNA-based research or clinical assays, which are known to be of limited robustness to formalin overfixation.
Introduction
F
The optimal tissue fixation time, as estimated by RNA integrity electropherogram features and by branched DNA assays, was 12–24 hours in phosphate-buffered formalin, with significant degradation occurring at 36 and 48 hours fixation time and almost complete loss of targeted messenger RNA (mRNA) expression at 72 hours fixation time. 5 The optimal fixation time for mRNA preservation has been shown to be between 4 and 24 hours, depending on the tissue type and specimen size. 6
In the context of clinical diagnostic assays, little has been published on the impact of formalin overfixation on FDA-approved or CE-marked assays, performed with nucleic acids from FFPE tissue. Fixation of breast cancer tissue samples of up to 5 days did not affect the results of a clinical diagnostic gene expression assay, based on eight cancer related and 4 reference genes, whereas 10 days of fixation did. 7 However, clinical diagnostics based on Next Generation Sequencing (NGS) can be biased since the number of deamination variants, C:G>T:A that are identified by NGS, increases with tissue fixation for >48 hours. 8 Furthermore, for protein analyses by immunohistochemistry (IHC), the American Society of Clinical Oncology/College of American Pathologists guideline for IHC testing of estrogen and progesterone receptors in breast cancer, is that breast tissue specimens must be fixed in 10% neutral-buffered formalin (NBF) for no <6 hours and for not more than 72 hours before processing. Overfixation could lead to false-negative results as a result of excessive protein cross-linking by formaldehyde. The guideline also stipulates that this would particularly be true if there was inadequate antigen retrieval used during the performance of the ER/PgR assays, since usual antigen retrieval protocols are optimized for 24 hours of fixation time. 9
In the context of research and biomarker discovery, there is evidence that tissue fixation time is a critical factor. Formalin overfixation leads to more DNA damage due to deamination of cytosine bases, which has a detrimental effect on the accuracy of NGS. 10
Formalin overfixation (1 week vs. 20 hours) generates low-quality labeling and poor comparative genome hybridization profiles in array CGH analyses. 11 When evaluated in the context of DNA microarray and whole-transcriptome sequencing platforms, liver tissue fixation time of 3 weeks compared to 18 hours resulted in half the RNA yield, increased the RNA input needed for library preparation, and led to lower correlation with frozen samples, detection of fewer differentially expressed genes and deterioration of microarray signal intensity. 12
Although several quality control (QC) tools exist, which allow us to qualify tissue samples, we still do not have an assay that will allow us to identify overfixed tissue samples. 13
Multiple studies, especially in the cancer field, have suggested that micro RNAs (miRNAs) can be used as diagnostic biomarkers.14,15 The advantage of miRNAs lies in their robustness. Due to their small size and the fact that they are protected in protein macromolecular complexes, miRNAs are resistant to degradation and chemical modification in FFPE tissue samples, and correlate with expression levels from corresponding frozen tissue, better than longer mRNAs.16,17 Despite the relative robustness of the miRNAs, a miRNA deep-sequencing study on cardiac tissue samples, fixed in formalin for periods of between 5 and 45 days concluded that the miRNA read counts in FFPE specimens are comparable only if the tissue samples are processed under the same fixation conditions. 18 Apart from the miRNAs, another category of short RNA molecules is the small nuclear RNAs (snRNAs) whose robustness to fixation conditions has not yet been studied.
Our study had two objectives: (1) to evaluate the robustness, not of just a few, but of more than 950 miRNA targets, to different fixation times, and (2) to identify at least one small RNA target that is sensitive to overfixation conditions and therefore could be used as a QC tool to assess overfixed tissue samples, particularly in legacy collections of unknown preanalytics.
Materials and Methods
Samples used
Biospecimen Preanalytical Variables (BPV) biospecimens were collected at four Biospecimen Source Sites (BSS) and sent to the centralized BPV biospecimen repository at Van Andel Research Institute where 10 kidney and 9 ovary tumor tissues were selected for this study, with <2 hours cold ischemia time, and 10–12 hours processing time (time in the tissue processor). 19 For each specimen, the BSS prepared a frozen aliquot and FFPE samples with four different fixation times: 6 hours (Sample PREanalytical Code [SPREC] code D), 12 hours (SPREC code E), 23 hours (SPREC code E), and 72 hours (SPREC code G),1,2 95 samples in total. These blocks were stored at room temperature until RNA extraction and were used as training set.
From an IBBL biospecimen research collection, six colon/sigmoid, one kidney, one ovary, two uterus, one rectum, six breast, two ileum tissue specimens were selected with 10 minutes to 31 hours ischemic times, and with 12.5 hours processing time. For each specimen, IBBL prepared FFPE samples with three different fixation times: 12–15 hours (SPREC code E), 48–52 hours (SPREC code G) and 72–76 hours (SPREC code Z). Fixation times were documented for all 19 specimens, and 57 samples were available for further testing. These blocks were stored at −20°C until RNA extraction and were used as a validation set. All patients signed an informed consent and the study had Ethics Committee approval under UNM IRB protocol 11-279 (University of New Mexico), IRB protocol study ID number 45796 (Emory University), IRB number 0506140 (University of Pittsburg), IRB number H-32145 (Boston Medical Center), and CPP number DC-2010-1145 (France).
RNA extraction and initial qualification
RNA extraction from all frozen tissue and FFPE samples was performed with miRNeasy Qiagen Kit (Ref. 217504; Qiagen) on a QIAcube platform. RNA quantification was performed by spectrophotometry, and the RNA integrity number (RIN) was determined on an Agilent 2100 Bioanalyzer. The tissue samples of the training set (Van Andel Institute) contained at least 60% tumor and <20% necrosis. The tissue samples of the validation set (IBBL) contained 10%–90% tumor and 0%–30% necrosis.
WaferGen SmartChip assay
0.5 μg of extracted RNA was poly A tailed using Poly(A) Polymerase Tailing Kit (Epicentre) with reverse transcription (RT) buffer from the High-Capacity complementary DNA (cDNA) RT Kit and RNase inhibitor (both Applied Biosystems), for one cycle of 30 minutes at 37°C, followed by 5 minutes at 70°C, in a Thermocycler (C1000; Bio-Rad Laboratories). Samples were stored at 4°C overnight. Poly A-tailed RNA was transcribed to cDNA by a reverse transcription reaction using High-Capacity cDNA Reverse Transcription Kit (Applied Biosystems) with SmartChip miRNA RT primers (WaferGen), running one cycle of 60 minutes at 40°C, followed by a 5 minutes at 85°C inactivation step. cDNA samples were stored at −80°C. For quantitative polymerase chain reaction (qPCR), the total cDNA sample was used, mixed with 500 μL LightCycler 480 DNA SYBR Green 1 Mix (Roche Applied Science), with 1 mg glycogen (Roche Applied Science), 1 μg M13mp18-ssDNA (New England Biolabs), spiked in yeast controls (2.0 μL from Saccharomyces cerevisiae S288c; WaferGen), and made up to 1 mL with PCR grade H2O (Roche Applied Science). Samples were loaded onto a SmartChip Human miRNA Panel v3.0 (WaferGen) with a Multisample Nanodispenser (WaferGen) and processed with a SmartChip Cycler (WaferGen) using Human miRNA v3 Protocol Rev F, or loaded chips were frozen at −20°C until processing. Quadruplicate analysis was performed for each miRNA, fixation time point and tissue type.
To demonstrate the reproducibility of the SmartChip miRNA assay, the Stratagene QPCR Human Reference Total RNA (Ref. 750500; Agilent) was run in triplicate, on three different chips, each run on a different day.
WaferGen customized miRNA chip assay
For high-throughput purposes, a customized WaferGen SmartChip was designed, allowing analysis of 48 samples per SmartChip. This chip contained only the primers for the following 24 targets: HSA-LET-7A, HSA-LET-7D, HSA-LET-7E, HSA-MIR-103, HSA-MIR-107, HSA-MIR-1251, HSA-MIR-1260, HSA-MIR-154, HSA-MIR-17, HSA-MIR-27A, HSA-MIR-320C, HSA-MIR-326, HSA-MIR-339-5P, HSA-MIR-4279, HSA-MIR-720, RNU12, RNU2-1, SCARNA5, SNORA16A, SNORA44, SNORA61, SNORD99, WGBS-YCF2, and WGBS-YCF3. Each target was printed in quadruplicate per sample loading area. The sample processing for the customized chip was identical to the WaferGen SmartChip Assay as described above; the only difference consisted in dividing the used reagent quantities by 40 per sample. The samples of the validation set were tested on the customized chip.
Data analysis
Data analysis on the standard miRNA SmartChip
miRNA qPCR profiles were analyzed with the WaferGen qPCR v2.5 software (see Supplementary Table S1 for detailed analysis settings; Supplementary Data are available online at www.liebertpub.com/bio). Cycle threshold (Ct) values were exported to qBase v 2.6.1 software (Biogazelle) and analyzed by sample grouping according to the fixation times. Global normalization and target scaling to average were used for qBase parameters calculation settings. Calibrated normalized relative quantities (CNRQ) data (global normalization) were exported to Excel (Microsoft) from samples with the following QC criteria: Global normalization factor between 0.3 and 3.33; Reference Targets Stability with an average GNorm M < 1.0 and coefficient of variation (CV) <0.6. Negative results were replaced by a minimal CNRQ value of 0.050 to avoid artificially decreasing CVs. miRNA variability was expressed in terms of CV of the CNRQ, and miRNAs were ordered accordingly.
Principal component analysis (PCA) was performed to evaluate miRNA expression patterns of all FFPE experimental groups relative to each other. For each miRNA, linear mixed effects models with random intercepts were used to estimate differences in log expression by protocol, while accounting for the within-sample correlation due to specimens coming from the same patient. The model contained five parameters, the intercept and four parameters for each of the preanalytical conditions (fixation for 6, 12, 23, and 72 hours). We used the likelihood ratio test for the global hypothesis that any of the four parameters differ from 0. This is a test of whether there are any differences in average expression among the preanalytical conditions tested, including the frozen control, without assuming linear relationships. We repeated this model excluding the frozen control, thereby testing for any differences in miRNA expression among the fixation times. Box plots were calculated, showing the median and 95% confidence intervals for the median. The accuracy of the expression scores for predicting fixation times were assessed using receiver operating characteristic (ROC) curve analysis, in which we estimated sensitivity, specificity, and the area under the ROC curve. To select an optimal cutoff from the ROC curve, we calculated the point with the minimum distance to the upper-leftmost corner (0, 1).
Analyses were performed using R version 3.3.2 (R Foundation for Statistical Computing, Vienna, Austria).
Data analysis for the selection of the targets of the customized chip
For detection of the highly expressed miRNAs, either stable or variable, the CVs of the CNRQ values for each fixation time and tissue type were ranked together with the mean of the corresponding replicate nonnormalized Ct values. The miRNA targets were selected based on detection in more than 95% of the samples and a quantification level of <22 Cts. A panel of 15 fixation-stable miRNA (CNRQ CV <20%), 7 fixation-unstable small RNAs (CNRQ CV >50%), and 2 yeast control targets were selected for the customized chip panel.
Results
Reproducibility of the SmartChip miRNA assay
Global normalization of the qPCR Human Reference Total RNA, run in triplicate, on three different chips, resulted in normalization factors of 0.95, 1.02, and 1.04, respectively. The RNU12, RNU2-1, SCARNA5, SNORA16A, SNORA44, SNORA61, and SNORD99 were used as reference targets in the WaferGen miRNA SmartChip. The stability of each of these reference targets, as expressed in GNorm, was in the range of 0.07–0.14, and the CV ranged from 3% to 10%, both parameters being within the qBase acceptance range of variance. The coefficient of determination (R2) between every combination of two replicates (1 vs. 2, 1 vs. 3, and 2 vs. 3) was 0.98–0.99 (Supplementary Fig. S1).
Training set; miRNA robustness to fixation time
For the ovary tissue, the average RIN obtained from 36 FFPE samples was 2.3 (standard deviation [SD] 0.6), while the average RIN obtained from the 9 corresponding frozen samples was 7.8 (SD 2.8). For the kidney tissue, the average RIN obtained from 40 FFPE samples was 2.8 (SD 1.0), while the average RIN obtained from the 10 corresponding frozen samples was 6.7 (SD 1.7).
The standard miRNA WaferGen SmartChip was used and two samples were excluded due to technical errors during manipulation.
The F test was performed for the global hypothesis that any of the four conditions (frozen, fixed for 6, 12, 23, and 72 hours) were significantly different. When the frozen samples were included in the analysis, in both ovary and kidney tissue, there were some marked differences in miRNA expression between FFPE samples and frozen control samples. On average, the fold difference in expression between frozen and FFPE was 98.7% in kidney and 117.3% in ovary tissue. For some miRNAs, the FFPE samples had lower expression levels, while for other miRNAs, FFPE samples had higher expression levels than their frozen counterparts. In kidney tissue, there were some differences in miRNA expression, between fixation times, among FFPE samples. On average, the fold difference in expression levels, between 72 and 6 hours fixation was 97.4%. We did not find many significant differences in expression levels among ovary FFPE samples. All the p-values are shown in Supplementary Table S2. PCA plot analysis showed good separation not only between FFPE and frozen samples but also between 72 hours fixation time (over-fixed samples) and 6, 12, and 23 hours fixation times (Fig. 1).
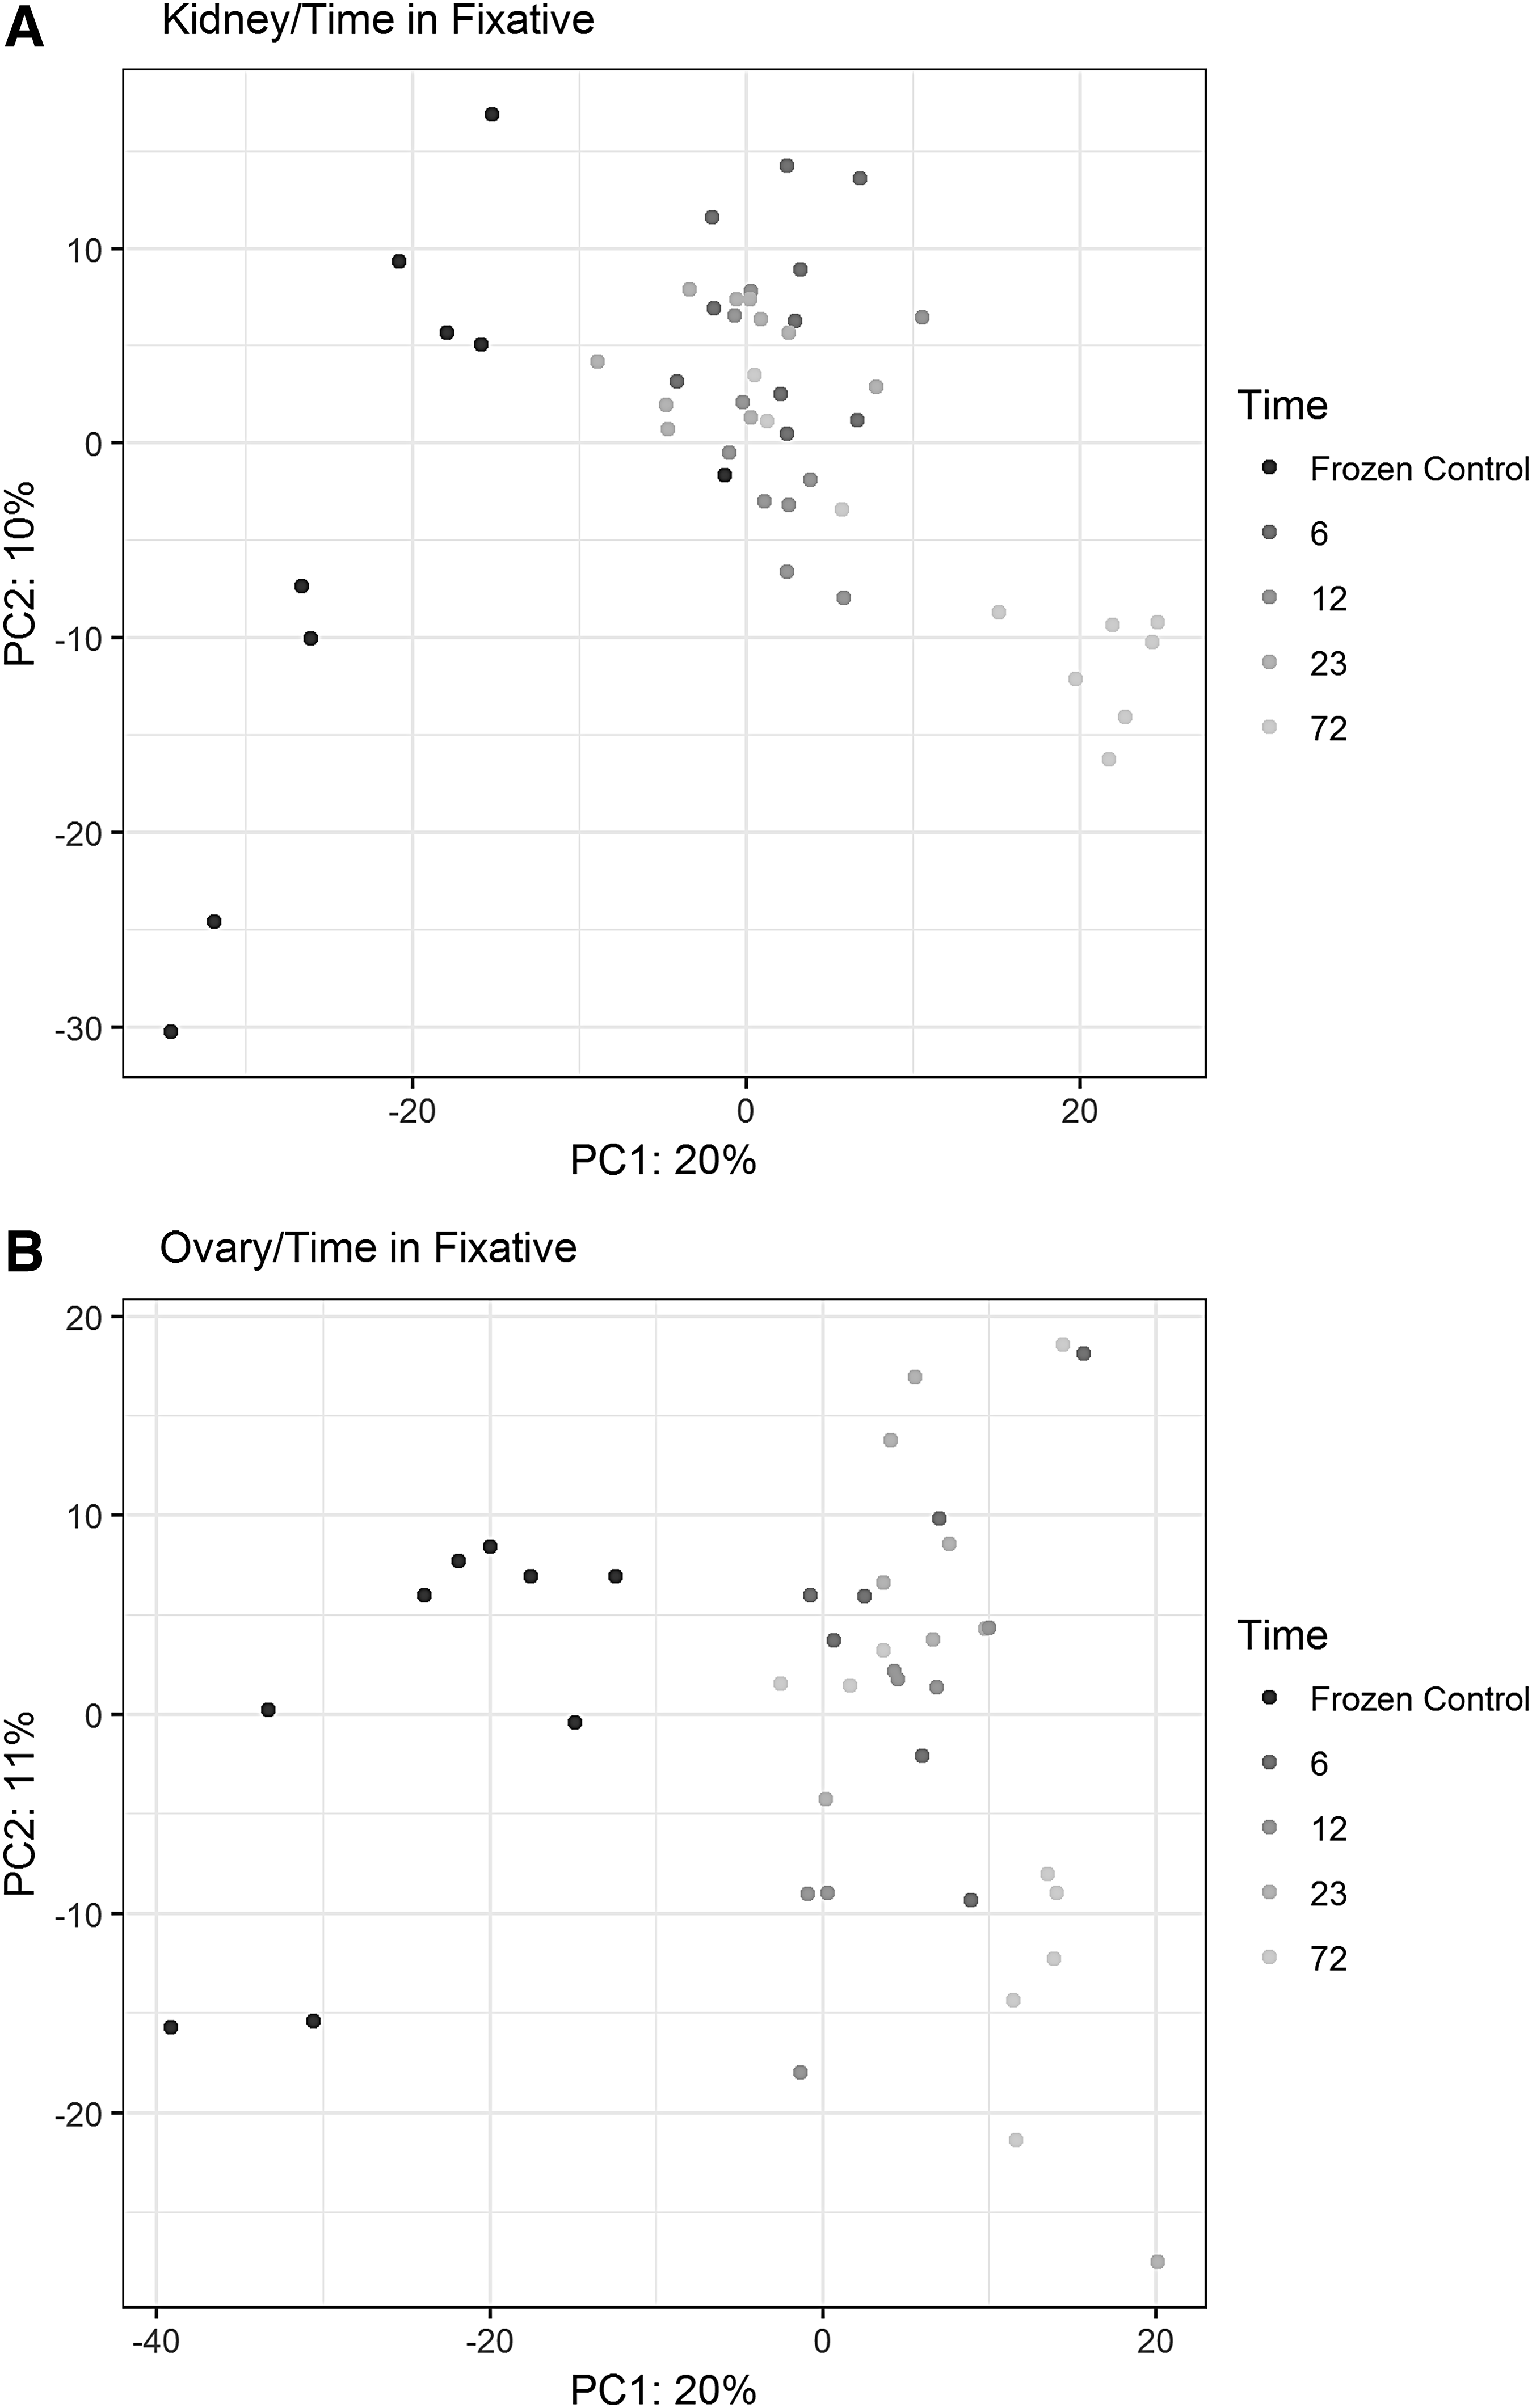
PCA plot for
Identification of miRNAs sensitive to overfixation conditions
After classification of all the miRNAs and small nucleolar RNAs (snoRNAs) based on CNRQ variability (CV %), we found that the most unstable targets were SCARNA5, SNORA16A, SNORA44, and SNORA61 (Fig. 2).
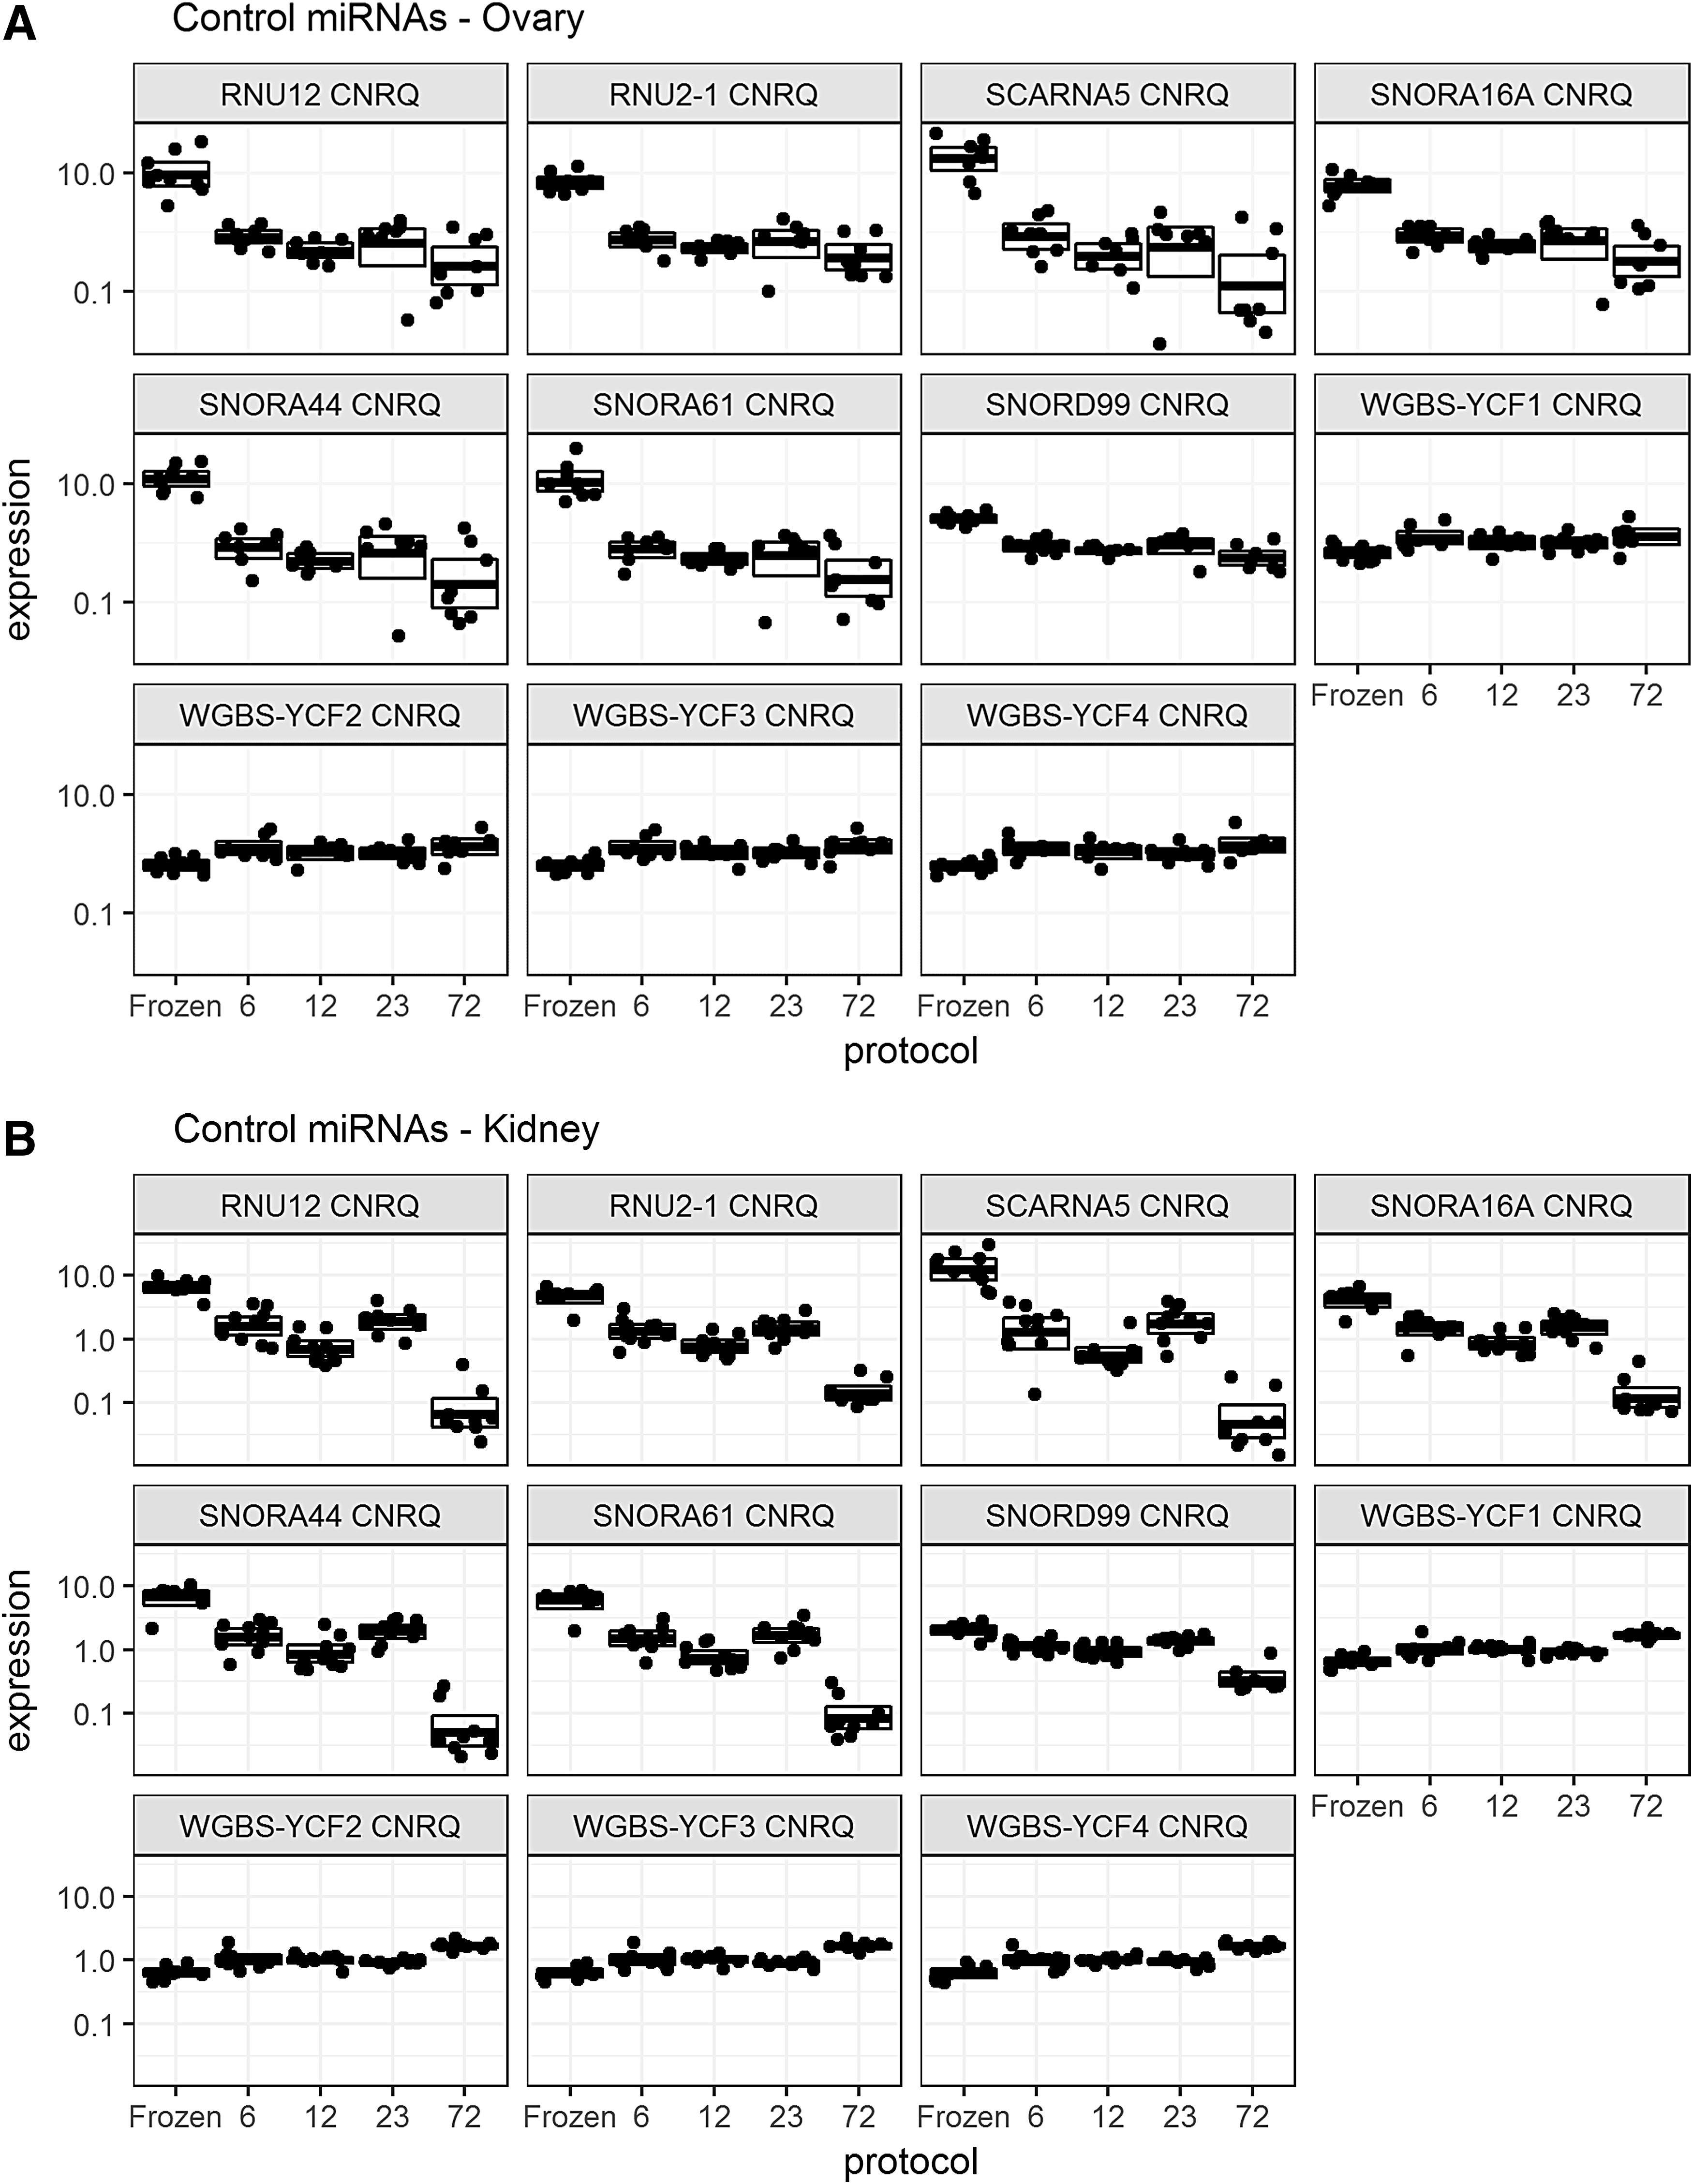
Box plot analysis of miRNA/snoRNA targets with significant differences in their raw Ct values between frozen samples and samples fixed for different fixation times (fixation times indicated on the horizontal axis), in the training set of kidney
We calculated a score (“snoRNA CNRQ score”) that is the sum of the logCNRQ values for SCARNA-5, SNORA-16A, SNORA-44, and SNORA-61 (snoRNA CNRQ score = logCNRQ SCARNA5 + logCNRQ SNORA16A + logCNRQ SNORA44 + logCNRQ SNORA61). Based on this score, there was a clear distinction between samples with fixation time corresponding to SPREC codes D and E (6–12 hours) and samples with fixation time corresponding to SPREC code G (72 hours). ROC curve analysis based on this score showed a sensitivity of 85% and a specificity of 88% (area under the curve [AUC] = 0.898) in the detection of FFPE tissue samples that were fixed for 72 hours versus those that were fixed for 6, 12, or 23 hours (Fig. 3).
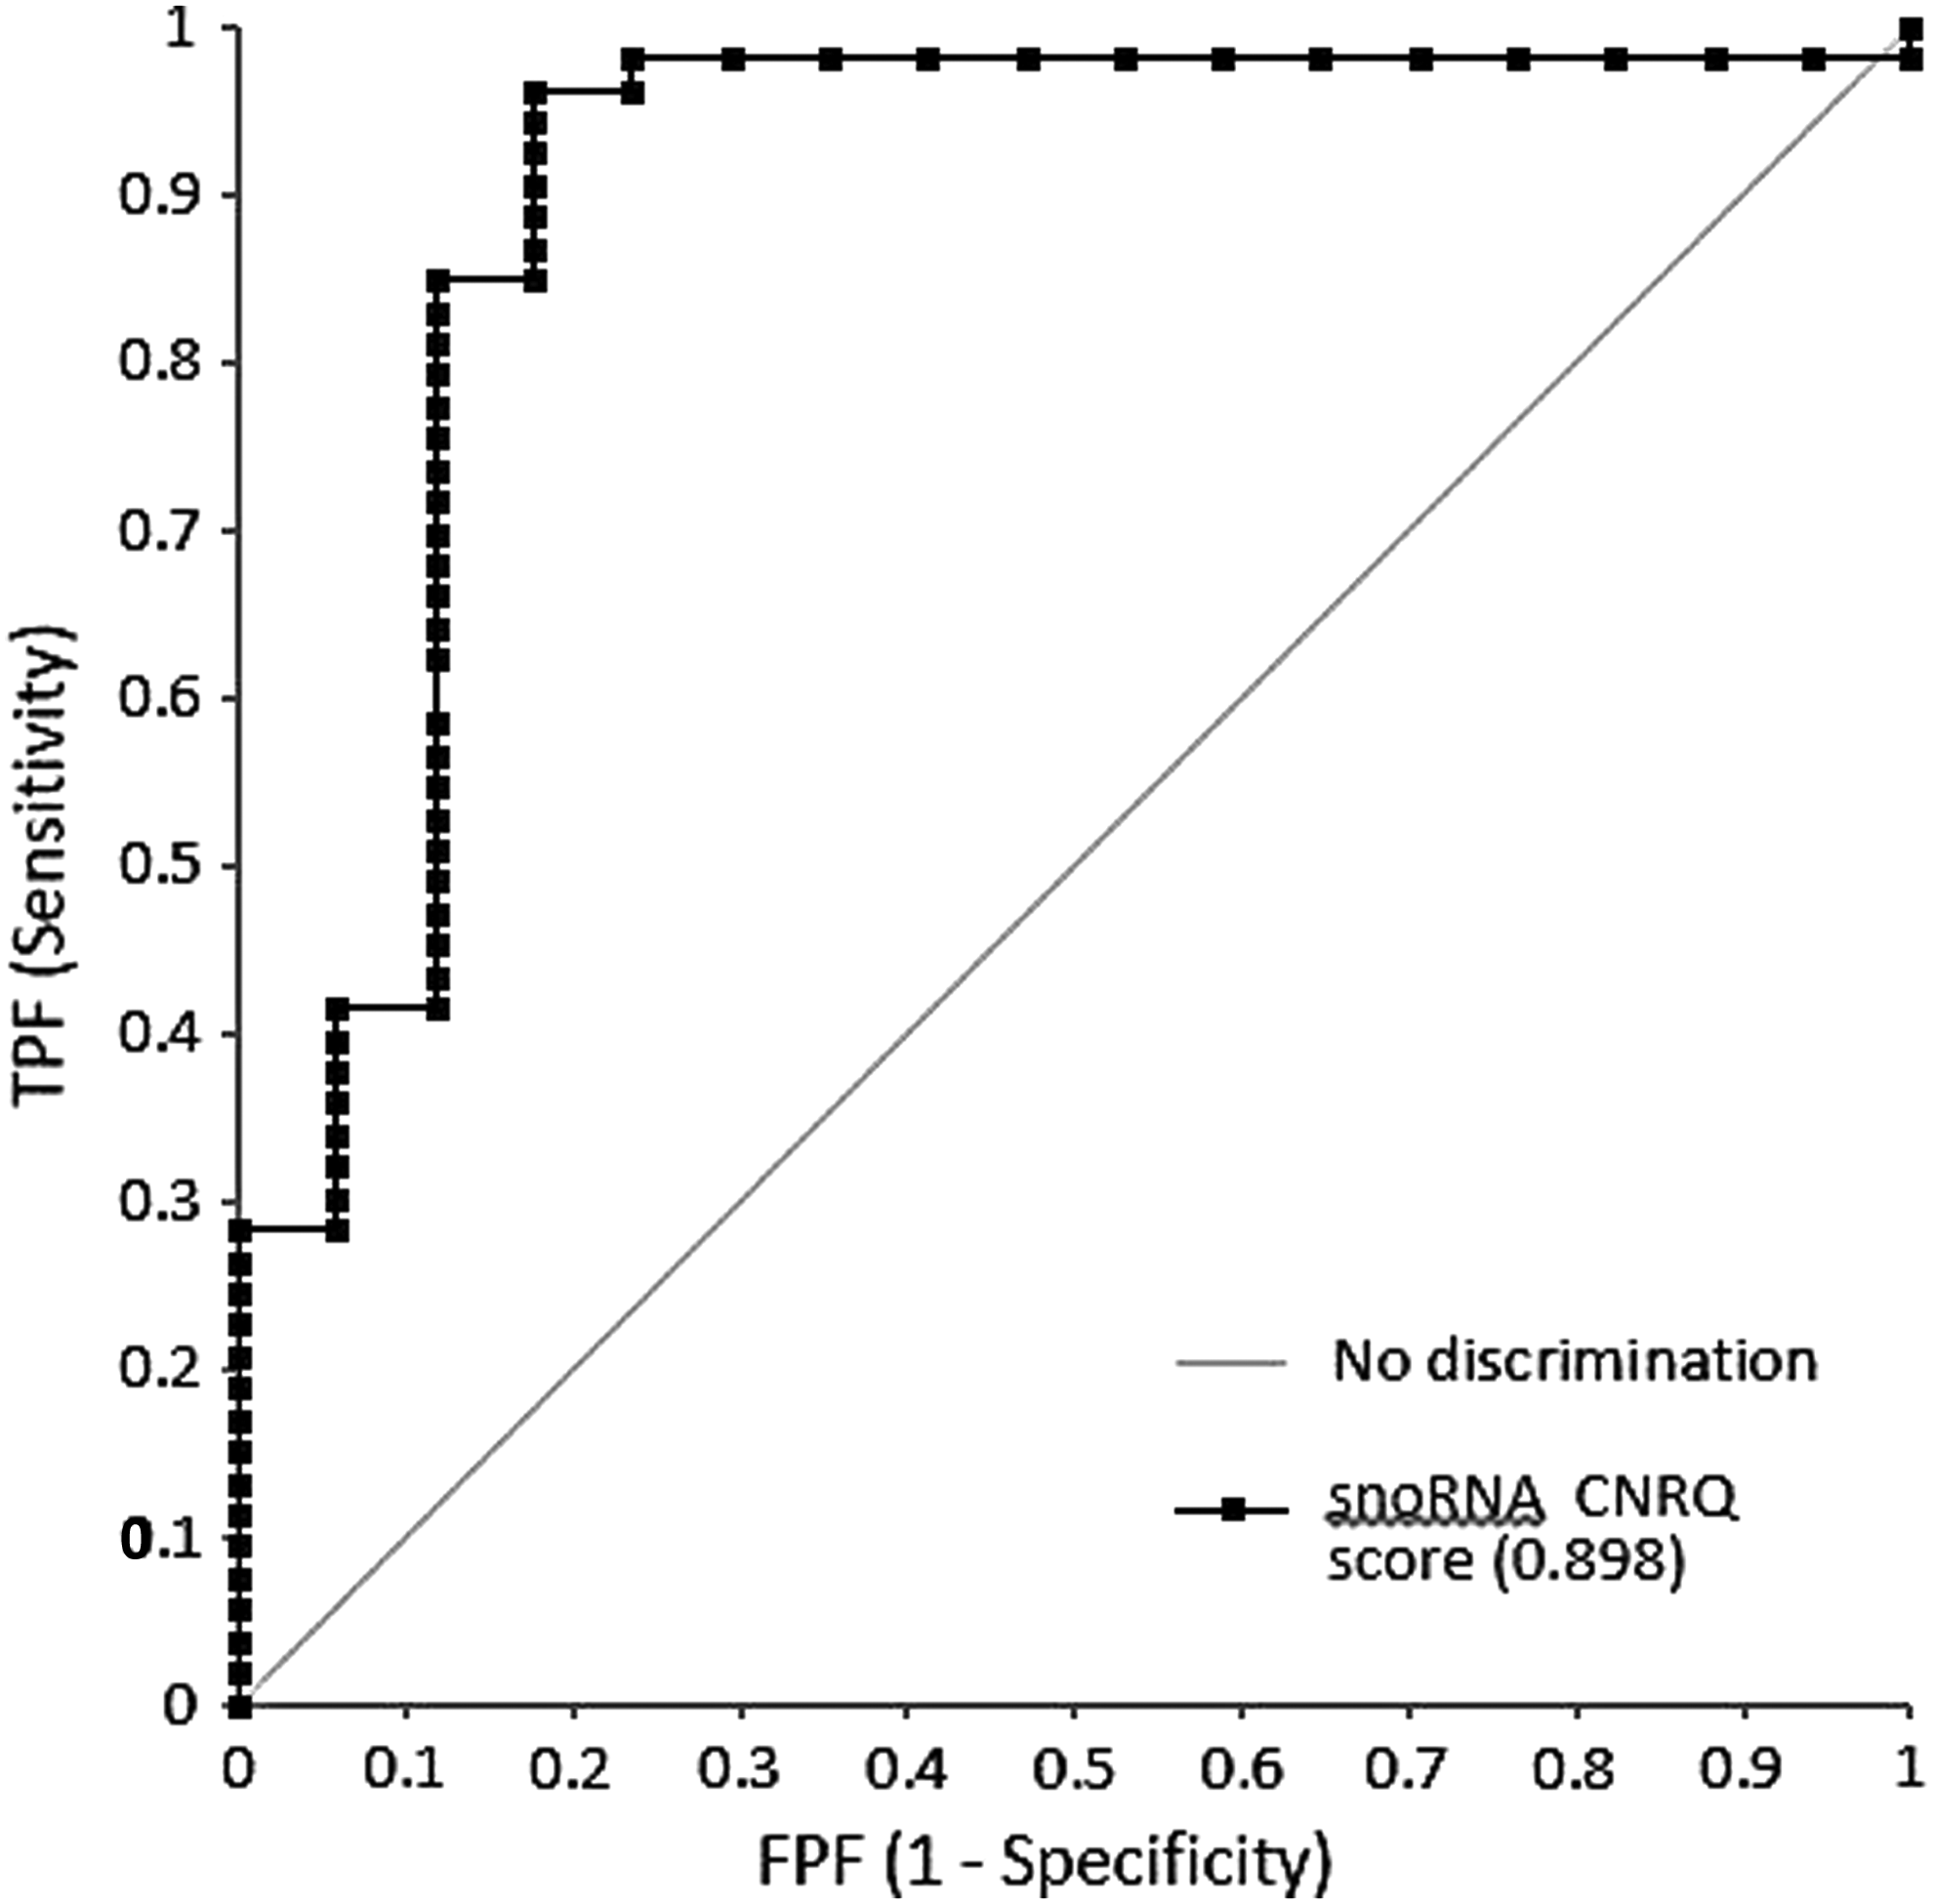
ROC curve for the ovary and kidney tissue samples (training set, including samples of different fixation times, but not the frozen samples, n = 78), analyzed on the WaferGen standard SmartChip with the “snoRNA CNRQ score” analysis (snoRNA CNRQ score = logCNRQ SCARNA5 + logCNRQ SNORA16A + logCNRQ SNORA44 + logCNRQ SNORA61). CNRQ, calibrated normalized relative quantities; ROC, receiver operating characteristic.
Validation set
The “snoRNA CNRQ score” was applied to 19 specimens of different tissue types, collected in IBBL, each subjected to 3 fixation times; 8–24 hours (SPREC code E), 48–72 hours (SPREC code G), and >72 hours (SPREC code Z). Four samples failed on the WaferGen SmartChip assay; one sample with E, one with Z, and two with G fixation time points. The sensitivity of the snoRNA targets to overfixation was confirmed (Fig. 4), and ROC curve analysis, based on the “snoRNA CNRQ score,” showed a sensitivity of 88% and a specificity of 91% in the detection of FFPE tissue samples with ≥72 hours fixation time (Fig. 5).
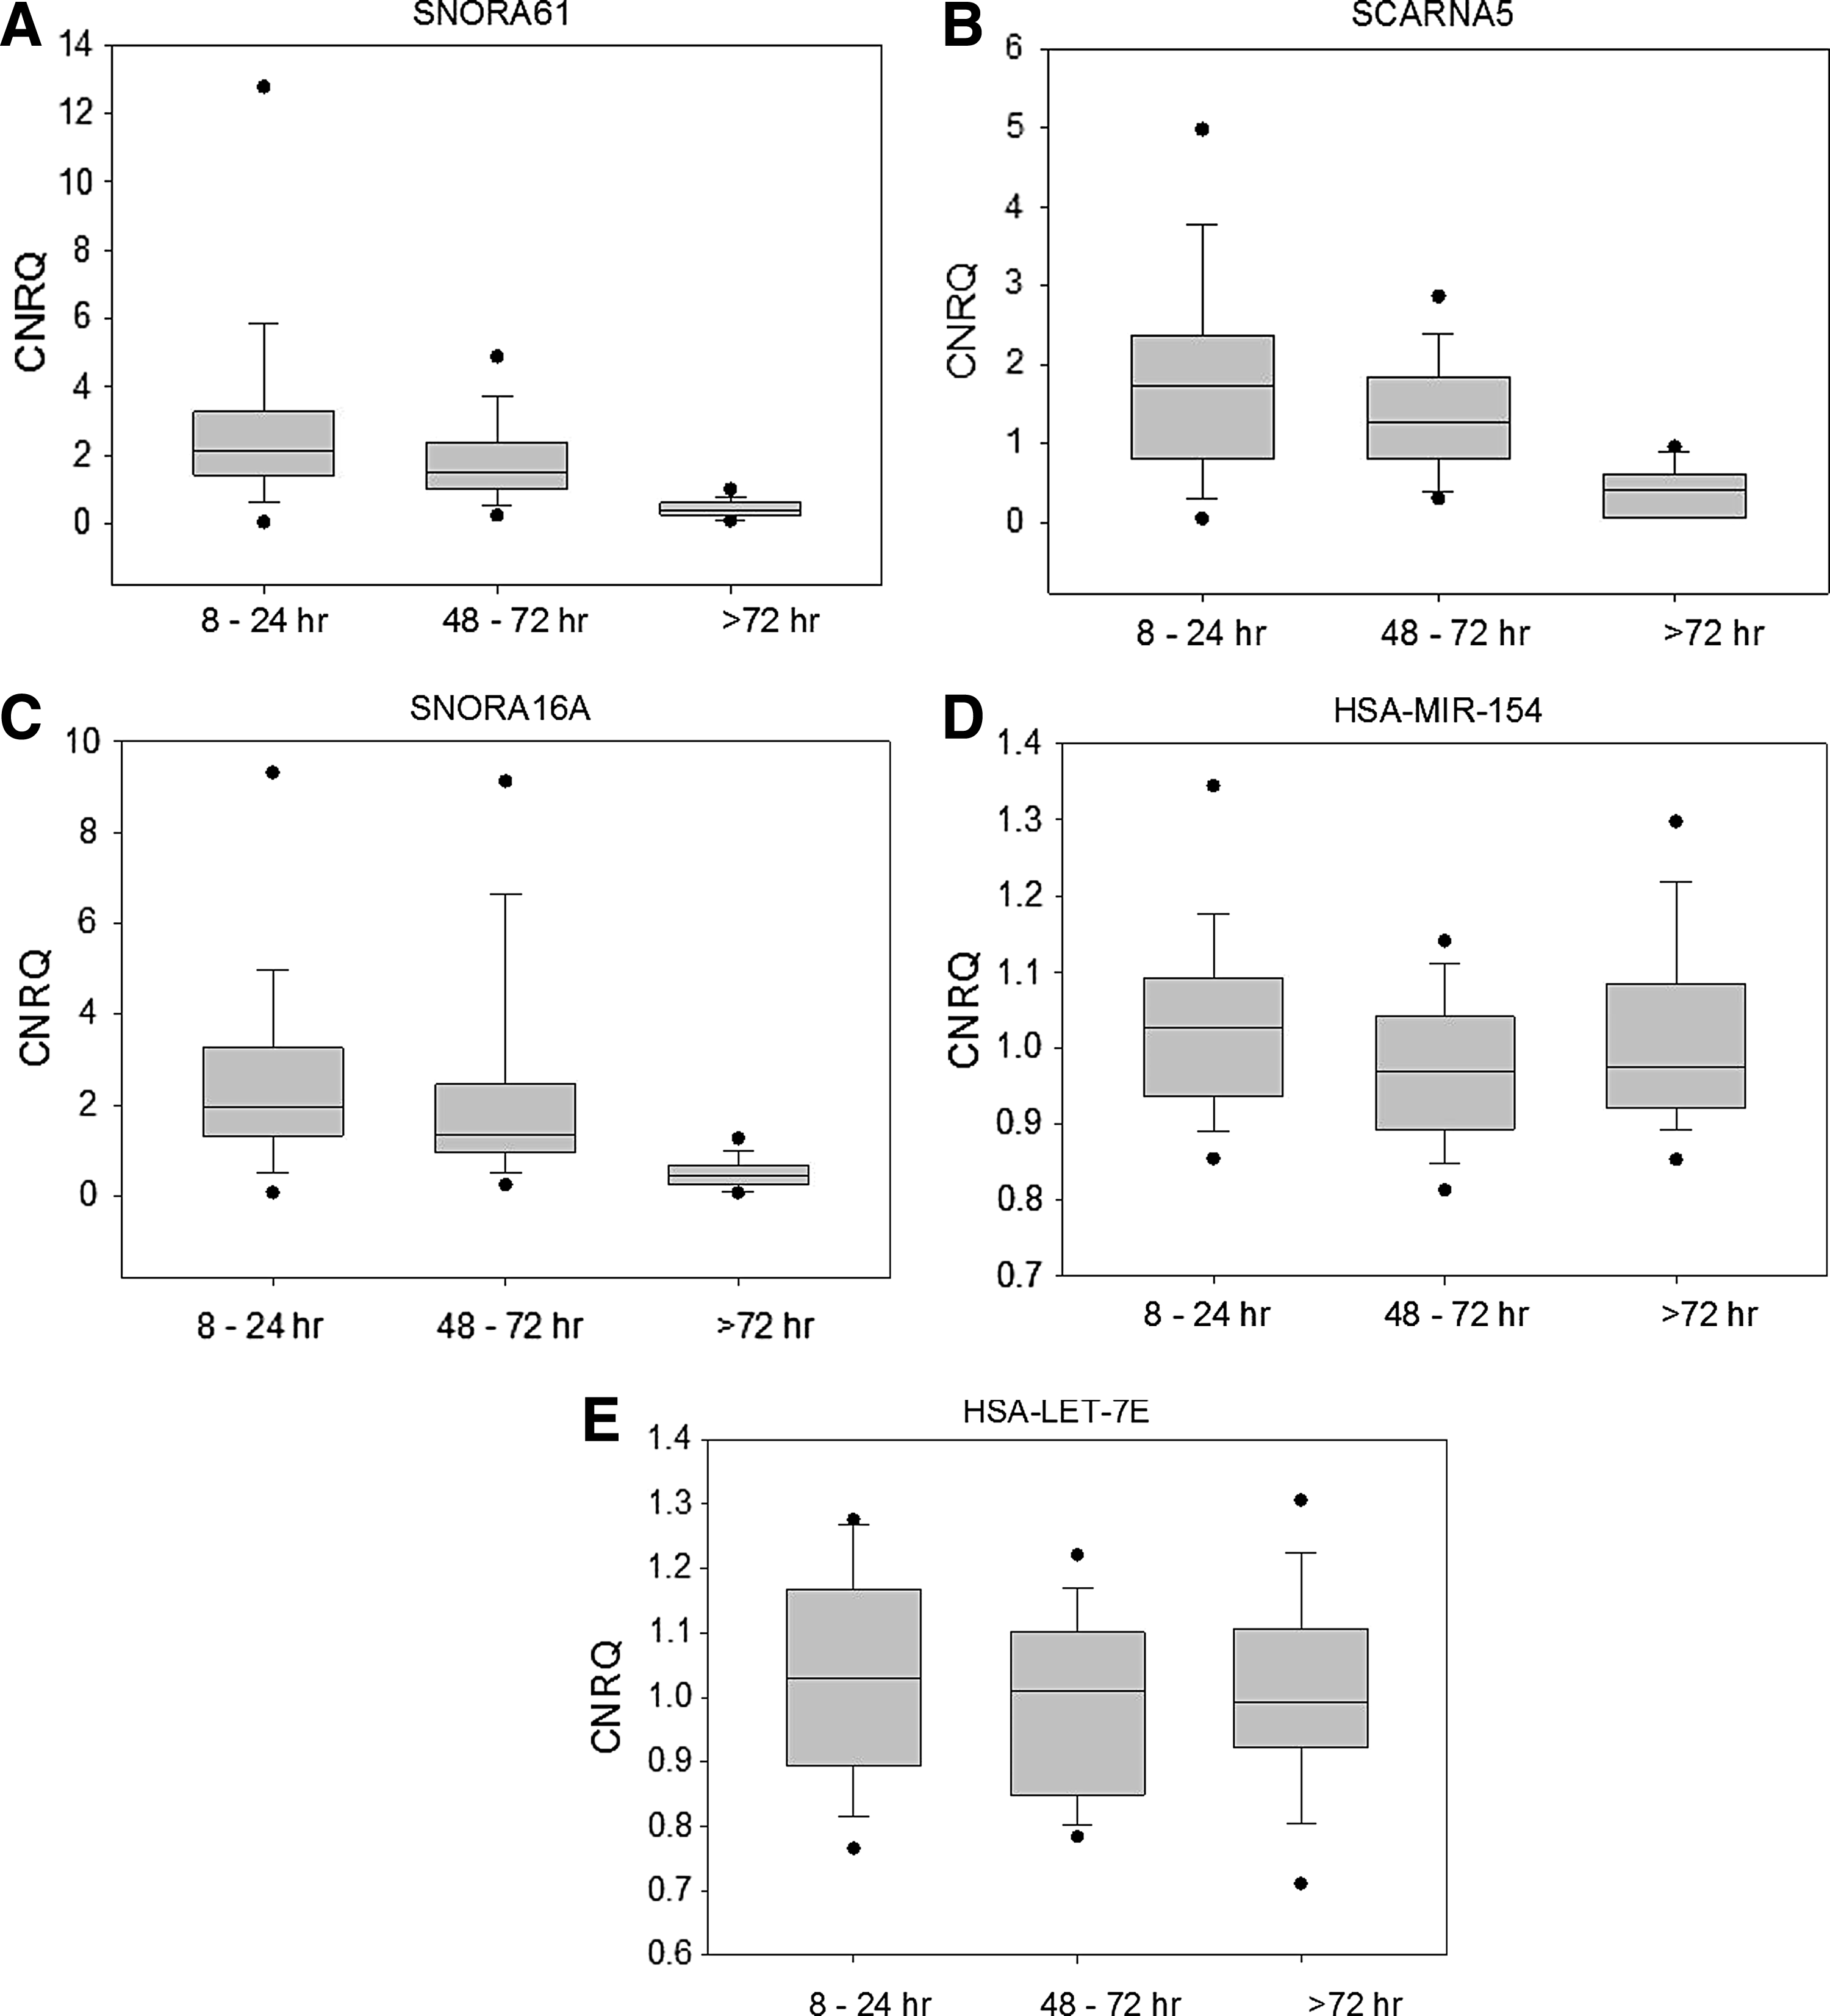
Boxplots of CNRQ scores of representative examples of unstable
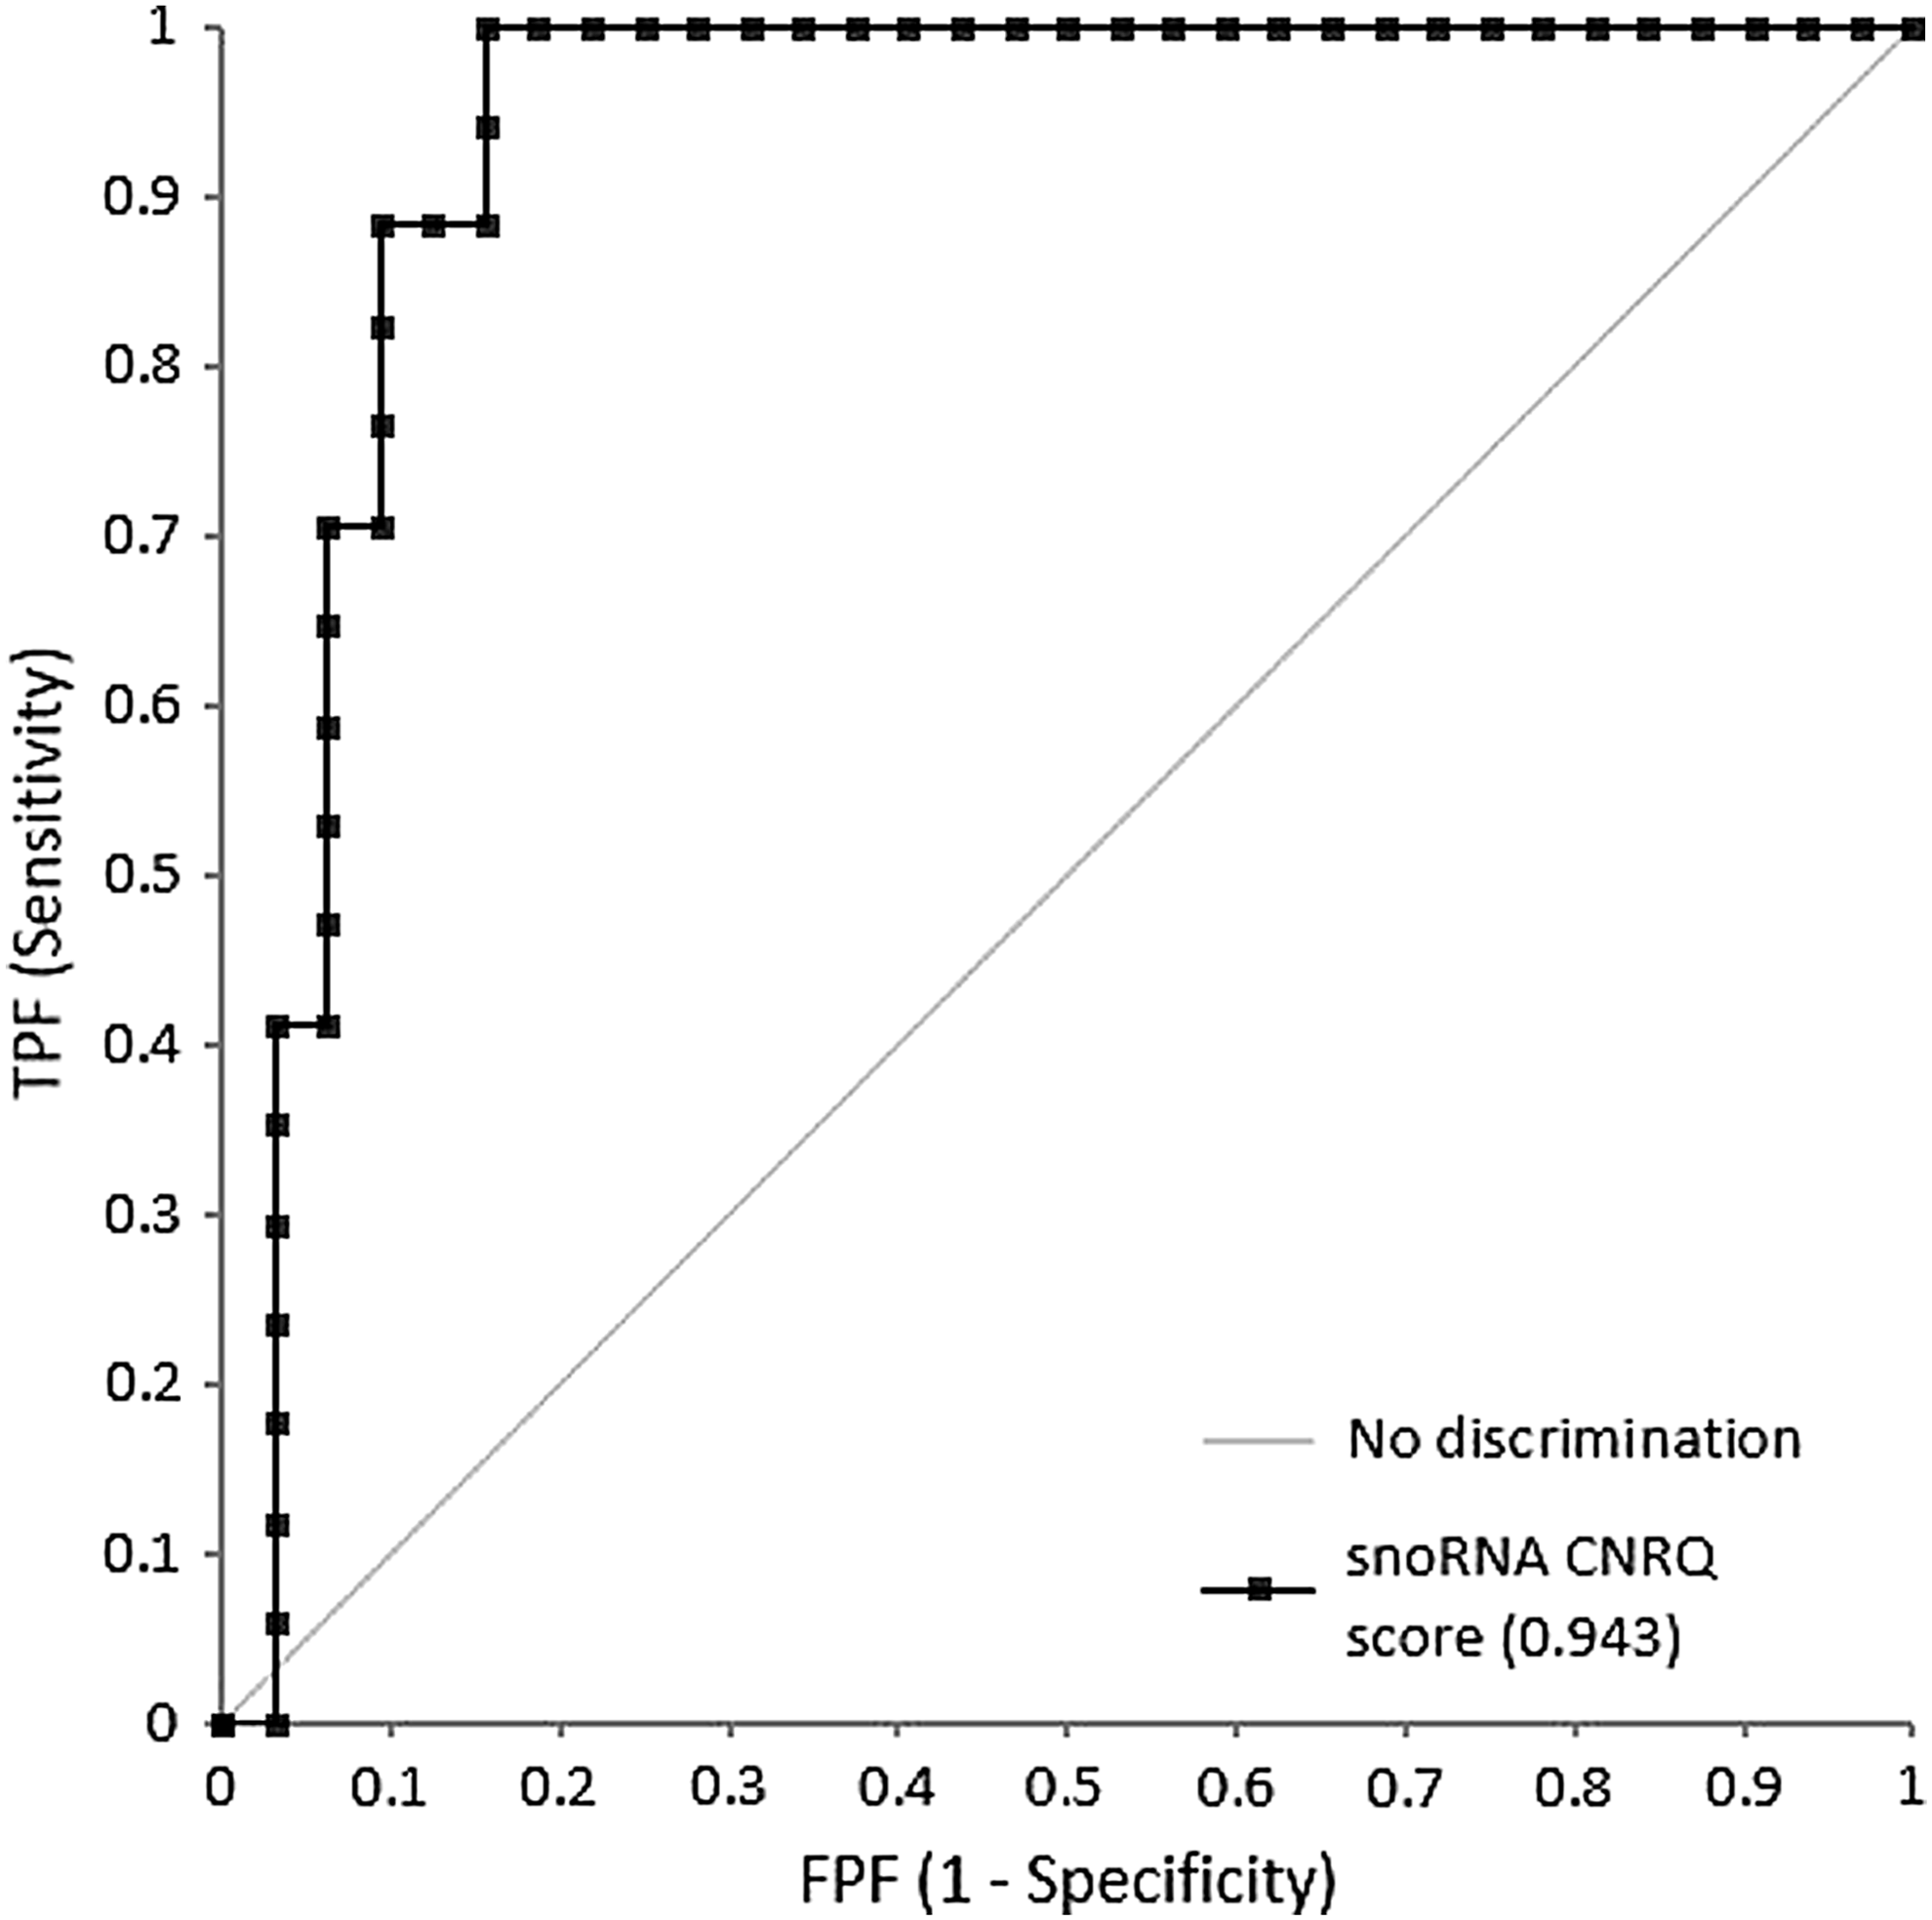
ROC curve for the colon/sigmoid, kidney, ovary, uterus, rectum, breast, and ileum tissue samples (validation set, n = 57), based on the “snoRNA CNRQ score” analysis (snoRNA CNRQ score = logCNRQ SCARNA5 + logCNRQ SNORA16A + logCNRQ SNORA44 + logCNRQ SNORA61) on the WaferGen standard SmartChip.
Customized WaferGen miRNA chip assay
The median CNRQ values of tissue samples with fixation times corresponding to SPREC codes E, G, and Z, for 24 targets, which were selected for the customized WaferGen chip, are shown in Supplementary Figure S2. There were two groups of targets (apart from the two yeast controls): one group, including the HSA-LET-7A, HSA-LET-7D, HSA-LET-7E, HSA-MIR-103, HSA-MIR-107, HSA-MIR-1251, HSA-MIR-1260, HSA-MIR-154, HSA-MIR-17, HSA-MIR-27A, HSA-MIR-320C, HSA-MIR-326, HSA-MIR-339-5P, HSA-MIR-4279, and HSA-MIR-720, with overall stable CNRQ values, and one group, including the RNU12, RNU2-1, SCARNA5, SNORA16A, SNORA44, SNORA61, and SNORD99, with high CNRQ values at standard fixation conditions and low CNRQ values at overfixation conditions.
Eight sets of 3 samples (24 samples total) from the IBBL collection were tested on the customized WaferGen chip. One set of samples was excluded from further analysis for not having a sample fixed for more than 72 hours. A coefficient of determination R2 of 0.74 was observed between the Ct values on the standard miRNA SmartChip and on the customized chip (Supplementary Fig. S2B). On the customized chip, a simple “snoRNA score” was calculated by subtracting the sum of the Ct values of HSA_MIR_720, HSA-MIR-1260, and HSA-LET-7A from the sum of the Ct values of SNORD99, SNORA61, SNORA44, SNORA16A, and SCARNA5; whereas the “snoRNA CNRQ score” requires the whole miRNA SmartChip, and therefore, only one sample can be tested per run, the simplified “snoRNA score” requires only 24 targets and 40 samples can be tested per run. The repeatability of the “snoRNA score,” validated on 37 technical replicates had a CV of 3.4% (data not shown). ROC curve analysis gave us an AUC of 1.000 for both distinctions between fixation time corresponding to SPREC codes G versus Z and between fixation time SPREC codes E versus Z (data not shown).
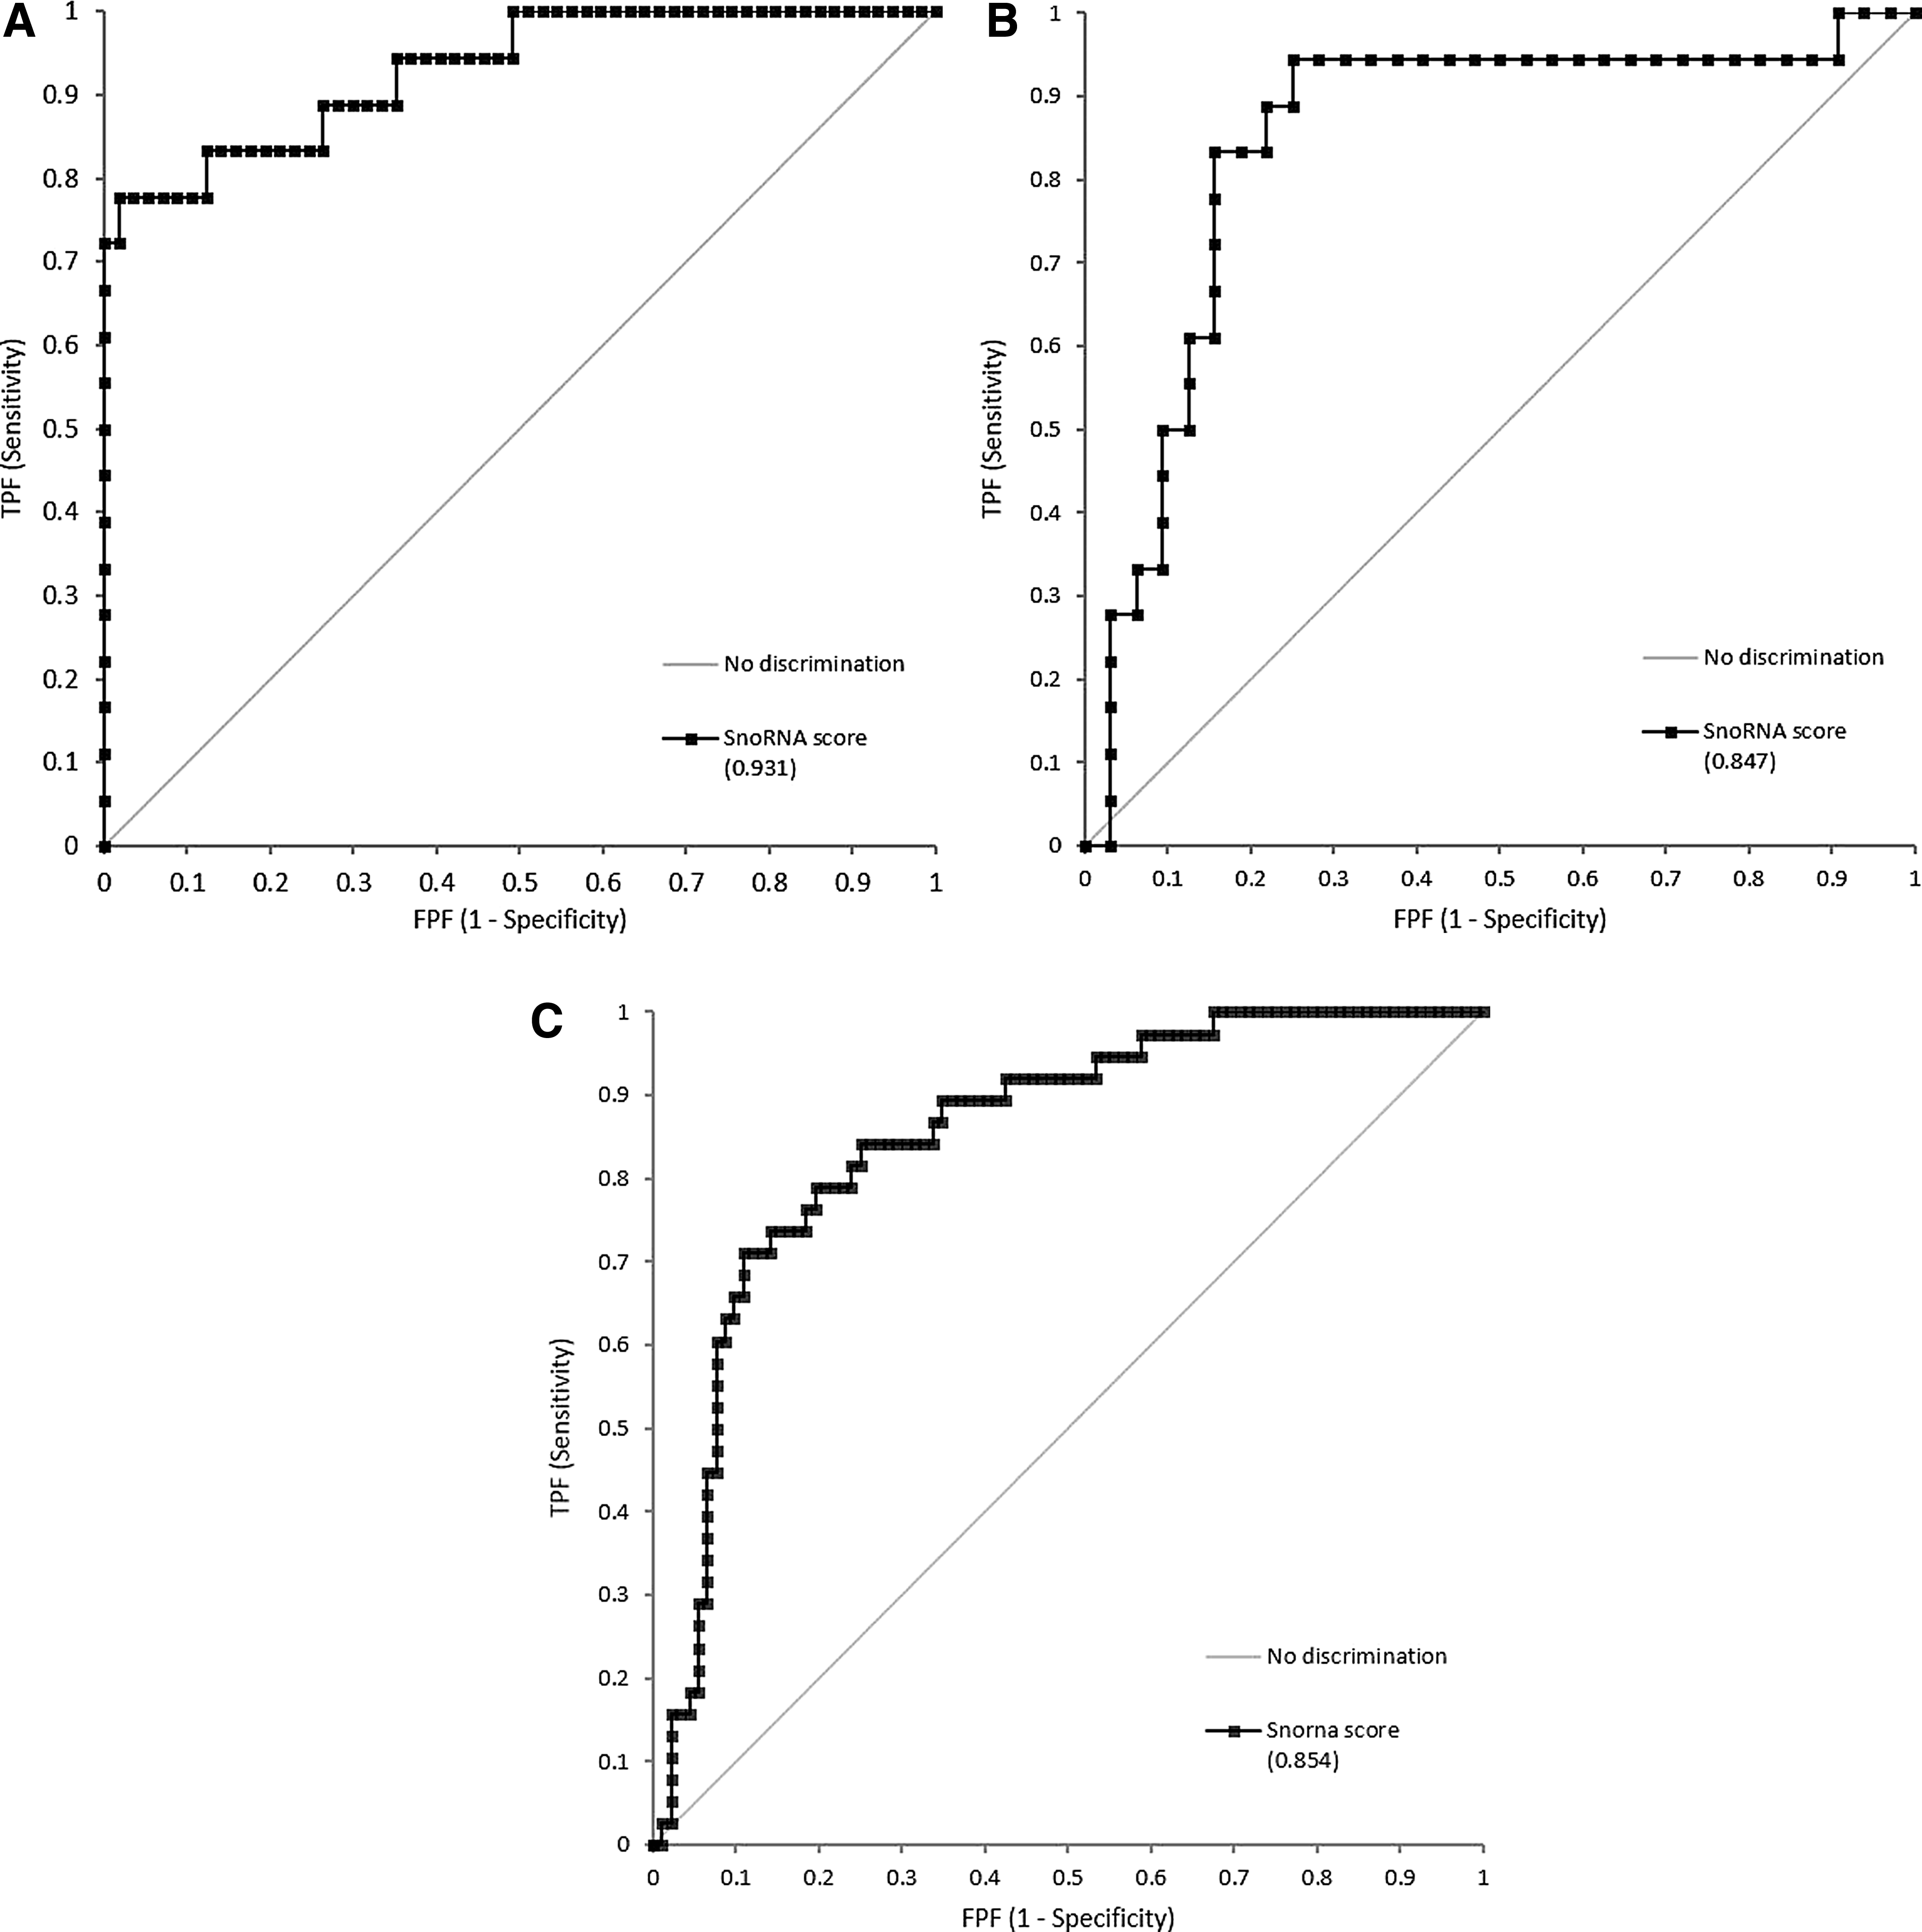
This snoRNA score (CtSNORD99 + CtSNORA61 + CtSNORA44 + CtSNORA16A + CtSCARNA5 − CtHSA_MIR_720 − CtHSA-MIR-1260 − CtHSA-LET-7A) was then applied to the raw data obtained by our initial FFPE training set of two tissue types (50 kidney samples, 45 ovary samples) and the whole validation set of seven different tissue types. For the training set, the new ROC curve analysis, based on the snoRNA score, gave AUC 0.989 for the distinction between 6, 12, and 23 hours versus 72 hours fixation time of kidney samples and AUC 0.728 for ovary samples. When all the kidney and ovary samples were analyzed together, the ROC curve analysis, based on the snoRNA score, gave AUC 0.931 with an optimal cutoff value 67. This corresponds to a sensitivity of 83.3% and specificity of 82.5% for the detection of overfixed samples.
In the validation set of 53 samples, the distinction between SPREC code E and G versus Z, showed AUC 0.847, with the optimal cutoff value 85, corresponding to a sensitivity of 83.3% and specificity of 84.4% for the detection of overfixed samples (Fig. 6).
ROC curve on the samples of the training set, n = 95
Finally, we defined the optimal cutoff for the snoRNA score, by analyzing the samples of both the training and the validation sets together. The diagnostic cutoff was 79, with AUC 0.854 corresponding to a sensitivity of 78.9% and specificity of 80.4% for the detection of overfixed samples (Fig. 6).
Discussion
The Qiagen miRNeasy FFPE Kit used in this study has been shown to be the most effective extraction kit for FFPE miRNAs. 20 The choice of the WaferGen platform for detecting differences between miRNAs was based on published data demonstrating very high sensitivity and reproducibility. 21 The data analysis pipeline that we used combines the power of both the WaferGen and the qBase analysis programs. While it has recently been shown that versions of miRBase published after miRBase16 contain many false miRNAs, which are RNA degradation products, 22 this issue has no effect on our study since the WaferGen miRNA chip composition is based on miRBase16.
This study is the first to have evaluated the stability of 1036 miRNA targets to fixation conditions by RT-qPCR. The results show a global and uniform robustness of the miRnome to NBF fixation times up to 72 hours. This can be explained by the uniform molecular structure of the miRNAs and confirms the reliability of FFPE miRNA profiling. 23
Unsurprisingly, paraffin embedding and formalin fixation induced lower miRNA expression levels, compared to frozen samples, confirming previously published comparisons. 24 Tissue heterogeneity between frozen and FFPE tissue counterparts may always be the origin of some degree of variability.
The impact of the duration of formalin fixation on global miRNA expression in colorectal and pancreatic tissue has been studied, and 3- or 6-day fixation induced a global reduction in miRNA expression by −1.06 and −0.64 Cq relative to 2-day fixation conditions, respectively. 24 Fixation times of 1–5 days did not have a significant impact on the expression levels of miRNA-16 and RNU6B in colorectal FFPE samples. 25 Our results are in line with previously published results showing a minimal impact of formalin fixation time on miRNAs overall.
Having identified and validated the signature of fixation time-sensitive snRNAs on the WaferGen platform, we tried to transfer the assay to a standard TaqMan platform. We used custom designed TaqMan Small RNA assays for targeted SNORAs (Ref. 4398987; Applied Biosystems). The results of this TaqMan assay confirmed the trend of the snoRNA targets Ct increasing with fixation time, however, the sensitivity of this platform was lower than the sensitivity of the WaferGen platform (materials/methods/results not shown), probably due to different chemistries between the two platforms.
The explanation of the relatively higher impact of fixation time on snRNAS than on miRNAs is probably structural. Mature miRNAs are ∼22 nucleotides (nt) long, while snRNAs are slightly longer (80–200 nt). Different structure, different association with proteins and/or different GC contents may explain the differential stability of snRNAs. Indeed, it has recently been shown that miRNAs with GC content lower than 40% are more degraded than GC-rich miRNAs in FFPE cardiac tissue samples. 18 Interestingly, the percent GC content of SNORA-16A, SCARNA-5, SNORA-44, and SNORA-61 is in the range of 45%–51%, which is lower than the average percent GC content of most miRNAs. It has recently been suggested that at least one snRNA (RNU6B) in prostate FFPE samples degrades more rapidly than other miRNAs. 26 The snoRNA and the small Cajal body-specific RNAs (scaRNAs) are 48-250nt long, have either a CDBox or a HAcaBox secondary structure, and are often associated with the abundant nucleolar protein fibrillarin. 27 Extended fixation times may induce extensive cross-links among the snoRNAs, scaRNAs, and their associated proteins, rendering their extraction more inefficient than extraction of miRNAs.
A limitation of the snoRNA score assay is that, for optimal sensitivity and specificity, the assay should be performed on the WaferGen platform. The customized chip contains 24 targets, of which 8 are used in the calculation of the snoRNA score. The other 16 targets are used in the establishment of the analytical run acceptance criteria: average yeast internal control Ct between 17 and 21 and average panel Ct between 17 and 23. An advantage of the snoRNA score assay is the relatively low amount of RNA required (25 ng of total RNA).
Results on the stability of miRNAs in FFPE blocks, stored at room temperature for long periods of time, are conflicting. Some studies suggest that the FFPE block age, when FFPE blocks are stored at room temperature, is a major factor of decrease of all transcript levels, including miRNAs. This has been suggested in studies with myometrium tissue samples 28 and more recently in a study with prostate tissue samples. 26 However, in these RT-qPCR studies, different groups of samples from the different time periods were used, and therefore one cannot exclude the possibility of another confounding factor, which may have contributed to the lower levels of miRNA targets found in the older samples. Bovell et al. have not found any significant effect of block age on six miRNA targets in colorectal tissue blocks stored for 28 years. 29 On the contrary, Boisen et al. found a significant effect of −0.05 Cq/year of sample age on global miRNA expression in pancreatic tissue of up to 30 years old, but not in colorectal tissue of up to 12 years old. 24 Taking this kinetic assumption, the snoRNA score can safely be used in FFPE samples, fixed with NBF, and stored either at room temperature for 10 years or at −20°C for much longer periods.
In our study, the cold ischemia time was constant in the training set of samples and variable in the validation set. The processing time (time in tissue processor) was 10–12.5 hours for all samples. It has been shown that tissue degradation due to ischemia time or freeze thawing has minimal or no impact on miRNAs,30,31 and therefore, the snoRNA score assay can be applied irrespective of these preanalytical variables. More specifically, Borgan et al. have shown that there are only 54 miRNas whose expression levels are influenced by tissue ischemia time and snRNAs are not part of them 30 ; the snoRNA score therefore is not influenced by ischemia, but only by fixation time.
In conclusion, there is no significant impact of formalin fixation time on miRNA expression levels overall. Furthermore, the snoRNA score assay, validated on seven different tissue types, can identify FFPE tissue samples (of at least the seven tissue types tested) with 72 hours or longer fixation times. This assay fills an important gap in the toolbox of biospecimen qualification assays and enables quality stratification of legacy FFPE tissue collections of unknown preanalytics. It allows the user to categorize the FFPE samples in at least two quality classes, based on fixation time. The user can take this information into consideration when analyzing the results from his research. Hence, the snoRNA score assay will ensure fitness-for-purpose of FFPE samples for DNA- or mRNA-based applications and increase research reproducibility.
Footnotes
Acknowledgments
We are thankful to Monica Marchese and Lieke Mevis for excellent assistance with ROC plots and article formatting. This research did not receive any specific grant from funding agencies in the public, commercial, or not-for-profit sectors.
Author Disclosure Statement
None of the authors has a conflict of interest that could compromise the integrity of this project.
References
Supplementary Material
Please find the following supplemental material available below.
For Open Access articles published under a Creative Commons License, all supplemental material carries the same license as the article it is associated with.
For non-Open Access articles published, all supplemental material carries a non-exclusive license, and permission requests for re-use of supplemental material or any part of supplemental material shall be sent directly to the copyright owner as specified in the copyright notice associated with the article.