
Abstract
Network representation learning methods map network nodes to vectors in an embedding space that can preserve specific properties and enable traditional downstream prediction tasks. The quality of the representations learned is then generally showcased through results on these downstream tasks. Commonly used benchmark tasks such as link prediction or network reconstruction, however, present complex evaluation pipelines and an abundance of design choices. This, together with a lack of standardized evaluation setups, can obscure the real progress in the field. In this article, we aim at investigating the impact on the performance of a variety of such design choices and perform an extensive and consistent evaluation that can shed light on the state-of-the-art on network representation learning. Our evaluation reveals that only limited progress has been made in recent years, with embedding-based approaches struggling to outperform basic heuristics in many scenarios.
Introduction
Networks are data representations that arise naturally in many fields from social sciences to medicine, biology, or computer science.1,2–4 They model entities as graph nodes and their relations as edges. These particular structures, though highly expressive, do not directly support traditional machine-learning tasks such as classification, regression, or clustering. In this context, network representation learning or network embedding (NE) methods learn mappings from network nodes to low dimensional vectors of an embedding space.5–9 The obtained vector representations generally preserve certain network properties and constitute convenient transformations that support downstream prediction and inference tasks.
To assess the quality of the learned representations, downstream tasks such as data visualization,10,11 node multi-label classification,12,13 link prediction,14,15 and network reconstruction8,16 are evaluated. Among these tasks, data visualization is an effective evaluation tool that is limited to small-sized networks. Multi-label classification is a relatively straightforward task that can be performed on larger networks and, thus, has been extensively studied in recent literature.17–19
Link prediction and network reconstruction, on the other hand, have received far less attention. The main reason for this is their need for more complex evaluation pipelines, with several preprocessing steps and design choices that can confound the results and are prone to errors. A recent empirical study 20 does, however, consider the link prediction task. In this study, the authors unify various representative NE models under the same framework and aim at explaining their differences by using a small set of experimental setups.
In this article, we focus on link prediction,* where we aim at estimating the likelihood of the existence of edges between given node-pairs not connected in the input graph, and on network reconstruction, which amounts to predicting the edges of a given network from its node embeddings. We also cover a broad range of experimental setups and implementations of unsupervised NE methods in a transductive scenario. The two evaluated tasks are strongly related and present similar challenges, as discussed next:
Data preprocessing: To evaluate the generalization performance of NE methods, specifically for link prediction, sets of train and test/validation edges (i.e., connected node-pairs) are required. These sets can be obtained by using different approaches that might impact the evaluation results. For instance, a typical assumption is that the train edges span a (train) sub-network of a more complete (test) network. Thus, a principled approach is to use snapshots of the network at two different points in time. The first snapshot is used for training, and the difference between the two snapshots is used for testing/validation.2–4
Unfortunately, networks with such a temporal component are scarce, and therefore authors ordinarily resort to sampling edges from a network as test/validation examples and using the remaining edges for training.9,15,21,22 The sampling process varies between scientific works in different aspects. The sizes of the train and test/validation sets vary from 50-50,15,21 to 60-409 or 80-20.
22
The algorithms used to generate these splits also differ and while some aim at constructing training networks with similar, scaled-down, properties such as, for example, node degrees,
23
others generate training graphs that preserve the general topology of the original network.
24
Prediction pipeline: Different NE methods require different pipelines to obtain link predictions. Although some embedding methods directly compute link probabilities,15,16 for others, these need to be learned on top of the node embeddings. Two common approaches are: (i) interpreting some notion of similarity between two node embeddings (e.g., dot product) as the link probability and (ii) casting the problem as a binary classification task. The latter requires as a pre-step the computation of node-pair embeddings. Thus, an operator must be applied on the node embeddings to obtain node-pair representations that are, in turn, fed into a binary classifier to perform link prediction or network reconstruction. The choice of operator not only varies between scientific works13,21 but is also, in some cases, completely overlooked in the experimental setup discussion.10,22 Moreover, many valid choices exist for the binary classifier, and classifier training requires—in addition to “positive” examples or edges—“negative” samples or non-edges. These non-edges can also be selected by using different strategies and be of varying sizes.
25
Hyperparameter tuning: When comparing new methods with the state-of-the-art, for the baseline methods the default parameter settings are often used,13,16 yet care is taken in tuning the parameters of the introduced method. When the recommended default settings were informed by experiments on other graphs than those used in the study at hand, this can paint an unduly unfavorable picture of the baseline methods. Evaluation metrics: Finally, no consensus exists on which evaluation criteria should be used for comparing different methods. Although some papers advocate for the use of precision@Np for a range of Np values,8,10,16 others use area under the ROC curve (AUC)15,21 or precision and recall at fixed thresholds.
26
These challenges have led to an inconsistency in evaluation procedures throughout papers. Hence, the practical performance of NE methods is poorly understood. Moreover, as several recent studies have found,27,28 the inconsistency of evaluation procedures is a central issue that has stalled progress in many sub-fields within Artificial Intelligence. As such, in this article, we aim at clarifying the impact of these design choices on the evaluation pipelines and ultimately on method performance. At the same time, we aim at shedding light on the real state-of-the-art by means of a standard evaluation process.
Contributions
We provide an in depth empirical analysis of the state-of-the-art on network representation learning. We focus on link prediction and network reconstruction and evaluate a total of 29 implementations of 23 different NE methods on 7 popular real-world networks. We study the impact on method performance of different evaluation pipelines and specific components such as hyperparameter tuning, embedding dimensionality, train set size, edge sampling strategy, node-pair embedding operator, and binary classifier.
Finally, there are inevitable limitations to the scope of our evaluation, such as an exclusive focus on undirected and unweighted networks without attributes, moderate-sized networks, and a representative but finite set of evaluated methods. To alleviate these limitations, we based our evaluation on Eva1NE, 24 a framework that ensures the reproducibility of results and allows for direct extensions of our work in all the aforementioned aspects.
This article is an extension of Ref. 29 The main difference is the extended experimental evaluation: We have included one additional downstream task (network reconstruction; Network Reconstruction section, Network Reconstruction Performance section; Table 4 and Fig. 10), one new heuristic baseline, and six new NE methods (changes throughout); included a comparison of different evaluation pipelines (Prediction Pipeline section; Fig. 8); and deepened the analysis of the link prediction performance and the use of embedding dimensions by different approaches (Prediction Pipeline section and Method Performance and Network Structure section; Fig. 9).
The remainder of this article is organized as follows. In the Methods section, we present the methods evaluated. The Datasets section introduces the real-world datasets used. A detailed description of the evaluation setup is given in the Experimental Setup section. In the Experimental Results section, we summarize our findings and finally, the Conclusions section concludes this article.
Methods
In this section, we present the NE methods (NE Methods section) and baseline heuristics (Baseline Heuristics section) evaluated, and we discuss the specific implementations used and method hyperparameters tuned (Implementations and Hyperparameters section).
Before continuing with method descriptions, we first lay down some notation. We represent an undirected network or graph as
NE methods
Embedding methods can be broadly categorized into four classes according to the strategy used for learning node similarities. In this taxonomy, we can distinguish methods based on the Skip-Gram model, 30 matrix factorization, neural architectures, and probabilistic approaches. Next, we describe the methods from each family included in our evaluation.
Methods based on Skip-Gram
These methods leverage the Skip-Gram model to compute node representations such that the posterior probability of observing a neighboring node in a random walk is maximized.
DeepWalk 12 is the first method to use language modeling inspired techniques for NE. It uses random walks with fixed transition probabilities to measure node similarities, and embeddings are derived by using Skip-Gram approximated via hierarchical softmax.
Node2vec 21 is a generalization of DeepWalk that uses truncated random walks for node neighborhood exploration and the Skip-Gram model, approximated via negative sampling, for embedding generation. The random walk properties are controlled by a return parameter p and an in-out parameter q.
Struc2vec
31
extracts structural information from graphs through node-pair similarities for a range of neighborhood sizes. This information is then summarized as a multi-layer weighted graph
Metapath2vec 11 is designed to learn embeddings from heterogeneous networks. The authors extend the concept of random walks to account for nodes of different types and use a heterogeneous Skip-Gram model to learn the embeddings.
LINE
6
uses joint and conditional probability distributions to model the first- and second-order adjacencies between linked nodes in
VERSE
13
learns embeddings by training a single-layer neural network that minimizes the Kullback-Leibler (KL) divergence between node similarities in
Watch Your Step (WYS)
32
is an attention model learned on the power series of the transition matrix of
Methods based on matrix factorization
These approaches use representations of node similarities such as high-order proximities expressed as polynomials of
Graph factorization (GF)
33
uses regularized Gaussian matrix factorization to recover a matrix
GraRep
7
is based on factorization of different polynomials of the adjacency matrix
HOPE 8 preserves high-order proximities in graphs and accounts for the asymmetric transitivity property of directed networks.
Laplacian Eigenmaps (LE)
5
constructs a weighted representation
Locally linear embeddings (LLE) 34 operates under the assumption that nodes and their neighbors lie on locally linear patches of a high-dimensional manifold. The embedding of a node can, thus, be derived from the linear coefficients that better reconstruct the node from the embeddings of its neighbors.
FREDE 35 uses Personalized PageRank as a node similarity matrix and adapts the Frequent Directions sketching algorithm 36 to produce embeddings.
NetMF 37 factorizes the DeepWalk transition probability matrix via singular value decomposition to reach the global optimum. To address the method's limited scalability, the authors have proposed an approximation method in Ref.. 38
M-NMF 39 incorporates community structure information in the embedding learning process via modularized non-negative matrix factorization.
AROPE,
16
similarly to GraRep, proposes embeddings as found by the truncated singular value decomposition of polynomials of
Methods based on neural networks
Neural approaches return as embedding the latent representations learned by deep layers of the networks. In this category, we include models with a wide range or architectures, from shallow to deep models and from classical convolutional networks to graph convolutional approaches.
Structural deep network embedding (SDNE) 10 uses a deep neural network for learning embeddings that capture first- and second-order graph proximities.
PRUNE 22 relies on a deep Siamese neural network for learning node embeddings and can incorporate node ranking as additional information.
GAE/VGAE 14 is based on the variational auto-encoder model and computes embeddings from latent variables. The inference model is parametrized by a two-layer graph convolutional network, and the generative model computes inner products of latent representations. VGAE is a non-probabilistic variant of GAE.
Graph isomorphism network (GIN) 40 is a neural model based on the Weisfeiler-Lehman test 41 that achieves maximum discriminative power among graph neural networks.
GatedGCN 42 belongs to the subclass of message passing graph convolutional approaches, where node representations are learned by performing local updates only. The model incorporates edge gating mechanisms into vanilla graph convolutional networks.
Probabilistic approaches
These methods use probabilistic approaches to model node similarities and learn embeddings.
CNE 15 uses a Bayesian approach to generate embeddings that model the observed network while taking prior information into account. The prior can incorporate structural graph properties such as node degrees or block densities for clustered or multi-partite networks.
Baseline heuristics
In addition to the NE approaches, we evaluate a set of heuristics as baseline. Among these, we include heuristics that derive similarity scores—which can be interpreted as link probabilities—from the neighborhoods
We also include a method based on paths, that is, Katz similarity. This method is defined as
Lastly, we generate a “heuristics embedding” by concatenating CN, JC, AA, RA, and PA as a five-dimensional node-pair embedding. Logistic regression (LR) is then used to obtain link predictions. We will refer to this method as NE_heuristics.
Implementations and hyperparameters
Regarding the code used in our evaluation, we primarily rely on reference implementations by the original authors of different manuscripts. In addition to these, we also use code from other sources such as the extensively used OpenNE 43 and Graph Embedding Methods (GEM) 19 libraries. Table 1 summarizes the implementations used and hyperparameters tuned.
Implementation used and hyperparameters tuned for each method
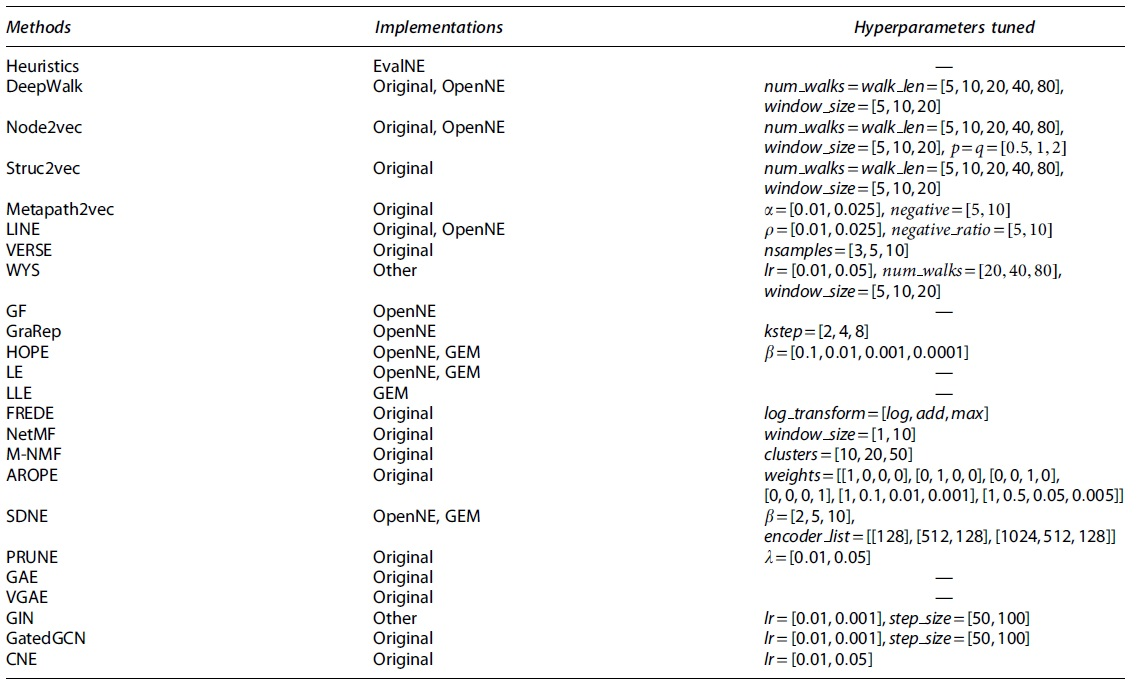
Except for AROPE, CNE, GAE, VGAE, GIN, GatedGCN, and the heuristics, the edge embedding operator is also tuned as a hyperparameter.
In the table, all heuristics are summarized in a single Heuristics field and have no tunable hyperparameters (for Katz we fix
Lastly, some notable differences between method implementations and important method specifics are as follows: For LINE, the original implementation uses second-order proximity by default (LINE-2) whereas the OpenNE implementation uses a concatenation of first and second orders (LINE-1 + 2). For HOPE, the OpenNE implementation uses Common Neighbors as a similarity matrix, which is then factorized, whereas the GEM implementation uses Katz similarity.
For VERSE, the reference implementation provides an unsupervised version of the method with Personalized PageRank as a similarity metric. In NetMF, context window sizes of 1 and 10 correspond to evaluating NetMF-small and NetMF-large, respectively. Finally, for GIN and GatedGCN, end-to-end link prediction is performed by adding a new layer to each network trained to minimize the cross-entropy between the logits of this layer and the ground truth labels (existence or not of an edge).
Datasets
We conduct our experimental evaluation on seven undirected real-world networks from different domains. These networks are medium-sized to ensure successful execution of all methods and constrain the computational resources needed. Next, we present a short description of each network and in Table 2, we summarize their main statistics.
Summary of dataset statistics where
StudentDB 44 represents a snapshot of Antwerp University's relational student database. Nodes in the network represent entities such as students, professors, tracks, etc. and edges constitute binary relations, that is, student-in-track, student-in-program, student-take-course, professor-teach-course, and course-in-room.
Facebook 45 and BlogCatalog 46 are online social networks, where nodes represent different users and edges indicate friendships.
GR-QC 45 and AstroPh 45 describe collaboration networks in the fields of General Relativity and Astrophysics. Nodes represent papers, and edges denote citations between them.
PPI 47 is a biological protein–protein interaction network and constitutes a subset of the Homo Sapiens PPI network.
Finally, Wikipedia 48 contains nodes representing words in Wikipedia pages and links denoting co-occurrences.
Experimental Setup
In this section, we give details on the link prediction and network reconstruction tasks, present the experimental setups used, and discuss the limitations to the scope of the evaluation and reproducibility of results.
Link prediction
As pointed out in the Introduction section, the objective in link prediction is to identify missing links in an incomplete graph
For obtaining
These construct a spanning tree of
In addition to splitting connected pairs, we also generate sets of train and test non-edges,
For hyperparameter tuning, the train sets need to be further split into train and validation. We fix their proportions to 90% train and 10% validation in all our experiments, and the validation split is always performed by using the same algorithm as the initial train-test split. Grid search is adopted as the strategy for learning the best model hyperparameters.
For most methods, with the exception of CNE, AROPE, GAE, VGAE, GIN, GatedGCN, and the heuristics, for which node-pair similarities are directly computed, the link predictions are learned through binary classification. First, node-pair embeddings for
Network reconstruction
Network reconstruction evaluates how accurately an embedding method captures the link structure of a network. In other words, it evaluates how well the adjacency matrix
First, for each method and network we perform hyperparameter tuning via a grid search. The best set of parameters is then used to compute node embeddings, and node-pair embeddings are derived by using the same operators
We note that for this task there are two fundamental differences with respect to the link prediction pipeline. First, since the objective is to determine how well a method captures the structure of a graph, training of the NE methods, training of the binary edge classifier, hyperparameter tuning, and model assessment are all performed on the complete input graph
Second, this task requires us to provide a prediction for all
Evaluation setup
For link prediction, we use two experimental setups, called LP1 and LP2, with model hyperparameter tuning as the only difference. In LP1, we tune all hyperparameters presented in Table 1 as well as the node-pair operator; in LP2, we use default recommended parameters for all methods while still tuning the node-pair embedding strategy. We quantify method performance in terms of AUC and also report execution times. For visualization purposes, we use
Unless otherwise specified, we use embedding dimensionality
Setup LP1 is used to study the performance of NE methods with respect to parameters
For network reconstruction we use a single experimental setup, where method hyperparameters and node-pair embedding operators are tuned. We present method results for the best embedding dimension
Reproducibility notes
To ensure the reproducibility of our results and foster further research in this area, we have based our experimental evaluation on the EvalNE framework. This open-source Python toolbox aims at simplifying the evaluation of NE methods for link prediction, network reconstruction, node classification, and visualization. The toolbox automates tasks such as hyperparameter tuning, selection of train and test edges, or non-edge sampling.
EvalNE also implements widely used node-pair embedding operators and can incorporate any classifier for prediction. Moreover, its design ensures that common errors, such as the computation of features on
Experimental Results
In this section, we present the results of our empirical study. First, we focus on link prediction and discuss performance in the Link Prediction Performance section, the effect of hyperparameter tuning in the Hyperparameter Tuning section, embedding dimensionality in the Embedding Dimensionality section, train-test splits in the Train-Test Split Size section, edge sampling in the Edge Sampling section, and finally prediction pipelines in the Prediction Pipeline section.
Then, in the Network Reconstruction Performance section, we present the results for the network reconstruction task and in the Method Performance and Network Structure section, the relationship between method performance and network structure. All experiments were conducted on a machine equipped with two 12 Core Intel(R) Xeon(R) Gold processors and 256 GB of RAM.
Link prediction performance
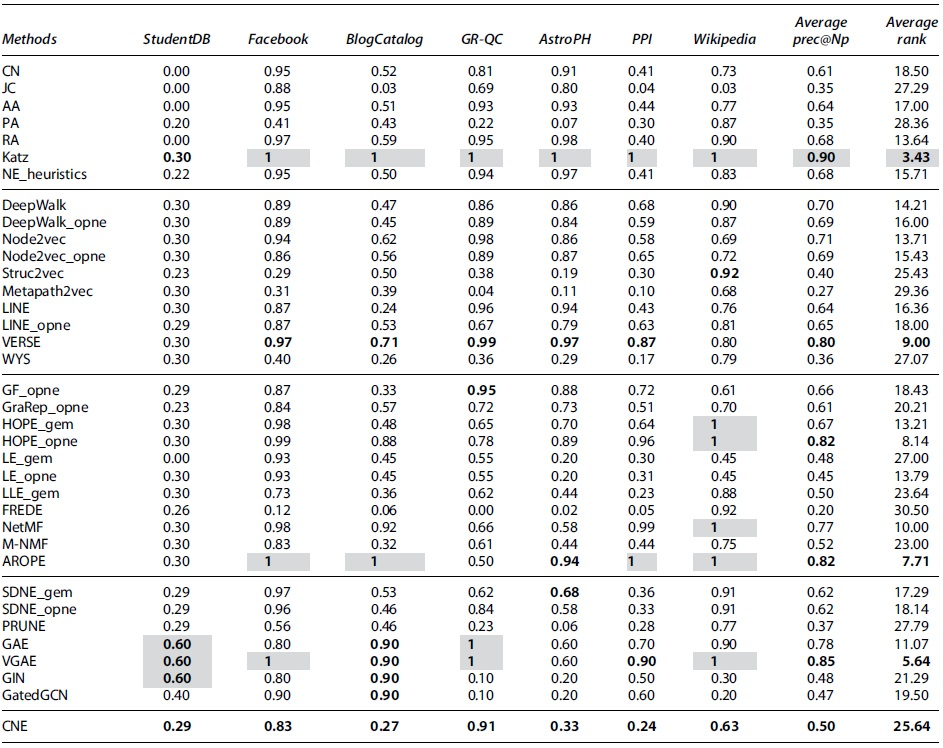
We start in Table 3 by presenting the best AUC scores for each method on the link prediction task. These results were obtained by using setup LP1, where for each method we selected the embedding dimension
Area under the ROC curve scores and standard deviations over three experiment repetitions for setup LP1 where hyperparameters are tuned and
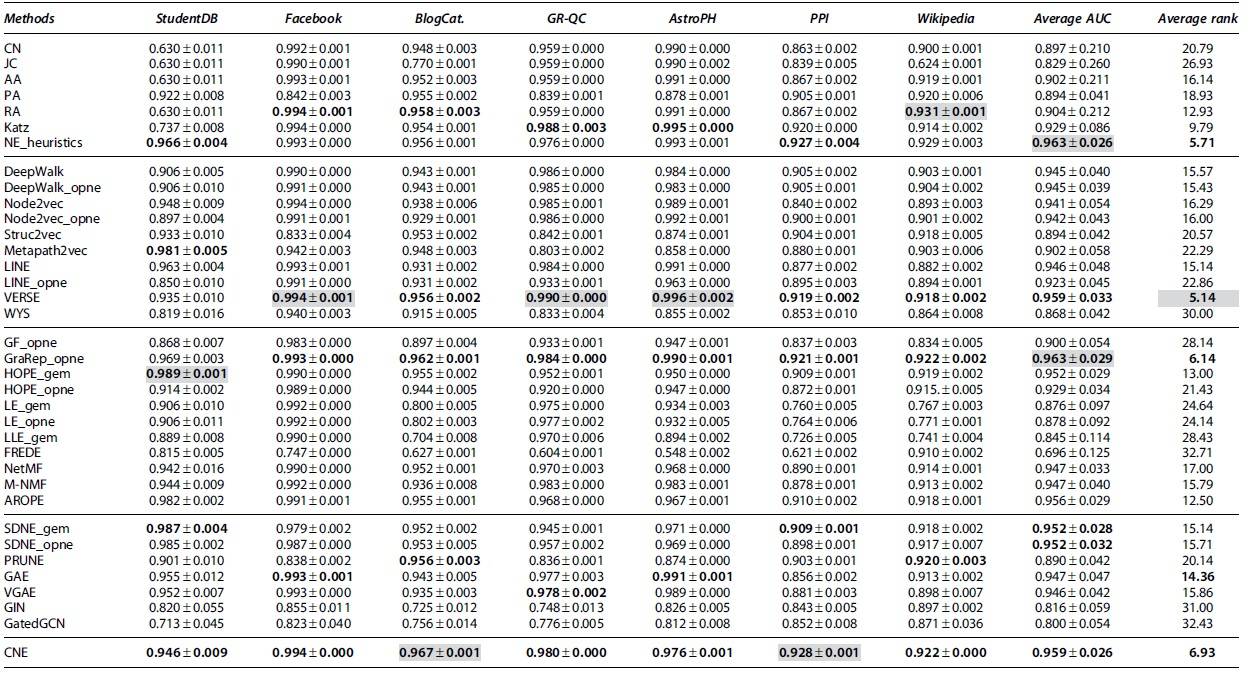
Note that 0.000 in the table means <0.0005. The best method within each type of approach is highlighted in bold, and the overall best for each column is depicted in a gray background.
In the table, we group methods according to the taxonomy in the Methods section with the best performing method per group highlighted in bold and the overall best for each network on a gray background. The last two columns show averages over the seven evaluated networks of: (i) the AUC performance and (ii) the ranking of each method among all other approaches.
The results in Table 3 show the excellent performance, on most datasets, of the baseline heuristics and in particular of RA, Katz, and the NE_heuristics. The latter, together with GraRep, achieves the highest average AUC among all methods of 0.963. In addition, although NE_heuristics is not a top performer on any particular network, its AUC scores are consistently high across all networks and never more than 2% lower than the best scores in each case. This effect is also reflected by the method's excellent average AUC rank (second overall).
Among Skip-Gram based approaches, VERSE is a clear top performer. GraRep is the matrix factorization-based method with the highest scores and it presents a consistent performance across networks. Nonetheless, AROPE and HOPE also exhibit good performance. The neural architecture-based approaches present similar performances, with SDNE and GAE obtaining marginally higher scores.
Overall, according to their average AUCs and AUC ranks, the best performing methods are: VERSE, NE_heuristics, GraRep, and CNE. It is worth noting that for these top performers we tuned at most one hyperparameter (see Table 2) and, thus, their excellent performance cannot be ascribed to an exhaustive model selection process. Also noteworthy is the fact that CNE achieves state-of-the-art results, with an 8-dimensional embedding as compared with the 128 dimensions required by other methods.
In the absence of additional data, such as node or edge attributes, our experiments suggest that performance generally improves as the order of proximity between nodes captured by a model increases (i.e., as a node's neighborhood includes vertices that are further and further away). GraRep, the best performing NE method, captures relations up to order 8. HOPE and AROPE, also top performers, capture relations up to order 4 whereas the remaining first- and second-order methods exhibit lower performance.
Two interesting exceptions to this pattern are VERSE and CNE. In the case of VERSE, the second-order method employs a nonlinear transformation that is able to preserve more information from the original network. CNE, on the other hand, finds an embedding based on first-order information. Its excellent performance can be explained by the fact that it additionally models structural information (node degrees) in a prior, leaving more flexibility to the embedding.
Another important observation from the results in Table 3 is that method performance varies significantly between different implementations of the same NE methods (up to 11.7% for LINE on StundentDB). These differences are especially large for the implementations of LINE (3.3% difference, on average, over all networks), HOPE (2.4%) and Node2vec (2%). The main factors causing these differences are numerical instability, approximation of computations, and dependencies on different software versions with varying default parameters.
In our Supplementary Material, we also show fluctuations in method performance of up to 44.5% for GEM implementations due to package dependencies and up to 5% for metapath2vec due to multi-core execution.
Also interesting is the difference in performance between Node2vec and DeepWalk. In this case, one would expect the former (which is a generalization of the latter) to perform consistently better. This would, indeed, be the case if both methods would approximate Skip-Gram via negative sampling. 21 In our experiments, however, the Skip-Gram is approximated via hierarchical softmax for DeepWalk (as proposed by the original authors) and via negative sampling for Node2vec (also as proposed by the authors), which explains the observed differences.
Further experiments comparing the two Skip-Gram approximations for both methods reveal significant fluctuations in AUC of up to 0.02, with a standard deviation of 0.02. Moreover, we find that no approximation provides consistently better results than the other across all datasets. Ultimately, this experiment reveals the importance of accounting for the approximation used when comparing methods based on Skip-Gram.
Hyperparameter tuning
Figure 1 presents a heatmap of the increment in link prediction accuracy obtained through hyperparameter tuning, that is, the difference in AUC between setups LP1 and LP2. Only methods with tuned hyperparameters are shown in this figure. The results reveal limited improvements in most cases. For ∼7% of the network-method combinations, however, we observe increments in AUC greater than 5%. WYS, SDNE and CNE benefit the most from hyperparameter tuning. Popular random walk methods such as DeepWalk and Node2vec, for which parameter tuning is tedious, show minimal gains in AUC.
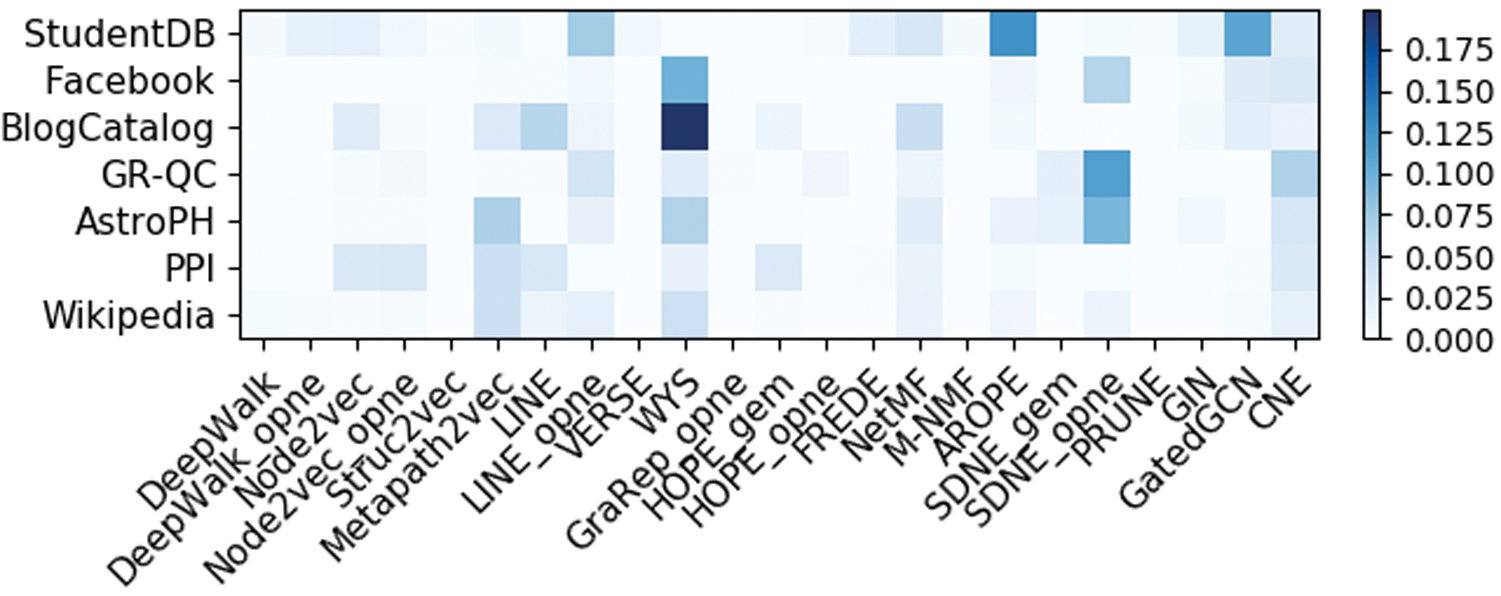
Improvement in AUC of tuning model hyperparameters. Only methods with tuned parameters are shown. AUC, area under the ROC curve. Color images are available online.
In Figure 2, we present the node-pair embedding operator selected by using hyperparameter tuning for each method and network on experimental setup LP1. The results indicate that Hadamard is the most frequently selected (in 71/161 cases) and that some methods prefer specific operators. This is: Hadamard in the case of VERSE, HOPE and SDNE, and average for PRUNE. The remaining methods present a mix of operators. On average, over all methods and datasets we observe a difference in validation AUC between the best and the worst performing operator of 0.141, with a standard deviation of 0.092. This clearly highlights the need to tune the node-pair embedding operator as a method hyperparameter.
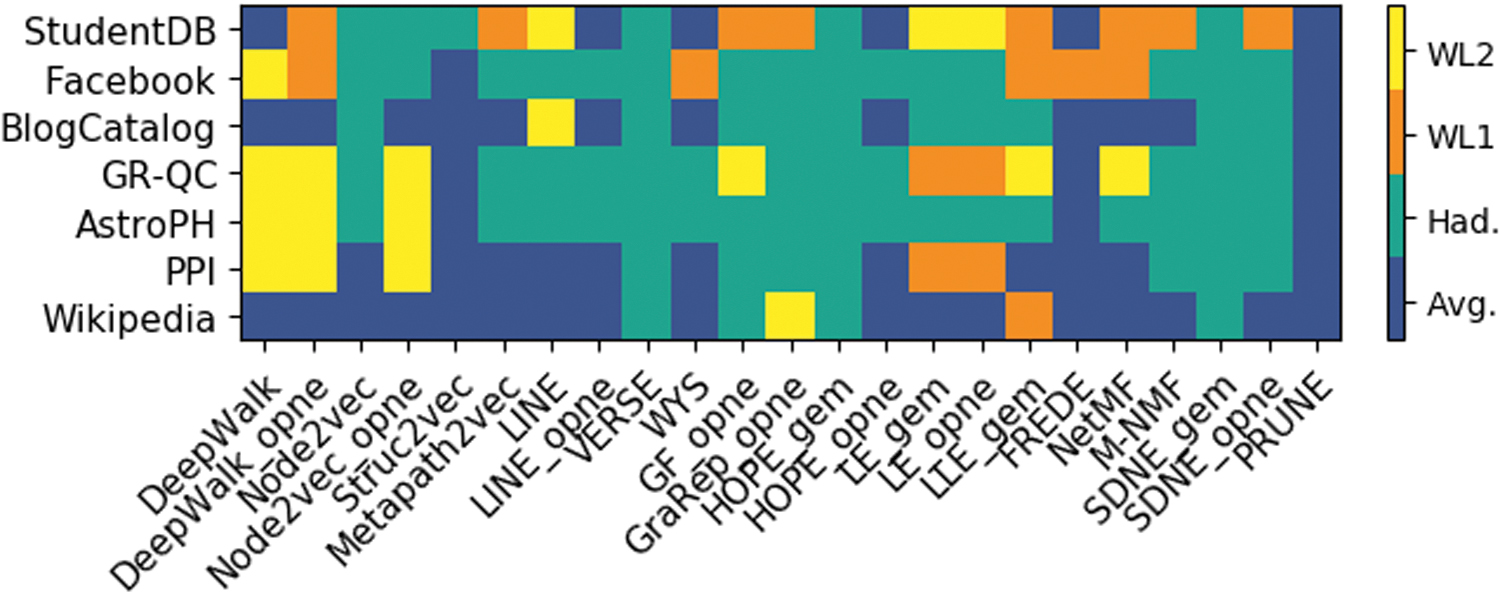
Best performing node-pair embedding operators on setup LP1. Only methods for which the node-pair operator was tuned are shown. Color images are available online.
For each method, the sum of execution times on the seven evaluated networks for experimental setups LP1 and LP2 is presented in Figure 3. As expected, runtimes for LP1 are larger than those of LP2 and the differences are especially significant for the methods with more tuned hyperparameters, for example, Node2vec, Struc2vec, and SDNE (as this implies computing an embedding of the validation graph for each combination of hyperparameters).
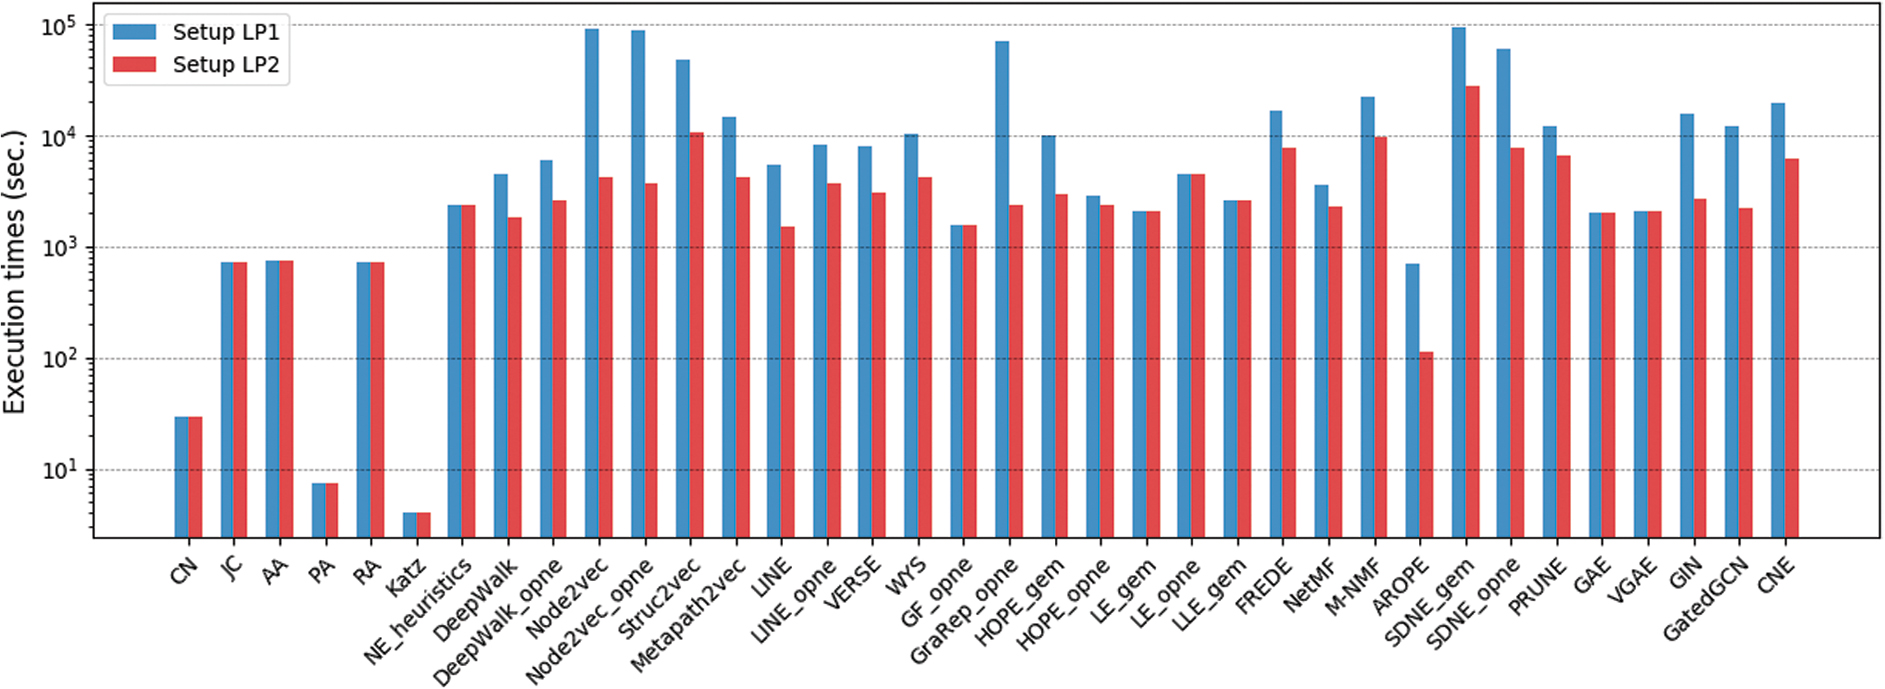
Execution times in seconds of setups LP1 and LP2. Color images are available online.
Nevertheless, the highest increase in runtime can be found for GraRep, for which a single hyperparameter was tuned (the k-step). This indicates that computing high-order proximities in GraRep is a slow process and, as shown in Figure 1, does not result in a large improvement in performance for k-step >4.
We also observe from Figure 3 that naive sequential implementations of the heuristics are still faster than heavily optimized and parallelized NE methods, with only AROPE presenting comparable runtimes. Finally, with no hyperparameter tuning, similar patterns can be observed within each method family with factorization methods being the fastest.
Embedding dimensionality
We have evaluated the effect of embedding dimensionality on method performance by modifying setup LP1 and computing the AUCs of all methods for
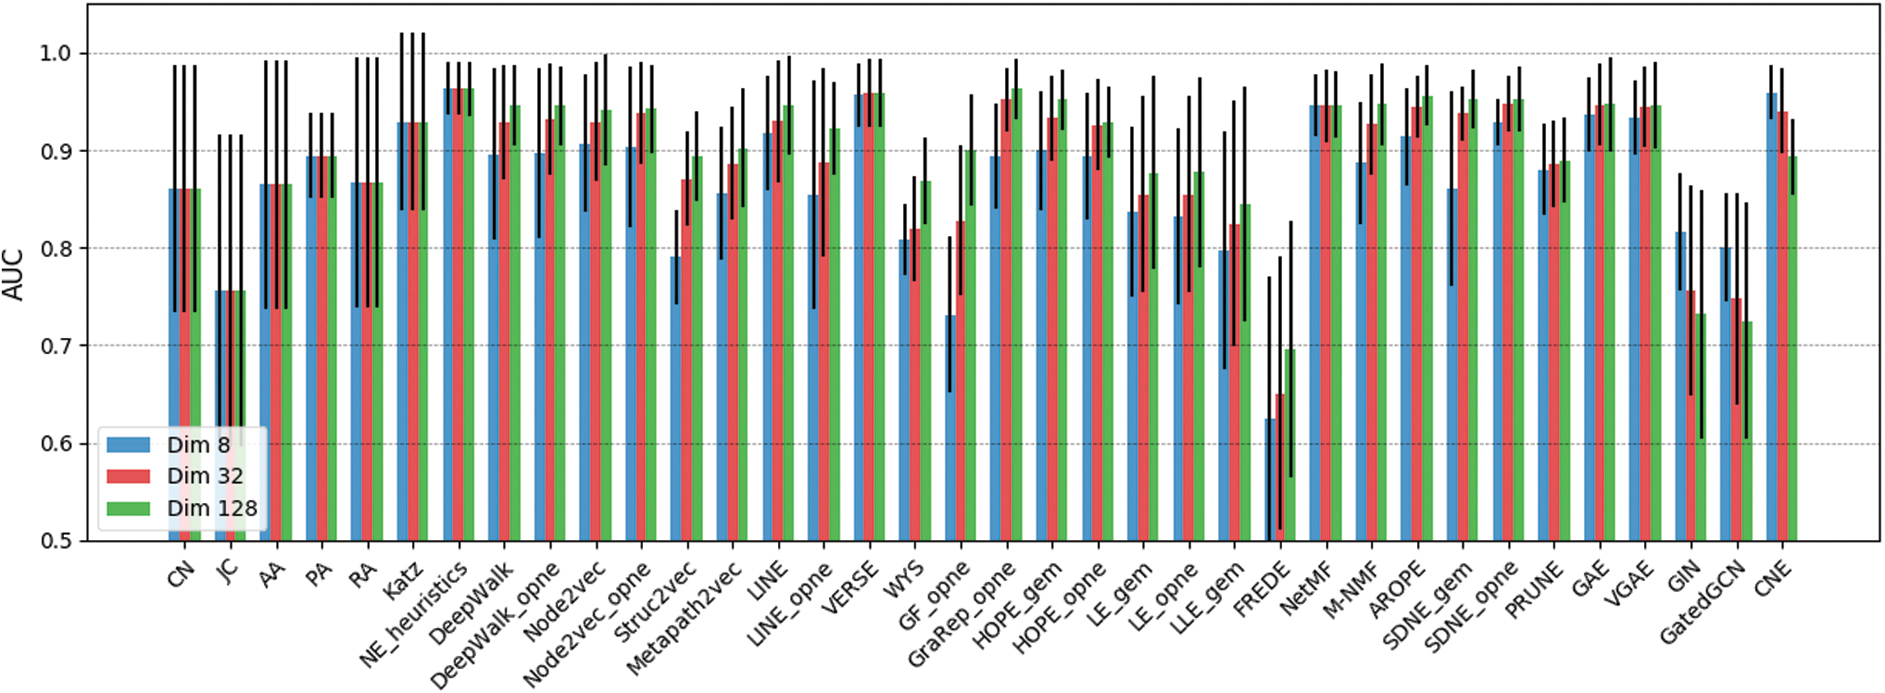
Method performance (AUC) on setup LP1 for
Train-Test split size
We further used experimental setup LP1 to analyze the effect on method performance of the train fraction f. These results are summarized as three heatmaps in Figure 5 showing performance as
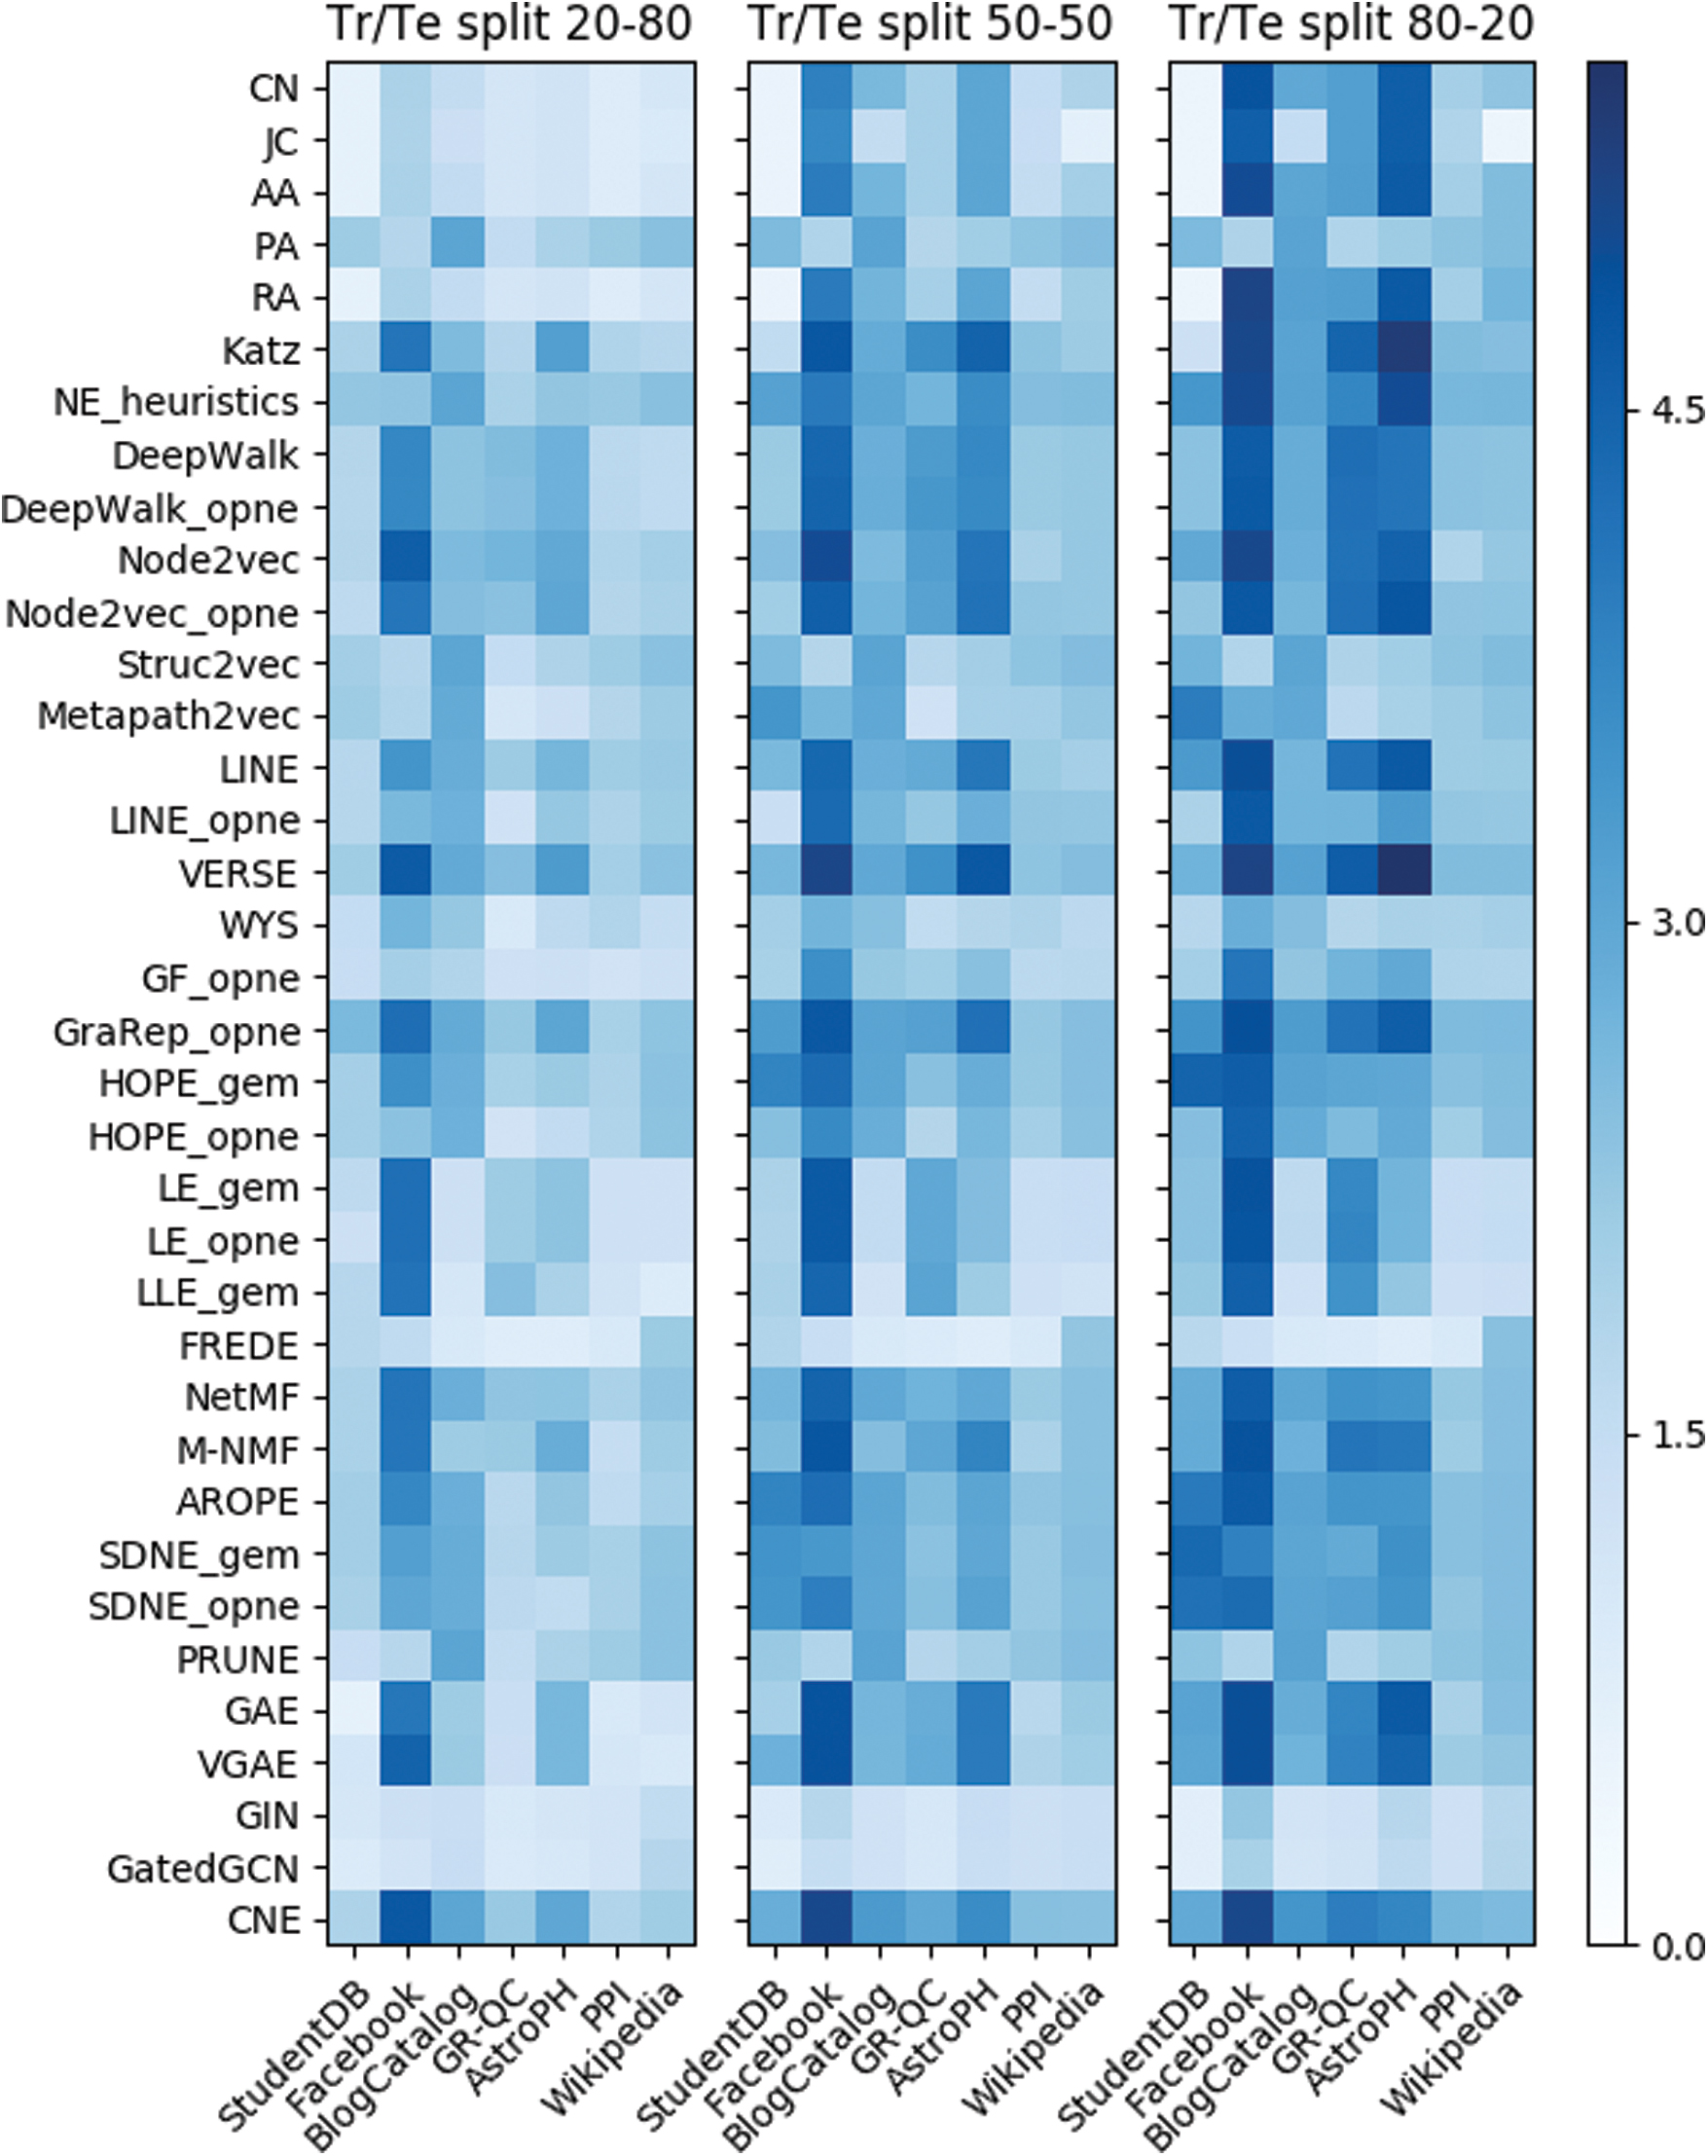
Method performance as
From this experiment, we also observe that probabilistic approaches present the highest robustness to varying train set sizes followed by Skip-Gram, factorization, neural approaches, and, finally, the heuristics. VERSE, GraRep, CNE, and NetMF are the methods that best capture the network structure when only 20% of the edges are used for training. Lastly, regarding method runtimes, these increase by ∼60% from evaluations with
Edge sampling
We also conducted an experiment to compare the three strategies introduced in the Link Prediction section, namely random, ST, and DFT, for splitting
For large networks, edge sampling can become a bottleneck and, thus, sampling runtimes were also worth investigating. Our results, depicted in Figure 6, show that the random strategy is the slowest followed by ST and finally, DFT, which is up to one order of magnitude faster on specific networks. The slower runtimes of the random strategy are mainly due to set intersections to obtain the correct
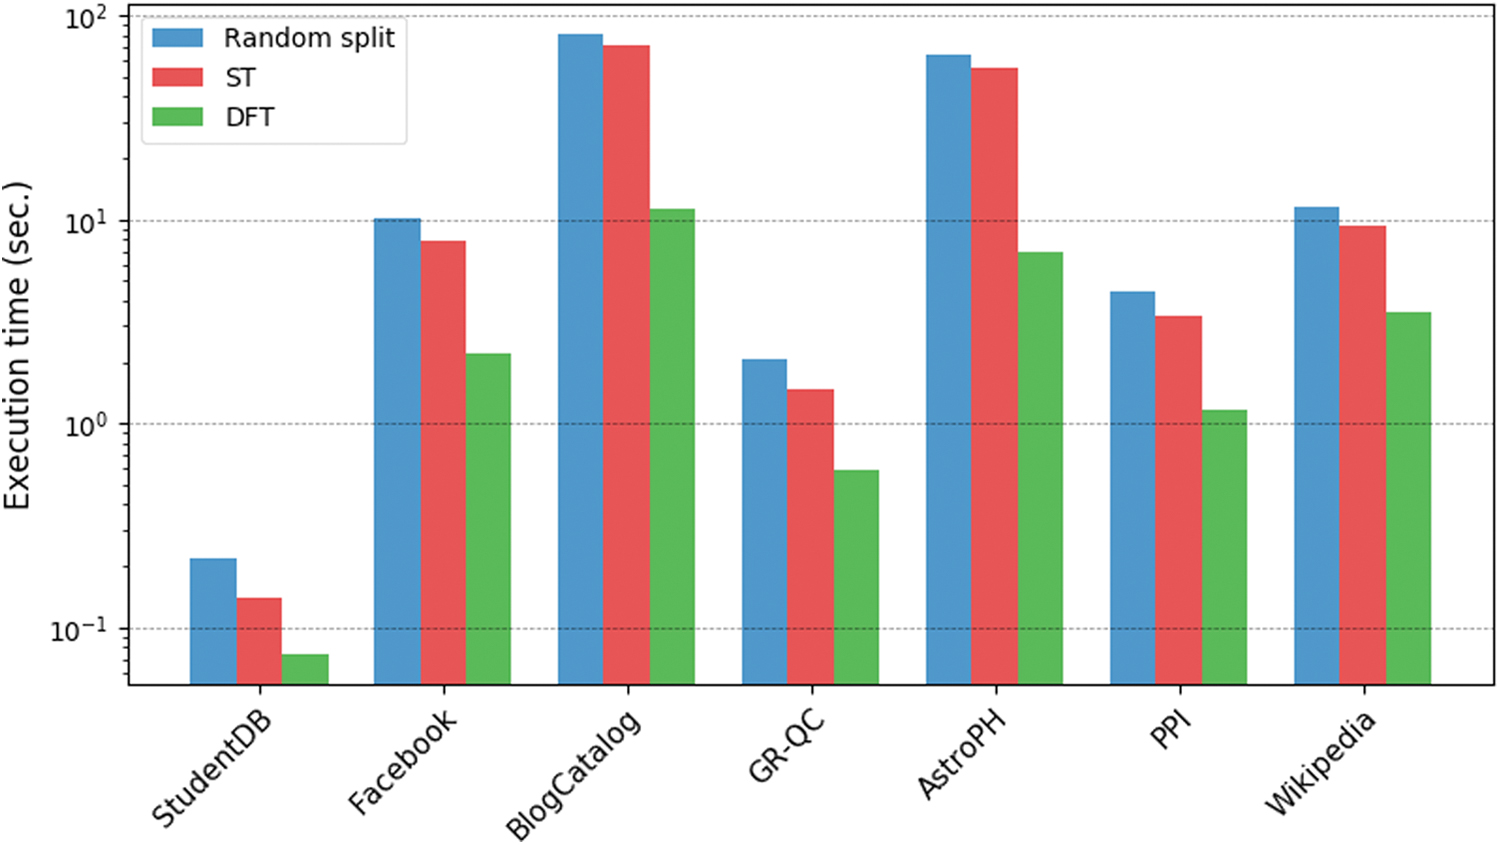
Execution times of different train-test split algorithms. Color images are available online.
Our experiments also reveal that the random edge split strategy does not preserve all nodes from the input graph
We also compared the ST strategy with a split based on edge timestamps to determine whether the excellent performance of the heuristics is a result of the edge sampling strategy used. For this, we selected two temporal networks CollegeMsg and MathOverflow from the SNAP repository. 45 The first network encodes messages sent between students at UC Irvine, whereas the second captures interactions between users of the Math Overflow social platform.
As both networks present temporal information on the edges, we can compare a timestamp-based edge sampling with the random ST strategy. In this experiment, we used setup LP2 with a fixed train fraction of 0.8. In the timestamp sampling, we selected the 20% most recent edges such that, when these were removed, the remaining training graph was still connected.
Our results are summarized in Figure 7. We observe that the ST strategy significantly boosts the performance of both heuristics and NE methods when compared with the timestamp sampling. We also observe that for ST sampling the performances of heuristics and NE methods are very similar, whereas for the timestamp sampling, the latter perform slightly better. Ultimately, this experiment indicates that the sampling strategy induces properties on the training graphs that some approaches might exploit better than others.
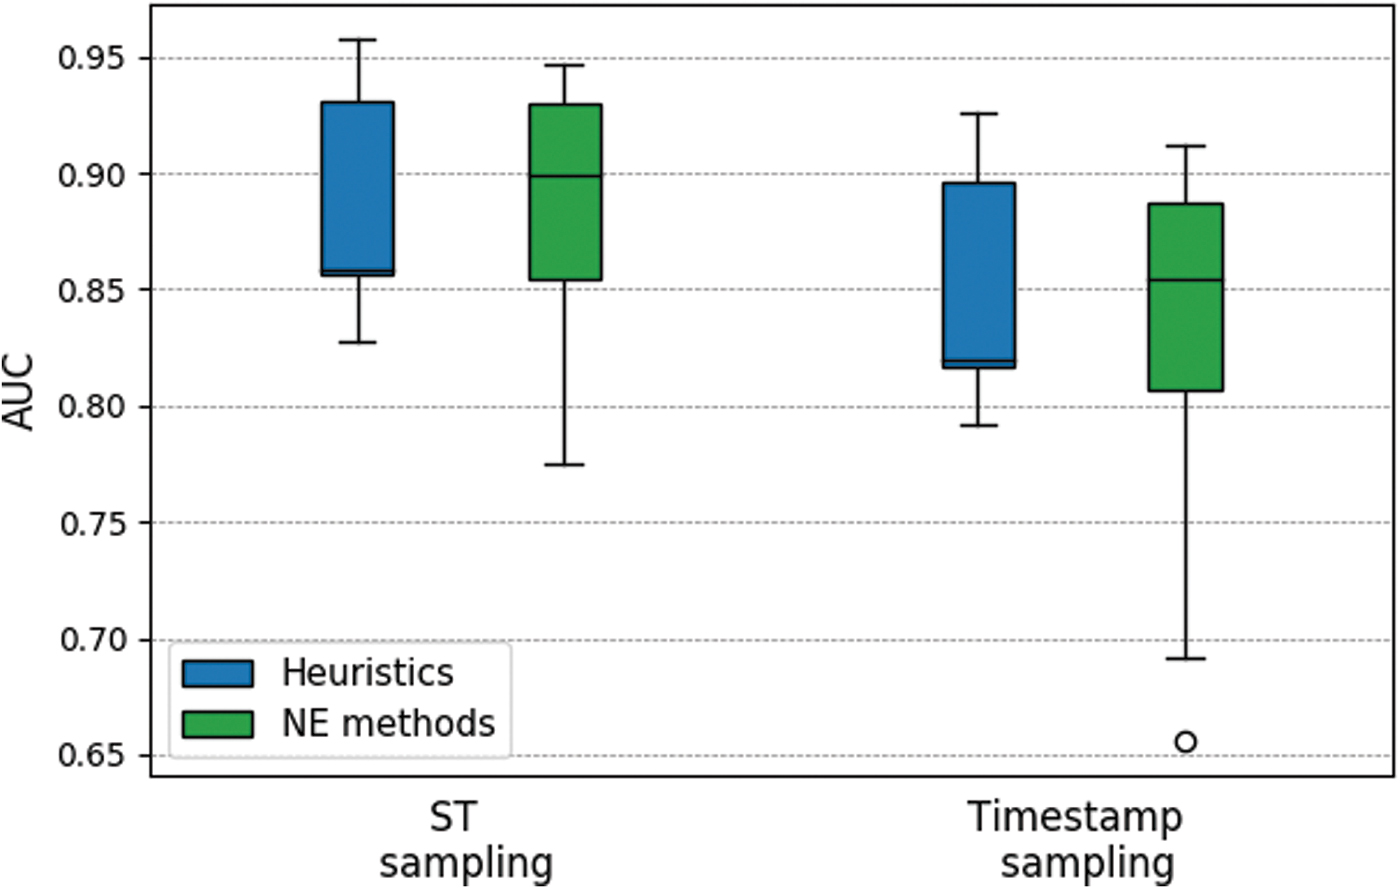
Performance of the heuristics and NE methods compared for the spanning tree and timestamp-based sampling strategies. NE, network embedding. Color images are available online.
Finally, we also monitored the variation in performance when embeddings are learned from different initial training graphs
This experiment, thus, indicates that averaging link prediction results over several sets
Prediction pipeline
For all end-to-end methods considered in our experiments (i.e., GAE, VGAE, GIN, GatedGCN, AROPE, and CNE), we compared their original pipelines with the same pipeline used for other methods, that is, computation of node-pair embeddings followed by binary classification with LR. The results are summarized in Figure 8 and show that for most methods and networks, computing node-pair embeddings and performing LR can result in a higher overall performance.
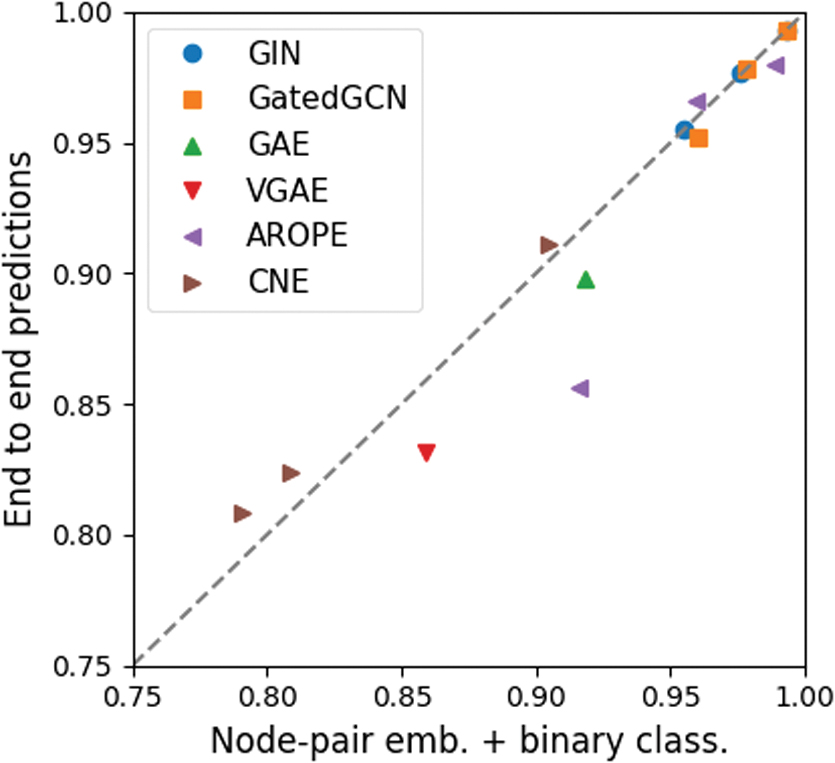
End-to-end prediction pipelines compared with node-pair embeddings and binary classification. Color images are available online.
We have conducted additional experiments using setup LP2 comparing all methods with different binary classifiers: LR, LRCV, and decision trees (DT). Our experiments do not reveal any significant differences in performance for most methods, with the exception of LE and LLE, which are significantly boosted by the DT classifier. For LE we observe an increment in average AUC over all networks of 6.5%, from 0.87 using LRCV to 0.93 with DT. For LLE, the increment is of 7.8%, from an AUC of 0.84 with LRCV to 0.91 with DT.
The LR binary classifier can also be used to gain insights on how NE methods distribute information over the available embedding dimensions. In Figure 9, we show, for each method, the sorted log odds of the LR coefficients. These are presented for a specific network (GR-QC) and train-test split on setup LP2 with
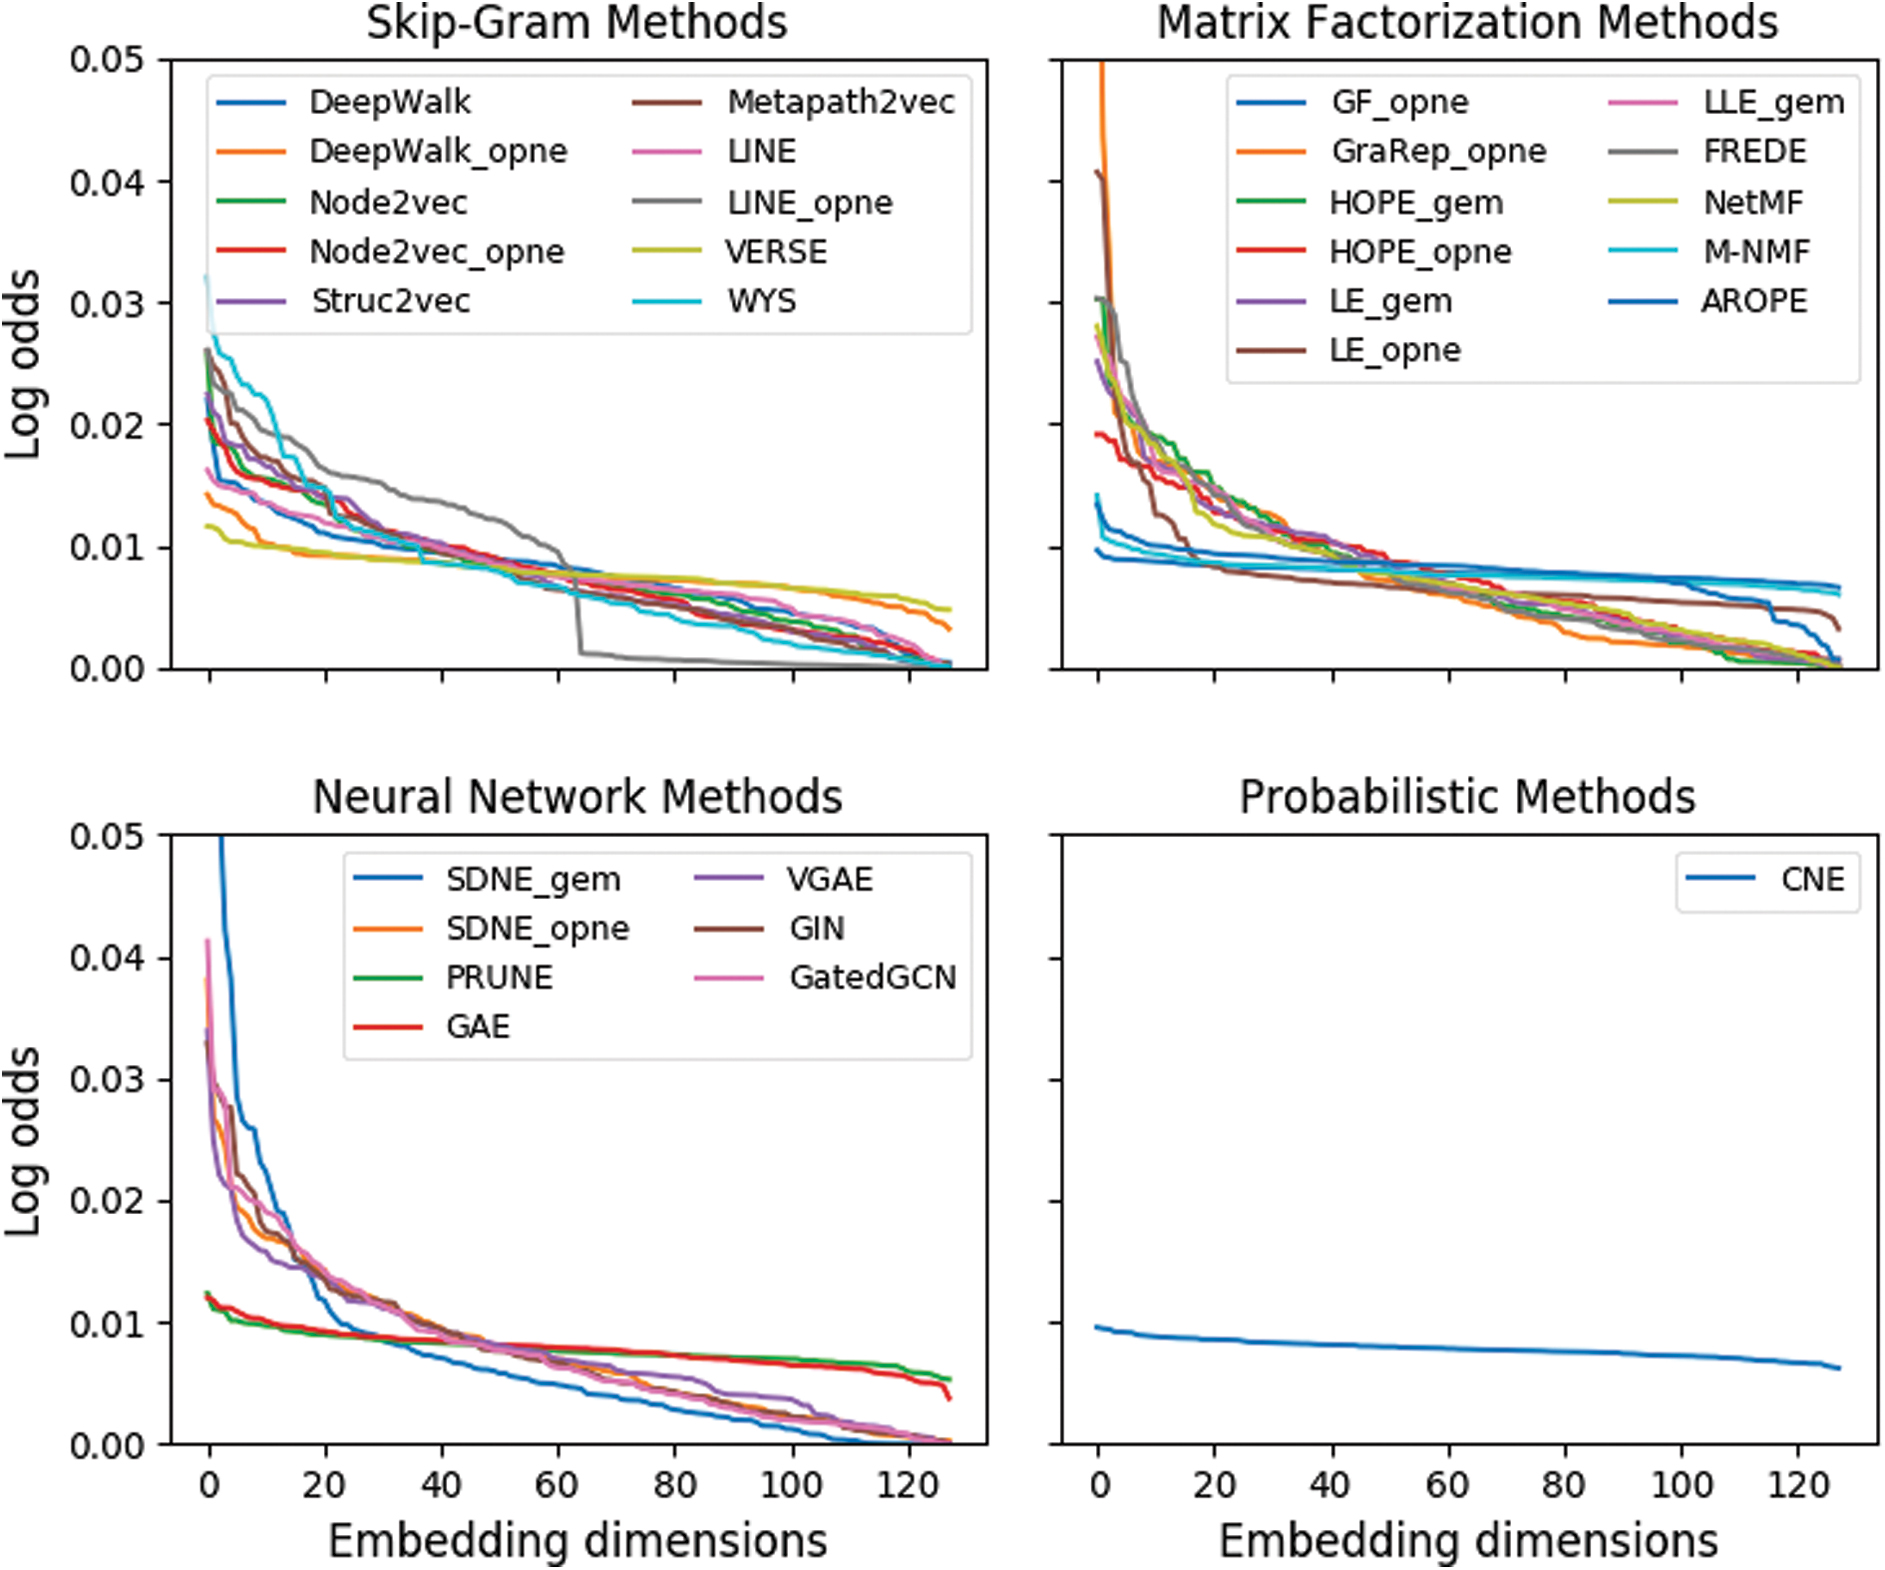
Log odds for each coefficient of the LR binary classifier. Results are presented for the GR-QC dataset, but identical patterns are observed for other networks and experimental setups. LR, logistic regression. Color images are available online.
Notable exceptions are some of the top performers, that is, CNE, VERSE, and AROPE, and also other methods such as GF, M-NMF, GAE, or PRUNE, which spread the information more evenly. A second interesting finding is that the OpenNE implementation of LINE evaluated appears to encode no information beyond dimension 64. This could indicate an implementation error when calculating the second-order proximities (recall that this implementation uses concatenated first and second orders). We do not observe this pattern in the original implementation of LINE (LINE-2), which takes full advantage of all 128 dimensions.
Network reconstruction performance
For the network reconstruction task, we first summarize method performance in terms of precision@Np, for
Network reconstruction performance shown as precision@100 where method hyperparameters are tuned and
The best method/methods within each type of approach are highlighted in bold, and the overall best for each column are depicted in a gray background.
The average precision@100 over all networks and average rank for each method are also presented.
AUC, area under the ROC curve.
In Figure 10, we plot the precision@Np for a range of Np values for a subset of methods and networks. The methods shown are the top performers from Table 4, that is, Katz, VERSE, HOPE_opne, AROPE, and VGAE. We observe that Katz is the only method that maintains a very high precision on all networks as the threshold increases. AROPE and HOPE perform very similarly on all networks and maintain overall good precision scores. For VERSE and VGAE, we observe large variations between different networks and overall lower performances.
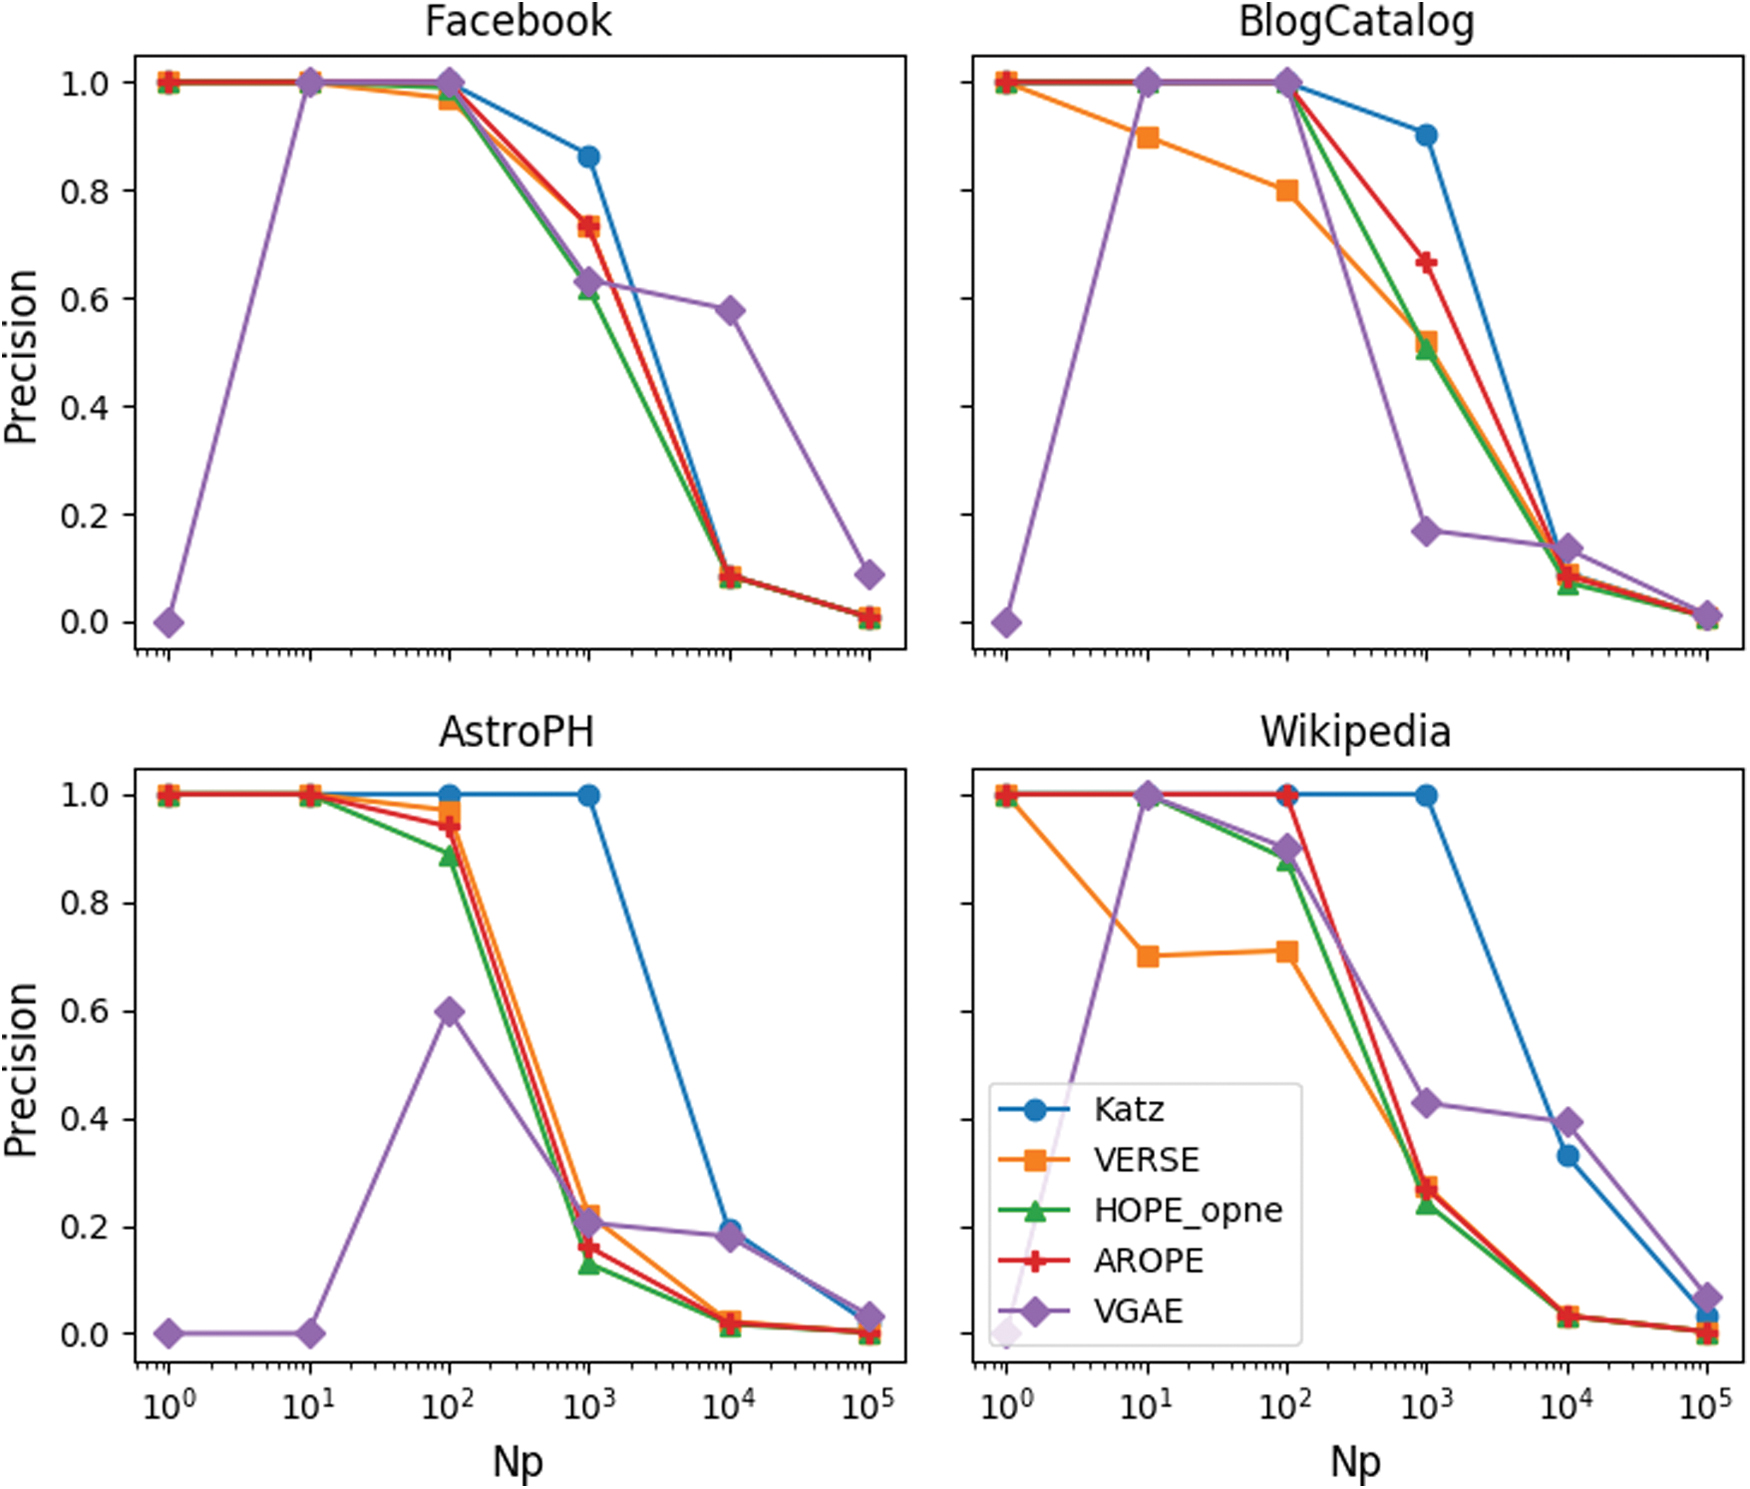
Network reconstruction performance in terms of precision@Np shown only for the top-performing approaches. Color images are available online.
Method performance and network structure
The results in Tables 3 and 4 also show that most NE methods and heuristics perform well on Facebook, AstroPH, and GR-QC (a graphical representation of the results in Table 3 is provided in the rightmost heatmap in Fig. 5 ‡ ). These networks share similar topologies with large diameters and high clustering coefficients, which indicate the presence of community structures within the networks.
These observations are consistent with the data represented by the networks, that is, groups of friends in Facebook and citations between papers in different research sub-fields for AstroPH and GR-QC. The community structures with high intra-community edge densities and low inter-community densities could explain the higher link prediction performance of most methods.
On the other hand, the lowest method performance can be observed for StudentDB, BlogCatalog, Wikipedia, and PPI.
For StudentDB, the k-partite structure of the network poses a challenge to both heuristics and NE methods; first, due to the fact that, in this case, similar node neighborhoods do not necessarily imply that two nodes should be connected. For instance, two students following the same courses will have identical node neighborhoods; however, they should never be connected, as links between nodes of the same types do not exist in the data. Second, NE methods must at the same time represent similarity between nodes of different types and dissimilarity for those of the same type. For example, students following the same course must be embedded close to the said course yet far from each other. Methods that are able to capture high-order proximities between nodes (e.g., GraRep, HOPE, AROPE) or those that learn node roles (e.g., Metapath2vec) maintain high AUC scores in this case.
The BlogCatalog and Wikipedia networks present very similar structures with small diameters, high clustering coefficients, and large average degrees. This can result in cluttered representations, where all nodes are close by, making downstream classification tasks harder. Lastly, the PPI network presents the opposite scenario with a large diameter and a small clustering coefficient. This can result in embeddings, where most nodes lie equally far from each other and, thus, overall lower AUCs.
We further analyzed the reasons behind the large variations in method performance on different networks by computing the average true positive rates (TPR) and false positive rates (FPR) over all methods for each network. As a threshold, we used the value in the AUC that maximized the accuracy of predictions. We omit showing the full statistics for brevity. We observe that although most TPRs at this threshold vary around 0.8, the FPRs for StudentDB, BlogCatalog, PPI, and Wikipedia are three orders of magnitude higher than those of other networks. This indicates that, indeed, a clear community structure simplifies the link prediction task whereas cluttered graphs negatively impact the prediction of non-edges.
Limits to the scope of this evaluation
Constraints on overall computation time (the results in this section required ∼65 days to compute) inevitably imply boundaries to the scope of this evaluation: It is limited to popular mid-sized undirected and unweighted networks. It evaluates a representative but non-exhaustive set of NE methods. It only evaluates methods purely exploiting the network structure (and not node/edge meta-data), such that some methods are not used to their full potential (but note that the same holds for the heuristic baselines).
Further, the selected heuristics are very simple; other more powerful similarity metrics between network nodes have been proposed, for example, in Refs.49,50 These are not included, as a thorough analysis of link prediction heuristic performance is not the main goal of our work. For a detailed overview and experimental evaluation of different heuristics, we refer the reader to Ref. 51
External validation of the results
Due to differences in the evaluations, we can only validate our results, to some extent, against the empirical results in the Node2vec and CNE papers. In the first case, although our AUC scores are consistently higher, the same main conclusion holds: node2vec outperforms its competitors on the three networks originally evaluated. However, a properly tuned LINE exhibits similar performance or even outperforms node2vec on other networks. In the second case, our results are very similar to those reported by the authors of CNE. Finally, our evaluation also corroborates the conclusions reported by the authors of AROPE regarding network reconstruction performance and the choice of the node-pair operator for VERSE.
Conclusions
In this article, we have conducted an extensive empirical study on NE methods. Our results show that, despite the surge of interest in the field in recent years, thin progress has been made. Most of the NE methods evaluated perform very similarly, and in most cases not significantly better than simple heuristics for both tasks studied. On average, the proposed NE_heuristics baseline outperforms all other methods for the link prediction task. Nevertheless, some embedding-based methods such as GraRep, VERSE, and CNE do show promising results.
We have also shown that clear community structures in the graphs, high embedding dimensionalities, and capturing high-order proximities between nodes all impact method performance positively. In contrast with recently published results, our experiments indicate no significant difference between LR and LRCV as binary classifiers in this setting. We also highlight the need to tune the node-pair embedding operator as a model hyperparameter and that a single train-test split provides a good estimation of method accuracy, resulting in higher evaluation efficiency.
Methods such as Katz, VERSE, HOPE, AROPE, and VGAE present exceptionally good results for network reconstruction. Finally, we hope this study and evaluation toolboxes such as EvalNE serve as initial steps toward the creation of standard evaluation pipelines for NE methods, and shed light on the current state-of-the-art. Specifically, we plan to use these results as a basis for an online resource that is continuously augmented with results for newly developed methods and/or other networks.
Footnotes
Authors' Contributions
A.M., J.L., and T.D.B. conceived and planned the experiments. Alexandru Mara designed and implemented the computational framework used in the experiments and carried out the evaluations. J.L. and T.D.B. verified the evaluations and contributed toward the interpretation of results. All authors provided critical feedback that helped shape the research and the article.
Author Disclosure Statement
No competing financial interests exist.
Funding Information
The research leading to these results has received funding from the European Research Council under the European Union's Seventh Framework Programme (FP7/2007-2013)/ERC Grant Agreement no. 615517, from the Flemish Government under the “Onderzoeksprogramma Artificile Intelligentie (AI) Vlaanderen” programme, and from the FWO (project no. G091017N, G0F9816N, 3G042220).
Abbreviations Used
References
Supplementary Material
Please find the following supplemental material available below.
For Open Access articles published under a Creative Commons License, all supplemental material carries the same license as the article it is associated with.
For non-Open Access articles published, all supplemental material carries a non-exclusive license, and permission requests for re-use of supplemental material or any part of supplemental material shall be sent directly to the copyright owner as specified in the copyright notice associated with the article.