
Abstract
Abstract
Methods from machine learning and data science are becoming increasingly important in the social sciences, providing powerful new ways of identifying statistical relationships in large data sets. However, these relationships do not necessarily offer an understanding of the processes underlying the data. To address this problem, we have developed a method for fitting nonlinear dynamical systems models to data related to social change. Here, we use this method to investigate how countries become trapped at low levels of socioeconomic development. We identify two types of traps. The first is a democracy trap, where countries with low levels of economic growth and/or citizen education fail to develop democracy. The second trap is in terms of cultural values, where countries with low levels of democracy and/or life expectancy fail to develop emancipative values. We show that many key developing countries, including India and Egypt, lie near the border of these development traps, and we investigate the time taken for these nations to transition toward higher democracy and socioeconomic well-being.
Introduction
As more data becomes available, we increase our understanding of processes and dynamics we observe in societies. One phenomenon that has received some attention in the economics and political science research is development traps. Under certain conditions countries can get stuck in these traps and experience a period of stagnation of the socioeconomic development on a low level. Data provided by the World Bank or the United Nations (UN) may give some insight into this phenomena. Data mining and machine learning techniques,1,2 for instance, could facilitate predictions about the risk of countries getting trapped in low development, and the time required for countries to move out of development traps. This can be a useful approach if predictions are the ultimate goal. However, such an approach is limited in terms of providing understanding2–6 of the dynamics and mechanisms of development traps.
Data scientists are now discussing ways to extend or find new methods in machine learning that would allow modeling of causality, detecting mechanisms or including social and economic theory in data science approaches.7–9 In an earlier article, 10 we propose a data-driven dynamical systems approach to deriving differential equation models from panel data. Our approach is inspired by machine learning approaches, to the extent that model building is data driven. However, our approach differs from a pure machine learning approach, in that we do not merely fit models to make best possible predictions but derive a set of equations that describe the underlying processes. The hope is that these equations will aid understanding of the underlying process.
One question where understanding is just as important as prediction is in the change of cultural values, development, and democracy.11–14 In Spaiser et al. 15 we applied our method to look at how democracy, socioeconomic development, and cultural values have changed across different countries in the last 30 years. We fitted differential equations for the rate of change of six indicators as a function of the level of the indicator itself and the level(s) of other predictors in the previous year. The result of this work was a general dynamical model of the interactions between democracy, cultural values, and socioeconomic indicators that provided the best fit to the available data. Figure 1 summarizes the dynamic relations we found between the various indicators. 15 In brief, we found that a critical level of the Human Development Index (HDI) triggers democratization and then the emancipation of the population. However, while emancipative values contribute to equal access to education and a healthy life, they do not lead to further accumulation of wealth. Thus once countries reach high levels of democracy and emancipation, they tend toward equilibrium in terms of economic growth.
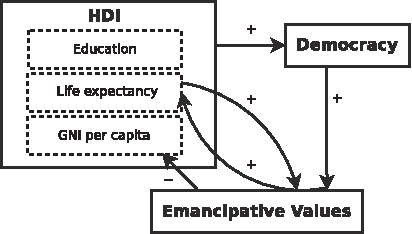
Dynamic model of interactions between socioeconomic indicators, democracy, and cultural values.
The next step, and the question we address here, is to use our model to understand the underlying process of human development. This is an essential step if we are to address the issue of mechanisms and causality.7–9 It is also essential if we are to disentangle the consequences of the interactions between values, democracy, and development shown in Figure 1. While this flow diagram indicates positive and negative feedbacks, the picture becomes complicated when we consider the underlying nonlinear differential equations (presented in detail below). From these we can see various threshold effects, where interactions change sign depending on the level of interacting variables. In particular, these thresholds suggest the possibility of “development traps,” where countries can become “trapped” with low levels of democracy and/or socioeconomic development. The question is how these traps interact to determine the course of socioeconomic and political development in the world.
Development traps are widely discussed in the economics literature. For instance, Nelson 16 and Azariadis and Drazen 17 examined causes such as endogenous population growth or technological externalities with a “threshold” property, for persistently low rates of growth or relatively low levels of economic development of countries. More recently, Sachs 18 analyzed causes for poverty traps in terms of misbalances in different types of capital, for instance, undersupply of human capital in terms of education. 19 A poverty trap is generally seen as a self-reinforcing mechanism that causes poverty to persist, usually from generation to generation. 20 Low growth and poverty traps are closely linked, since they represent different perspectives on underdevelopment.16,21
Rather than concentrating solely on economic growth traps, we look at development traps with respect to both democratization and socioeconomic development. Our starting point is the empirical relationships summarized in Figure 1, and our aim is to clarify the implications of these relationships in terms of development traps. To do this we employ two tools. The first is dynamical systems style 22 mathematical analysis of the nonlinear equations that best fit the data. The second is stochastic simulation of the equations. We model inherent variability in development using independent Gaussian noise variables and account for the unpredictability by performing stochastic integrations to obtain estimates of future probability distributions in the socioeconomic, political, and cultural values indicators.
Data and Methods
We used six different indicators in our analysis: four socioeconomic indicators and one democracy and one cultural values indicator. The analysis has been done for the time period 1981–2006 for 65 countries (for details on data availability, see Table 1 and Spaiser et al.
15
). HDI,
GNI, gross national income.
In our article,
These six indicators were chosen because the analyses in this article build on results we have published in an earlier article. 15 Originally, the selection of these indicators was inspired by the Human Development Sequence Theory11,12 that assumes that socioeconomic development, cultural change, and democracy are interrelated. We have tested alternative indicators for democracy (effective democracy), cultural change (self-expressive values), and socioeconomic development (GDP per capita, female education) in our two earlier article, and the six indicators that were selected for analyses in this article proved to be best predictors. The results are also consistent over different indicators, with some exceptions for the democracy indicators, which we have discussed in the previous article. 15
The variables
In our previous article, we already identified relationships between the five variables. Specifically, we fit the changes (
The methodology used in the model selection is described in detail in Ranganathan et al. 10 and the steps taken to obtain these specific models are described in Spaiser et al. 15
In this article, we first use phase portraits based on the equations above to identify different patterns of behavior such as trap regions where the yearly changes slow down to very small values. Second, we look at stochastic integrations of the model.
In order to incorporate stochastic dynamics, we use discrete time versions of equations and include a noise term estimated from the data. For a simplified two-variable model, these are Equations (6) and (7) below, while for the five-variable model these are Equations (11)–(15) below. The deterministic terms in these models are precisely the same as described above, although now expressed in discrete time. The noise term in each variable at each time step is a constant multiplied by an independent normally distributed random variable with mean zero and standard deviation 1. The noise constant is the standard deviation of the error in the model fit, that is, the square root of the residual sum of squares divided by number of observations.
The stochastic integrations were performed starting from a set of four different initial conditions in the five variables corresponding to values for Egypt, India, Jordan, and Ukraine in 2006. At each time step we predict the yearly change using the model and add this to the current levels in the indicator variables along with independently generated observations from Gaussian noise variables corresponding to the description above. Since
Results
Democracy and development
Before we deal with the full model from Figure 1, we start by analyzing the interactions of just two indicator variables: human-rights democracy and HDI. This analysis will pave the way for the more complex model established between the five indicator variables in the full model. The best fit model relating democracy and HDI is
The noise terms
The model of HDI is straightforward to interpret. HDI grows at a constant rate, plus or minus a random term, and is unaffected by democracy. The democracy equation is more complicated. Democracy only increases in countries where
For smaller values of
The democracy trap condition [Eq. (6)] is quantitative, since it is estimated directly from the available data. It does not imply that every country below the line fails to increase in terms of democracy. Rather, it reflects the fact that over the last 30 years those countries that have not fulfilled the HDI condition have generally experienced decreases in democracy, while those above it have experienced increases. We can, and later in this article do, speculate why such a trap exists, but for now we simply note that it is an empirical pattern in the available data that can be summarized in terms of a single equation.
For this two-variable model, we can go on to obtain a full solution to the equations, in the absence of noise. Equation (7) can be solved directly to give
where
where
Figure 2a provides a full-phase portrait of Equations (6) and (7) (in the absence of noise). There are two time scales involved in the evolution of
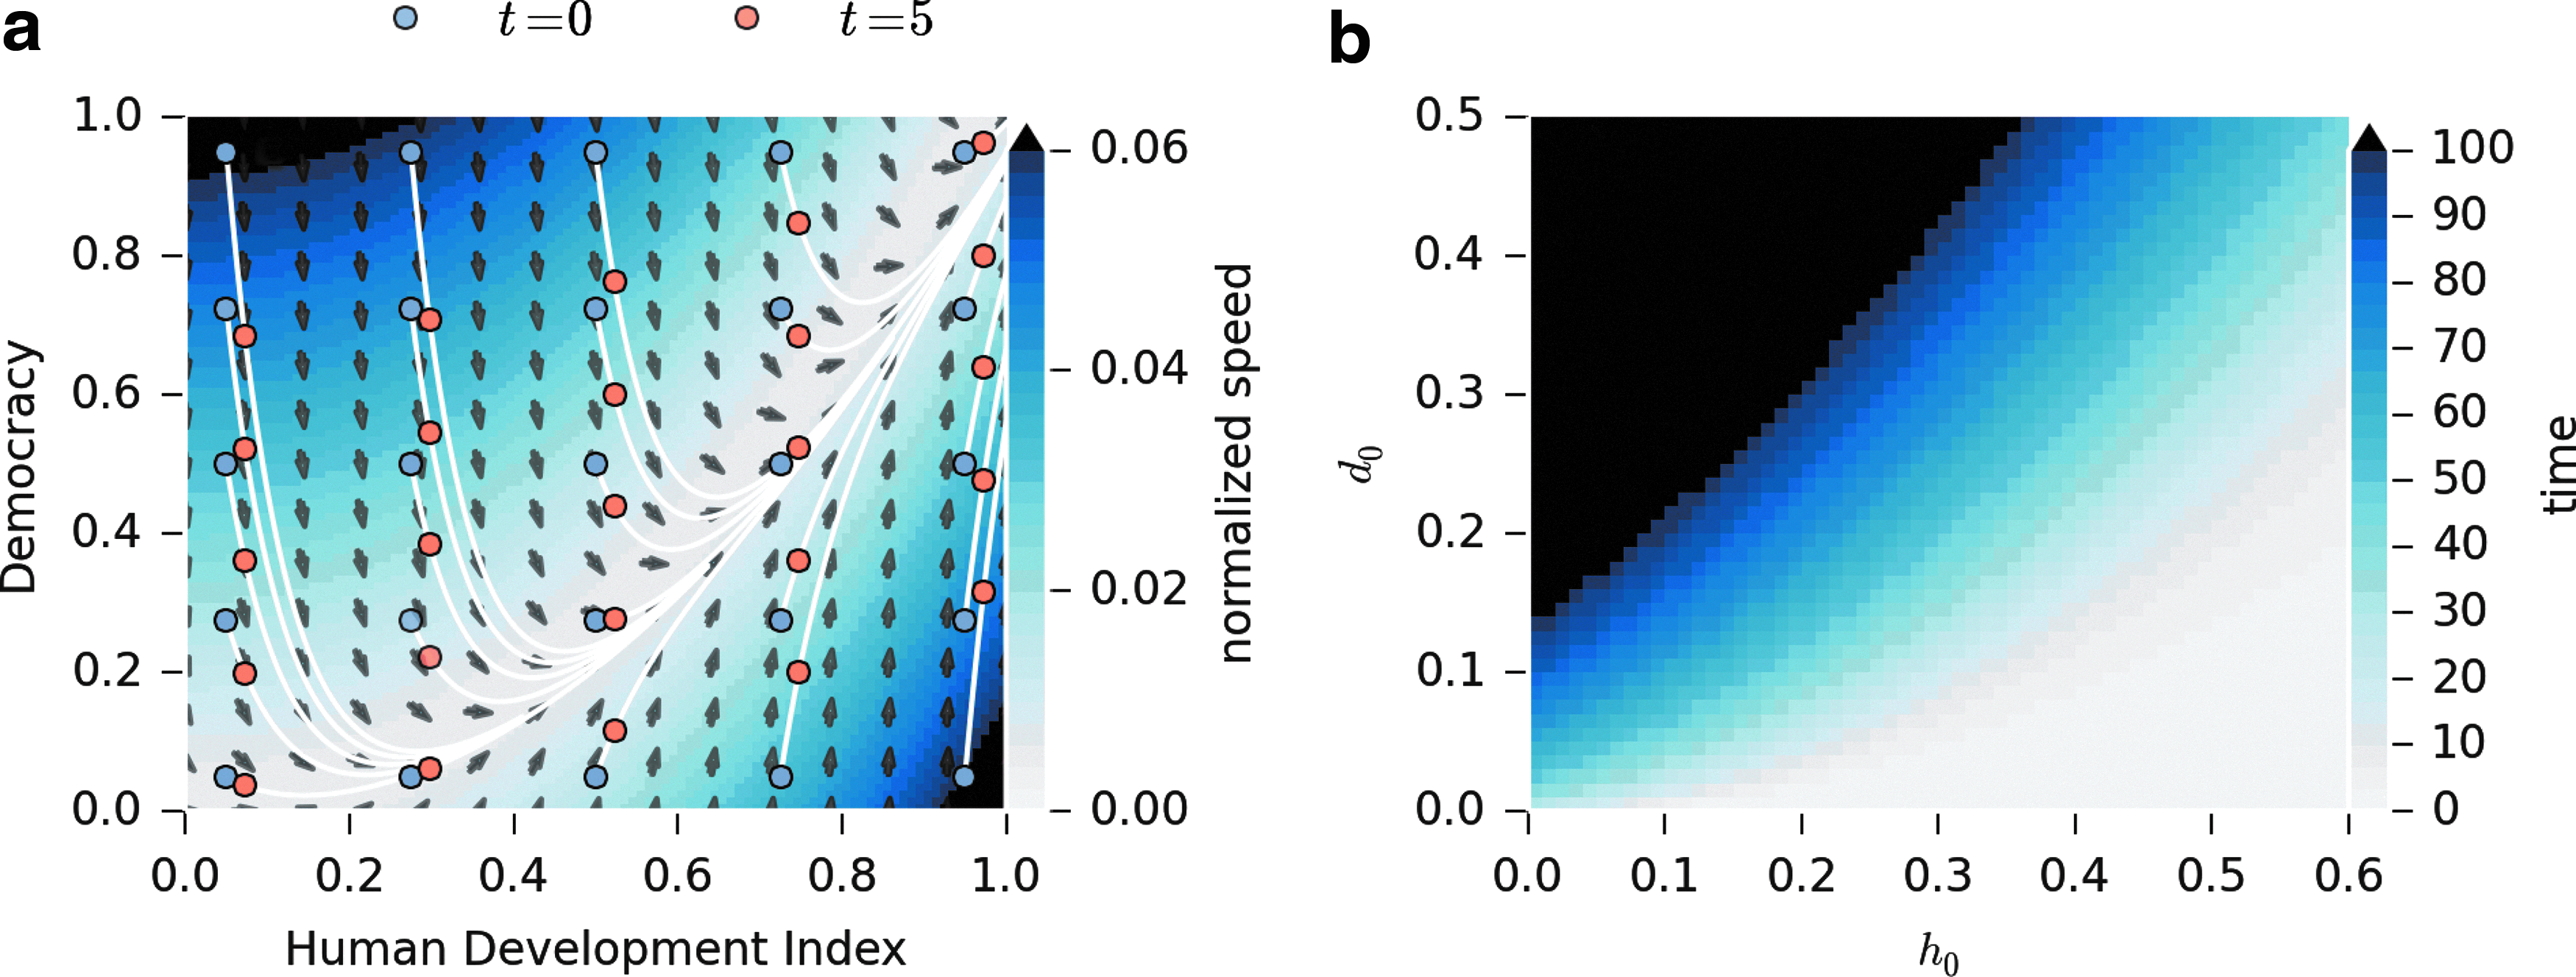
To provide a specific example, we take initial conditions corresponding to India in 1990, the first year the data is available (
The prediction that Indian democracy will grow slowly does not take in to account intrinsic and external noise or variability in the process of democratization and socioeconomic development. Noise and uncertainty is of course inherent in this process. While it is impossible to account completely for the uncertainty in future events, we can use the error in our model fit to account for some of this variability. Figure 3 shows example evolutions of a stochastic integration of Equations (6) and (7), including the noise term, for four different initial conditions corresponding respectively to Egypt, India, Jordan, and Ukraine.
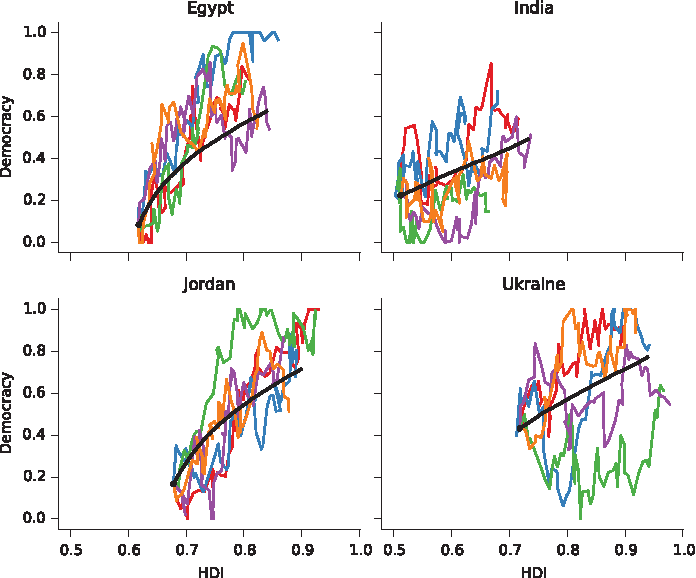
Stochastic integrations over a period of 50 years for initial conditions corresponding to Egypt, India, Jordan, and Ukraine. Average over 10,000 realizations (in black) and 5 different unique realizations (in color). Noise variances at each time step (corresponding to each year) are based on modeling error as specified in Equations (6) and (7).
Figure 4 shows a range of different possible democracy outcomes for India over a 50-year time scale, from long periods with continued low levels of democracy to increases to levels comparable with United States in 2006. For Ukraine, and also Egypt and Jordan, democracy levels comparable with countries in Western Europe, that is, greater than about 0.8, are plausible outcomes within 50 years. These are seen as the darker band at the top of Figure 4. In general, the noise in democracy is large, making it difficult to make reliable predictions using the two-variable model.
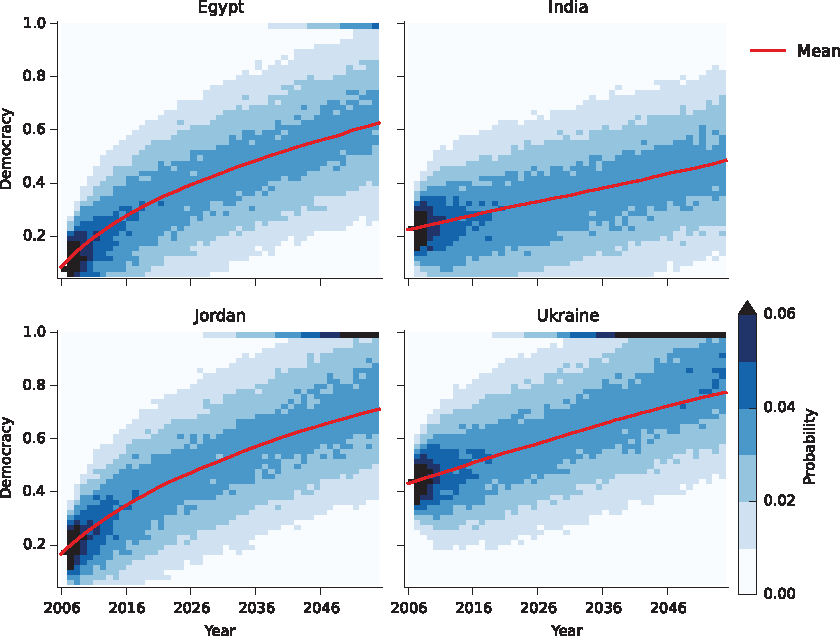
Heatmaps showing the evolution of the distribution of
Including HDI components and cultural values
The full model includes five variables. HDI is replaced by its three compound variables: GNI per capita
where
There are several insights that can be gained directly from these equations. First, the values for all the components of HDI generally increase over time or reach a stable equilibrium. In the case of life expectancy, this equilibrium is around 90 years old. Two of the HDI components, GNI and life expectancy, interact with emancipative values. This interaction is different for GNI, where countries with high emancipative values experience slow economic growth, than for life expectancy, which increases with emancipative values.
Democracy and emancipative values both have potential development traps. In the case of emancipative values,
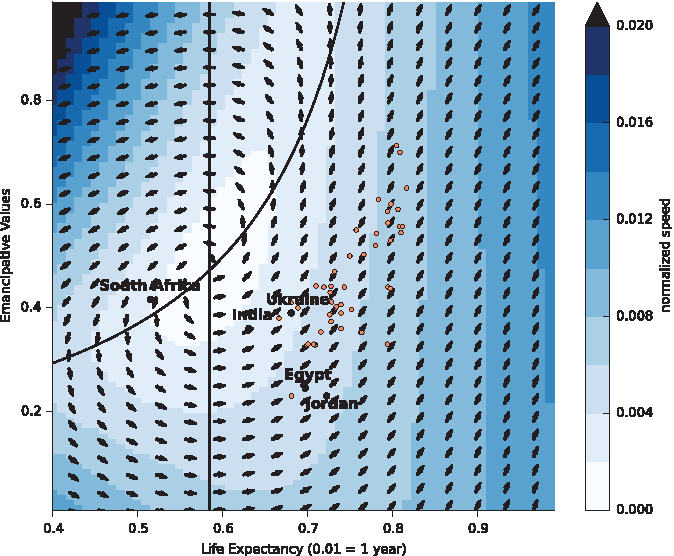
The phase portrait of
the change in both
To calculate the time it takes countries to increase their indicator values by a certain amount, we can do a further analysis of the system of equations. The steady state (
Using the eigenvalues we can infer the time needed to increase the values of
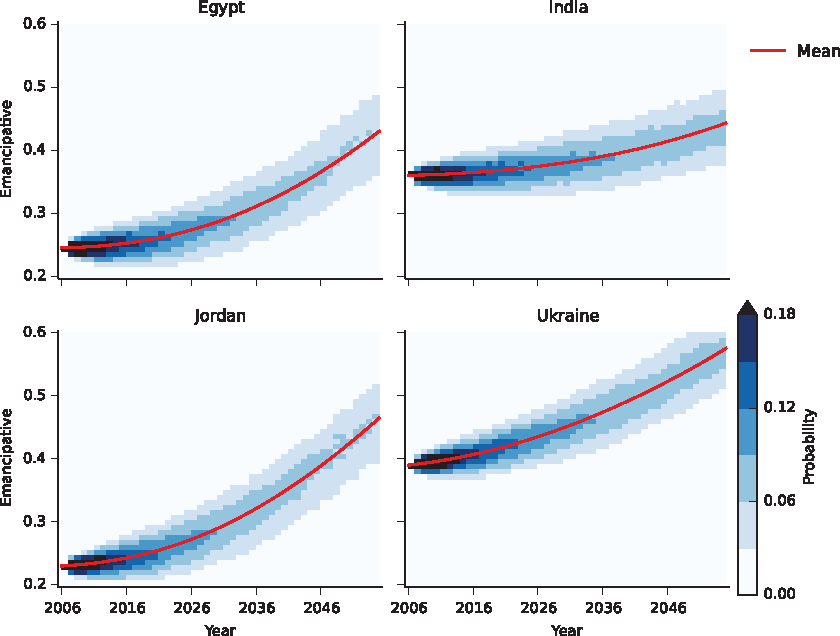
Heatmaps showing the evolution of the distribution of
The dynamic for democracy is similar to the two-variable model in the previous section, but now with an interaction between GNI and education. Specifically,
Democracy requires both high levels of education and economic growth in order to increase. Since education and GNI tend to be correlated, the five-variable model makes similar predictions as the two-variable model. The main difference appears to be in the speed with which democracy increases. Figure 7 shows how democracy is predicted to change in our four example countries. Here we see India reaching higher levels of democracy faster than in the two-variable model. Again, the variation in the prediction for democracy is high, and it is plausible that India reaches full democracy within 50 years.
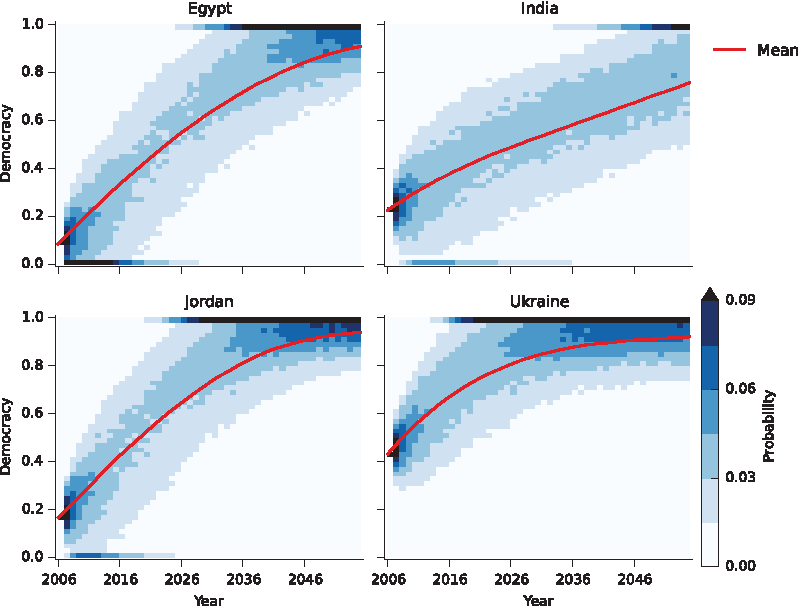
Heatmaps showing the time evolution of the distribution of the values of democracy
Figure 8 shows a phase plane for democracy and GNI for two different cases: one in which education is relatively low
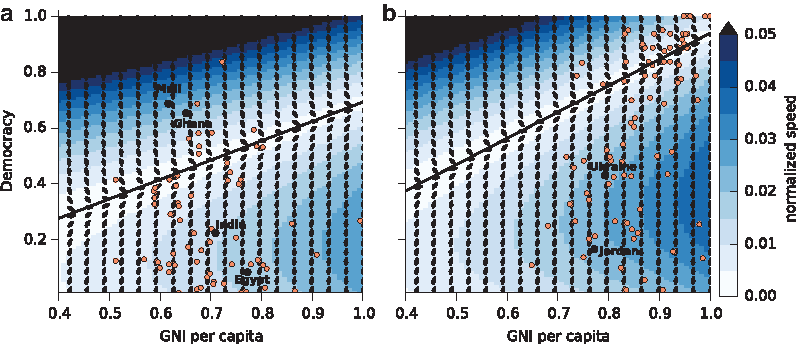
The phase portrait of the
On the other hand, certain countries with exceptional levels of democracy are predicted to experience decreases. For instance, Mali and Ghana have exceptionally high levels of democracy given their levels of GNI. The suggestion here is that these countries would require extra support, in order to avoid the fate of those countries in the past (like Nigeria or Bangladesh, for instance), which experienced a decrease in democracy. Since the time the data was collected in 2006, Mali has followed the path suggested by the model, experiencing civil unrest and decreases in democracy.
Finally, we can calculate the rate at which points near the line given by Equation (17) move away from it, using the eigenvalue for these points. This eigenvalue is 0.002/
Conclusions
In this article, we have extended the theoretical and empirical concept of the development trap studied in economics3,17,18 to the political dimension in terms of political regime development (democratization) and political culture development (emancipation). In line with more recent research,30–33 our analysis suggests that the development trap is a multidimensional phenomenon, because the economic and political spheres are closely linked and a development trap in the economic sphere necessarily translates into a development trap in the political sphere. Our contribution to this research field is the attempt to use the available data to quantify the development trap and factors causing it as well as factors contributing to overcome it. Moreover, we use the data to make probabilistic predictions about the time that would be necessary for a given country to overcome a certain development trap given its initial situation.
In this regard, we show how data-driven modeling and analysis can go beyond “black box” analysis and predictions.3,6 The analysis we do here reveals how different indicators interact and the implications of these interactions. This provides a step toward a method for elucidating theories about development directly from data.
It is widely recognized that the last 30 years have seen a global trend toward democratization, in terms of regime change and emancipation, where people become more tolerant of the rights of others.12,13,34–36 Despite this general trend, this article has shown that some countries may not experience democratization in the near future. They are caught in a development trap with respect to democracy and/or emancipation. Although in the long run (50–100 years) we expect to see democratic and emancipation changes in these countries too, in the near future these changes will happen only very slowly, with possible setbacks due to noisy fluctuations that are caused by various uncertainties.
Our analysis shows that countries are caught in a democracy trap if they have low levels of GNI and/or education. We quantified the democracy trap condition, Equation (17), and visualized the rate of change as a phase portrait (Fig. 8). Countries near the trap condition experience slow increases, or even decreases, in democracy. It is difficult to say for sure what will happen in a particular country, but the phase portrait, combined with the stochastic simulations, shows that these traps are a real possibility. For example, simulations for Egypt showed that full democracy is a possibility within the next 20 years, but so too is a long period of autocracy (low levels of democracy indicator).
We also found evidence for emancipation traps. Emancipation may be seen as the cultural representation of democratization.12,34,37 The data suggests that emancipation can only increase if life expectancy is above a certain threshold. As emancipation depends on both life expectancy and democracy, higher values of democracy contribute to a country's faster move through the trap region. This is an example of how being caught in one trap, that is, lack of democracy, can lead to a country being caught in another, that is, lack of emancipation.
Indicators can interact in other ways too. For example, an interesting result is that high levels of emancipation, prior to democratization, may actually slow down movement out of the trap region for democracy. This is because high emancipative values tend to slow down economic growth. However, since high levels of democracy are required for emancipation to grow, this may not prove possible in practice.
Given these dynamics and accounting for uncertainty in future events, we made probabilistic predictions about future democracy trajectories of four exemplary countries: Egypt, Jordan, India, and Ukraine. The five-variable model gives relatively “optimistic” predictions for all four countries in terms of democratization. The predictions generally suggest that all four countries are likely to become largely democratic within the next 50 years, but the trajectories are likely to be characterized by temporary setbacks. At certain points the changes may be extremely slow and give the impression that the country is stuck.
Footnotes
Author Disclosure Statement
No competing financial interests exist.