Our society is increasingly relying on digitalized, aggregated opinions of individuals to make decisions (e.g., product recommendation based on collective ratings). One key requirement of harnessing this “wisdom of crowd” is the independency of individuals' opinions; yet, in real settings, collective opinions are rarely simple aggregations of independent minds. Recent experimental studies document that disclosing prior collective ratings distorts individuals' decision making as well as their perceptions of quality and value, highlighting a fundamental discrepancy between our perceived values from collective ratings and products' intrinsic values. Here we present a mechanistic framework to describe herding effects of prior collective ratings on subsequent individual decision making. Using large-scale longitudinal customer rating datasets, we find that our method successfully captures the dynamics of ratings growth, helping us separate social influence bias from inherent values. Leveraging the proposed framework, we quantitatively characterize the herding effects existing in product rating systems and promote strategies to untangle manipulations and social biases.
Introduction
In his seminal work,1 Sir Francis Galton introduced the famous notion of “one vote, one value,” believing that aggregating the opinions over a large population can successfully harness their collective wisdoms. Many studies have since shown that indeed collective opinions of a group are often closer to the truth than the answer of an individual to a question.2 Today, with the explosive growth of information, our decisions are increasingly relying on aggregated opinions contributed by others, from product or service recommendation to political elections. While one key prerequisite of harnessing the crowd wisdom is the independency of individuals' opinions,2 most, if not all, of the times, we are exposed to others' opinions before forming and expressing our own. For example, we go to the theater after checking reviews of the movie online, we download songs from the hit list, and we purchase products or go to restaurants after researching what others think about them. As a result, the markets do not simply aggregate preexisting individual preferences, but rather create an environment rich in social influence. Yet, compared with the well-known social influence caused by direct social interactions,3–6 such noninteractive social influence is more pervasive yet much less studied.
Recent studies offered convincing evidence that social influence exerts important but counterintuitive effects on collective judgment.7,8 Through carefully designed control experiments in different settings, these studies demonstrate that disclosing prior collective opinions distorts individuals' decision making as well as their perceptions of quality and value, creating herding that is irrational and pervasive, yet consequential to market outcome. Despite the significance of these results in experimental settings, there has been no quantitative framework to model social influence and its impact on social systems that are constantly evolving. Indeed, models on collective intelligence, from majority voting to collaborating filtering9–12 and crowdsourcing,13,14 all assume independent crowds, representing a critical gap between modeling frameworks and empirical insights.
Here we develop a mechanistic framework to model individual rating decisions as a function of a product's intrinsic quality and prior collective opinions. Using 28 million ratings spanning over 18 years on over 1.7 million products from Amazon15 as an exemplary case, we demonstrate that our method successfully captures the temporal trajectories of rating dynamics across different product categories, allowing us to separate social biases introduced by prior ratings from the true values inherent to products. We further show that our framework is not only effective in detecting the presence of social biases and gauging less biased values for any given product, but also accurately predicts the long-term cumulative growth of ratings through a scalable estimation model only based on early rating trajectories.
Leveraging the proposed framework, we quantitatively characterize what might be the herding effects existing in product rating systems and promote new strategies in untangling artificial manipulations and social biases. We believe that our framework is of fundamental importance to studies of social processes and provides significant insights toward design of platforms that aggregate individual opinions, from electoral polling to market analysis to product recommendation.
Phantom of Herding Effects
We start with an empirical study on the phenomena of herding effects using the Amazon rating datasets. Amazon adopts a discrete 1-to-K star ratings system with 1- and K-star, respectively, being the lowest and highest ratings (currently, K=5). Many online retailers have used similar systems. To be succinct yet reveal the important issues, we focus on ratings of products from four top-level categories: Books, Music, Movies & TV, and Electronics, which cover over 72% of Amazon's catalog. Table 1 summarizes the statistics of this dataset. These four categories demonstrate rather diverse statistics. For example, the entropy16 of each product's ratings is defined as
\documentclass{aastex}\usepackage{amsbsy}\usepackage{amsfonts}\usepackage{amssymb}\usepackage{bm}\usepackage{mathrsfs}\usepackage{pifont}\usepackage{stmaryrd}\usepackage{textcomp}\usepackage{portland, xspace}\usepackage{amsmath, amsxtra}\pagestyle{empty}\DeclareMathSizes{10}{9}{7}{6}\begin{document}
\begin{align*}- \sum \limits_ {k = 1} ^K \left[ \frac {N_k} {\sum\nolimits_ {\, k^ {\prime} = 1} ^K N_ {k^ {\prime}}} \log_2 \left( \frac {N_k} {\sum\nolimits_ {k^ {\prime} = 1} ^K N_ {k^ {\prime}}} \right) \right] \tag {1} \end{align*}
\end{document}
Summary of Amazon Customer Rating Dataset
Product category
Number of products
Number of ratings
Average ratings
Average entropy of ratings
Books
929,264
12,886,488
4.271
0.666
Music
556,814
6,396,350
4.410
0.555
Movies & TV
212,836
7,850,072
3.944
0.955
Electronics
82,067
1,241,778
3.791
0.824
Total
1,780,981
28,374,688
4.253
0.673
where Nk denotes the number of k-star ratings; as can be noticed in Table 1, the category-wise average entropy ranges from 0.56 to 0.96.
“TO GAUGE THE EXISTENCE OF HERDING EFFECTS IN COLLECTIVE RATING SYSTEMS, THE FIRST QUESTION WE INTEND TO ASK IS WHETHER THESE SEQUENCES EVOLVE OVER TIME OR THEY ARE STATIONARY ACROSS TIME.”
We consider a product's ratings as a temporally ordered sequence \documentclass{aastex}\usepackage{amsbsy}\usepackage{amsfonts}\usepackage{amssymb}\usepackage{bm}\usepackage{mathrsfs}\usepackage{pifont}\usepackage{stmaryrd}\usepackage{textcomp}\usepackage{portland, xspace}\usepackage{amsmath, amsxtra}\pagestyle{empty}\DeclareMathSizes{10}{9}{7}{6}\begin{document}
$$r_1 , r_2 , r_3 , \ldots$$
\end{document}, with \documentclass{aastex}\usepackage{amsbsy}\usepackage{amsfonts}\usepackage{amssymb}\usepackage{bm}\usepackage{mathrsfs}\usepackage{pifont}\usepackage{stmaryrd}\usepackage{textcomp}\usepackage{portland, xspace}\usepackage{amsmath, amsxtra}\pagestyle{empty}\DeclareMathSizes{10}{9}{7}{6}\begin{document}
$$r_i \in \{1 , 2 , \ldots , K \} $$
\end{document} being the ith rating and i being its sequence number. Also, we say that the ratings ahead of \documentclass{aastex}\usepackage{amsbsy}\usepackage{amsfonts}\usepackage{amssymb}\usepackage{bm}\usepackage{mathrsfs}\usepackage{pifont}\usepackage{stmaryrd}\usepackage{textcomp}\usepackage{portland, xspace}\usepackage{amsmath, amsxtra}\pagestyle{empty}\DeclareMathSizes{10}{9}{7}{6}\begin{document}
$$r_i \ ( r_1 , r_2 , r_3 , \ldots , r_{i - 1} )$$
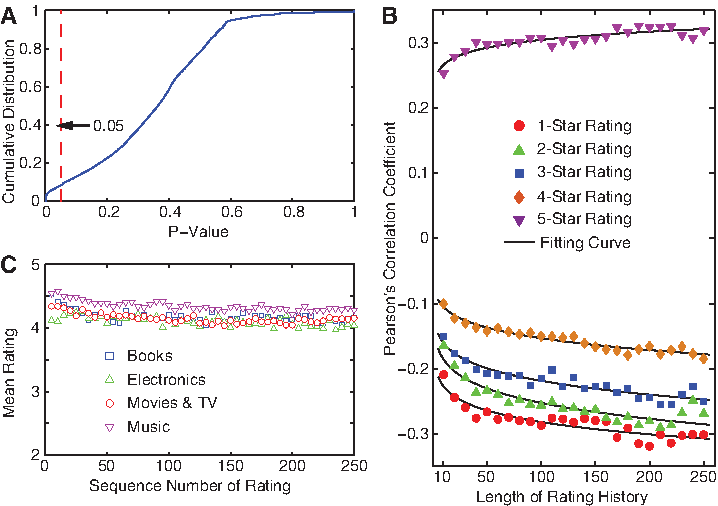
\end{document} form its history. To gauge the existence of herding effects in collective rating systems, the first question we intend to ask is whether these sequences evolve over time or they are stationary across time. We use Augmented Dickey–Fuller test,17 a standard stationary test for time series. Figure 1A depicts the cumulative distribution of p-values of all rating sequences in the dataset. It is noticed that, for a majority of sequences, the null hypothesis that a unit root exists cannot be rejected, indicating the nonstationarity nature of the time series.
(A) Cumulative distribution of p-values of Augment Dickey–Fuller test over all rating sequences in the dataset. (B) Average Pearson's correlation coefficient between fractions of k-star (k=1, 2, 3, 4, 5) ratings in history and the next 10 ratings with respect to length of ratings history. (C) Mean ratings at specific rating sequence number. Each point is the average over all ratings sequences in the same category.
Many profound factors might account for the nonstationarity of a ratings sequence. For example, the product's perception and popularity might change as new selections emerge; customers' inclinations might evolve over time10,11; early and late adopters of the product might have different rating tendencies. Among all these factors, we are particularly interested in the temporal dynamics attributed to history ratings.
To answer this question, we measure the dependency between history and future ratings. Specifically, let i be the sequence number of the latest rating. We consider the fractions of k-star ratings \documentclass{aastex}\usepackage{amsbsy}\usepackage{amsfonts}\usepackage{amssymb}\usepackage{bm}\usepackage{mathrsfs}\usepackage{pifont}\usepackage{stmaryrd}\usepackage{textcomp}\usepackage{portland, xspace}\usepackage{amsmath, amsxtra}\pagestyle{empty}\DeclareMathSizes{10}{9}{7}{6}\begin{document}
$$( k = 1 , 2 , \ldots , 5 )$$
\end{document} in history \documentclass{aastex}\usepackage{amsbsy}\usepackage{amsfonts}\usepackage{amssymb}\usepackage{bm}\usepackage{mathrsfs}\usepackage{pifont}\usepackage{stmaryrd}\usepackage{textcomp}\usepackage{portland, xspace}\usepackage{amsmath, amsxtra}\pagestyle{empty}\DeclareMathSizes{10}{9}{7}{6}\begin{document}
$$( r_1 , r_2 , r_3 , \ldots , r_i )$$
\end{document} as one set of variable, and the next m ratings \documentclass{aastex}\usepackage{amsbsy}\usepackage{amsfonts}\usepackage{amssymb}\usepackage{bm}\usepackage{mathrsfs}\usepackage{pifont}\usepackage{stmaryrd}\usepackage{textcomp}\usepackage{portland, xspace}\usepackage{amsmath, amsxtra}\pagestyle{empty}\DeclareMathSizes{10}{9}{7}{6}\begin{document}
$$( r_{i + 1} , r_{i + 2} , \ldots , r_{i + m} )$$
\end{document} as another set. We measure Pearson's correlation coefficient between these two sets of variables by considering all rating sequences in the dataset as samples. Figure 1B illustrates how the correlation coefficient for different k (average over next m=10 ratings) varies as the length of ratings history increases from 10 to 250. We find that different ratings in history exhibit fairly diverse patterns of correlations with future ratings. For example, 5-star ratings demonstrate strong positive correlation, while all other ratings are negatively correlated with future ratings. More interestingly, as indicated by the fitted curves, the magnitudes of both positive and negative correlations increase as the length of ratings history grows. To validate whether such increasing correlations are caused by the evolution of average ratings tendency, we further measure the mean rating at specific sequence number (Fig. 1C), finding no significant shift of average ratings over time across all four different categories.
These observations demonstrate that ratings generation is not an independent, homogeneous process, supporting our hypothesis that rating systems do not simply aggregate individual opinions, but create an environment that influences subsequent ratings in a systematic manner.
While our results are in good agreement with recent experimental findings on social influence, suggesting that disclosing prior ratings by other customers exerts pervasive and consequential herding effects on subsequent individual opinions, further experiments are needed to conclude the extent to which the observed influence can be attributed to herding. Yet, as we show next, rating trajectories follow widely reproducible dynamical patterns, as such systematic influence can be effectively learned and detected from early rating histories, which can be used to predict subsequent ratings.
Dynamics of Ratings Growth
We start by identifying two fundamental factors that drive rating trajectories.
“A PRODUCT'S VALUE DEPENDS ON SO MANY INTANGIBLE AND SUBJECTIVE DIMENSIONS THAT IT IS IMPOSSIBLE TO QUANTIFY THEM ALL.”
Intrinsic quality pertains to a product's true value. A product's value depends on so many intangible and subjective dimensions that it is impossible to quantify them all. Here, we view intrinsic quality as a collective measure capturing the product's value perceived by the customer community when each customer expresses his/her opinion independently. In a discrete 1-to-K star ratings system, we can represent a product's intrinsic quality as a multinomial distribution \documentclass{aastex}\usepackage{amsbsy}\usepackage{amsfonts}\usepackage{amssymb}\usepackage{bm}\usepackage{mathrsfs}\usepackage{pifont}\usepackage{stmaryrd}\usepackage{textcomp}\usepackage{portland, xspace}\usepackage{amsmath, amsxtra}\pagestyle{empty}\DeclareMathSizes{10}{9}{7}{6}\begin{document}
$$g_1 , g_2 , \ldots , g_K \left( \sum \nolimits_{k = 1}^K g_k = 1 \right)$$
\end{document} over 1- to K-star, with gk being the probability density at k-star. For mathematical convenience, we parameterize this multinomial distribution with K variables \documentclass{aastex}\usepackage{amsbsy}\usepackage{amsfonts}\usepackage{amssymb}\usepackage{bm}\usepackage{mathrsfs}\usepackage{pifont}\usepackage{stmaryrd}\usepackage{textcomp}\usepackage{portland, xspace}\usepackage{amsmath, amsxtra}\pagestyle{empty}\DeclareMathSizes{10}{9}{7}{6}\begin{document}
$$\mu_1 , \mu_2 , \ldots , \mu_K$$
\end{document}, which satisfy gk α exp (μk) for \documentclass{aastex}\usepackage{amsbsy}\usepackage{amsfonts}\usepackage{amssymb}\usepackage{bm}\usepackage{mathrsfs}\usepackage{pifont}\usepackage{stmaryrd}\usepackage{textcomp}\usepackage{portland, xspace}\usepackage{amsmath, amsxtra}\pagestyle{empty}\DeclareMathSizes{10}{9}{7}{6}\begin{document}
$$k \in \{1 , 2 , \ldots , K \} $$
\end{document}.
Herding effects influence ratings generation in a more intricate manner. Different prior ratings can excite, suppress, or have negligible effects on the generation of a new rating. Given a ratings sequence \documentclass{aastex}\usepackage{amsbsy}\usepackage{amsfonts}\usepackage{amssymb}\usepackage{bm}\usepackage{mathrsfs}\usepackage{pifont}\usepackage{stmaryrd}\usepackage{textcomp}\usepackage{portland, xspace}\usepackage{amsmath, amsxtra}\pagestyle{empty}\DeclareMathSizes{10}{9}{7}{6}\begin{document}
$$r_1 , r_2 , r_3 , \ldots ,$$
\end{document} the first (i – 1) ratings form the history of the ith rating ri, which we summarize as a vector \documentclass{aastex}\usepackage{amsbsy}\usepackage{amsfonts}\usepackage{amssymb}\usepackage{bm}\usepackage{mathrsfs}\usepackage{pifont}\usepackage{stmaryrd}\usepackage{textcomp}\usepackage{portland, xspace}\usepackage{amsmath, amsxtra}\pagestyle{empty}\DeclareMathSizes{10}{9}{7}{6}\begin{document}
$$\textbf{\textit{x}}_i = [ x_{i , 1} , x_{i , 2} , \ldots , x_{i , K} ] ^T$$
\end{document}, with xi,k being the number of k-star ratings among these (i – 1) ratings. This setting is motivated by the observation that Amazon displays the counts of different ratings in each product's review section. We use a general linear model to capture all possible effects xi can exert on ri (a more general model18 may further account for the dynamically varying strength of herding effects). We use a vector \documentclass{aastex}\usepackage{amsbsy}\usepackage{amsfonts}\usepackage{amssymb}\usepackage{bm}\usepackage{mathrsfs}\usepackage{pifont}\usepackage{stmaryrd}\usepackage{textcomp}\usepackage{portland, xspace}\usepackage{amsmath, amsxtra}\pagestyle{empty}\DeclareMathSizes{10}{9}{7}{6}\begin{document}
$${\bold{\theta}}_k \in {\mathbb R}^K$$
\end{document} for \documentclass{aastex}\usepackage{amsbsy}\usepackage{amsfonts}\usepackage{amssymb}\usepackage{bm}\usepackage{mathrsfs}\usepackage{pifont}\usepackage{stmaryrd}\usepackage{textcomp}\usepackage{portland, xspace}\usepackage{amsmath, amsxtra}\pagestyle{empty}\DeclareMathSizes{10}{9}{7}{6}\begin{document}
$$k \in \{1 , 2 , \ldots , K \} $$
\end{document} to weigh the different components of ratings history. Without loss of generality, assume ri is a k-star rating. The influence of ratings history xi on the generation of ri is given by \documentclass{aastex}\usepackage{amsbsy}\usepackage{amsfonts}\usepackage{amssymb}\usepackage{bm}\usepackage{mathrsfs}\usepackage{pifont}\usepackage{stmaryrd}\usepackage{textcomp}\usepackage{portland, xspace}\usepackage{amsmath, amsxtra}\pagestyle{empty}\DeclareMathSizes{10}{9}{7}{6}\begin{document}
$$h_k ( \textbf{\textit{x}}_i ) \propto \exp \ ( {\bold{\theta}}_k^T \textbf{\textit{x}}_i )$$
\end{document}. More specifically, let θk,k′ denote the k′th component of \documentclass{aastex}\usepackage{amsbsy}\usepackage{amsfonts}\usepackage{amssymb}\usepackage{bm}\usepackage{mathrsfs}\usepackage{pifont}\usepackage{stmaryrd}\usepackage{textcomp}\usepackage{portland, xspace}\usepackage{amsmath, amsxtra}\pagestyle{empty}\DeclareMathSizes{10}{9}{7}{6}\begin{document}
$${\bold{\theta}}_k$$
\end{document}, indicating how prior k′-star ratings influence the likelihood of a new rating being k-star. When θk,k′>0, then preceding k′-star ratings excite the generation of new k-star rating ri; when θk,k′<0, prior k′-star ratings suppress the generation of ri; while if θk,k′=0, prior k′-star ratings have negligible effects on the occurrence of ri.
Combining these two factors, we can write the probability that the ith rating ri is k-star conditional on its ratings history xi as follows:
\documentclass{aastex}\usepackage{amsbsy}\usepackage{amsfonts}\usepackage{amssymb}\usepackage{bm}\usepackage{mathrsfs}\usepackage{pifont}\usepackage{stmaryrd}\usepackage{textcomp}\usepackage{portland, xspace}\usepackage{amsmath, amsxtra}\pagestyle{empty}\DeclareMathSizes{10}{9}{7}{6}\begin{document}
\begin{align*}{\rm Pr} ( r_i = k \mid \textbf{\textit{x}}_i ) = g_k h_k ( \textbf{\textit{x}}_i ) \propto \exp ( \mu_k + {\bold{\theta}}_k^T \textbf{\textit{x}}_i ) \tag{2}\end{align*}
\end{document}
with the constraint that \documentclass{aastex}\usepackage{amsbsy}\usepackage{amsfonts}\usepackage{amssymb}\usepackage{bm}\usepackage{mathrsfs}\usepackage{pifont}\usepackage{stmaryrd}\usepackage{textcomp}\usepackage{portland, xspace}\usepackage{amsmath, amsxtra}\pagestyle{empty}\DeclareMathSizes{10}{9}{7}{6}\begin{document}
$$\sum \nolimits_{k = 1}^K {\rm Pr} ( r_i = k \mid \textbf{\textit{x}}_i ) = 1$$
\end{document}.
It is noted that this model does not include the effects of time-specific or user-specific rating tendency for two main reasons. First, no significant shift of average rating tendency across time is observed in the current dataset (Fig. 1C). Second, we view intrinsic quality as a collective measure of a product's perceived value irrespective of individual customers' rating tendency.
In this model, both \documentclass{aastex}\usepackage{amsbsy}\usepackage{amsfonts}\usepackage{amssymb}\usepackage{bm}\usepackage{mathrsfs}\usepackage{pifont}\usepackage{stmaryrd}\usepackage{textcomp}\usepackage{portland, xspace}\usepackage{amsmath, amsxtra}\pagestyle{empty}\DeclareMathSizes{10}{9}{7}{6}\begin{document}
$$\{ \mu_k \} _{k = 1}^K$$
\end{document} and \documentclass{aastex}\usepackage{amsbsy}\usepackage{amsfonts}\usepackage{amssymb}\usepackage{bm}\usepackage{mathrsfs}\usepackage{pifont}\usepackage{stmaryrd}\usepackage{textcomp}\usepackage{portland, xspace}\usepackage{amsmath, amsxtra}\pagestyle{empty}\DeclareMathSizes{10}{9}{7}{6}\begin{document}
$$\{{\bold{\theta}}_k \} _{k = 1}^K$$
\end{document} are variables, which we estimate from available training data following the maximum likelihood principle (see section Inference of Model Parameters in Supplementary Data, available online at www.liebertpub.com/big). The straightforward solution to estimating parameters using ratings of multiple products is to directly fit the model parameters to ratings of each product individually following the procedure sketched in the section Inference of Model Parameters in Supplementary Data. However, this can easily lead to overfitting. Instead, we use ratings of all products in each category to train category-level parameters \documentclass{aastex}\usepackage{amsbsy}\usepackage{amsfonts}\usepackage{amssymb}\usepackage{bm}\usepackage{mathrsfs}\usepackage{pifont}\usepackage{stmaryrd}\usepackage{textcomp}\usepackage{portland, xspace}\usepackage{amsmath, amsxtra}\pagestyle{empty}\DeclareMathSizes{10}{9}{7}{6}\begin{document}
$$\{ \theta_k \} _{k = 1}^K$$
\end{document}. Then, for each product, we fix \documentclass{aastex}\usepackage{amsbsy}\usepackage{amsfonts}\usepackage{amssymb}\usepackage{bm}\usepackage{mathrsfs}\usepackage{pifont}\usepackage{stmaryrd}\usepackage{textcomp}\usepackage{portland, xspace}\usepackage{amsmath, amsxtra}\pagestyle{empty}\DeclareMathSizes{10}{9}{7}{6}\begin{document}
$$\{ \theta_k \} _{k = 1}^K$$
\end{document} and focus on learning product-level parameter \documentclass{aastex}\usepackage{amsbsy}\usepackage{amsfonts}\usepackage{amssymb}\usepackage{bm}\usepackage{mathrsfs}\usepackage{pifont}\usepackage{stmaryrd}\usepackage{textcomp}\usepackage{portland, xspace}\usepackage{amsmath, amsxtra}\pagestyle{empty}\DeclareMathSizes{10}{9}{7}{6}\begin{document}
$$\{ \mu_k \} _{k = 1}^K$$
\end{document}. The optimization procedure is similar to the section Inference of Model Parameters in Supplementary Data, except that at every iteration we need to update \documentclass{aastex}\usepackage{amsbsy}\usepackage{amsfonts}\usepackage{amssymb}\usepackage{bm}\usepackage{mathrsfs}\usepackage{pifont}\usepackage{stmaryrd}\usepackage{textcomp}\usepackage{portland, xspace}\usepackage{amsmath, amsxtra}\pagestyle{empty}\DeclareMathSizes{10}{9}{7}{6}\begin{document}
$$\{ \mu_k \} _{k = 1}^K$$
\end{document} for each product, and update \documentclass{aastex}\usepackage{amsbsy}\usepackage{amsfonts}\usepackage{amssymb}\usepackage{bm}\usepackage{mathrsfs}\usepackage{pifont}\usepackage{stmaryrd}\usepackage{textcomp}\usepackage{portland, xspace}\usepackage{amsmath, amsxtra}\pagestyle{empty}\DeclareMathSizes{10}{9}{7}{6}\begin{document}
$$\{ \theta_k \} _{k = 1}^K$$
\end{document} for all products in each category.
To test the validity of the proposed model, we apply it to predict a product's future ratings based on its current ratings history. Recall that xi represents the summary of the first (i – 1) ratings, which also corresponds to the history of the ith rating. The transition probability from xi to xi+1 is described by the rule below (ek is a 1-of-K vector with the kth element being 1 and the rest elements being 0):
\documentclass{aastex}\usepackage{amsbsy}\usepackage{amsfonts}\usepackage{amssymb}\usepackage{bm}\usepackage{mathrsfs}\usepackage{pifont}\usepackage{stmaryrd}\usepackage{textcomp}\usepackage{portland, xspace}\usepackage{amsmath, amsxtra}\pagestyle{empty}\DeclareMathSizes{10}{9}{7}{6}\begin{document}
\begin{align*}{\rm Pr} ( \textbf{\textit{x}}_{i + 1} = \textbf{\textit{x}}_i ) + \textbf{\textit{e}}_k \mid \textbf{\textit{x}}_i ) \propto \exp ( \mu_k + {\bold{\theta}}_k^T \textbf{\textit{x}}_i ) \tag{3}\end{align*}
\end{document}
This transition rule essentially specifies a nonstationary Markov chain in which both the state space and the transition probability change from step to step. Given the current ratings summary xc, we apply Monte Carlo methods19 to predict the ratings summary xc+t after including the next t new ratings (see the section Prediction Model in Supplementary Data).
We partitioned each ratings sequence into two subseries as the training set and testing set, respectively. In addition to the proposed model, for comparison purpose, we introduce a baseline model that predicates future ratings using the average of past ratings (moving average). We measure prediction accuracy using root mean square error (RMSE), which is defined as \documentclass{aastex}\usepackage{amsbsy}\usepackage{amsfonts}\usepackage{amssymb}\usepackage{bm}\usepackage{mathrsfs}\usepackage{pifont}\usepackage{stmaryrd}\usepackage{textcomp}\usepackage{portland, xspace}\usepackage{amsmath, amsxtra}\pagestyle{empty}\DeclareMathSizes{10}{9}{7}{6}\begin{document}
$$\sqrt{\sum \nolimits_{r \in {\rm testcase}} ( r - \tilde{r} ) ^2 / \mid {\rm testcase} \mid}$$
\end{document}, where r and \documentclass{aastex}\usepackage{amsbsy}\usepackage{amsfonts}\usepackage{amssymb}\usepackage{bm}\usepackage{mathrsfs}\usepackage{pifont}\usepackage{stmaryrd}\usepackage{textcomp}\usepackage{portland, xspace}\usepackage{amsmath, amsxtra}\pagestyle{empty}\DeclareMathSizes{10}{9}{7}{6}\begin{document}
$$\tilde{r}$$
\end{document}, respectively, represent the actual and predicated rating. In the experiments, we varied the length of training subseries (as the fraction of each ratings sequence) and measured the prediction accuracy of the rest ratings by both models.
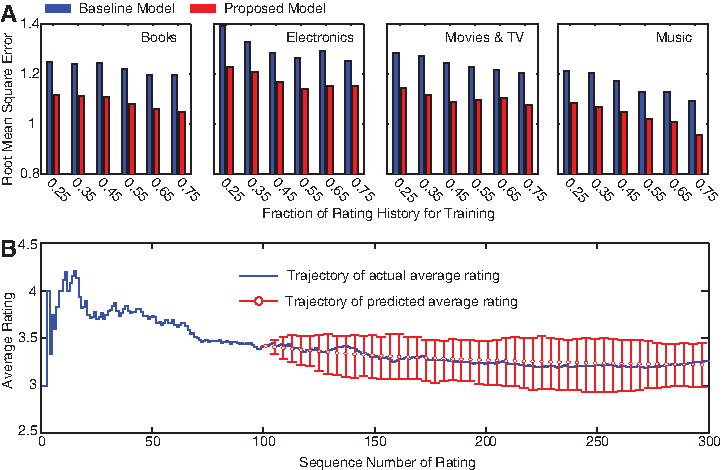
Across all product categories, the proposed model significantly outperforms the baseline model in predicting future ratings growth (Fig. 2A), even when only limited data (e.g., 25% of ratings history) is available for training. This is attributed to two main reasons. First, our model definition accounts for a wide range of dynamical patterns of herding effects (Eq. 2). Second, the proposed model leverages the rating data of all products in a same category to fit category-level parameters θ, which effectively prevents overfitting. In contrast, the baseline model relies solely on the overall statistics of ratings history of each product, which might have not emerged when only limited training data is available. It is also noticed that the prediction performance varies slightly with product category, indicating varying unpredictability across different product categories. To visualize the predication of our proposed model, the predicated average rating growth trajectory for a randomly selected product is illustrated in Figure 2B, in contrast to its real ratings growth trajectory, indicating a close match. Overall, the verified predictive power of the proposed model indicates that it faithfully captures the dynamics of ratings growth.
(A) Prediction accuracy (root mean square error, RMSE) of proposed model and baseline model with respect to fraction of ratings history used for training in four product categories. (B) Comparison of actual and predicted ratings growth trajectories. Based on the first 100 ratings of a product from Movies & TV, the proposed model predicts the growth of the next 200 ratings.
Applications
The proposed model enables us to answer a set of fundamental questions.
The first question is: “What do the herding effects look like?” We conducted a quantitative study on the herding effects observable in real customer ratings data by fitting the model to product ratings in each category and examining parameters \documentclass{aastex}\usepackage{amsbsy}\usepackage{amsfonts}\usepackage{amssymb}\usepackage{bm}\usepackage{mathrsfs}\usepackage{pifont}\usepackage{stmaryrd}\usepackage{textcomp}\usepackage{portland, xspace}\usepackage{amsmath, amsxtra}\pagestyle{empty}\DeclareMathSizes{10}{9}{7}{6}\begin{document}
$$\{{\bold{\theta}}_k \} _{k = 1}^K$$
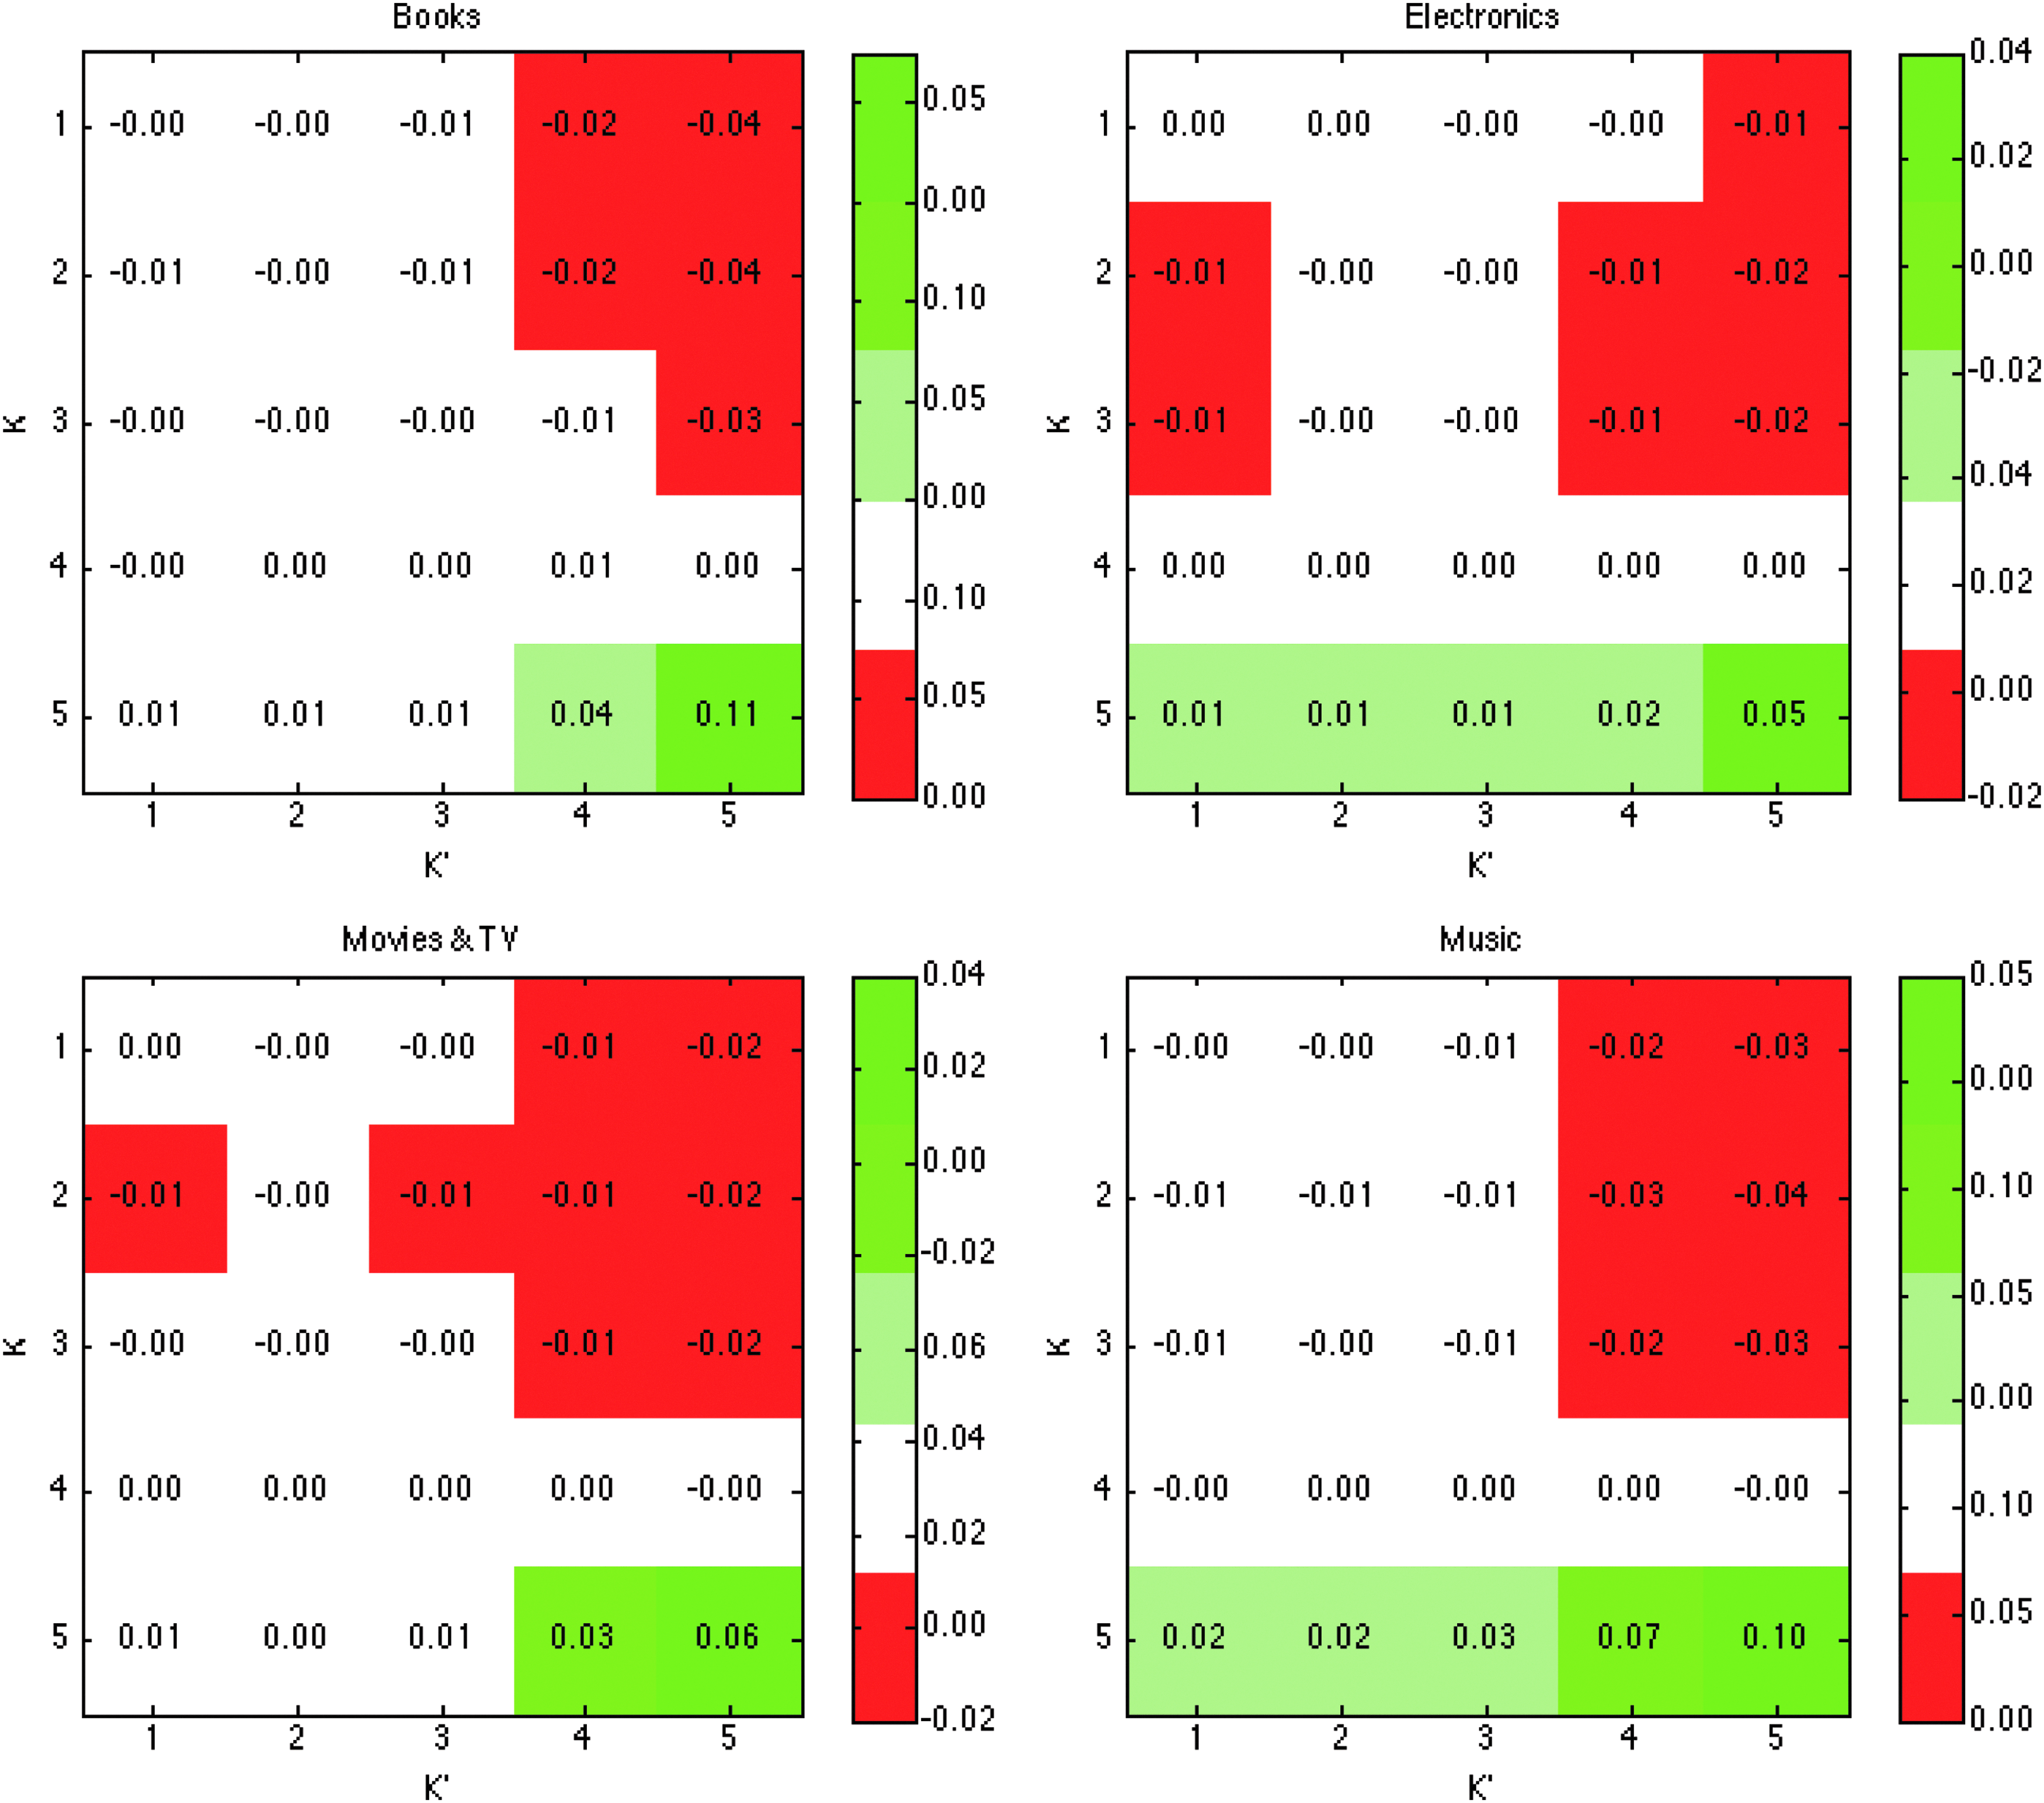
\end{document}. Recall that these parameters describe the mutual influence between ratings at different levels (Eq. 2), specifically, with θk,k′ specifying how prior k′-star ratings may positively excite or negatively suppress the generation of new k-star ratings. While each product category has its unique traits, a set of common patterns is observed (Fig. 3). First, high ratings (e.g., 5-star) tend to stimulate new high ratings while suppressing the generation of low ratings. Second, high ratings are more impactful than low ratings in influencing other ratings. This is consistent with the observations that we have discussed in Figure 1B. These observations are also consistent with the finding of asymmetric herding effects of positive and negative prior opinions in other domains.7
Characteristics of category-level parameters θ. Here θk,k′ measures how prior k′-star ratings influence the likelihood of a future rating being k-star, positive and negative value indicating exciting and suppressing effects, respectively.
The second question is: “What is the intrinsic rating pertaining to the true quality of a product if we can factor out the herding effects?” Recall that the model (Eq. 2) comprises two additive components, namely, the intrinsic quality (\documentclass{aastex}\usepackage{amsbsy}\usepackage{amsfonts}\usepackage{amssymb}\usepackage{bm}\usepackage{mathrsfs}\usepackage{pifont}\usepackage{stmaryrd}\usepackage{textcomp}\usepackage{portland, xspace}\usepackage{amsmath, amsxtra}\pagestyle{empty}\DeclareMathSizes{10}{9}{7}{6}\begin{document}
$$\{g_k \} _{k = 1}^K$$
\end{document}) and the herding effects (\documentclass{aastex}\usepackage{amsbsy}\usepackage{amsfonts}\usepackage{amssymb}\usepackage{bm}\usepackage{mathrsfs}\usepackage{pifont}\usepackage{stmaryrd}\usepackage{textcomp}\usepackage{portland, xspace}\usepackage{amsmath, amsxtra}\pagestyle{empty}\DeclareMathSizes{10}{9}{7}{6}\begin{document}
$$\{h_k \} _{k = 1}^K$$
\end{document}). Therefore, we can “de-bias” the collective ratings by only keeping the component attributed by intrinsic quality \documentclass{aastex}\usepackage{amsbsy}\usepackage{amsfonts}\usepackage{amssymb}\usepackage{bm}\usepackage{mathrsfs}\usepackage{pifont}\usepackage{stmaryrd}\usepackage{textcomp}\usepackage{portland, xspace}\usepackage{amsmath, amsxtra}\pagestyle{empty}\DeclareMathSizes{10}{9}{7}{6}\begin{document}
$$\{g_k \} _{k = 1}^K$$
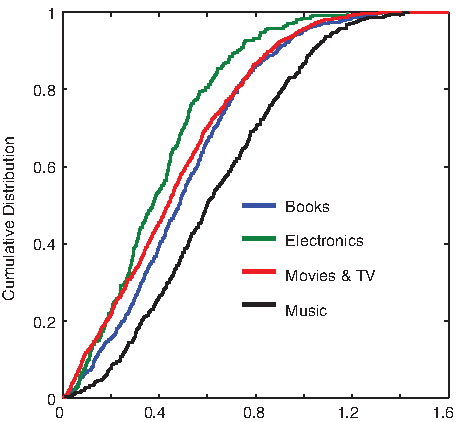
\end{document}. To understand the issue of how the simple aggregated (or extrinsic) rating of a product deviates from its true quality, we measured for each product the absolute difference between its intrinsic and extrinsic average ratings. Across all four categories, over 50% products have this difference above 0.5 (Fig. 4), indicating a significant discrepancy between our perceived values from collective ratings and products' true values.
Cumulative distribution of products with respect to differences between intrinsic and extrinsic average ratings in four categories of Amazon customer ratings data.
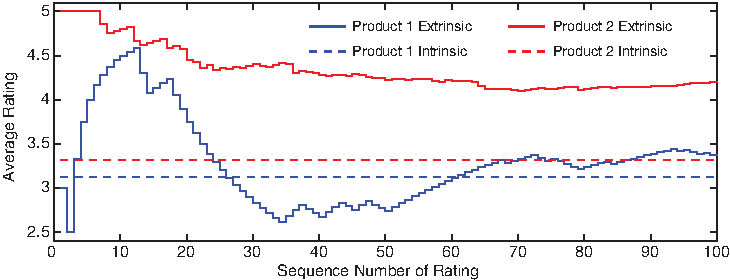
Endowed with the capability of exposing products' intrinsic ratings, we can also compare the true quality of two products without being misguided by their extrinsic ratings. We randomly selected two sample products, with significantly different extrinsic ratings (with difference around 0.9) (Fig. 5). Their intrinsic ratings are indeed fairly similar (with difference less than 0.2) after factoring out the herding effects. The reason is explained by the fact that the first sample product experiences a sequence of low ratings at the early stage of its ratings history, which considerably changes the dynamics of its ratings growth. The proposed model enables us to maximally de-bias this type of influence caused by the herding effects.
Two sample products (product 1 from Music and product 2 from Books) with similar intrinsic ratings but with different dynamics of ratings growth, leading to significantly distinct extrinsic ratings.
“THE MARKOVIAN NATURE OF THE PROPOSED MODEL ENABLES US TO EASILY PERFORM SUCH WHAT-IF ANALYSIS.”
The third question is: “Given a product's current ratings, how would its future ratings be herded if we exerted certain artificial manipulation?” The Markovian nature of the proposed model enables us to easily perform such what-if analysis. Specifically, given the current ratings summary xc, we may arbitrarily change xc to another summary \documentclass{aastex}\usepackage{amsbsy}\usepackage{amsfonts}\usepackage{amssymb}\usepackage{bm}\usepackage{mathrsfs}\usepackage{pifont}\usepackage{stmaryrd}\usepackage{textcomp}\usepackage{portland, xspace}\usepackage{amsmath, amsxtra}\pagestyle{empty}\DeclareMathSizes{10}{9}{7}{6}\begin{document}
$$\textbf{\textit{x}}_c^{\prime}$$
\end{document} to reflect any artificial conditions we wish to inject. Staring from this new state \documentclass{aastex}\usepackage{amsbsy}\usepackage{amsfonts}\usepackage{amssymb}\usepackage{bm}\usepackage{mathrsfs}\usepackage{pifont}\usepackage{stmaryrd}\usepackage{textcomp}\usepackage{portland, xspace}\usepackage{amsmath, amsxtra}\pagestyle{empty}\DeclareMathSizes{10}{9}{7}{6}\begin{document}
$$\textbf{\textit{x}}_c^{\prime}$$
\end{document} and applying the prediction method (Eq. 3), we can then gauge the consequences of the injected conditions.
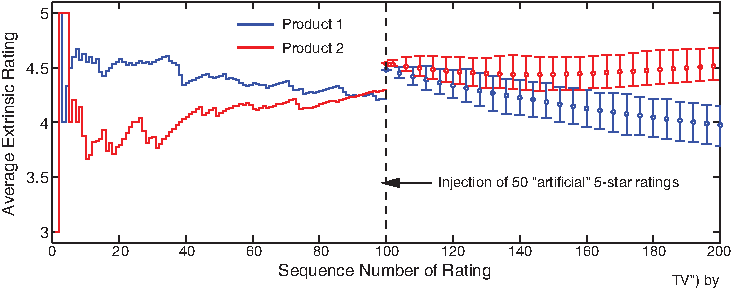
Such predictive analysis is valuable for a range of applications, including market profitability estimation, budgeted advertising, and fraudulent manipulation detection. For example, before deciding whether to invest in a promotion campaign for a product, market analysts may wish to estimate the long-term influence of a short burst of high ratings due to the promotion. We randomly selected two sample products, respectively, from the categories of Music and Movies & TV, with fairly close average extrinsic ratings thus far. Now, assuming that the promotion takes effect, we injected 50 artificial 5-star ratings into their rating histories. The prediction by the proposed model tells us (Fig. 6) that, while both products experience similar short-term bursts in their popularity, in the long run the promotion has much longer-lasting influence on the sample product from the category of Movies & TV. This provides valuable intelligence for the decision making of market analysts.
What-if analysis of two sample products (product 1 from Music and product 2 from Movies & TV) by artificially injecting fifty 5-star ratings, leading to distinct long-term impacts.
Additional Related Work
There have been a number of interesting studies into the semantics of collective opinions, such as analyzing the text and social aspects of product reviews. While they are useful for review spam detection,20 customer sentiment analysis,21,22 product recommendation,23 and more, insights extracted from semantic features are, however, not mechanistic, and hence not capable of projecting the full rating trajectories. Nevertheless, these studies are complementary to our work, in a sense that the useful semantic features learned can be integrated into our model in the form of prior belief of model parameters. Another line of research that is relevant to this work is collaborative filtering (CF),9–12 a technique used by recommender systems to make prediction (filtering) about a customer's interests by collecting preferences from many customers (collaborating). The underlying assumption is that a customer often gets the best recommendations from customers with similar preferences (as reflected in their past selections). CF is a customer-centric method, attempting to model each customer's specific preferences. Our work differs in that it is a product-centric method, attempting to statistically capture the temporal dynamics of each product's ratings growth without knowledge about whom will give future ratings. Nevertheless, incorporating available text-, social-, or customer-specific information into the ratings growth model would be a promising future direction.
Conclusions
In this article we presented a mechanistic modeling framework for the growth dynamics of online product ratings, which explicitly accounts for the herding effects of prior customer opinions. Using Amazon customer ratings datasets, we demonstrated its efficacy in capturing the dynamics of ratings growth, quantifying social influence, and de-biasing collective ratings, and further performing what-if analysis against artificial manipulations. Leveraging the proposed framework, we quantitatively characterized the herding effects existing in product rating systems and promoted strategies to untangle artificial manipulations and social biases. This framework is not limited to product rating systems. Indeed, its mechanistic nature makes it also applicable for modeling the herding effects in other domains where social influence plays a role, from crowdsourcing and recommender systems to electoral polling.
Footnotes
Acknowledgment
This research was sponsored by the U.S. Army Research Laboratory and the U.K. Ministry of Defense and was accomplished under Agreement Number W911NF-06-3-0001. The views and conclusions contained in this document are those of the authors and should not be interpreted as representing the official policies, either expressed or implied, of the U.S. Army Research Laboratory, the U.S. Government, the U.K. Ministry of Defense or the U.K. Government. The U.S. and U.K. Governments are authorized to reproduce and distribute reprints for Government purposes notwithstanding any copyright notation hereon.
Author Disclosure Statement
No competing financial interests exist.
References
1.
GaltonF. One vote, one value. Nature, 1907; 75:414.
2.
SurowieckiJ. The Wisdom of Crowds. New York: Anchor, 2005.
3.
JuddS, KearnsM, VorobeychikY. Behavioral dynamics and influence in networked coloring and consensus. Proc Natl Acad Sci USA, 2010; 107:14978–14982.
4.
LorenzJ, RauhutH, SchweitzerF, et al.How social influence can undermine the wisdom of crowd effect. Proc Natl Acad Sci USA, 1011; 108:9020–9025.
5.
WangT, SrivatsaM, AgrawalD, et al.Microscopic social influence. In: GhoshJ, LiuH, DavidsonI, DomeniconiC, KamathC, (eds.), Proceedings of 2012 SIAM International Conference on Data Mining. Philadelphia, PA: SIAM, 2012, pp. 129–140.
6.
DasA, GollapudiS, PanigrahyR, et al.Debiasing social wisdom. In: DhillonIS, KorenY, GhaniR, SenatorTE, BradleyP, ParekhR, HeJ, GrossmanRL, UthurusamyR (eds.), Proceedings of 19th ACM SIGKDD Conference on Data Mining and Knowledge Discovery. New York: ACM, 2013, pp. 500–508.
7.
MuchnikL, AralS, TaylorSJ. Social influence bias: A randomized experiment. Science, 2013; 341:647–651.
8.
SalganikMJ, DoddsPS, WattsDJ. Experimental study of inequality and unpredictability in an artificial cultural market. Science, 2006; 311:854–856.
9.
DasA, DatarM, GargA, et al.Google News personalization: Scalable online collaborative filtering. In: WilliamsonCL, ZurkoME, Patel-SchneiderPF, ShenoyPJ (eds.), Proceedings of the 16th International Conference on World Wide Web. New York: ACM, 2007, pp. 271–280.
10.
KorenY. Collaborative filtering with temporal dynamics. In: ElderIV JF, Fogelman-SouliéF, FlachPA, ZakiMJ (eds.), Proceedings of the 15th ACM SIGKDD Conference on Data Mining and Knowledge Discovery. New York: ACM, 2009, pp. 447–456.
KorenY. Factor in the neighbors: Scalable and accurate collaborative filtering. ACM Trans Knowl Discov Data, 2010; 4:1–24.
13.
ShengV, ProvostF, IpeirotisP. Get another label? Improving data quality and data mining using multiple, noisy labelers. In: LiY, LiuB, SarawagiS (eds.), Proceedings of the 14th ACM SIGKDD Conference on Data Mining and Knowledge Discovery. New York: ACM, 2008, pp. 614–622.
14.
ZhouD, PlattJ, BasuS, et al.Learning from the wisdom of crowds by minimax entropy. In: BartlettPL, PereiraFCN, BurgesCJC, BottouL, WeinbergerKQ (eds.), Proceedings of Neural Information Processing Systems. Curran Associates, Inc., 2012, pp. 2204–2212.
15.
McAuleyJ, LeskovecJ. Hidden factors and hidden topics: Understanding rating dimensions with review text. In: YangQ, KingI, LiQ, PuP, KarypisG (eds.), Proceedings of 7th ACM Recommender Systems Conference. New York: ACM, 2013, pp. 165–172.
16.
CoverTM, ThomasJA. Elements of Information Theory (Wiley Series in Telecommunications and Signal Processing). New York: Wiley-Interscience, 2006.
17.
FullerWA. Introduction to Statistical Time Series. New York: John Wiley and Sons, 1976.
18.
WangT, WangD, WangF. Quantifying herding effects in crowd wisdom. In: MacskassySA, PerlichC, LeskovecJ, WangW, GhaniR (eds.), Proceedings of 20th ACM SIGKDD Conference on Data Mining and Knowledge Discovery. New York: ACM, 2014, 1087–1096.
19.
RobertCP, CasellaG. Monte Carlo Statistical Methods (Springer Texts in Statistics). Secaucus: Springer–Verlag New York, Inc., 2005.
20.
SunH, MoralesA, YanX. Synthetic review spamming and defense. In: DhillonIS, KorenY, GhaniR, SenatorTE, BradleyP, ParekhR, HeJ, GrossmanRL, UthurusamyR (eds.), Proceedings of 19th ACM SIGKDD Conference on Data Mining and Knowledge Discovery. New York: ACM, 2013, pp. 1088–1096.
21.
GanuG, ElhadadN, MarianA. Beyond the stars: Improving rating predictions using review text content. In: Proceedings of the 12th International Workshop on the Web and Database, 2009.
22.
GanuG, KakodkarY, MarianA. Improving the quality of predictions using textual information in online user reviews. Inf Syst, 2013; 38:1–15.
23.
HuM, LiuB. Mining and summarizing customer reviews. In: KimW, KohaviR, GehrkeJ, DuMouchelW (eds.), Proceedings of the 10th ACM SIGKDD International Conference on Knowledge Discovery and Data Mining. New York: ACM, 2004, pp. 168–177.
24.
BishopCM. Pattern Recognition and Machine Learning (Information Science and Statistics). Secaucus: Springer–Verlag New York, Inc., 2006.
25.
DawidAP, SkeneAM. Maximum likelihood estimation of observer error-rates using the em algorithm. J R Stat Soc Ser C Appl Stat, 1979; 28:20–28.
Supplementary Material
Please find the following supplemental material available below.
For Open Access articles published under a Creative Commons License, all supplemental material carries the same license as the article it is associated with.
For non-Open Access articles published, all supplemental material carries a non-exclusive license, and permission requests for re-use of supplemental material or any part of supplemental material shall be sent directly to the copyright owner as specified in the copyright notice associated with the article.