
Abstract
Abstract
TV audience measurement involves estimating the number of viewers tuned into a TV show at any given time as well as their demographics. First introduced shortly after commercial television broadcasting began in the late 1940s, audience measurement allowed the business of television to flourish by offering networks a way to quantify the monetary value of TV audiences for advertisers, who pay for the estimated number of eyeballs watching during commercials. The first measurement techniques suffered from multiple limitations because reliable, large-scale data were costly to acquire. Yet despite these limitations, measurement standards remained largely unchanged for decades until devices such as cable boxes, video-on-demand boxes, and cell phones, as well as web apps, Internet browser clicks, web queries, and social media activity, resulted in an explosion of digitally available data. TV viewers now leave digital traces that can be used to track almost every aspect of their daily lives, allowing the potential for large-scale aggregation across data sources for individual users and groups and enabling the tracking of more people on more dimensions for more shows. Data are now more comprehensive, available in real time, and cheaper to acquire, enabling accurate and fine-grained TV audience measurement. In this article, I discuss the evolution of audience measurement and what the recent data explosion means for the TV industry and academic research.
Introduction
T
The key takeaways of the article are as follows:
1. Audience measurement remained largely the same throughout most of its history and change has been slow to arrive. This sluggish progress was due primarily to a lack of new types of data with which to work. In short, there was little momentum for the development of audience measurement because the same, stagnant data categories remained available year after year. 2. Recently, audience measurement has changed drastically because of new methods of collecting more detailed data from a wide variety of sources. Audience measurement now includes a wide range of techniques created around new types of data that have rapidly become available in recent years. The new measurement techniques are a direct result of new types of data from a variety of sources, including set-top boxes, video-on-demand (VOD), and social media. While there are massive amounts of data available on TV viewers, aggregating this data from a multitude of sources and, at the same time, linking it to viewers has proven to be a huge challenge. 3. These newly available, abundant data on individuals hold immense potential, but there are many technical barriers to large-scale individualized measurement and the obvious outcomes of better measurement and onscreen personalized, targeted advertisement. Data must be linked through individual user IDs to create comprehensive pictures of behavior as determined from various sources (i.e., TV viewership, social media, and purchase data). Once this is possible, companies can build better behavioral models for households and individuals. We can then expect to see more efficient audience measurement models and, as a result, more effective, individualized advertising methods similar to that of online advertising. In terms of TV advertising, however, this prospect poses challenges not faced by traditional online advertising. First, video advertisements are costly to develop; second, cable networks have limited bandwidth, making personalization at the individual household level infeasible for TV in its current form.
History and Evolution
Birth (1950): phone surveys
Since the advent of commercial television in 1947, systems have been in place to measure what audiences are watching. 1 These ratings systems used methodologies developed to measure radio audiences, relying primarily on phone calls to the audience. Clark Hooper eliminated bias and problems with earlier random survey methods that had respondents recall what they had watched/listened to by developing a survey methodology that asked only what listeners were tuned into at the moment they received the call, plus demographic information about who was listening. 2 Known as telephone coincidentals, 1 these calls created many of the standard measurements used by television ratings companies such as audience shares. The technique had been considerably refined by 1950 when Nielsen acquired Hooper's business and began its audience monitoring of national television with the Nielsen Television Index. 1
Infancy (1953): meters and diaries
Nielsen primarily used metering devices to measure audiences, another technique developed for tracking radio listeners. These audimeters measured what was being viewed on a television set and when. This eliminated dependence on often unreliable and costly phone surveys, 3 but the system only collected information as to what was on the TV, not who was watching. To remedy this gap, Nielsen began to record more detailed information thanks to a subset of the sample population who kept viewing habits in Nielsen Diaries. The demographic information thus supplemented audimeter-collected data.
In 1971, Nielsen introduced their version of an American Research Bureau meter whose data could be retrieved by phone line, lowering data-preparation time for the market. This storage instantaneous audimeter stored data during the day and transmitted them overnight. 4 This newfound speed made Nielsen ratings and reports increasingly important for advertisers, as demographic information on viewers dominated advertising decisions. 5
This system remained largely unchanged until 1986, when the peoplemeter was introduced. This new viewership measurement method allowed for individual data collection from multiple members of a household; individual users recorded their viewing patterns along with demographic information on this device. This major change in data collection created a huge, readily available database that included much more detailed information about exactly who was watching what than had ever been available before. 6 Businesses could now tailor their advertising messages more specifically.
“This major change in data collection created a huge, readily available database that included much more detailed information about exactly who was watching what than had ever been available before.”
Childhood (1986): cable TV and VCRs
The spread of cable television further altered the type of data collected for audience measurement and how it was used. Cable television was first established in the 1940s to provide TV signals to remote communities. Operators took signals from areas with good reception and then distributed them by coaxial cable to subscribers. Cable systems were able to handle more stations and, beginning in the 1970s, networks designed to be distributed specifically by cable were created, and increasingly diverse programming was introduced. 7 By 2011, more than 5300 systems were in operation, with around 60 million subscribers in the United States.
The peoplemeter system's capacity to measure small, demographically targeted audiences made it possible to tailor programming content and develop shows for specific audiences. At the same time, cable's advertiser-supported networks could collect the detailed data needed to lure advertisers of niche products, who could place ads specifically targeted at particular demographic groups. This proliferation of cable networks enhanced the importance of TV ratings and made user data even more valuable for advertisers. They could now dispense with appealing to the lowest common denominator and target their products to those groups most likely to be interested.
The widespread adoption of VCRs in the 1980s signaled a further shift in television viewing habits. People could now record television programs and watch them at a later date, a phenomenon known as time shifting. Expanding with the later introduction of digital TV recorders, time shifting dramatically changed how data are collected and used in programming and advertising decisions.
The need to keep up with the ever-increasing numbers of shows, as well as take time shifting into account, led to the development of new solutions to automatically detect which programs were being viewed using digital signatures. The System for Measuring and Reporting Television was developed by SRI in 1994, and Nielsen competed with Active/Passive shortly after. 8 These digital tracking solutions allow the detection of both TV show and TV advertisement signatures. The new possibilities led to an expansion of the measurement market; in parallel with these developments, newcomer Rentrak outpaced its competition by devising solutions for measuring VOD. Fully entering the market in 2008, Rentrak swiftly became a major player on the basis not only of offering viewership and demographic data, but also of being the only company to provide VOD measurements obtained from set-top box data as well as measurement of box office ticket sales, all of which can be linked by time and location.
Adolescence (2000–2010): the Internet and social media
The development of the Internet in the early 2000s altered how people watched TV and integrated it into other aspects of their lives. As people spent more time online, companies recognized that clicks, searches, locations, tweets, purchase, and demographics could all be measured relatively easily at large scale in real time. As the public entered the new world of the Internet, they gave rise to a new world of data. This could be used to measure the impact of TV and advertising on viewers in terms of attention while watching and what they “thought” while watching, as well as what they purchased. 9
Various methods exist for doing this. Starting in 1999, comScore measured demographics, clicks, and purchases, and has since evolved to measure attention across many key platforms (e.g., both home and mobile Internet). Google Trends allow tracking of keyword searches over time and by geographic location. 10 Yet while users are likely to search for a brand online after seeing it advertised on TV, 11 the first online measurement solutions were unable to take TV viewing into account because of data inaccessibility. This has since changed. Ever since a chat forum for discussing the show The Prisoner was launched in 1995, 12 a plethora of social TV platforms have popped up, and their usage rates have skyrocketed. Users now engage more with TV shows because shows are also prompting two-way communication, as experts from Viacom and Mass Relevance (now Spredfast) indicate in the boxed text.
TV Measurement Experts Comment on the Current Practical Uses of New Data
At Viacom, we rely on data from linear TV ratings and demographics, apps, and websites to gain insights into viewership across those platforms, so we can tune user experience via programming. We plan to use these data in conjunction with data from our ad servers to effectively manage campaigns and impressions across platforms. We also use Audience Manager, Adobe's data management platform, to segment our user base for analytics and targeting. A few years back, we switched from recommendations from a third party provider to internal recommendations produced from Apache Mahout. This resulted in an increased click-through rate, because we are able to tune the recommender better than a third party since we know our own content best.
—Mark Cohen, VP, Data Platform, Viacom
Mass Relevance (now Spredfast) was Twitter's first social TV partner and one of the first companies to combine social media with traditional TV programming. Mass Relevance began in 2010, and our first undertaking was powering tweets onscreen for Dancing with the Stars. Our solutions have changed how people interact with TV and with one another by integrating polls, tweets, and other interactive activity in shows to get real-time responses from viewers. Our solutions integrate social media online and on-air to promote fan engagement and conversation about shows. Five of the top 10 primetime TV shows integrate social media online and/or on-air: NBC Sunday Night Football, both nights of The Voice, and both nights of X Factor. In addition, Spredfast reaches 135 million people each week through our on-air social visualizations, which is 40% of the U.S. population.
—Chris Kerns, Director of Analytics and Research, Spredfast
The secret to Rentrak's recent success with TV is the scale of the different types of data we combine. The company's infrastructure, which we began building in 1977, has a global reach. We continue to layer data on top of the infrastructure for more sophisticated aggregation across important sources like TV viewership and video on demand. Our solutions offer unmatched stability because we cover over 13 million TV homes. Because of time shifting, data is being sold on longer and longer cycles. Rentrak's scale allows us to sell on cycles up to 28 days for most shows because we have tremendous coverage across users. Because of its scale, our data also allows for finer grained and more precise targets. For example, during the 2012 presidential election, Obama, using Rentrak viewing data, merged in a privacy protected manner with 70 key Democratic voting blocks and bought 100 networks deep compared to 18 for Romney. Therefore, Obama spent less per ad by buying micro-audiences that the sellers did not realize they had, which led to 15% more efficient buying. I expect the next step to be programmatic buying machines buying inventory based on precise demographics.
—Bruce Goerlich, Chief Research Officer, Rentrak
“Because of its scale, our data also allows for finer grained and more precise targets.”
The opportunities for viewer communication and interaction are virtually limitless. According to Pew Research Internet Project, 71% of adults use Facebook and 42% of adults use more than one social media platform, for example, Twitter and Instagram. 13 The popular social media sites have been joined by television-specific platforms such as Youtoo, Mytv, and GetGlue that allow users to “check-in” to shows online and interact with other viewers. GetGlue announced in 2011 that after less than a year on the market, it had over one million users. 14 In the same year, the TV show X Factor introduced Twitter voting, the first use of the platform for this purpose. 15
People now commonly comment on Twitter and Facebook while watching TV, a phenomenon known as second screening. 16 In 2008, Nielsen's first three-screen report, covering television, Internet, and mobile usage in the United States, revealed that 31% of Internet usage occurs while people are watching TV. 17 A similar study by Nielsen and Yahoo! focused on mobile usage in 2011 and found that 86% of mobile Internet users accessed the Internet with their mobile device while watching TV. A quarter of these users were looking at content related to the show they were watching. A multitude of applications connecting television with the Internet and social media have been introduced, resulting in huge, user-generated data sets that reveal viewer preferences, habits, and purchasing behavior. The era of user-generated content has arrived. For the first time in generations, new behaviors have resulted in swathes of new data from set-top boxes, tweets, and Facebook posts, enabling the development of new audience measurement techniques that have the potential to address some of the limitations of past methods.
Firms began to analyze social media text in the light of TV and advertising as soon as the data became available. BuzzMetrics, now owned by Nielsen, was founded in 1999 to quantify online buzz about brands, celebrities, and TV shows. Bluefin Labs (now part of Twitter) is heavily engaged in social media measurement, matching social media comments to television content using proprietary algorithms. The Social TV Lab 18 came on the scene in 2010 to measure social response to TV from an academic perspective. Mass Relevance (now Spredfast) has recently developed a comprehensive way to measure millions of pieces of social content per minute and recently announced EchoGraph, which will track and analyze this for advertisers. Other methods are also used. Simulmedia, for instance, combines set-top box data with data obtained from market research companies such as Nielsen, Rentrak, and Kantar, and targets TV audiences based on their purchase history rather than using demographics such as gender and age.
The much finer-grained nature of data compiled from user-generated content, compared with previously available information, allows advertisers to closely tailor their messages in terms of both content and placement, affects programming decisions, and allows social aspects to be built into programming. These data have proven to be incredible sources for measuring viewer engagement at the aggregate audience level. While the new data have not replaced Nielsen ratings for cable and networks channels, they provide an entirely new level of information in terms of volume and level of detail, particularly with their inclusion of all types of television viewing, both synchronous and deferred. It is currently impossible to link all the different pieces of data at the individual or household level, but data partnerships firms and researchers are moving closer to being able to link TV viewership with online social activity, clicks, and, ultimately, purchases across multiple devices.
The net result is a huge amount of very specific user-generated data with multiple uses that opens up opportunities for more dynamic business practices, including auctions. 19 Because of the radically different ways people watch TV, companies are developing new ways of monitoring what is being viewed by whom and when, and how the content is being shared through various social media outlets (see boxed text).
The coming of age (2013–): VOD and TV everywhere
The proliferation of the Internet and mobile devices such as smartphones and tablets has resulted in major disruption for the TV industry by fundamentally changing the way people watch TV and therefore calls for new models of advertising. 20 The appearance on the scene of services such as Netflix (established in 1997), YouTube (2005), Hulu (2007), and Amazon Fire TV (2014) has led to a world of infinite content—anytime, anywhere, for anyone. In terms of global viewership as a result of online VOD, YouTube is catching up with TV. The vastly different metrics of these media create an image problem for the TV industry among both consumers and investors. During this year's UpFronts, a number of tech writers highlighted a presentation where Google chairman Eric Schmidt seemed to say that YouTube's success was because the site now has some one billion unique users who consume some six billion videos a month. 21 There is now more content online at any time than could possibly be presented on television. These infinite viewing choices also represent infinite advertising possibilities, meaning greater opportunities to identify users.
Networks have responded with TV Everywhere services. Premiered in 2009 by Time Warner Cable and followed by many other providers, this model allows users to subscribe to specific channels via a user account and view them across multiple devices. The existence of specific accounts means that for the first time, firms can collect data and target users at the individual level, linking such details as personal preferences, locations, demographics, purchases, and social media activity across devices.
Social TV spaces represent repositories of preference information, consumption patterns, social trends, market segmentation information, and opportunities for customization of very fine granularity at the individual and community levels, all of which can be creatively extracted and leveraged to provide enhanced value to customers and advertisers. 22 This makes today an exciting time for TV measurement. This article offers only a brief overview of TV measurement, highlighting only key sources of data and not comprehensively covering all firms and efforts, but Figure 1 illustrates the extent to which its evolution has speeded up in recent years, mainly because of the explosion of Internet and social media data. Just as it is clear that limited data was at the root of the mostly static nature of TV measurement, the removal of such limitations has left the field dynamically evolving. Viewers are no longer guaranteed to be sitting in their living rooms while watching TV, but it is now possible to track where and when they watch shows. These new data sources provide fertile ground for current and future research, as my recent work detailed below demonstrates.
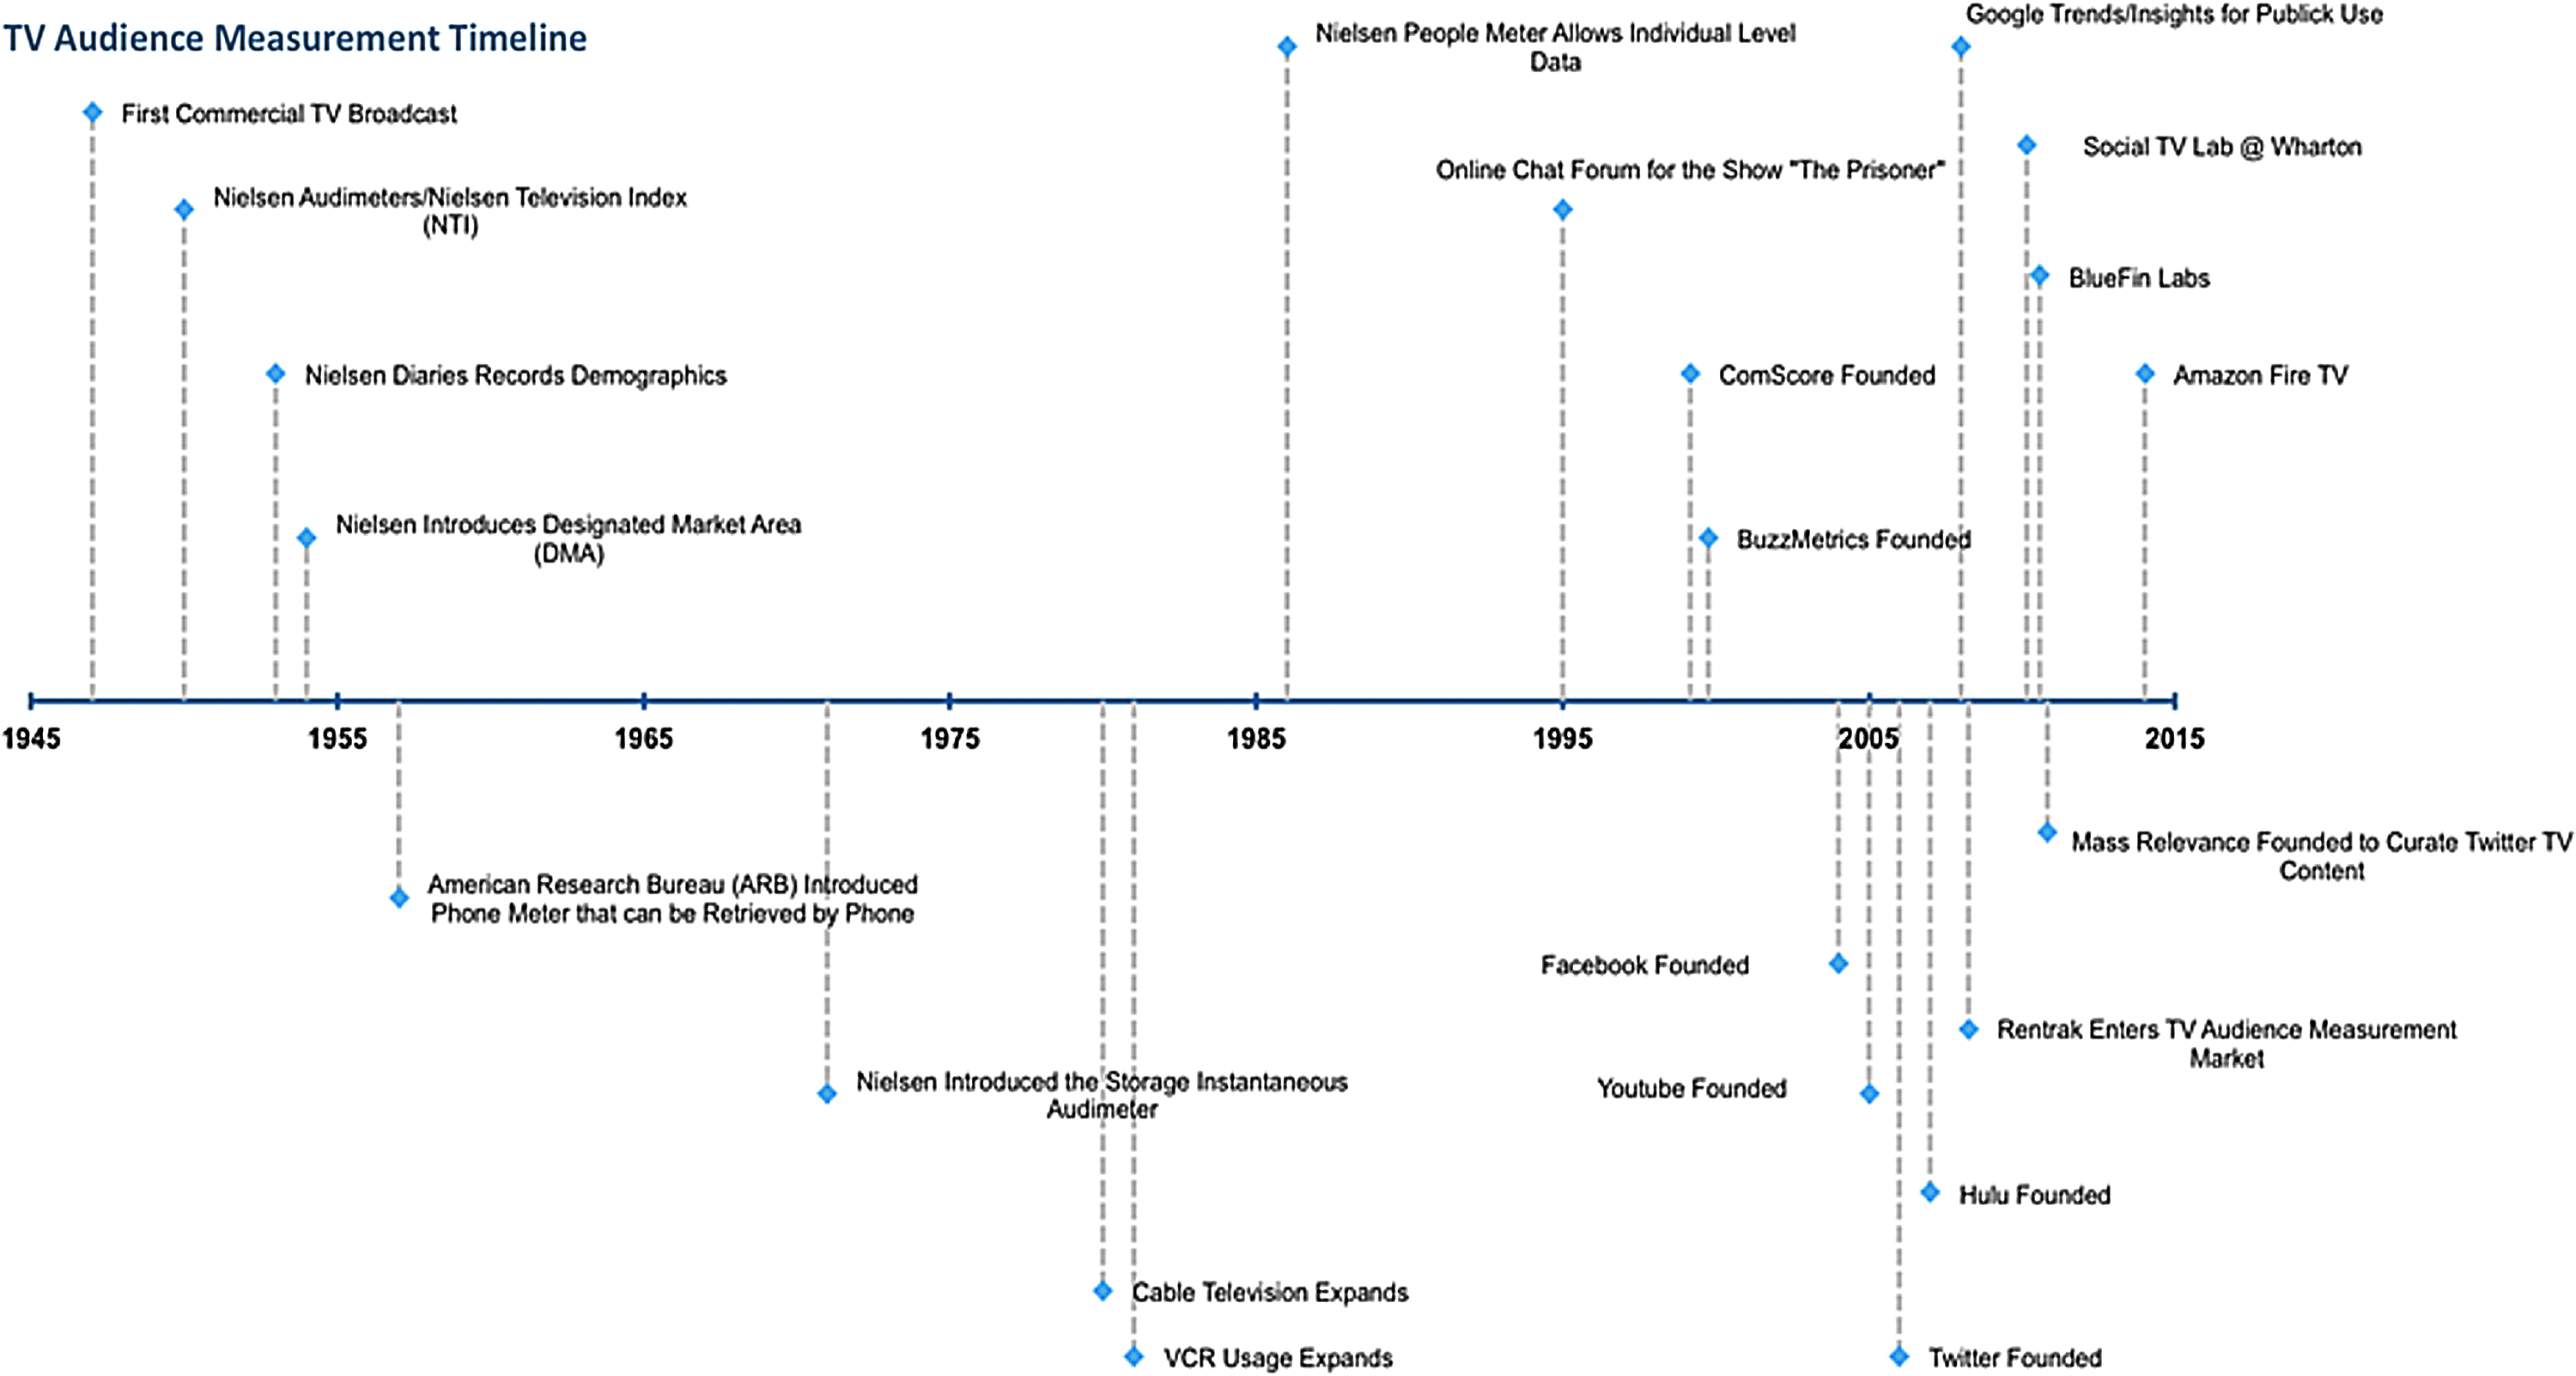
TV audience measurement timeline.
Renewed Possibilities for Research
In my research, I find ways to combine data from new sources so as to better predict viewership, audience demographics and interests, and real-time engagement. My work is only possible because of the wealth of publicly available data from the TV-viewing audience. In this section, I summarize some of the ways these new data can be used to research and solve the old problems of predicting audiences and viewership better.
Predicting TV viewership
The ability to build predictive models from large amounts of data is at the heart of the emerging field of data science. 23 Many firms and researchers working in the entertainment industry are concerned with the question of whether social media data can predict or cause viewership. We have found evidence that these media can be predictive. 24 Using freely available, publicly generated social TV data from GetGlue check-ins for 80 popular shows aired during the fall 2012 season, we have demonstrated that social TV behavior on Twitter shows a significant ability to predict shows' number of weekly viewers, and validated that our unique data set is almost as significant in tracking TV viewership from week to week as Nielsen's rating data. Combining these two data sets enhances predictive accuracy even further compared with using either data set alone. Figure 2 presents the frequency of GetGlue check-ins over the course of a week for two shows (The Voice and Big Bang Theory). Each colored line represents a week of check-ins, while the horizontal axis spans time from the beginning to the end of the week. From the plots, you can see that the check-ins exactly follow the shows' original airing dates. However, we also see from the plots that there are additional check-ins when the show is not airing for the first time, indicating that people are time shifting either by using digital video recorder or on-demand services. Such publicly available data on TV applications check-ins allows us to reliably predict viewership in this manner for tens of thousands of TV shows. In our work, we provide unique and intuitive views on the question of when this type of social media is likely to be a good predictor of viewership. We find that social content works best for shows skewed toward younger demographics and for reality shows.
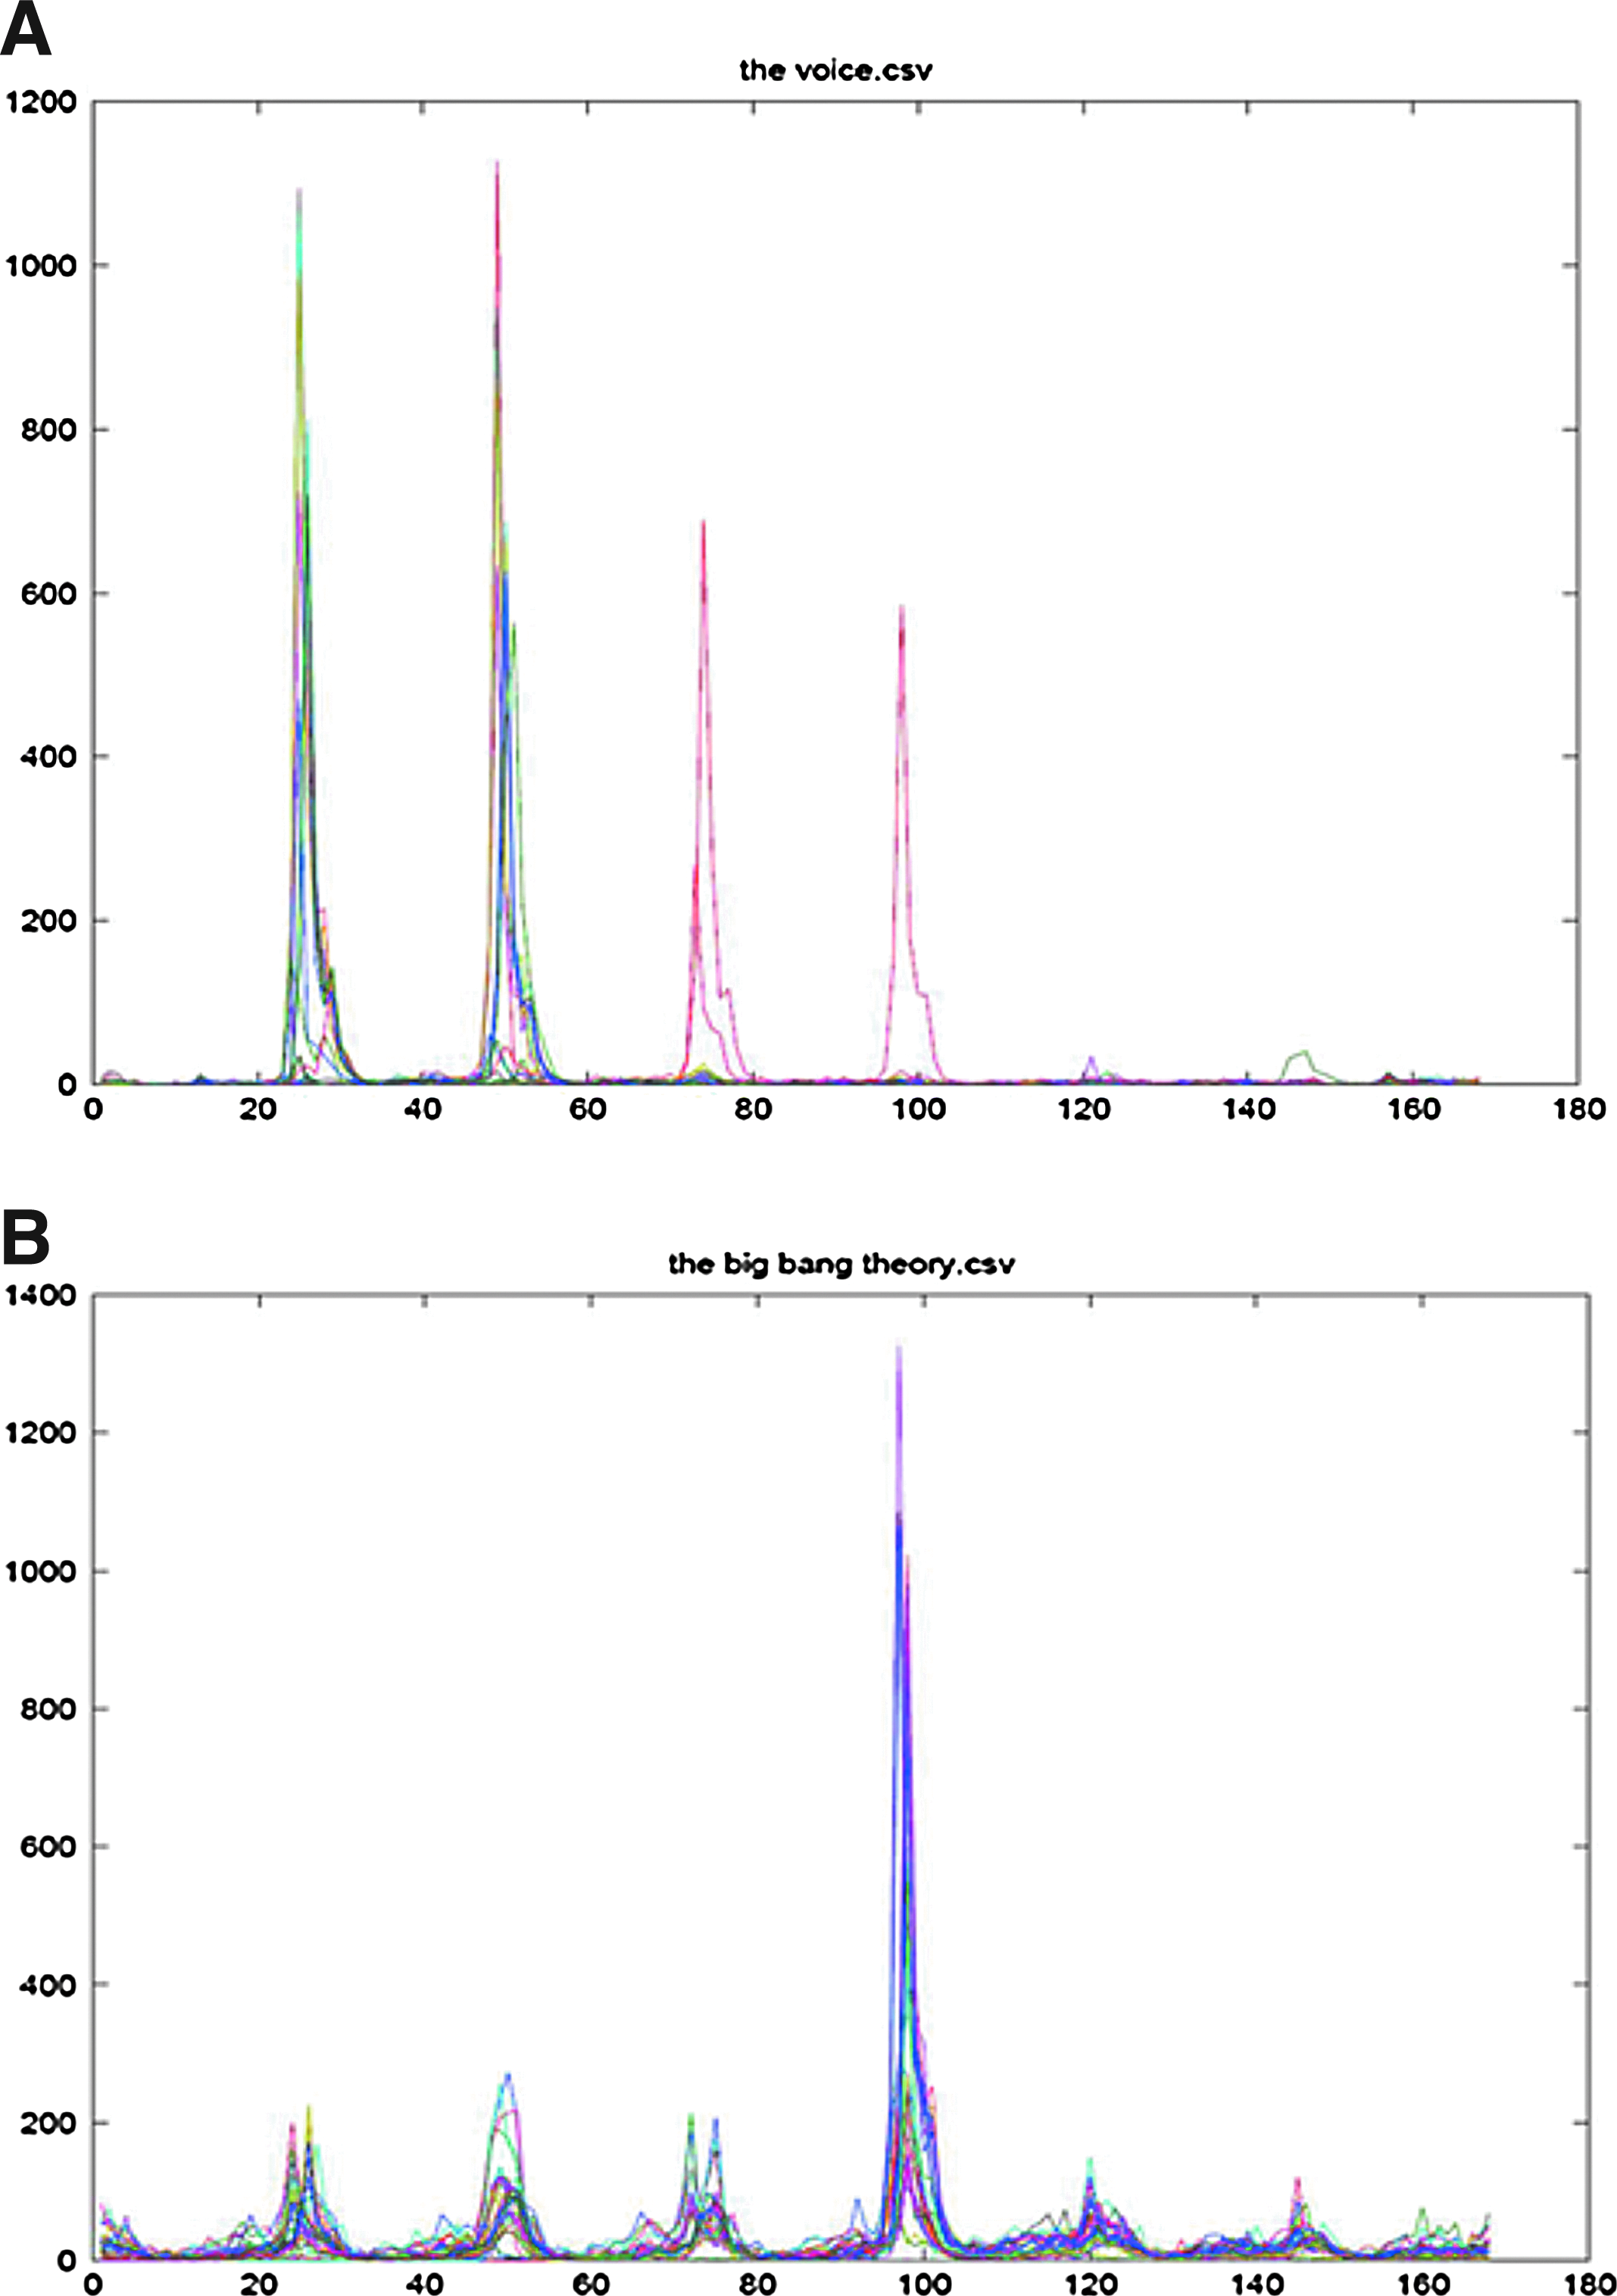
GetGlue check-ins during the week for a show that airs one night a week with daily repeats
The same GetGlue data shows that viewer churn (at the individual level) can be better predicted when information about loyalty (as evidenced by social media engagement) is used. 25 Past research has shown that engagement leads to loyalty, an important consideration for firms that have repeated transactions with customers. By fitting traditional customer lifetime value (CLV) models (popular in the marketing literature) to our TV viewer panel check-in data from GetGlue, we validate the fact that consumers who tweet positively about shows have lower churn probabilities for those shows. In order to measure the positivity of a given user's tweets, we applied a classifier to each tweet to label each Tweet by its likelihood of having positive sentiment. We then took the average positivity score from the models over all tweets for a given user. Combining marketing and information systems methods, social media text mining, and traditional CLV methods, we are able to predict future viewership on an individual level.
“Combining marketing and information systems methods, social media text mining, and traditional CLV methods, we are able to predict future viewership on an individual level.”
In addition to linking social media data to TV viewership, we have linked TV viewership and online sales. 26 In our work, we find that there is evidence of a significant spillover effect between offline TV consumption and online sales. 9 In short, more offline consumption leads to lower online sales, indicating that TV consumption and online sales are substitutes rather than complements. One possible explanation for this is that people have a limited attention budget and that, consequently, increased attention to TV leads to decreased attention for online retailers.
Predicting TV audience demographics and preferences
In addition to predicting TV viewership, we have used social network data collected from Twitter to predict the TV viewing preferences for viewers of both TV shows. Specifically, we predict which shows Twitter users follow. We have tried to determine whether knowing that a large number of a given user's friends follow a show on Twitter allows us to predict whether that user follows it as well. Accuracy in such social network–based prediction provides opportunities for firms to maximize profit through marketing that targets existing customers' friends and contacts. In the work of Hill et al., 27 we find that social network-based recommendations are more precise when both the user and product have a large number of followers. In other words, the greater the number of connections, the greater the possibility of using them for prediction. “Big data” is not merely a case of there being more data available; the quantity of data is intrinsic to its success. In addition, we find that connections between users alone are not enough; the features of each TV show matter. The social network approach works best for shows that skew toward a specific demographic. At the forefront of research in this field, this study is the first to compare the effectiveness of social network–based marketing across an immense spectrum of shows.
“At the forefront of research in this field, this study is the first to compare the effectiveness of social network–based marketing across an immense spectrum of shows.”
A second predictive recommendation system is based on user-generated text, specifically tweets. By aggregating all the tweets of a given show's viewers, we can reliably calculate the affinity among TV shows and describe how and why certain shows are similar in terms of their audiences. 26 We provide a new methodology for collecting data from social media, beginning with a Twitter handle and collecting all information about that handle's audience, including information about product networks (how shows are connected through users on a social network), geographic location, and user-contributed text comments. This method can be used to generate and test affinity to networks as well as predict audience demographics and interests. By relying on all publicly available text contributed by viewers, as opposed to only preselected keywords, our approach is both more flexible and generalizable than those used in any prior research. Our approach predicts remarkably well which TV shows Twitter users follow by using text, just like with the social network data discussed above. We demonstrate that this is mostly because user-generated content reflects the demographics, geographic location, and psychographics of viewers. For example, Figure 3 presents words associated with shows with high female viewership (left) compared with high male viewership (right). In addition to predicting demographics like gender, we reveal that Twitter text can represent and, therefore, predict many complex, nuanced combinations of the demographic, geographic, and psychographic features of an audience.
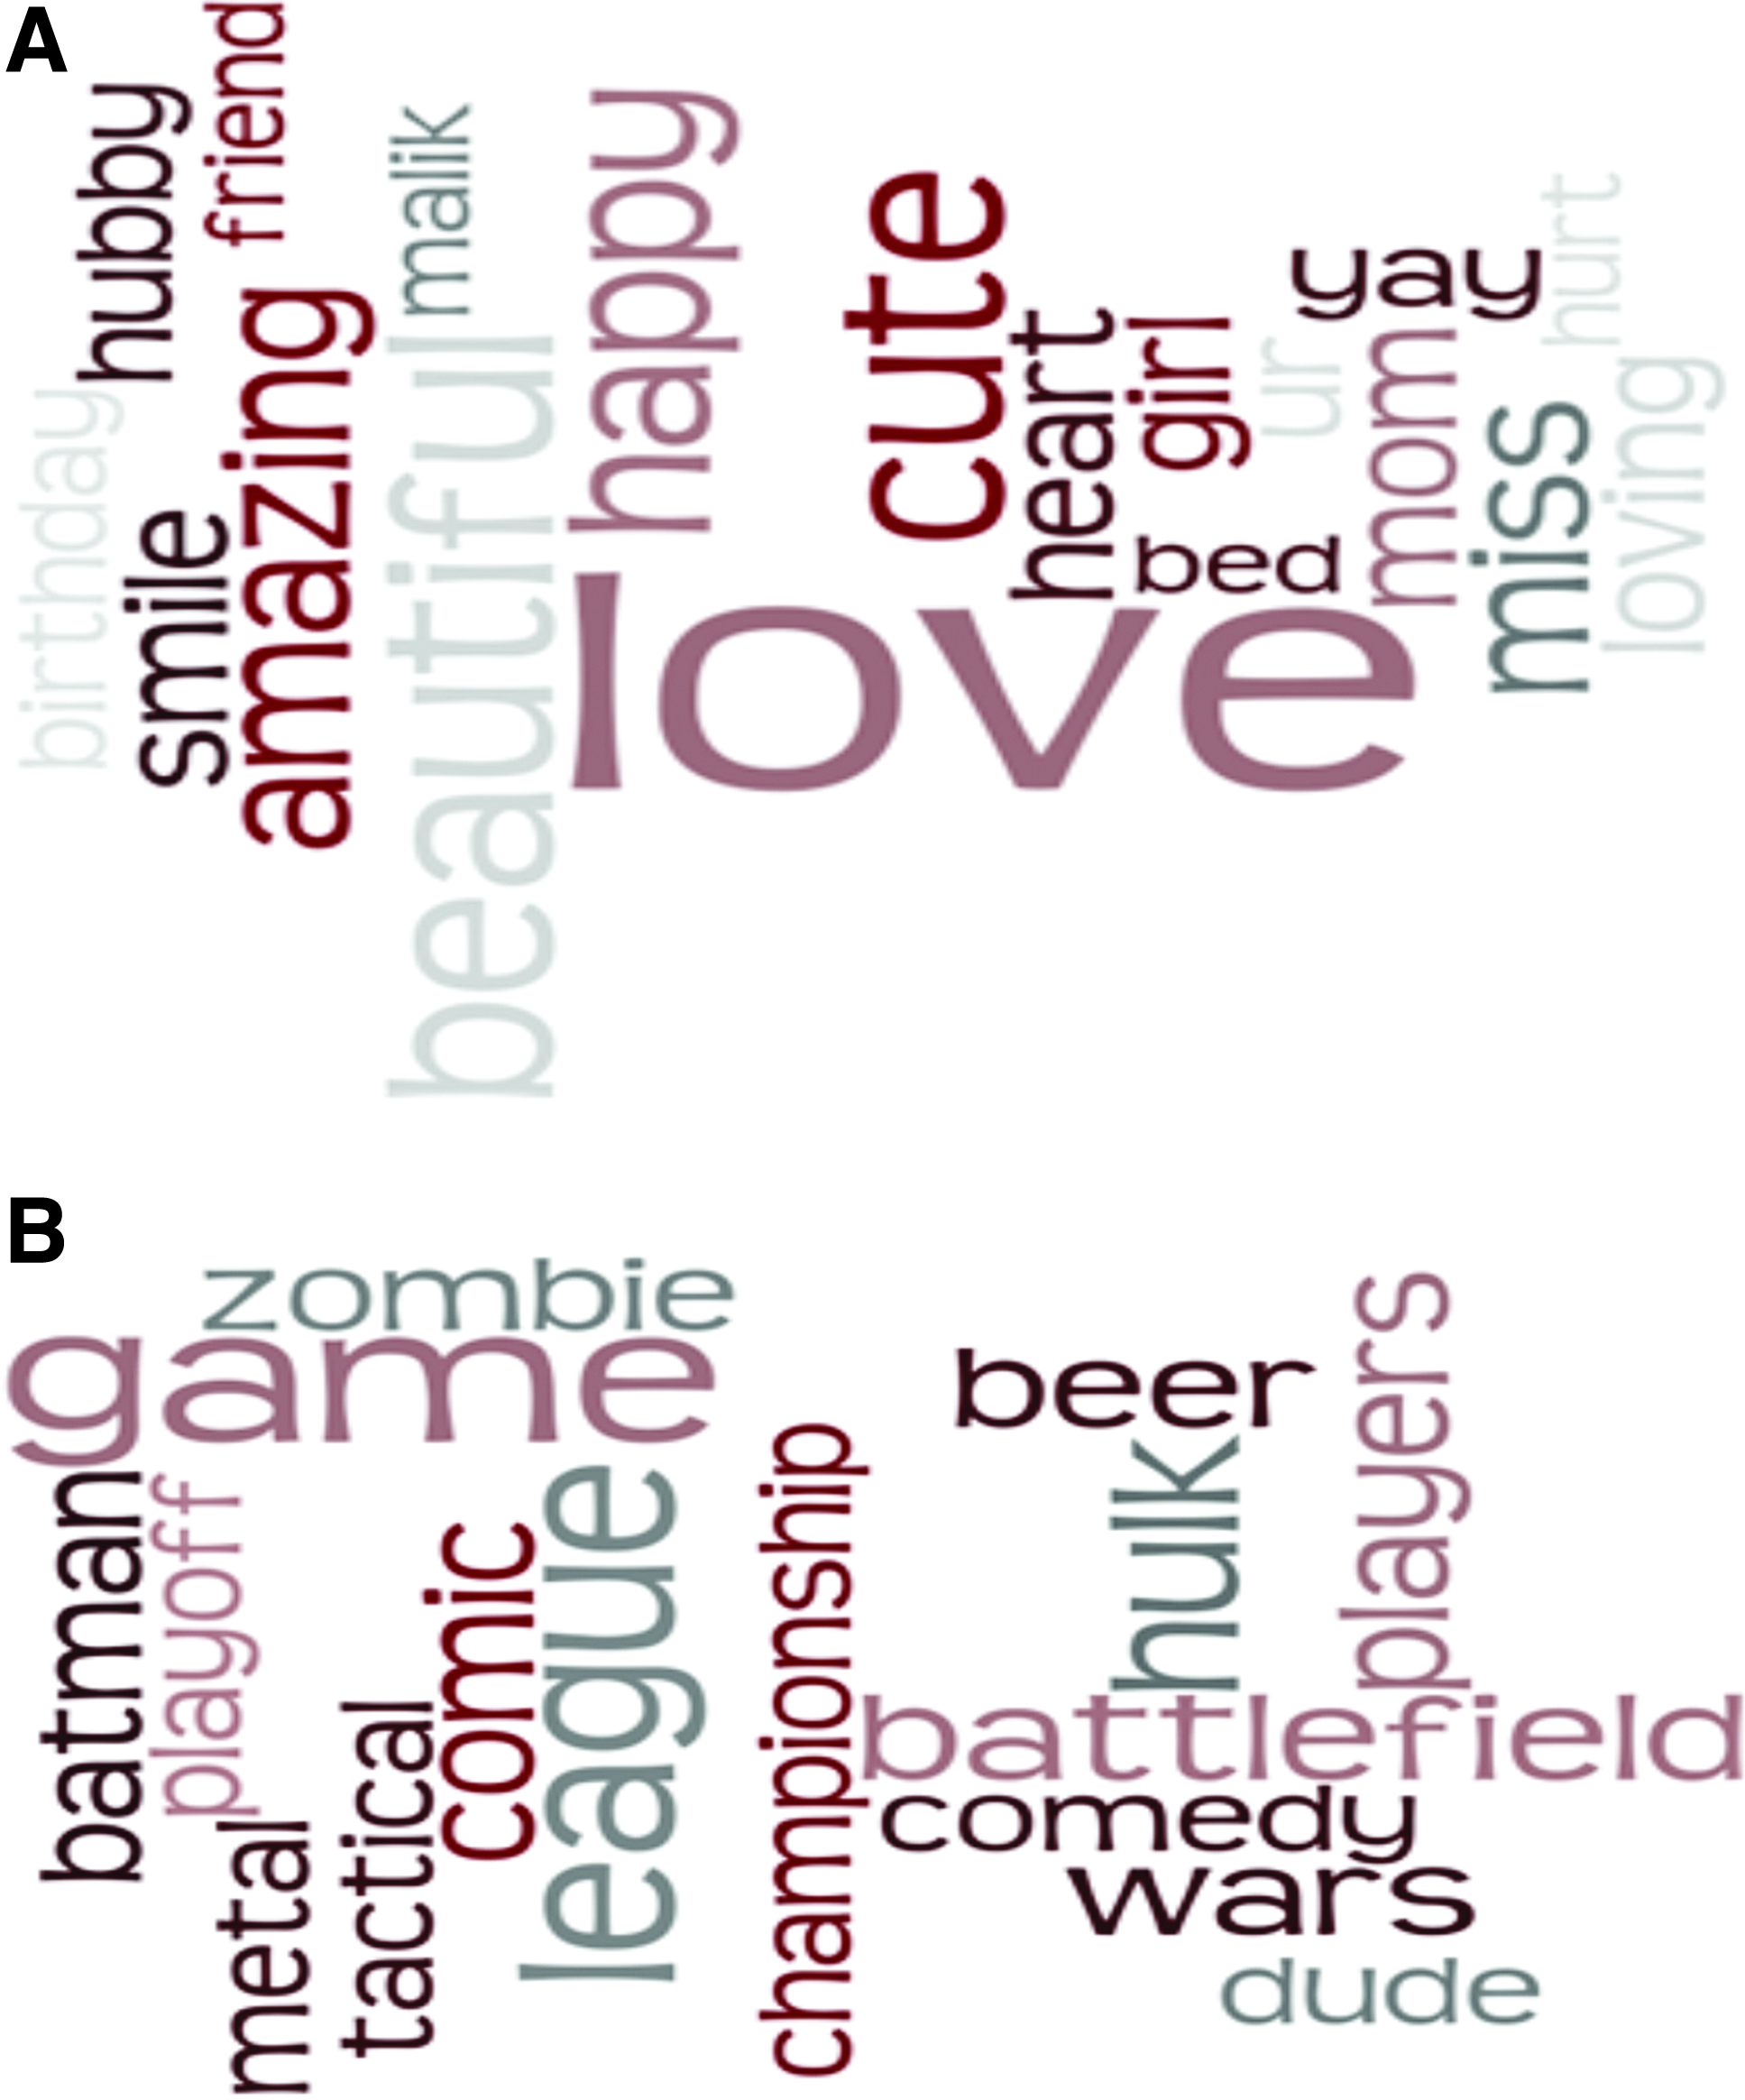
Words from publicly available Twitter posts that predict female
Real-time response data
The data contributed by social media is useful for advertisers and TV shows in other ways as well. Because social media responses are both immediate and often concurrent with TV viewing, we can for the first time look at real-time reactions to TV programming. Two of our recent case studies show that “social TV strategies” increase and sustain user engagement. Looking at both Super Bowl XLVI 28 and the popular reality/game show The Voice, 26 we focused on real-time social media responses to TV advertising and, in the second case, to what we call social TV triggers—display of hashtags and tweets during the actual broadcast of the show. We linked Twitter responses to aspects of TV ads, including social media strategy, creativity, and product type. Analysis of millions of tweets showed that online consumer engagement, as measured by new Twitter followers and overall buzz, correlated directly to the presence of an active social media strategy. Figure 4 shows the frequency of tweets during the Super Bowl in 2012 related to Teleflora and Chevrolet. The red lines indicate when commercials were shown on TV. We see immediate responses to Teleflora, but unlike Chevrolet, there is no sustained buzz over the entire Super Bowl. Brands like Chevrolet that did sustain a buzz during the Super Bowl were playing a kind of social game with viewers. In Chevy's case, they introduced a game-time app that promised prizes such as cars if used during the Super Bowl.
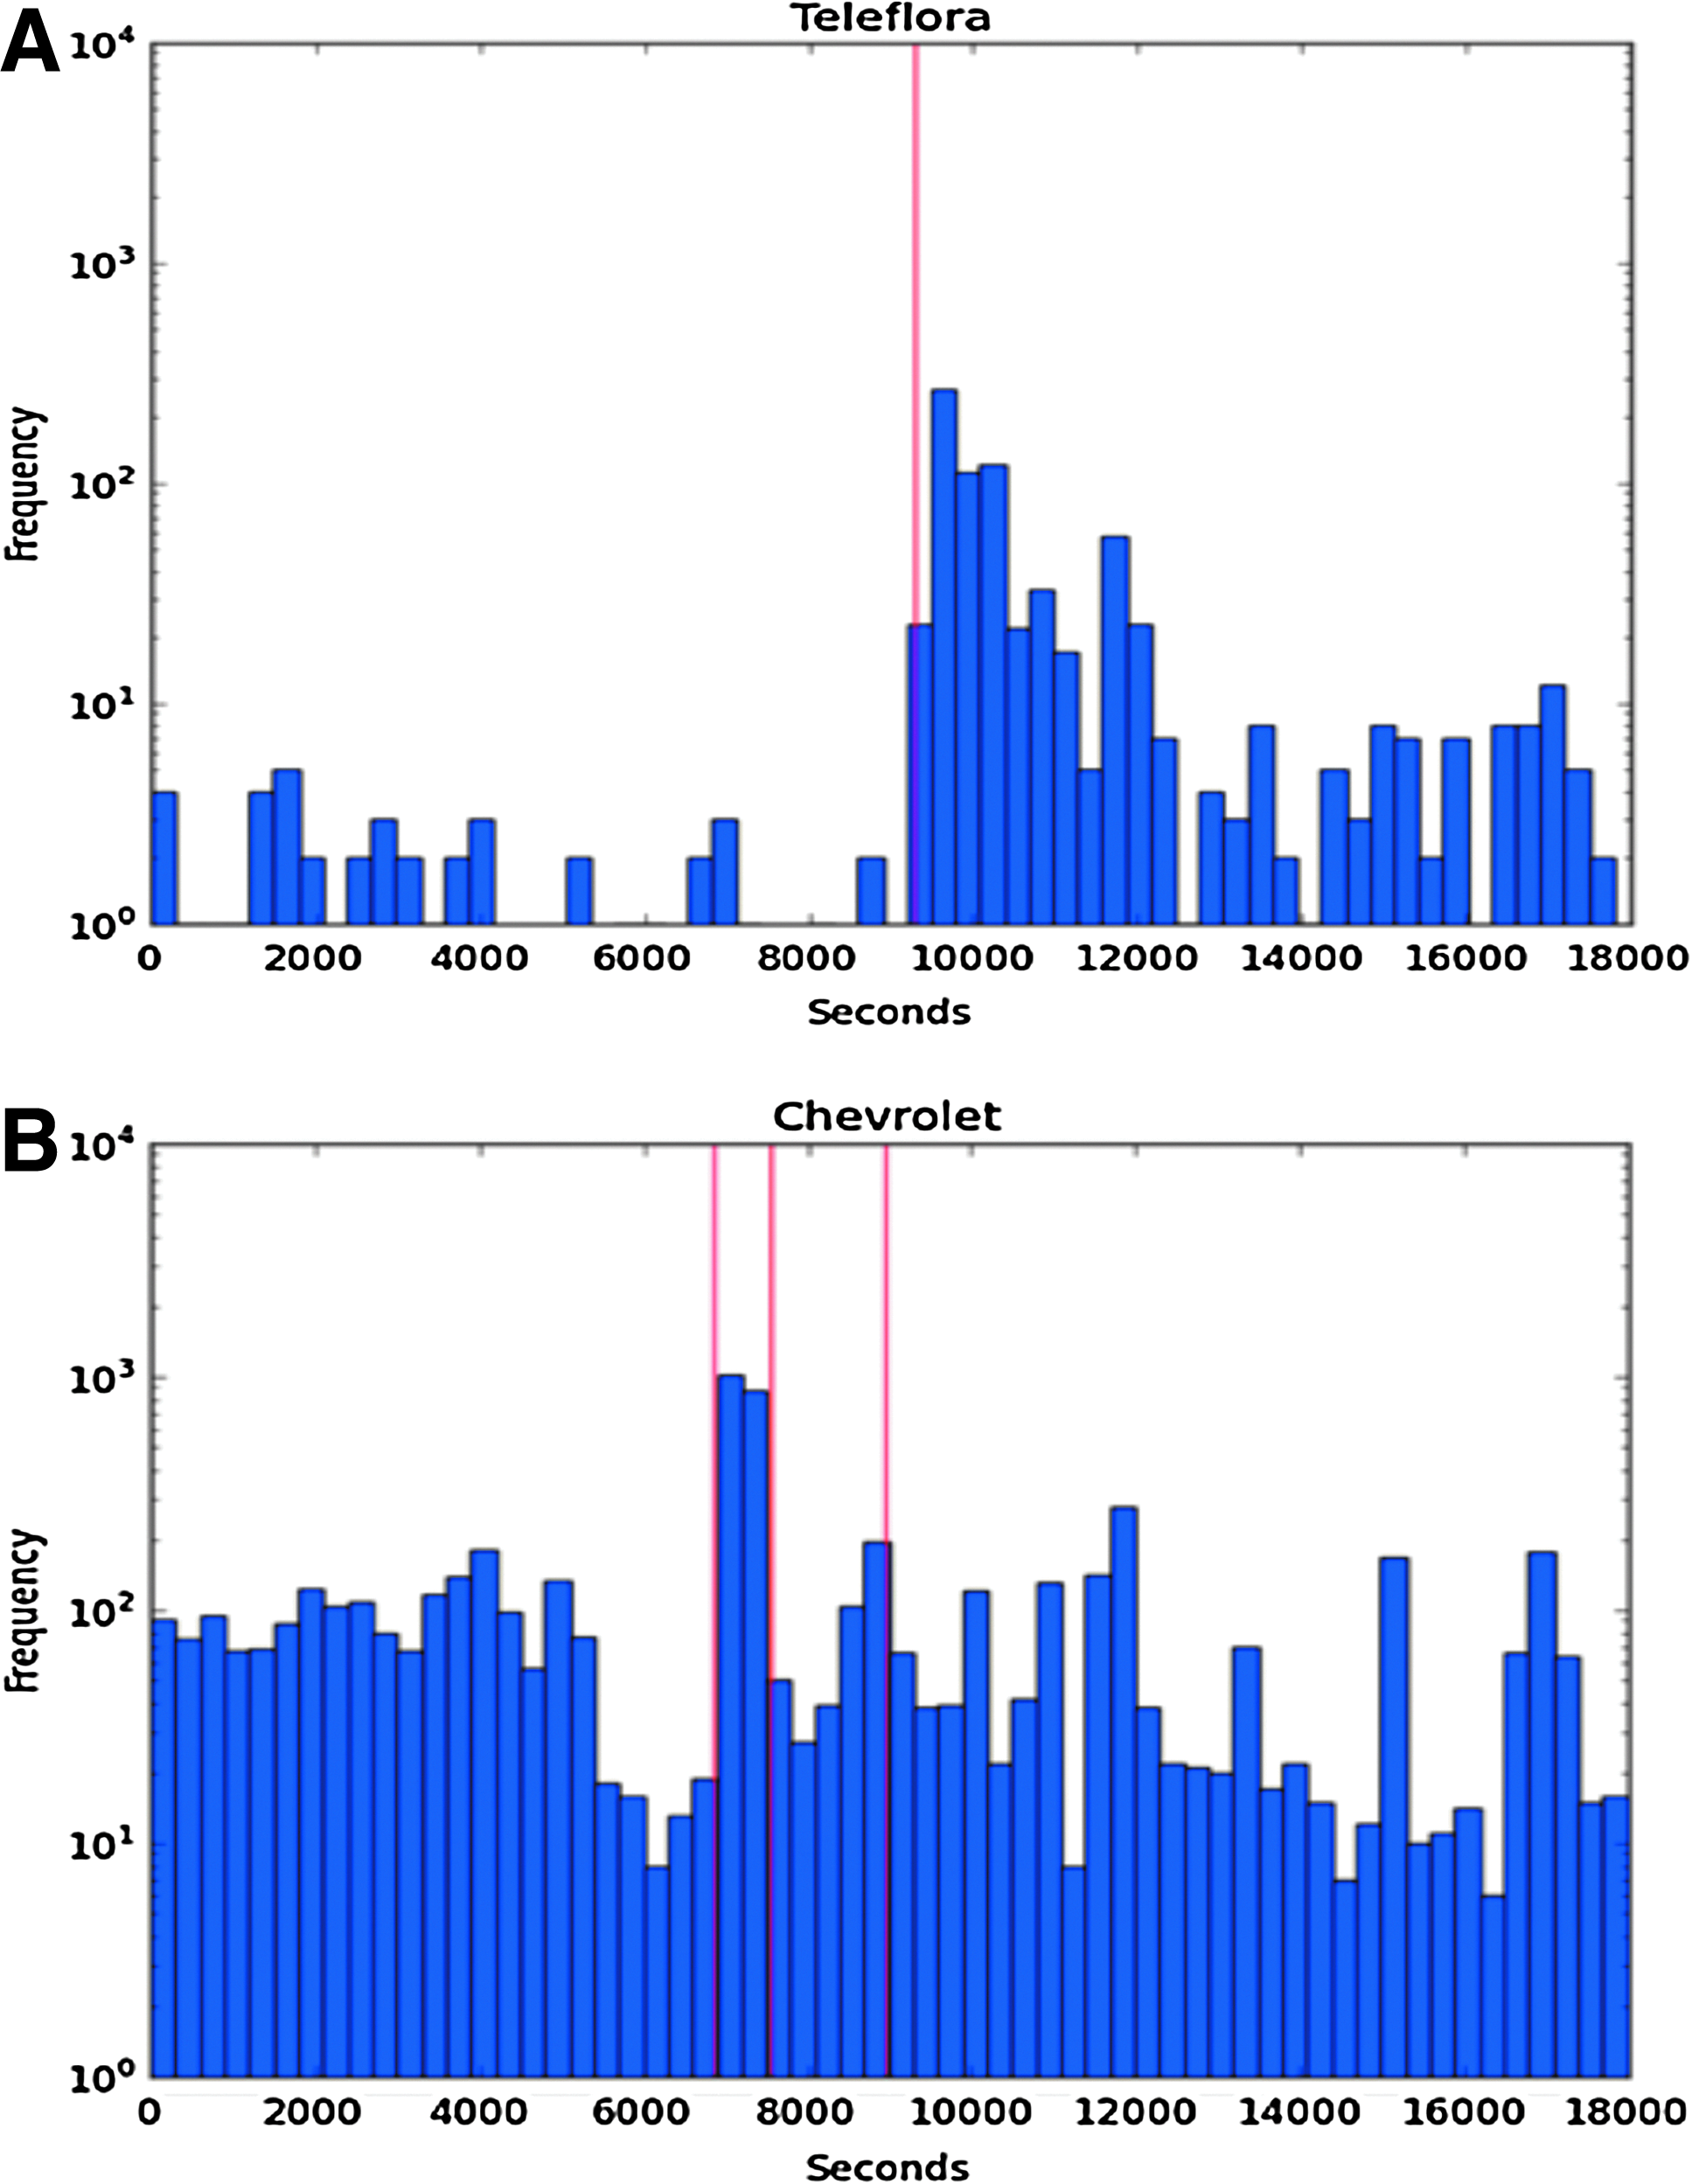
Real-time response to TV advertising. Frequency of tweets during 2012 Super Bowl for
For TV shows rather than TV advertising, tweets and other social media content like polls and hashtags are shown to draw different levels of social media engagement; we find that viewers are more likely to discuss on-air tweets, and tweets with new information result in more engagement than general on-air hashtag posts. Looking more deeply at the content of viewer responses, we also find that positive sentiments and levels of Twitter sharing—measures often used to quantify the effectiveness of TV ads—vary significantly by demographic category, including gender. Significantly, in the case of The Voice, we were able to demonstrate that online buzz is an excellent predictor of sales for the iTunes songs associated with the shows. The effectiveness of sales predictors such as choice of song, contestant characteristics, and quality was reinforced when combined with buzz, suggesting that sales are best predicted by a combination of buzz and perceived product value. The fact that we can observe purchases over time in response to TV content lets us begin to understand the previously mysterious relationship between content, buzz, and sales.
Adulthood: The Revolution Will Not Be Televised
The new reality for TV represents a truly seismic shift. The model that, despite occasional cosmetic modifications, has basically been the foundation for all television production and advertising since its inception has been recently altered and may even soon be discarded. What does this mean for measurement?
Any answer to this question must address two elements. On the one hand is the new data itself, with its new specificity and the ability it offers to look more closely at individual as well as aggregate audiences. On the other is what can be done with this data in terms of measurement.
Data
The future is bright in terms of data collection. Data availability has outpaced methods for linking users across disparate sources. The new quantity and detailed level of data is exciting in and of itself, but is not enough on its own; rather, it is the ability to link the overall view the data provides with the individual experience of given users that gives this new world its full value. It must not be forgotten that this data exists in part because of changing audience behaviors, some of which are driving content creation in a way previous audiences did not, if only because they could not. Creators and audiences are engaged in a collaborative reinvention of television, with creators having to reach out to audiences as they did not have to when they were, as the saying goes, “the only show in town.” This includes their use of social media to attract and engage with their audience and the acceptance that the era of a family sitting down on a couch to watch a single show on a single screen is over. This give-and-take between content providers and content receivers, existing as it does in the open forum of social media, is at the heart of the possibilities offered to researchers and business. As online viewing rapidly catches up with traditional TV watching in terms of number of viewers as well as variety of content, as people increasingly watch on screens that can be tracked at the individual level, as their engagement with their favorite shows is ever more collectable by networks and researchers, it becomes easier and easier to closely track viewing activities. The variety of sources afforded by these new behaviors not only amplifies the quantity and quality of available data, but also facilitates its aggregation.
So what exactly will be different from what we have today? First, we will be able to capture more information about even more viewers, including purchases, geographic location, and social networks of viewers in real time. Second, TV shows will interact more with viewers that will generate data about both shows and viewers. Third, and most importantly, what we have in aggregate form today will be linked at the individual level and then aggregated if needed. All of these data will lead to better measurement solutions and viewing predictions for more people, even those viewers that are not currently noticeable with the relatively small panels of traditional audience measurement companies. New measurement techniques as a result will lead to more personalization quicker for almost everyone, which is beneficial to both the viewers and the advertisers.
Measurement
The data explosion has left the question of what to measure regarding TV watchers and their behaviors increasingly important. The often-simultaneous use of multiple screens makes cross-platform measurement necessary. In addition, the fact that TV viewers are time shifting at an increasing rate must be addressed. However, cross-platform measurement is currently in its infancy. In light of changes in TV watching, eyeballs watching televisions are no longer a sufficient yardstick to measure TV watchers and their behaviors, so we need new metrics. In the era of multiple screens, it is necessary to measure the attention devoted to each screen. This is no different from the needs of traditional advertising. Just like in the online world, we will no longer be limited to demographics; we will be able to infer interests, behaviors, willingness to pay, and TV watching styles—all, to some extent, from publicly available data, which is both more comprehensive and cheaper than traditional methods. In fact, most of my research on audience measurement relies on publicly available, free data. One main challenge to using web data, however, is that when we restrict our analysis to the convenient sample of online TV watchers or users of smart TV, the sample of viewers for analysis is biased since these technologies have not yet been adopted by the masses.
“In the era of multiple screens, it is necessary to measure the attention devoted to each screen.”
So what can we expect in terms of new measurement solutions? We will be able to measure time shifting and viewership more precisely. We will be able to measure the value of individual viewers to advertisers and TV shows. We will be able to measure just about all aspects of viewers' daily lives.
The consequence of new data and measurement is exciting
New data partnerships between firms with different types of data will facilitate the linking of data at the individual level. This will lead to better methods of audience measurement, which will in turn offer better matching of TV content for both advertisers and viewers, which will lead to more programmatic buying. Based at first on micro-audiences, then on individual-level data, advertisers will soon be bidding on households rather than simply on timeslots. In addition, they will bid for viewers' attention across platforms.
However, in order to do so, the bandwidth challenge of sending personalized video must be addressed. Cable companies have only limited bandwidth, so, even if it were creatively and economically feasible to produce highly targeted ads, the full potential is restricted by technological constraints. With real-time feedback, TV shows and advertisers can tailor content to target specific viewers, but are currently constrained by both costs and technology.
Still, new solutions are imminent. For example, AOL just launched Adap.tv, which provides a programmatic buying platform called Audience Path that enables the planning, purchase, and execution of ad campaigns across all digital screens. With real-time feedback and measurement, TV shows and advertisers can also change content, strategies, and programming on the fly. As an example, Oreo created a commercial and tweeted the graphic during Super Bowl 2013 to respond to a lighting outage in the stadium. Users may also change their content on the fly. In fact, Hulu already allows viewers to swap ads based on interest. One of the questions both TV producers and advertisers alike are interested in answering is, “how do we change or influence the behaviors of viewers in real time with programming?” As with online advertising, TV shows will soon be able to run experiments with manipulated content to understand the features that best drive viewer behaviors that TV shows and advertisers care most about, for example, purchasing advertised products.
The holy grail, of course, is that TV broadcasters and advertisers want to know their audiences better in order to sell products. We are seeing new devices that might make this option a reality in real time soon. Apple TV, Roku, and Google's Chromecast all offer Internet streaming options where connections to purchasing behavior can be made. Recently, Amazon entered the market with Amazon Fire TV, which will enable the company to sell their consumers more of nearly everything on Amazon during viewing. In addition to real-time predictions, broadcasters and advertisers want to predict future viewing and purchasing habits in order to plan production and advertising better. Entertainment systems like Xbox One that link millions of viewers and game players provide the potential for scalable solutions for TV as well, where individual level predictions for TV viewership can rely both individual level behaviors and the behaviors of the people viewers are connected to. Xbox One recently announced plans for many Social TV applications. Interactions with such applications will allow further real time feedback to TV. 29 We can measure what viewers are watching this week, but additional value results from predicting what these same viewers will be watching and buying in the future.
With all of these challenges and opportunities, the landscape is ripe to develop new methodologies that deal with the complications of data and TV measurement, while offering more efficient targeting options to advertisers. It is a great time to be a (big) data scientist looking for solutions to the TV audience measurement problem. There are big questions needing big data–driven solutions.
Footnotes
Author Disclosure Statement
No competing financial interests exist.