
Abstract
Abstract
The importance of healthcare improvement is difficult to overstate. This article describes our collaborative work with experts at Seattle Children's to create a prioritized improvement system using performance benchmarking. We applied analytics and modeling approaches to compare and assess performance metrics derived from U.S. News and World Report benchmarking data. We then compared a wide range of departmental performance metrics, including patient outcomes, structural and process metrics, survival rates, clinical practices, and subspecialist quality. By applying empirically simulated transformations and imputation methods, we built a predictive model that achieves departments' average rank correlation of 0.98 and average score correlation of 0.99. The results are then translated into prioritized departmental and enterprise-wide improvements, following a data to knowledge to outcomes paradigm. These approaches, which translate data into sustainable outcomes, are essential to solving a wide array of healthcare issues, improving patient care, and reducing costs.
Prioritized Improvements Using Performance Benchmarking
T
U.S. News and World Report (USNWR) provides one of the most popular performance benchmarks to measure and compare healthcare enterprises.5–9 USNWR's industry-wide surveys are an assessment of healthcare throughout the United States and include nearly 200 children's hospitals. As with any survey-based approach, it is not without its limitations; its adult hospital comparisons and its reputation component have been criticized and rebutted.10–12 Nevertheless, USNWR utilizes expert knowledge and annually readjusts the metrics, scores, and categories to improve the overall methodology and validity of the results.6,8–10 For example, during 2012 and 2013, USNWR benchmarking compared a wide range of metrics, including outcomes, management, structural and process parameters, survival rates, clinical practices, subspecialist quality, and availability.6,8,9
In this performance benchmarking, each U.S. children's hospital, including SC, is evaluated across 10 departments (medical service lines).5–9 Each department is scored based on specific criteria and measures relative to all the participating healthcare enterprises. If the departmental scores are in the top 10th percentile, the department receives 1 point; if its scores are in the top 5th percentile, the department receives 2 points.5,8–10 USNWR tallies all the departmental scores (points) to rank the entire enterprise.5,9 For example, in 2013 Departments A1 and A2 (department-coded IDs are used throughout the text) were in the top 5th and 10th percentiles, respectively, among similar departments nationwide (Table 1). As a result, their corresponding scores are 2 and 1, respectively. Department A3 was below the 10th percentile; thus, its score is zero.
First-tier (A) priority is in red; second-tier (B) priority is in blue.
No percent score increase required, maintain performance for goal(s).
How can these benchmarking metrics guide a healthcare enterprise in prioritizing performance improvements that lead to better outcomes and care in a cost-effective manner? At SC, these modified metrics (no reputation component) are employed as hospital-wide metrics to assess how SC performs relative to itself and to other hospitals. To identify and prioritize improvement targets, we modified metrics and estimated scores using data from USNWR benchmarking. Because the provided data are limited to the top 50 hospitals, we used imputation methods to estimate the missing values. 4 We then modeled all 10 departments' ranks and scores. By applying the empirically simulated transformation to the data, 4 we were able to accurately estimate departments' ranks and scores.
Several statistical metrics have been utilized to compare and validate our assessments, including residual mean squared error, mean absolute error, and average correlation. 4 Figure 1 illustrates simulated versus actual ranks for Department A2 (from Table 1) across the top 50 similar departments in the United States for 2012 (A) and 2013 (B), respectively. Interestingly, Department A2 improved its ranking from 8th in 2011 to 7th in 2012 and 6th in 2013. However, its scores did not change between the 5th and 10th percentiles. Although our robust approach produced similar results for all 10 departments, Department A2 was chosen as an example to be followed throughout the entire article. Overall, for both years, 2012 and 2013, we were able to achieve departments' average rank correlation of 0.98 and average score correlation of 0.99.
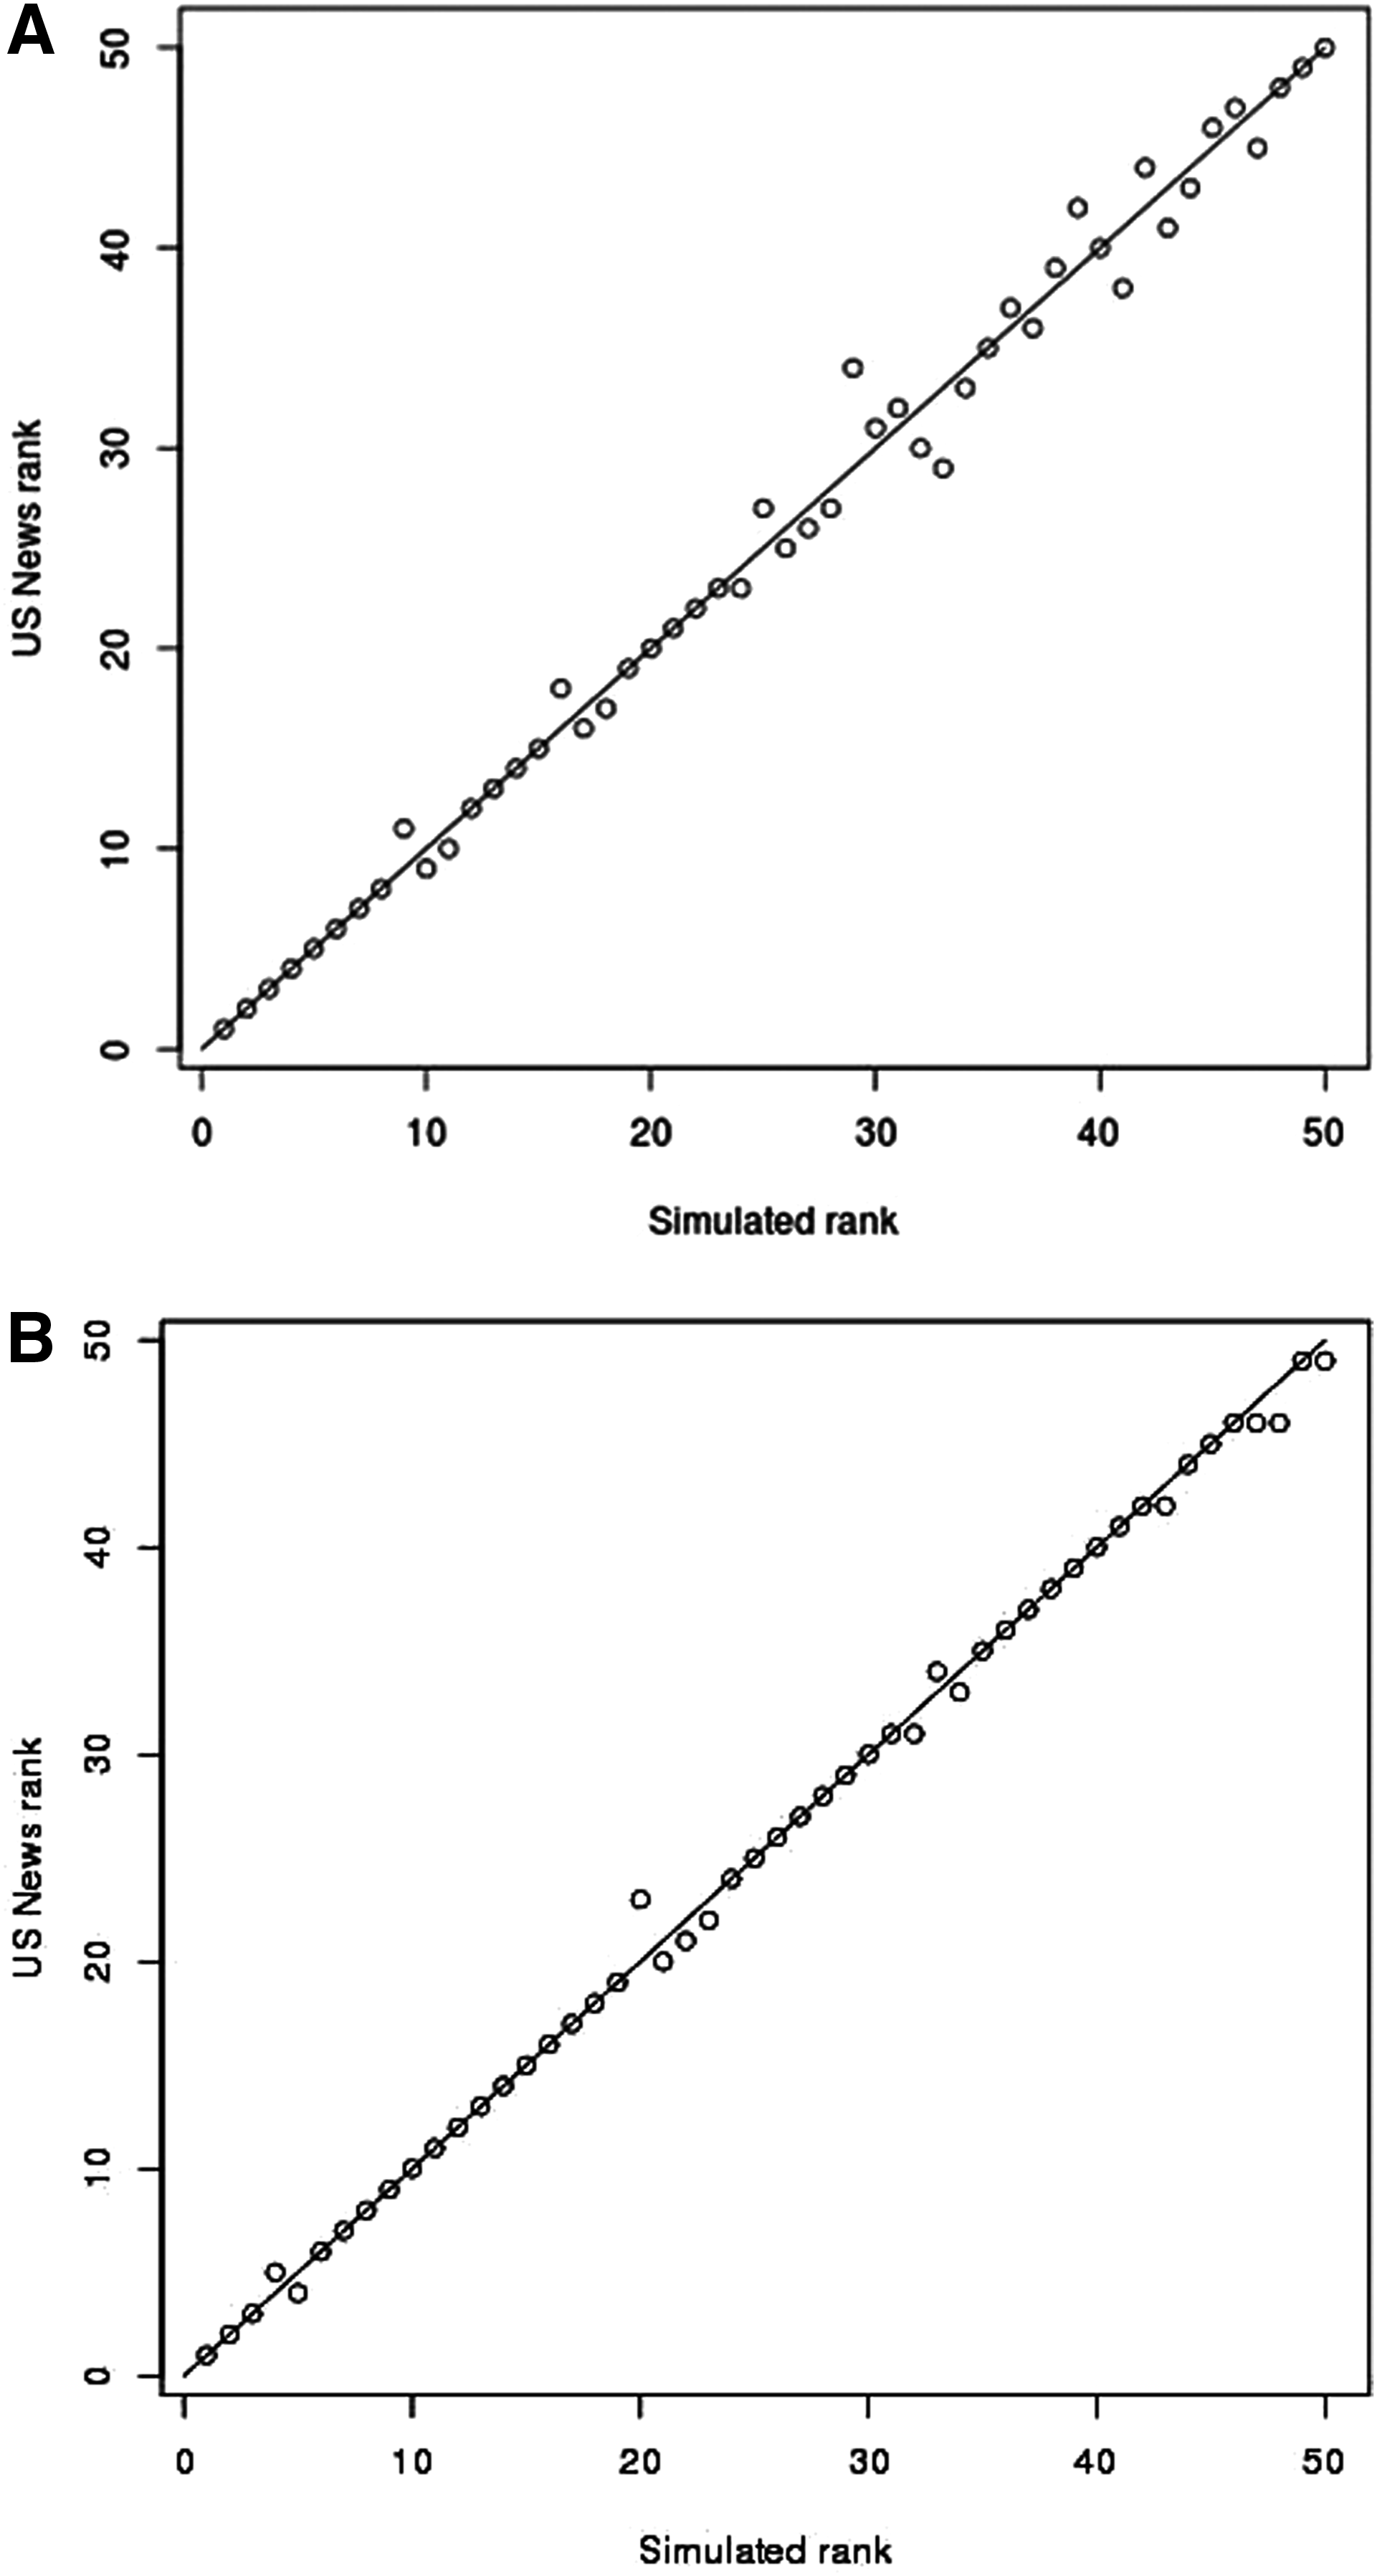
Model for Department A2.
The key deliverable was to determine which factors (categories, metrics) should be considered for further performance improvements and, in turn, which actions and implementation timelines to focus on. This benchmarking-based system is part of SC's enterprise-wide lean and continuous performance improvement processes that, among other things, employ two-tier recommendations, including goals and stretch goals for each department. For each department, we use USNWR's 10th and 5th percentile marks as the goals and stretch goals, respectively. By dividing the needed performance increases by the maximum possible increase, the quantitative performance improvements required for each department to achieve its goals, and stretch goals can be determined (Table 1).
The proposed performance benchmarking system allows great flexibility in choosing the priority departments. On the enterprise level, this improvement system enables executive leadership and key stakeholders to prioritize departments for increased focus. One possible approach to determine first-tier prioritized improvements is to consider all the departments that require performance increases under 5% (minimal improvement needed) to achieve either goal. Similarly, second-tier improvements can be considered as percentile increases between 5% and 10% (moderate improvement needed). Let us consider Departments A2, A4, and B1 (from Table 1). Department A2 needs to maintain or improve by 3.4% its overall performance to achieve its goal and stretch goal, respectively (second line, Table 1). Therefore, Department A2 is in the first-tier priority for 2013. Department A4 needs to improve its overall performance by 2.1% and 9.8% to achieve its goal and stretch goal, respectively (fourth line, Table 1). Similarly, Department A4 is the first-tier priority. However, Department B1 requires its overall performance to increase by 7.4% and 19.6% to achieve its goal and stretch goal, respectively (fifth line, Table 1). Therefore, Department A3 belongs in the second-tier priority.
Alternative approaches can also be considered, including employing an opposite approach of designating departments that need the greatest improvements as top priority. This approach would instead focus on Departments C1 and C2, which require the greatest performance improvements. Other approaches can focus on optimizing specific factors (performance metrics) or determining cost-effective goals.
The aforementioned approaches can also be implemented in prioritizing performance improvements within each department. A detailed, metrics-based analysis reveals specific categories (factors) for each department's improvement. Department A2 is illustrated in Table 2. For this department, a total of 100 points is necessary to reach its stretch goal for both 2012 and 2013. Department A2 already ranks between the 5th and 10th percentile (Table 1), so the department can reach its goal by maintaining its current top performance—a challenging requirement. Table 2 lists the maximal number of points that each category can contribute toward reaching the departmental stretch goal. The higher the number of points, the more room there is for improvement in that category (metrics). For Department A2, preventative measures and management, as well as operations and practices, are key to improving its performance and outcomes (Table 2).
Note that such improvements might not necessarily result in higher rankings for this department or for the entire enterprise. Other healthcare enterprises might improve their performances even more significantly, and USNWR might (and most probably will) readjust its metrics, measures, and categories. Nevertheless, the robust approach for a prioritized improvement system using benchmarking performance is worth considering. This system enables the formulation of specific, achievable, quantitative, and cost-effective goals and stretch goals for each department that, in turn, are crucial for the enterprise-wide performance improvement.
Summary
It is completely natural for each of us to form assumptions regarding the source of problems, but it is only by data-driven analysis that we can accurately identify the underlying issues and begin to solve them effectively. To make real and continuous improvements, we can look beyond department silos for patterns in data that are inevitably overlooked in our daily routines. Our challenge and opportunity is discovering how to mine and analyze the data and reach sustainable outcomes that can translate into solutions for the entire enterprise, improve patient care, and reduce costs. The described approach and its translation into a prioritized improvement system are representative of our current projects. The projects are primarily focused on people (patients and personnel), forecasting and prioritizing care and performance improvements, and identifying real problems and opportunities. They spot areas of verifiable concern and, in turn, can lay the foundation for the creation of accurate, actionable, and cost-effective solutions.
As this article illustrates, we applied analytics and modeling approaches to compare and assess a wide range of performance metrics. Following a data-to-knowledge-to-outcomes paradigm, the results have been translated into prioritized improvements. These approaches enable data-driven sustainable outcomes and are essential to improving enterprise performance, patient care, and cost reduction. Data can be very powerful when used to create a shared understanding and vision for driving organizational changes and making enterprise-wide improvements. Given that healthcare improvement has become both a national and global priority, we believe that data will become the single most important tool used by the healthcare system to drive meaningful and lasting change.
Footnotes
Acknowledgments
We are indebted to the exceptional members of the Predictive Analytics and Bioinformatics team. We would like to sincerely thank Winston Haynes, Roger Higdon, Elizabeth Montague, and Larissa Stanberry for analytics and modeling work, and Natali Kolker, Imre Janko, and William Broomall for operational and technical expertise. We also thank Rob Arnold, Roger Higdon, Maggie Lackey, Elizabeth Stewart, and Gregory Yandl for their critical reading of the article.
We thank all the above individuals for stimulating discussions, as well as Norman Beauchamp, Joe Bugajski, Gordon Cohen, Avery Comarow, David Cullen, Drexel DeFord, Douglas Hawkins, Chris Howard, Craig Jackson, Mark Lewin, Ryan Leininger, Andrew Lowe, Murray Olmsted, Vural Ozdemir, Gregory Redding, Cheryl Scott, Charles Smith, Peter Tarczy-Hornoch, and Gerald van Belle.
We especially thank SC executive leadership—our collaborators and sponsors on these projects: David Fisher, Mark Del Beccaro, Wes Wright, Bruder Stapleton, Steven Hurwitz, Sandy Meltzer, Judy Dougherty, Kelly Wallace, Lisa Brandenburg, Thomas Hansen, and James Hendricks.
Disclaimer
The content is solely the responsibility of the authors and does not necessarily represent the official views of Seattle Children's, University of Washington, or the Data-Enabled Life Sciences Alliance.
Author Disclosure Statement
No competing financial interests exist.