
Abstract
Abstract
With the increasingly widespread collection and processing of “big data,” there is natural interest in using these data assets to improve decision making. One of the best understood ways to use data to improve decision making is via predictive analytics. An important, open question is: to what extent do larger data actually lead to better predictive models? In this article we empirically demonstrate that when predictive models are built from sparse, fine-grained data—such as data on low-level human behavior—we continue to see marginal increases in predictive performance even to very large scale. The empirical results are based on data drawn from nine different predictive modeling applications, from book reviews to banking transactions. This study provides a clear illustration that larger data indeed can be more valuable assets for predictive analytics. This implies that institutions with larger data assets—plus the skill to take advantage of them—potentially can obtain substantial competitive advantage over institutions without such access or skill. Moreover, the results suggest that it is worthwhile for companies with access to such fine-grained data, in the context of a key predictive task, to gather both more data instances and more possible data features. As an additional contribution, we introduce an implementation of the multivariate Bernoulli Naïve Bayes algorithm that can scale to massive, sparse data.
Introduction
O
In this paper we will focus on a particular sort of data as being a reason for continued attention to scaling up. To highlight this sort of data, it is worthwhile to draw a contrast. Predictive modeling is based on one or more data instances for which we want to predict the value of a target variable. Data-driven predictive modeling generally induces a model from training data, for which the value of the target (the label) is known. These instances typically are described by a vector of features from which the predictions will be made. This is the setting we will consider. Now, the most common, tried-and-true predictive modeling formulation is to describe these instances with a small-to-moderate number—say, dozens up to hundreds—of features summarizing characteristics of the instances. For lack of a better term, let's call this the “traditional” setting, or more generally “traditional predictive analytics.” At the risk of oversimplifying for contrast, a key aspect of the traditional setting is that the dataset is dense—each instance has a non-trivial value for each feature (or at least for most of them).
Indeed, for many of the most common business applications of predictive analytics, such as targeted marketing in banking 3 and telecommunications, 4 credit scoring, 5 and attrition management, 6 the data used for predictive analytics are very similar. In these example applications, the features tend to be demographic, geographic, and psychographic characteristics of individuals, as well as statistics summarizing particular behaviors, such as their prior purchase behavior with the firm. 7 Recent work has shown that even with rich descriptive data, traditional predictive analytics may not receive much benefit from increasing data beyond what can currently be handled well on typical modern platforms. 3
“CERTAIN TELLING BEHAVIORS MAY NOT BE OBSERVED IN SUFFICIENT NUMBERS WITHOUT MASSIVE DATA.”
In contrast, big data thinking opens our view to nontraditional data for predictive analytics—datasets in which each data point may incorporate less information, but when taken in aggregate may provide much more.* In this article we focus on one particular sort of data: sparse, fine-grained feature data, such as that derived from the observation of the behaviors of individuals. In the context of behavior data, we can draw a contrast: we specifically do not mean data that are summaries of individuals' behaviors, as used traditionally, but data on the actual fine-grained behaviors themselves. Businesses increasingly are taking advantage of such data. For example, data on individuals' visits to massive numbers of specific web pages are used in predictive analytics for targeting online display advertisements.8–10 Data on individual geographic locations are used for targeting mobile advertisements. 11 Data on the individual merchants with which one transacts are used to target banking advertisements. 3 A key aspect of such datasets is that they are sparse: for any given instance, the vast majority of the features have a value of zero or “not present.” For example, any given consumer has not transacted with the vast majority of merchants, has not visited the vast majority of geographic locations, has not visited the vast majority of web pages, etc. Predictive modeling based on sparse, fine-grained (behavior) data is not a new phenomenon. Individual communications events have been used to improve targeting offers 4 and to predict customer attrition. 6 For two decades, fraud detection has been a popular application of predictive modeling, 12 where fine-grained behavioral data are also employed. Credit card companies, for example, use specific details from payment transaction data, and telco operators use specific locations and particular numbers called.
Despite research and development specifically geared toward sparse, high-dimensional data12–14 we do not yet have a large body of empirical results helping us to understand whether and when bigger data indeed are better for improving the generalization performance of predictive modeling for real-world applications. Some hints can be found in the literature. Perlich et al. 15 show increasing returns in generalization performance with increasingly larger data across dozens of datasets; however, although large for empirical machine learning studies at the time, the data sizes are not massive by present standards. Their largest dataset, which indeed shows increases to scale for over a million instances, is in fact a sparse (text) classification problem. Moreover, for the sort of linear models often used in business applications (viz., logistic regression), their results largely show the contrary: that massive data by and large do not provide additional improvements in predictive performance. On the other hand, Agarwal et al. 2 observe a noticeable drop in the performance of their proposed learning method after subsampling an online advertising dataset, leading to their conclusion that the entire training dataset is needed to achieve optimal performance. Martens and Provost 3 show similar results for predicting customer interest in new financial products. These two datasets are sparse.
Looking from a different angle, certain telling behaviors may not even be observed in sufficient numbers without massive data. 16 If in aggregate such rare-but-important behaviors make up a substantial portion of the data, due to a heavy tail of the behavior distribution, then again massive data may improve predictive modeling. Our experimental results below show that this indeed is the case for the sparse, fine-grained data we study.
This article makes two main contributions. The primary contribution is an empirical demonstration that indeed when predictive models are built from such sparse, fine-grained data, we continue to see marginal increases in predictive performance even to massive scale. The empirical results are based on data drawn from nine different predictive modeling applications.
The second contribution is a technical contribution: We introduce a version of Naïve Bayes with a multivariate event model that can scale up efficiently to massive, sparse datasets. Specifically, this version of the commonly used multivariate Bernoulli Naïve Bayes only needs to consider the “active” elements of the dataset—those that are present or non-zero—which can be a tiny fraction of the elements in the matrix for massive, sparse data. This means that predictive modelers wanting to work with the very convenient Naïve Bayes algorithm are not forced to use the multinomial event model simply because it is more scalable. This article thereby makes a small but important addition to the cumulative answer to a current open research question 17 : How can we learn predictive models from lots of data?
“WHEN DATA ARE DRAWN FROM HUMAN ACTIONS, NOISE RATES OFTEN ARE HIGH BECAUSE OF THE CEILING IMPOSED BY BEHAVIORAL RELIABILITY.”
Note that our use of Naïve Bayes should not be interpreted as a claim that Naïve Bayes is by any means the best modeling technique for these data. Other methods exist that handle large transactional datasets, such as the popular Vowpal Wabbit software based on scalable stochastic gradient descent and input hashing.2,18,19 Moreover, results based on Naïve Bayes are conservative. As one would expect theoretically 20 and as shown empirically, 15 nonlinear modeling and less-restrictive linear modeling generally will show continued improvements in predictive performance for much larger datasets than will Naïve Bayes modeling. (However, how to conduct robust, effective nonlinear modeling with massive high-dimensional data is still an open question.) Nevertheless, Naïve Bayes is popular and quite robust. Using it provides a clear and conservative baseline to demonstrate the point of the article. If we see continued improvements when scaling up Naïve Bayes to massive data, we should expect even greater improvements when scaling up more sophisticated induction algorithms.
These results are important because they help provide some solid empirical grounding to the importance of big data for predictive analytics and highlight a particular sort of data in which predictive analytics is likely to benefit from big data. They also add to the observation 3 that firms (or other entities) with massive data assets 21 may indeed have a considerable competitive advantage over firms with smaller data assets.
Sparse, Fine-Grained (Behavior) Data
As discussed above, it is clear from prior work that more data do not necessarily lead to better predictive performance. It has been argued that sampling (reducing the number of instances) or transformation of the data to lower dimensional spaces (reducing the number of features) is beneficial, 22 whereas others have argued that massive data can lead to lower estimation variance and therefore better predictive performance. 3 The bottom line is that, not unexpectedly, the answer depends on the type of data, the distribution of the signal (the information on the target variable) across the features, as well as the signal-to-noise ratio.
Therefore, we will focus on a certain sort of data: sparse, fine-grained data, such as data created by the detailed behavior of individuals. Such data from different domains have similar characteristics that would lead one to expect increasing benefits with very large data, an expectation that does not come with traditional data for predictive modeling. Modern information systems increasingly are recording fine-grained actions of individuals. As we use our telecommunications devices, make financial transactions, surf the Web, send e-mail, tag online photos, “like” postings, and so on, our behaviors are logged.
When data are drawn from human actions, noise rates often are high because of the ceiling imposed by behavioral reliability. 23 Social scientists have long argued that one way to circumvent the poor predictive validity of attitudes and traits is to aggregate data across occasions, situations, and forms of actions. 24 This provides an early suggestion that more (and more varied) data might indeed be useful when modeling human behavior data. The implication for predictive analytics based on data drawn from human behaviors is that by gathering more data over more behaviors or individuals (aggregated by the modeling), one could indeed hope for better predictions.
To show the actual predictive performance on these types of datasets in a realistic setting, we have gathered a collection of datasets representing such sparse, fine-grained feature information. Most of the datasets incorporate a task to predict some particular “target” characteristic based on features created from human behavior.
The Yahoo Movies dataset, † for which we are predicting the gender of the user, provides data on which movies each user has rated. In the Book-Crossing dataset, 25 the age of a user is predicted (higher or lower than the average age) based on the books rated. In the Ta-Feng dataset, ‡ age is predicted based upon which products are purchased. The Dating site describes user rating profiles on an online dating site, 26 for which we predict the gender of the users. The Flickr dataset also describes behavioral data 27 in the form of users “favoriting” pictures, and we predict whether each picture will be highly commented on or not (more or less than the dataset average). Nonbehavioral sparse data are captured in the URL dataset, where for each URL a large set of lexical and host-based features have been defined to predict whether a URL is malicious or not. 28 In the KDD Cup datasets we are predicting the performance of a student on a test, where a large number of binary features have been constructed based on other students answers. 29 Finally, one year of fine-grained payment transaction data is provided in the banking dataset, from consumers to merchants or other persons, to predict interest in a pension fund product (the payment receivers being the features). 3 Size characteristics of these datasets are listed in Table 1. The total number of elements in the traditional instance×feature matrix is the product of n and m (cf. Fig. 1); the “active” elements are those that actually have a value in the data.
“PEOPLE ONLY HAVE A LIMITED AMOUNT OF 'BEHAVIORAL CAPITAL'...WHEN THE TOTAL NUMBER OF POSSIBLE ACTIONS IS HUGE, ANY INDIVIDUAL ONLY CAN TAKE A VERY SMALL FRACTION OF ALL THE POSSIBLE ACTIONS.”
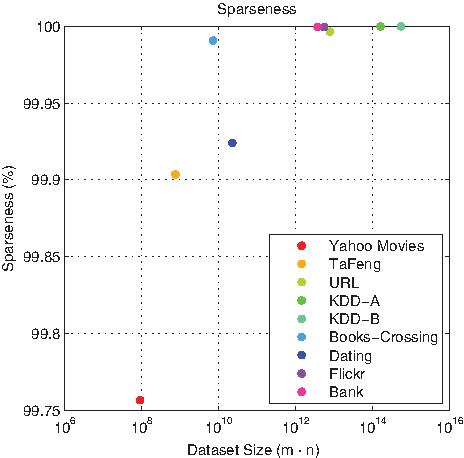
The sparseness is the percent of the entries that are not active (i.e., are zero) in the feature-vector matrix for each dataset. The horizontal axis represents the total size of the feature-vector matrix and the vertical axis shows the sparsensess. The sparseness increases (the density decreases) as the dataset size increases. Note the scale of the vertical axis.
The table reports the total number of active (non-zero) elements, the number of data instances, the number of features, the resultant sparseness for a traditional data matrix representation (fraction of matrix elements that are not active), and the target variable.
As shown in Table 1 and Figure 1, these datasets are quite sparse, and the sparseness increases as the datasets grow bigger. For behavioral data there is a clear explanation as to why the sparseness increases as dataset size increases. People only have a limited amount of “behavioral capital.” That is, any person only can take a limited number of actions. Most importantly here, when the total number of possible actions is huge, any individual only can take a very small fraction of all the possible actions. Increasing the dataset size may increase the total number of behaviors observed across all individuals, but increasing the dataset size will not increase an individual's behavioral capital. Concretely, there are only so many movies one can see (Yahoo Movies dataset), products one can buy (Bank dataset), or pictures one can favorite (Flickr dataset). The actual amount depends on the application context, but in every case the amount of behavioral capital is finite and is more or less constant. Therefore, the density of the actions in a traditional dataset formulation, such as the user-by-action matrix, will tend to decrease as the dataset size increases. This sparseness provides a key to efficient predictive modeling from massive data. It also provides a key reason why massive data are crucial to effective predictive modeling in these domains.
Predictive Techniques for Analyzing Fine-Grained Behavior Data
For the experiments we report, we use the Naïve Bayes classifier to learn models and to make predictions. Despite its simplicity, Naïve Bayes has been shown to have surprisingly good performance on sparse datasets. A very attractive property of Naïve Bayes is that it is extremely fast to run on a large, sparse dataset when it is formulated well. The main speedup stems from the fact that Naïve Bayes completely ignores interfeature dependencies by assuming that the within-class covariances of the features are zero. Combining this “naïve” assumption with Bayes' rule for conditional probability produces the following formulation:
There are a several variants of Naïve Bayes in common use, which differ in their calculation of the conditional probabilities. Each of these variants assumes a different event model, which postulates how the features from the data were generated. 30 The two most popular choices are the multivariate and the multinomial event models. The reader is referred to the appendix and to the literature 30 for details, but the main idea behind the multinomial event model is that each input sample results from a series of independent draws from the collection of all features. The main advantage of this model is that it requires only computing over those features that have a count that is nonzero. For a sparse dataset, this results in a huge reduction in run time since all the zeros can be ignored. Although results have shown this multinomial Naïve Bayes to be superior to the multivariate event model (described next) for text mining, the multinomial model makes the generative assumption that the features are drawn with replacement, which is not well specified for most binary feature data (although the multinomial model is used commonly in practice for binary data). The multinomial model further makes the implicit assumption that the number of draws in the generative model is independent of the class, which roughly implies in our setting that each instance contains on average the same number of active features (behaviors) per class, which might not be true for the datasets that we are considering. Therefore, it is helpful to consider the multivariate model as well, even though the traditional formulation is not efficient for massive datasets.
“IS IT WORTH UNDERTAKING THE INVESTMENT TO COLLECT, CURATE, AND MODEL FROM LARGER AND LARGER DATASETS?”
The multivariate event model takes the point-of-view that the features are generated according to an independent Bernoulli process with probability parameters θj for class C (see the appendix and the literature 30 for technical details).
Unfortunately, the usual multivariate formulation does not have the same attractive sparsity properties as the multinomial formulation. In the Appendix we present an alternative, equivalent formulation that circumvents the need to consider the massive number of inactive elements for binary classification problems containing only Boolean-valued features (which is the case in all our datasets). The implementations can be obtained from the authors.**
Bigger Is Better (Volume)
We now can ask: when using sparse fine-grained (behavior) data as features, do we indeed see increasing predictive performance as the training dataset continues to grow to massive size? We present the results of experiments examining this question on our datasets. The results are shown in Figure 2.
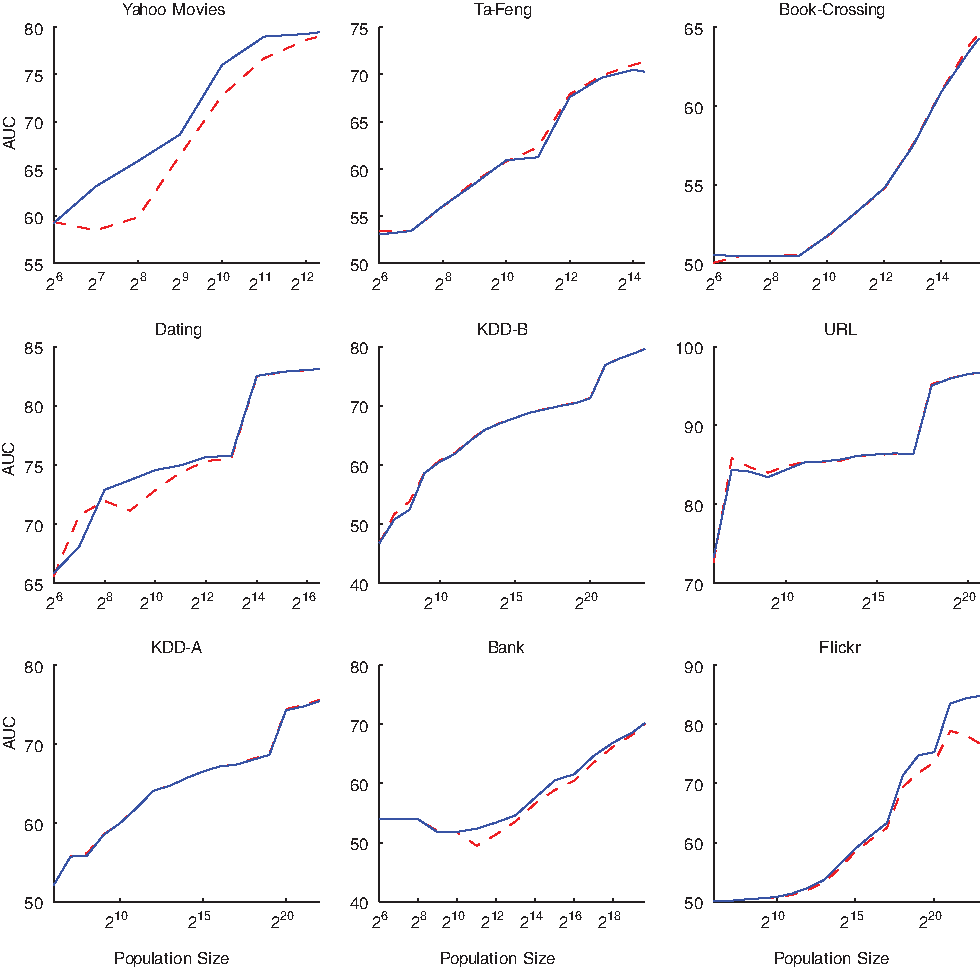
Learning curves for the multivariate (solid, blue) and multinomial (dashed, red) Naïve Bayes variants. For all of the datasets, adding more data (x-axis) leads to continued improvement of predictive power (area under the curve [AUC]).
To determine whether bigger volumes indeed lead to better performance, we built learning curves for each dataset. 15 Learning curves are an important tool for model analytics, as they help an organization decide how to invest in its data assets. 21 In particular, is it worth undertaking the investment to collect, curate, and model from larger and larger datasets? Or will a sample of the data be sufficient for building predictive models.
Specifically, our learning curves are built for each dataset via a series of experiments that simulated different data sizes by sampling (uniformly at random) increasingly larger amounts of data from the original datasets, training a predictive model for each of these datasets, and estimating its generalization performance using standard predictive modeling holdout evaluation (viz., computing averaged areas under the receiver operating characteristic curve via five-fold cross-validation 21 ).
As Figure 2 shows, for most of the datasets the performance keeps improving even when we sample more than millions of individuals for training the models. One should note, however, that the curves do seem to show some diminishing returns to scale. This is typical for the relationship between the amount of data and predictive performance, especially for linear models. 15 The marginal increase in generalization accuracy decreases with more data for several reasons. First, there simply is a maximum possible predictive performance (the “Bayes rate”) due to the inherent randomness in the data and the fact that accuracy can never be better than perfect. Second, modeling (especially linear modeling) tends to find the larger generalities first; modeling with larger datasets usually helps to work out nuances, “small disjuncts,” and other nonlinearities that are difficult or impossible to capture from smaller datasets.1,15
What is surprising here is that, even for this simple, linear model, a ceiling on generalization accuracy is not reached even after sampling a very large number of data points. We would expect more sophisticated modeling procedures (esp., non-linear methods) to extend the advantages with larger data.15,20
Interestingly, the multinomial Naïve Bayes did not perform better than the multivariate model for these datasets, contrary to results reported for text mining. 30 In fact, for these datasets, the multivariate event model sometimes outperformed the multinomial event model. Recall that the multinomial model makes the additional assumption that the numbers of observations made per subject are independent of the subjects' classes. Therefore, our introduction of an efficient big data implementation of multivariate Naïve Bayes is not just of theoretical interest. These results show that it should be included as an alternative in practice.
Fine-Grained Behavior Data Have Massive Feature Sets
As discussed briefly above, fine-grained behavior data often have massive numbers of possible features that predictive modeling may incorporate. In these domains, there simply are a very large number of different possible behaviors. When examining the importance of data size, separate for the moment from the question of predictive modeling, it is interesting to examine whether we need to observe large numbers of individuals even simply to see all the different possible behaviors. The notion of limited behavioral capital would suggest so.
“WE WOULD LIKE TO BELIEVE THAT INDEED, MORE VARIETY IN THE FEATURES OUGHT TO LEAD TO RICHER MODELS WITH BETTER PREDICTIVE ABILITY.”
Figure 3 examines this empirically for the Flickr dataset (the other datasets show similar patterns). Figure 3 plots the number of behaviors observed as more and more instances are added to the data (uniformly at random). As we expect, with few data instances, given the very sparse data only a portion of the behaviors will be revealed. (Realize of course that the behaviors we see here are not the total set of behaviors, but only those revealed by the individuals in our data.)
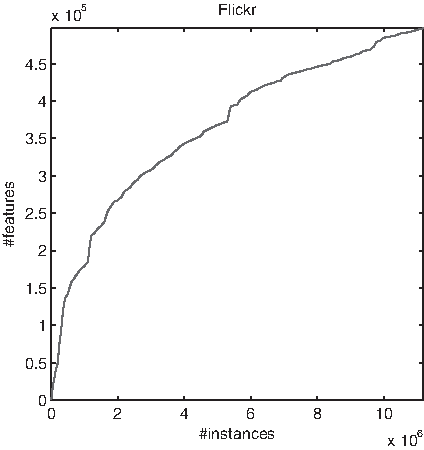
The number of features (behaviors) that have been observed (i.e., are present for at least one data instance), as the number of data instances is increased.
Bigger Is Better (Variety)
The experiments reported above demonstrate the improvement in predictive modeling accuracy from increasing the number of instances (individuals) observed. An alternative perspective on increasing data size is to consider a fixed population of individuals and increase the number of different possible data items (features, signals, behaviors) about each of them that are collected, stored, or utilized.
We would like to believe that indeed, more variety in the features ought to lead to richer models with better predictive ability. Intuitively it might make sense that adding more features to our total set of possible features would increase predictive performance, but this seems contrary to the long tradition of (and vast amount of research on) “feature selection” for predictive modeling. Therefore, we should think carefully about what are the deeper motivations for feature selection and whether we believe that they indeed apply in our context.
Feature selection is employed for at least two interrelated reasons. First, technically, larger feature sets lead to higher variance in predictive modeling 31 and relatedly increase overfitting, 21 and thereby can increase prediction error. Second, in many applications there are only a few important features among a large number of irrelevant features. The large number of irrelevant features simply increases variance and the opportunity to overfit, without the balancing opportunity of learning better models (presuming that one can actually select the right subset). Domains with this structure (many irrelevant variables) are the motivation behind the development of many feature selection techniques, both explicit (e.g., filter and wrapper methods 22 ) and implicit (e.g., via L1 regularization 31 ).
This line of reasoning does not provide such clear motivation in domains with a different “relevance structure” to the features. If most of the features provide a small—but nonzero—amount of additional information about the target prediction, then selecting a small set of features is not ideal. (If one has only a small number of instances, feature selection may be practically necessary, but that is a different story.) When presented with many low-signal but possibly relevant features, when there also are many instances, predictive modeling may benefit from a large number of features. ††
We can argue intuitively that fine-grained behaviors ought to provide such underlying relevance structures: If the target prediction is related to the same internal factors that drive the fine-grained behaviors, each should provide a little more information toward predicting the target concept. For example, if we are predicting the likelihood that an individual will respond positively to an advertisement from a particular brand or an offer for a particular product, that individual's taste is a key internal factor. If we have created features based on other signals of consumer taste, such as the web pages or the merchants that an individual frequents, each of these features may have a small amount of additional information and in total may give better predictions than simply choosing a small set of the best signals.
Our goal in this article is not to determine how best to model these domains, as there are a tremendous number of factors to consider, nor how best to perform feature selection. Nevertheless, as a follow-up analysis to our main results, let us consider how easy it is in our set of domains to approximate the true underlying knowledge based on a substantially smaller dataset via feature selection. If we can do this, it would mean that most of the features actually do not contain any meaningful information (or at least none that our methods can find). As a first, simple analysis, we conducted an experiment in which we repeatedly sampled increasing numbers of features (uniformly at random) from the entire feature set and learned a predictive model from the reduced representation. The result (for the Flickr dataset) is shown in Figure 4 (upper graph), where the predictive performance is shown for different numbers of features (over multiple repetitions of the experiment for stability in the results). The graph clearly shows that including random subsets of the features results in a disastrous performance drop.
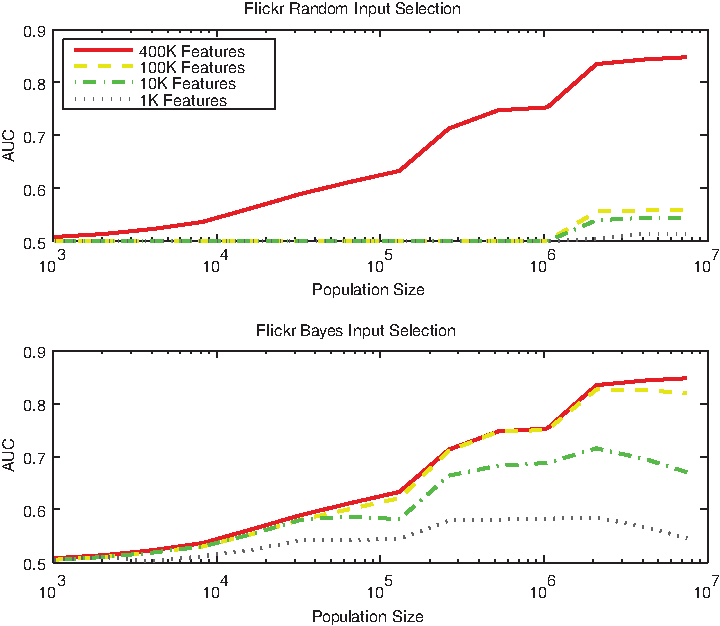
Learning curves with increasing numbers of features: sampled randomly (top) and using a posteriori information (bottom).
The foregoing result, selecting features at random, provides a lower bound. One cannot simply use a random subset of the features. This shows that for these datasets, the behavior data do not contain a large amount of overlapping information that is predictive of the target. However, it still may be the case that there is a small set of informative behaviors, and that those are all we need to build accurate predictive models.
As alluded to above, there exist many ways to perform intelligent feature or “input” selection. Our purpose is not to find the best feature selection methods for these data, or to perform a large comparative study of feature selection. (Moreover, many of the classic feature selection techniques do not work on data of this magnitude in a reasonable amount of time.)
Ideally we would like to complement the lower bound provided by the random selection above with an approximate upper bound. Specifically, if we knew a priori which small set of features mattered (e.g., if they were provided by an omniscient oracle), how close would be the predictive accuracy to that obtained using all the features? Unfortunately, conducting such a study is far beyond the scope of this article. Optimal feature selection itself is a big data problem in such domains; further, using Naïve Bayes we would not be able to determine a true upper bound on what would be possible using more sophisticated, non-linear modeling (cf., the striking differences in the learning curves for the linear and non-linear models shown by Perlich et al. 15 )
Nonetheless, it is useful to examine the results of a moderately intelligent selection of feature subsets, tailored to the modeling we perform. Specifically, given that we have learned Naïve Bayes models from all the data already, we can approximate the “best” feature set for each dataset by choosing the features which have the largest a posteriori marginal correlations with the target—in our case, the a posteriori marginal probabilities in each Naïve Bayes model. Let's call this Naïve Bayes feature selection.
As can be seen from the resulting graph on the same dataset (Flickr in Fig. 4, lower graph), the results are much better with Naïve Bayes feature selection. Nevertheless, despite this improved performance, this approximate upper bound still is substantially below the performance with the full feature set, up until the reduced feature set is itself massive (in this case, 100K features instead of 400K features).
“THIS PROVIDES ONE OF THE CLEAREST ILLUSTRATIONS THAT LARGER DATA ASSETS ARE INDEED MORE VALUABLE.”
Returning to the main contribution of the article, the results in Figure 4 reiterate that we cannot easily achieve top-notch predictive performance without massive numbers of instances. Thus, even when reducing the feature set somewhat, bigger still is better.
Final Words
Our main contribution is to provide empirical support that when mining sparse, fine-grained data, we do indeed continue to see increasing predictive performance from more data as the datasets become massive. This holds even for simple, linear models; the increases with larger data should be even greater as technical and theoretical advances allow us to build effective non-linear models from massive, sparse, noisy data. As a second, technical contribution, we provide an implementation of multivariate Naïve Bayes that can mine massive, sparse data extremely efficiently.
These results are not only of interest to pundits preaching about the value of big data, but also have important implications for businesses and other institutions faced with competition. We have shown that predictive modeling with large, transactional data can be made substantially more accurate by increasing the data size to a massive scale. This provides one of the clearest illustrations (of which we are aware) that larger data assets are indeed potentially more valuable 21 when it comes to predictive analytics. This implies that institutions with larger data assets—plus the ability to take advantage of them—potentially can obtain substantial competitive advantage over institutions without access to so much data, or without the ability to handle it.
Compare our results with the results of the study conducted by economist Prasanna Tambe of NYU's Stern School, which examined the extent to which big data technologies seem to help firms. 32 As described by Provost and Fawcett, 21 Tambe finds that, after controlling for various possible confounding factors, using big data technologies is associated with significant additional productivity growth. Specifically, one standard deviation higher utilization of big data technologies is associated with 1%–3% higher productivity than the average firm; one standard deviation lower in terms of big data utilization is associated with 1%–3% lower productivity. This leads to potentially very large productivity differences between the firms at the extremes.
Our results suggest that it is worthwhile for companies with access to such fine-grained data, in the context of a key predictive task, to gather data both on more data instances and on more possible features. For example, for an online advertising company that uses web page visitation data to target online ads, it is worthwhile to invest in additional data to increase the number of features—to see even more web pages a user visits. Such an online advertising company may also decide to diversify the sort of behavioral signals it collects, for example, by acquiring a mobile targeting company and collecting behavior on location visitations in addition to web page visitations. 33 It is worthwhile for two or more smaller banks to consider pooling their customer transaction data for better targeting, credit scoring, or fraud detection (and dealing with the obvious privacy concerns of such an endeavor), if each is faced with a large competitor. Similarly, it may be beneficial for two telco operators to pool their location visitation data for improved fraud detection. Another example implication is that a social network site with more users and more “likes” or “checkins” has a significant competitive advantage when it comes to using predictive modeling to target ads.
It is important not to interpret these results as indicating that all one needs to do is to apply Naïve Bayes to sparse, fine-grained data and one will be competitive in predictive analytics. These results are a demonstration that for predictive analytics with sparse, fine-grained data, even with simple models it indeed can be valuable to scale up to millions of instances and millions of features. Importantly, we have not shown that the benefit of increasing data size is unbounded. Nonetheless, looking forward, increases in value may continue for data that are orders of magnitude larger, especially as our ability to build non-linear models with such data improves. On the other hand, the evidence provided in this article notwithstanding, it is important for organizations to conduct their own analyses of whether and how the value of their data assets scales to massive data, 21 for example by building problem- and model-specific learning curves.
It also is important to keep in mind that achieving business value from massive, sparse, fine-grained data can be quite complicated (see, e.g., Perlich et al. 9 ). Developing a world-class data science team is essential, and even the best data scientists in the world do not yet know how best to build complex predictive models from this sort of massive data.17,19
Footnotes
Acknowledgments
Our sincere thanks to Brian Dalessandro, Tom Fawcett, and John Langford for their helpful comments on a prior draft manuscript; these improved the article substantially. Our thanks also to Brian, Tom, John, Josh Attenberg, Jessica Clark, Claudia Perlich, and Marija Stankova for many discussions of predictive analytics from sparse, massive-dimensional data. Foster Provost thanks NEC for a Faculty Fellowship.
Author Disclosure Statement
F.P. is the author of the book, Data Science for Business.
Appendix: Multivariate Bernoulli Naïve Bayes for Big Data
In the case of classification of high-dimensional sparse data, we can achieve computational time reductions for Naïve Bayes by reformulating the calculation all of the probabilities in terms of only the active (non-zero) elements of the data matrix. Specifically, let us denote the i-th instance in the dataset as
The Multivariate Bernoulli event model assumes that the data are generated according to a Bernoulli process. This is in fact a compound assumption consisting of the following three components:
1. The problem is binary classification. 2. The data are generated i.i.d. 3. The features can only take on a distinct number of discrete levels (e.g. 0 and 1). We will assume they are binary.
These assumptions enable very fast calculation of the empirical probabilities encountered when computing the class probability of an instance. If the data were generated by independent Bernoulli processes with probability parameters θ j for class C, we ought to see that:
We can then determine the log likelihood of the combination of all of the probabilities gathered in probability vector
Where L(
For computational reasons, this is usually reformulated as:
This corresponds to assuming a Laplacian prior on the probability in a Bayesian setting. Similarly, we can derive that:
This leads to the most common formulation of the Naïve Bayes classifier.
Revealing the following log likelihood for an instance
With:
For a dataset with
Note that a separate problem with computing and using Naïve Bayes estimates in practice is that often the exponentials to be calculated to recover the probabilities are so small that they cannot be represented by a computer using double precision. One example of avoiding the exponentials is to compare the ratio of the probabilities instead of the actual probabilities, 34 computing a score such as:
This value can be interpreted as being proportional to Kononenko's information gain of choosing one class over the other. In summary, this implementation of multivariate Bernoulli Naïve Bayes under the binary assumptions can be calculated very fast as they only require one pass over each of the active elements of the instances for training as well as in use.
*
Predictive modeling of properties of text documents is a shining instance of a nontraditional predictive modeling application that has seen moderately broad application. In fact, predictive modeling with text is quite similar to the sort of predictive modeling that is the focus of this article.
††
One might observe that instead of feature selection, when faced with such problems, one should engage in more sophisticated dimensionality reduction, such as via methods for matrix factorization. This may indeed allow the construction of predictive models with fewer direct features. However, in the context of our current discussion, this begs the question—one must process all the relevant features in the dimensionality reduction, and one must process all the features to create the values along the reduced dimensions in order to apply the resultant model(s).