
Abstract
Abstract
Children with special healthcare needs (CSHCN) require health and related services that exceed those required by most hospitalized children. A small but growing and important subset of the CSHCN group includes medically complex children (MCCs). MCCs typically have comorbidities and disproportionately consume healthcare resources. To enable strategic planning for the needs of MCCs, simple screens to identify potential MCCs rapidly in a hospital setting are needed. We assessed whether the number of medications used and the class of those medications correlated with MCC status. Retrospective analysis of medication data from the inpatients at Seattle Children's Hospital found that the numbers of inpatient and outpatient medications significantly correlated with MCC status. Numerous variables based on counts of medications, use of individual medications, and use of combinations of medications were considered, resulting in a simple model based on three different counts of medications: outpatient and inpatient drug classes and individual inpatient drug names. The combined model was used to rank the patient population for medical complexity. As a result, simple, objective admission screens for predicting the complexity of patients based on the number and type of medications were implemented.
Introduction
H
MCCs require a disproportionate amount of hospital resources. For example, one study of hospital discharge records in Ontario, Canada, found that children with medical complexity had a median of 13 outpatient physicians and 6 distinct subspecialists. 4 Another study found that pediatric patients with medically extreme “catastrophic” disease (excluding malignancy) constitute 0.4% of the population enrolled in the Washington state health plan yet were responsible for 24% of pediatric inpatient charges. 5 MCCs are also more likely to have an adverse event when hospitalized 6 and more likely to have frequent readmissions. 7 This is a major concern to children's hospitals because, although the Centers for Medicare & Medicaid Services are currently only penalizing adult hospitals for high readmission rates as part of the U.S. Patient Protection and Affordable Care Act's Hospital Readmission Reduction Program, federal policies for adult hospitals have been extended to children's hospitals in the past. 8 This policy extension has the potential to disproportionately affect hospitals with larger populations of MCCs. An examination of admittance rates found that between 2004 and 2009 the cumulative rate of hospitalization for MCCs rose 32.5%. 9
This growing demand for resources shows a clear need to identify and manage the care of MCCs. Coordinated managed care of MCCs can improve outcomes and reduce healthcare costs.10,11 Furthermore, forecasting the numbers of MCCs and other patient groups can enable predictions of hospital occupancy, economic resource utilization, and outcomes.12–14 Identifying MCCs at admission can guide treatment decisions, psychosocial interventions, and strategic planning at institutional and governmental levels. 15
“IDENTIFYING MCCS AT ADMISSION CAN GUIDE TREATMENT DECISIONS, PSYCHOSOCIAL INTERVENTIONS, AND STRATEGIC PLANNING AT INSTITUTIONAL AND GOVERNMENTAL LEVELS.”
One major problem inhibiting care management of MCCs is the lack of a clear definition of MCCs. The definition and even the label of medical complexity is challenging and evolving with such variations as “children with” complex medical needs, complex medical conditions, complex chronic conditions, or complex health conditions. 16 It is imperative to establish such a standard as it would allow research studies to be reproducible and comparable, and integrated patient care to be targeted to those who need it.
Such a definition would also support efforts to determine a simple, robust, and rapid way of identifying MCCs upon admission in order to provide the best possible care as soon as they are admitted. Classifying patients by complexity has been done from insurance claim information. 17 At Seattle Children's Hospital (SCH), a medically complex child is defined as a patient who has two or more chronic conditions, with some exceptions for extremely complex single-condition patients. 18 These definitions, however, require a thorough review of the medical history and require data not available at admission. To be useful and applicable in hospital settings, the admissions stage screening should be simple and accurate and utilize patient information upon admission as well as previous records.
Further complicating the analysis of MCCs is the scale and complexity of hospital databases. A medical record of any single patient may have hundreds if not thousands of associated variables, and this complexity is multiplied many fold for MCCs. In addition, the data are longitudinal, and measurements, procedures, medications, and medical tests may not be applied or recorded consistently as the database evolves. Extraction, standardization, and analysis of these data require considerable resources and expertise. 19
To manage the complexity of care and data involved with MCCs, it is necessary to identify them early in the treatment process through some type of screening. Previous efforts have identified variables associated with medical complexity in adult patients, including length of stay, number of days with laboratory tests, number of days with diagnostic procedures, number of consultations by specialists, and number of nonstandard nurse interventions. 20 In addition, the number of medications at admission, the number of medications during hospital stay, and the number of medications at discharge were found to be significantly correlated with the risk for extended hospital stay. 21 A manual screen for complexity in adults based on these predictors has been developed and tested in Europe. 22
The need for a simple screen and the observation that medication usage is associated with MCC status led to assessing whether the patient data gathered during the admission process—in particular, the patient's medication data—can rapidly predict MCC status. The number and type of medications were found to be informative predictors of MCC status. These findings were used by SCH to create a ranking system that identified patients for MCC evaluation utilizing the number of patient medications. The ranking system was incorporated into standard operating procedures to enable improved care and resource optimization. In what follows, we describe the methodology used in the analysis and compare competing models.
Patients and Methods
Population
This project was primarily carried out by the Predictive Analytics Group at SCH. SCH is the tertiary referral center (inpatient and ambulatory clinics) for a four-state region (Washington, Alaska, Montana, and Idaho) and the primary pediatric inpatient hospital for the Puget Sound area of Washington state. A basic unit of analysis is a patient, not a visit; a patient with multiple admissions in a year is considered a single count. Individual patients were selected using nonduplicative patient identifiers that were matched to medical record numbers. We excluded data from admissions that lasted less than 24 hours, such as patients admitted for observation or for day surgery. During our study, there were 7,916 individual children admitted to SCH. For our primary analysis, MCCs totaled 263 and non-MCCs totaled 7,653. Our analysis included patients later deceased (5 MCCs and 96 non-MCCs). The demographics of the patients are described in Table 1. The Institutional Review Board at SCH approved our protocol (no. 12509).
Clinical data
The records were manually curated to determine MCC status through use of diagnostic codes to identify patients with at least two chronic conditions or extremely complex cases with a single chronic condition. 18 This approach was considered to be the most likely to give an accurate accounting of status given the complexity and variability of the data. Details about the medication data and the flow of analysis are shown in Figure 1. Demographic and clinical data including the medication dataset for all outpatient and inpatient drug orders were recorded in the clinical database (Cerner Millennium®). The inpatient record tends to be more complete, as all orders are entered through computerized provider order entry and the integrated pharmacy system (PharmNet®, Cerner Millenium). Outpatient (ambulatory) orders include self-reported historical medications obtained at admission, including prescription, over-the-counter medications and supplements. However, because the patients cared for at SCH are not a captured population, the outpatient medication records do not contain every medication the patients may have received from their primary care providers. We considered outpatient and inpatient medication records separately. By dividing the medical record into inpatient and outpatient categories, we buffer our analysis from a loss of power that might result if one of the categories produced particularly poor predictors.
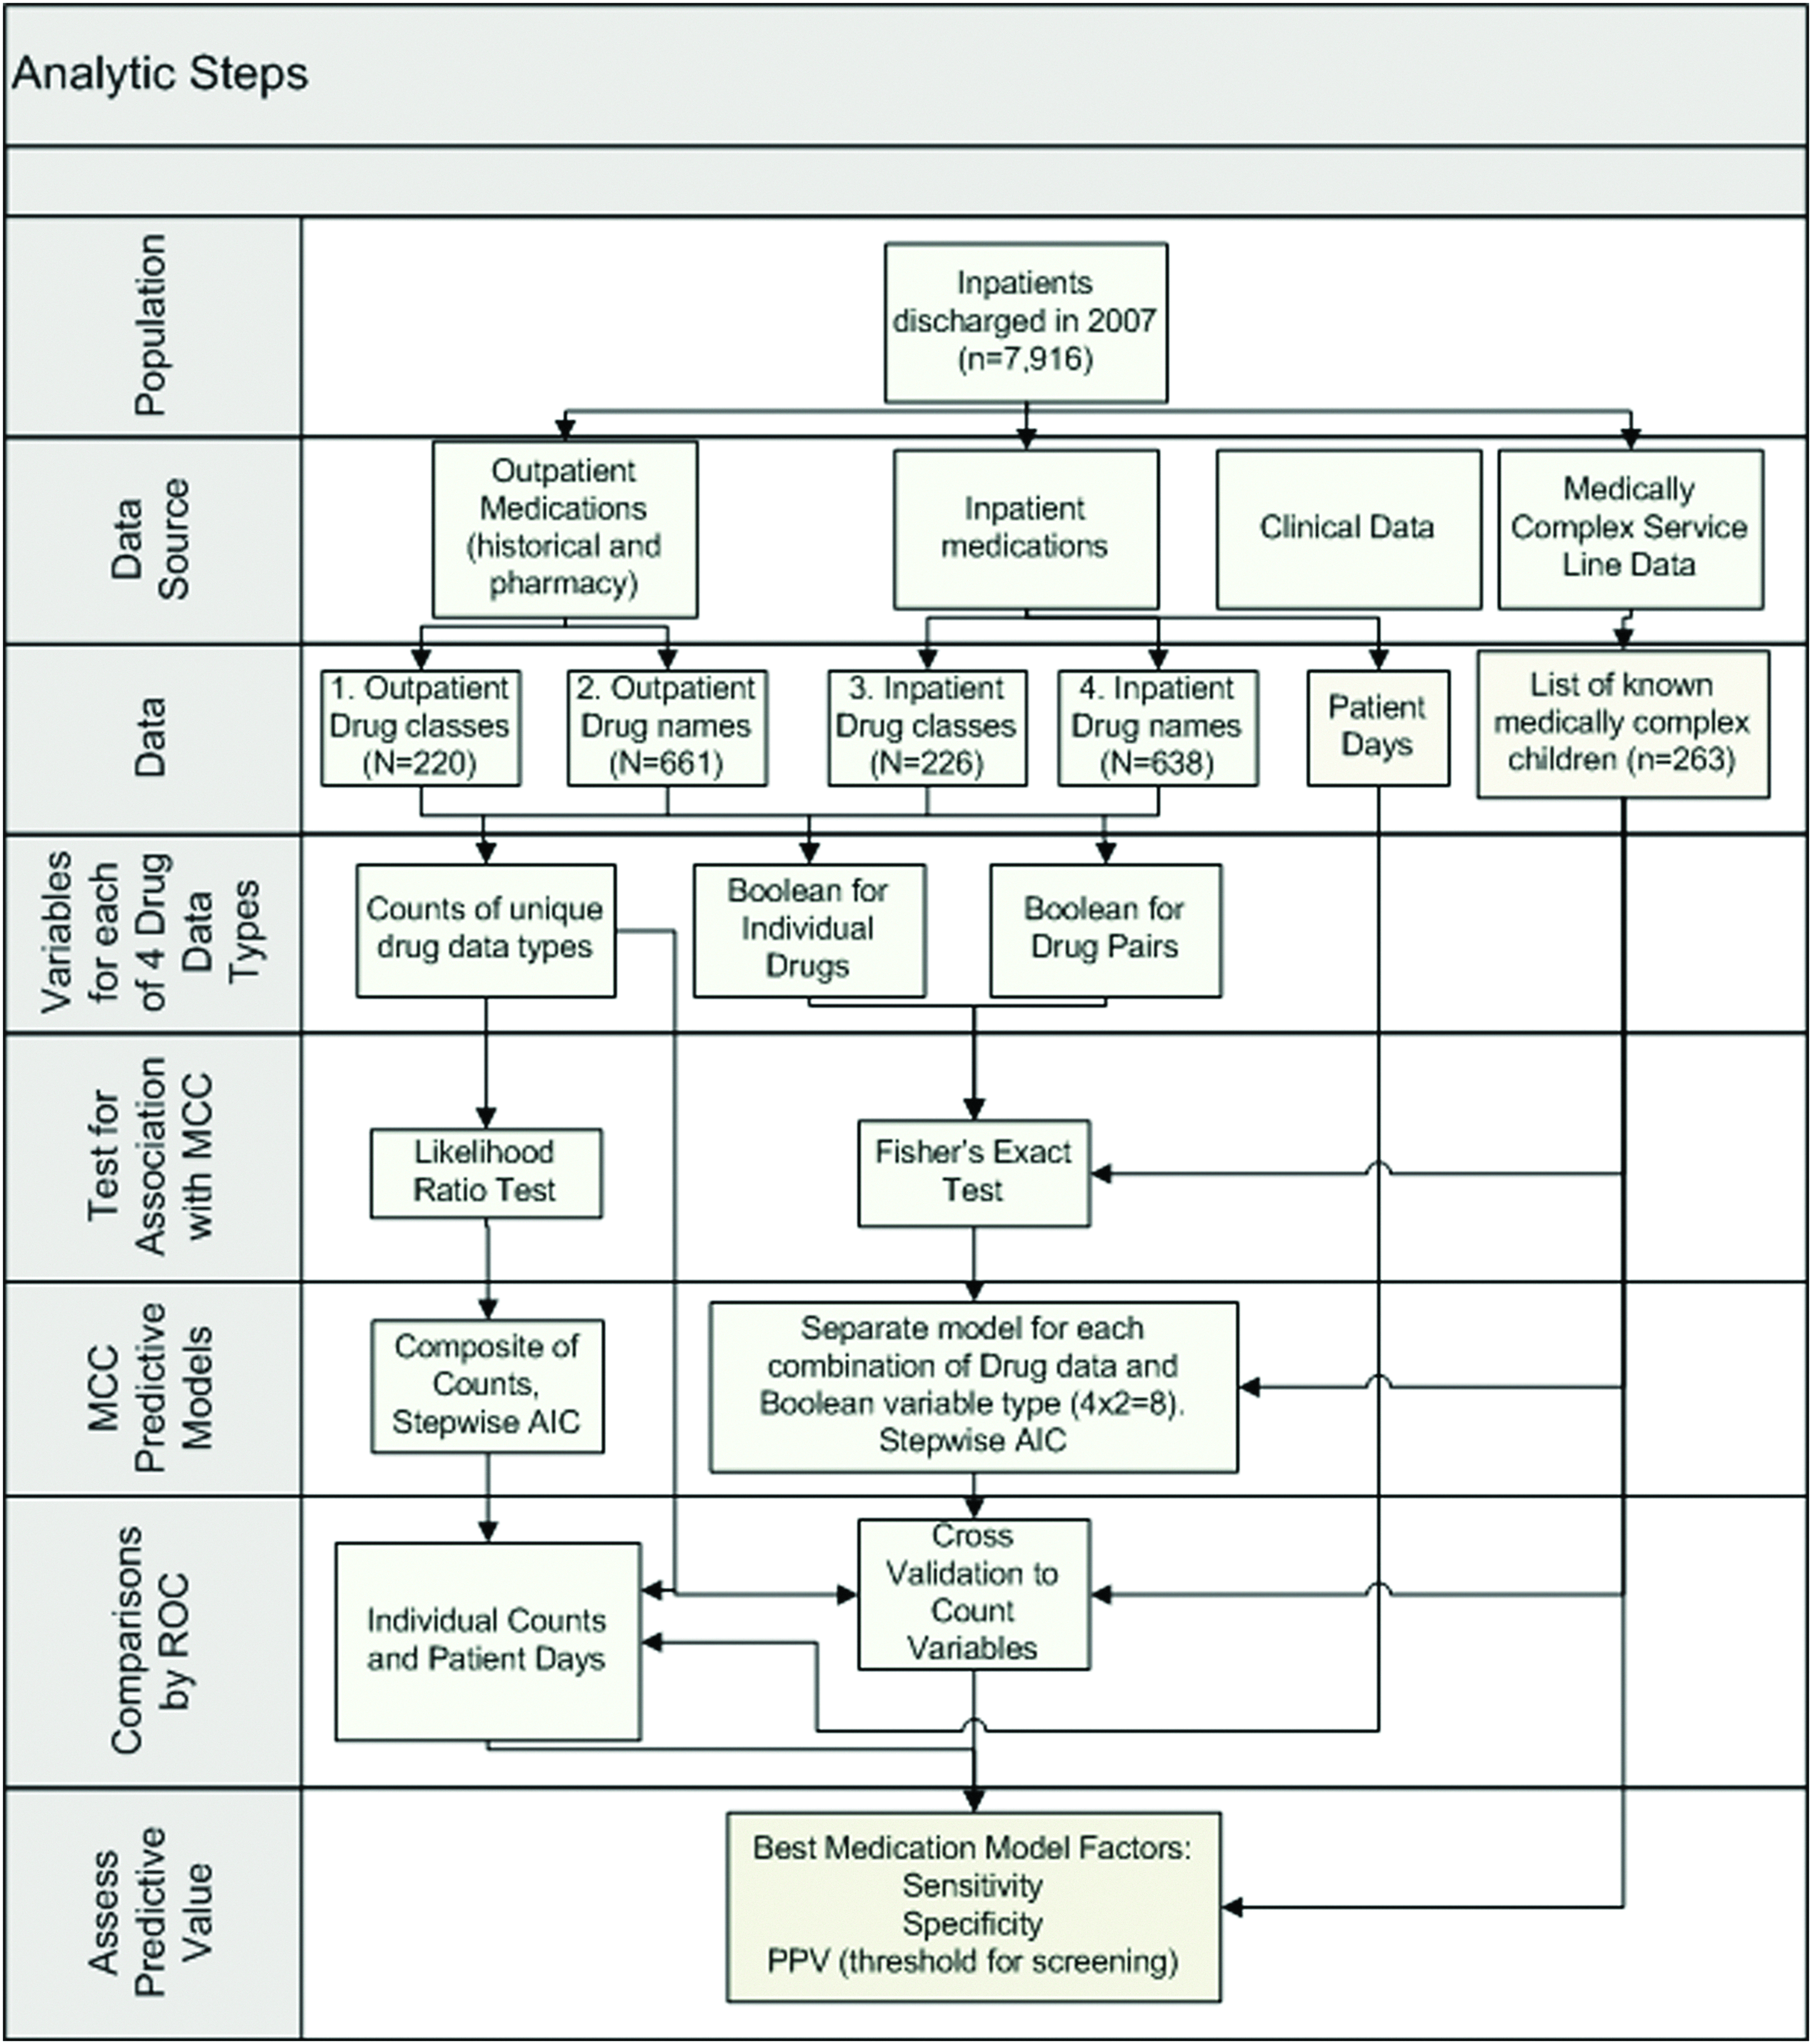
Strategy for analysis of medication data and MCC status. AIC, Akaike information criterion; MCC, medically complex child; PPV, positive predictive value; ROC, receiver operator characteristic.
PowerInsight® (Business Objects, Enterprise XI, release 2) was used to extract data from the clinical system. We tabulated unique drug classes as defined in the Cerner Millennium system (e.g., proton pump inhibitor) and drug names (e.g., lansoprazole) for both inpatient and outpatient medications for all children in the dataset. Multiple orders for the same drugs or drug classes were counted only once for each patient.
Variable generation
Because complexity is often driven by comorbidity, we hypothesized that combinations of medications would be more predictive than use of single particular medications. To gain further insight into underlying causes of associations, we also considered the presence or absence of particular drugs or drug classes as predictors. Simple counts of medications were also considered, as a potentially simple manual screen.
Using the data, we generated a number of different variables as potential MCC predictors. These included counts of unique medications by drug name or drug class separately for inpatient and outpatient records. Boolean variables for individual and pairs of medications for each patient were also created. For definitions and formulas, see Table 2.
Sensitivity: Probability of a positive prediction for an individual who is medically complex (TP/NMCC).
Specificity: Probability of a negative prediction for an individual who is not medically complex (TN/Nnon-MCC).
Prevalence: Proportion of medically complex children (MCCs) in the population (NMCC/N).
Positive predictive value (PPV): The probability of being medically complex for an individual predicted to be medically complex (TP/NA).
Akaike information criterion (AIC): Criterion for estimating the predictive ability of statistical models.
10-fold cross-validation: Estimating prediction accuracy by predicting each 10% partition of the data from the remaining 90%.
Receiver operator characteristic (ROC): An ROC curve summarizes the trade-off between sensitivity and specificity over the range of possible thresholds.
Variable selection
A composite model of drug counts was fit using stepwise logistic regression models. 23 The count variables were transformed to a log scale after adding a pseudo count to remove skewness and improve the model fit. Logistic regression models fit the log odds of being medically complex as a weighted average of individual predictors (Table 2). Logistic regression models were chosen because of the ability to model the anticipated monotone relationship between drug counts and increasing medical complexity The Akaike information criterion was used to select the best-fitting model. 24 A 10-fold cross-validation incorporating the stepwise selection procedure was applied to each model to estimate the prediction accuracy. 25 The final medication count model chosen by this approach was compared with the predictions by individual count variables, patient-days, and models based on either inpatient or outpatient drug counts. The comparisons were made using receiver operator characteristic (ROC) curves built on the cross-validation data. ROC curves plot the tradeoff between the percentage of correctly identified MCC patients (sensitivity) and the percentage of non-MCC patients (1 – specificity) identified at all possible thresholds. 26 The ROC curves are compared statistically using the area under the curve (AUC), and test models based on individual drugs and drug combinations were also fit.
Results
Single-variable predictions
As expected, the number of medications for MCCs was higher than that for non-MCCs. The number of medications tabulated by numbers of unique drug classes or unique individual medications for both outpatient and inpatient was significantly associated with MCC status (all p-values <0.0001). The number of patient-days was also strongly associated with MCC status (p<0.0001). Each of the four medication count variables was highly correlated with the others. Correlation coefficients ranged from 0.50 to 0.98 for the two inpatient counts, indicating that they contain redundant information. Medication counts were also strongly correlated with the number of bed-days (correlation coefficients ranging from 0.3 to 0.6).
The presence of particular medications (and medication classes) was associated with MCC status; for example, outpatient use of baclofen was the most predictive single medication (34/7,653 or 4.4% of non-MCC patients, and 20/263 or 7.6% of MCC patients). We also observed that pairs of drugs were often better predictors than single drugs (e.g., tacrolimus and acyclovir). Combinations of drug classes did not appear to add much value because of taxonomic redundancy. The most predictive drug class is proton pump inhibitors.
“WE ALSO OBSERVED THAT PAIRS OF DRUGS WERE OFTEN BETTER PREDICTORS THAN SINGLE DRUGS.”
Predictive models
A composite medication count model was selected by a stepwise approach. The best model includes counts of outpatient and inpatient drug classes and the count of individual inpatient drug names. All of these counts were statistically significant (p<0.0001) after adjusting for other variables in spite of the high degree of correlation between counts. The distribution of these scores from the medication count model between MCCs and non-MCCs shows a large separation in the number of medications between MCCs and non-MCCs, but with considerable overlap in the tails of the distributions (Fig. 2). The composite model improved upon the individual medication count models in terms of AUC (Fig. 3). The p-values respectively for comparing AUC for combined model versus counts inpatient drug classes, inpatient drug names, outpatient drug classes, and outpatient drug names were respectively. Models based on inpatient drug counts only or outpatient drug counts only were no better than individual inpatient or outpatient drug count variables (AUCs equal to 0.80 and 0.75, respectively). Inpatient drug counts were better than outpatient drug counts at predicting MCC (p<0.0001) (Fig. 3). All of the drug counts were more predictive than patient bed-days as a sole predictor (p<0.0001).
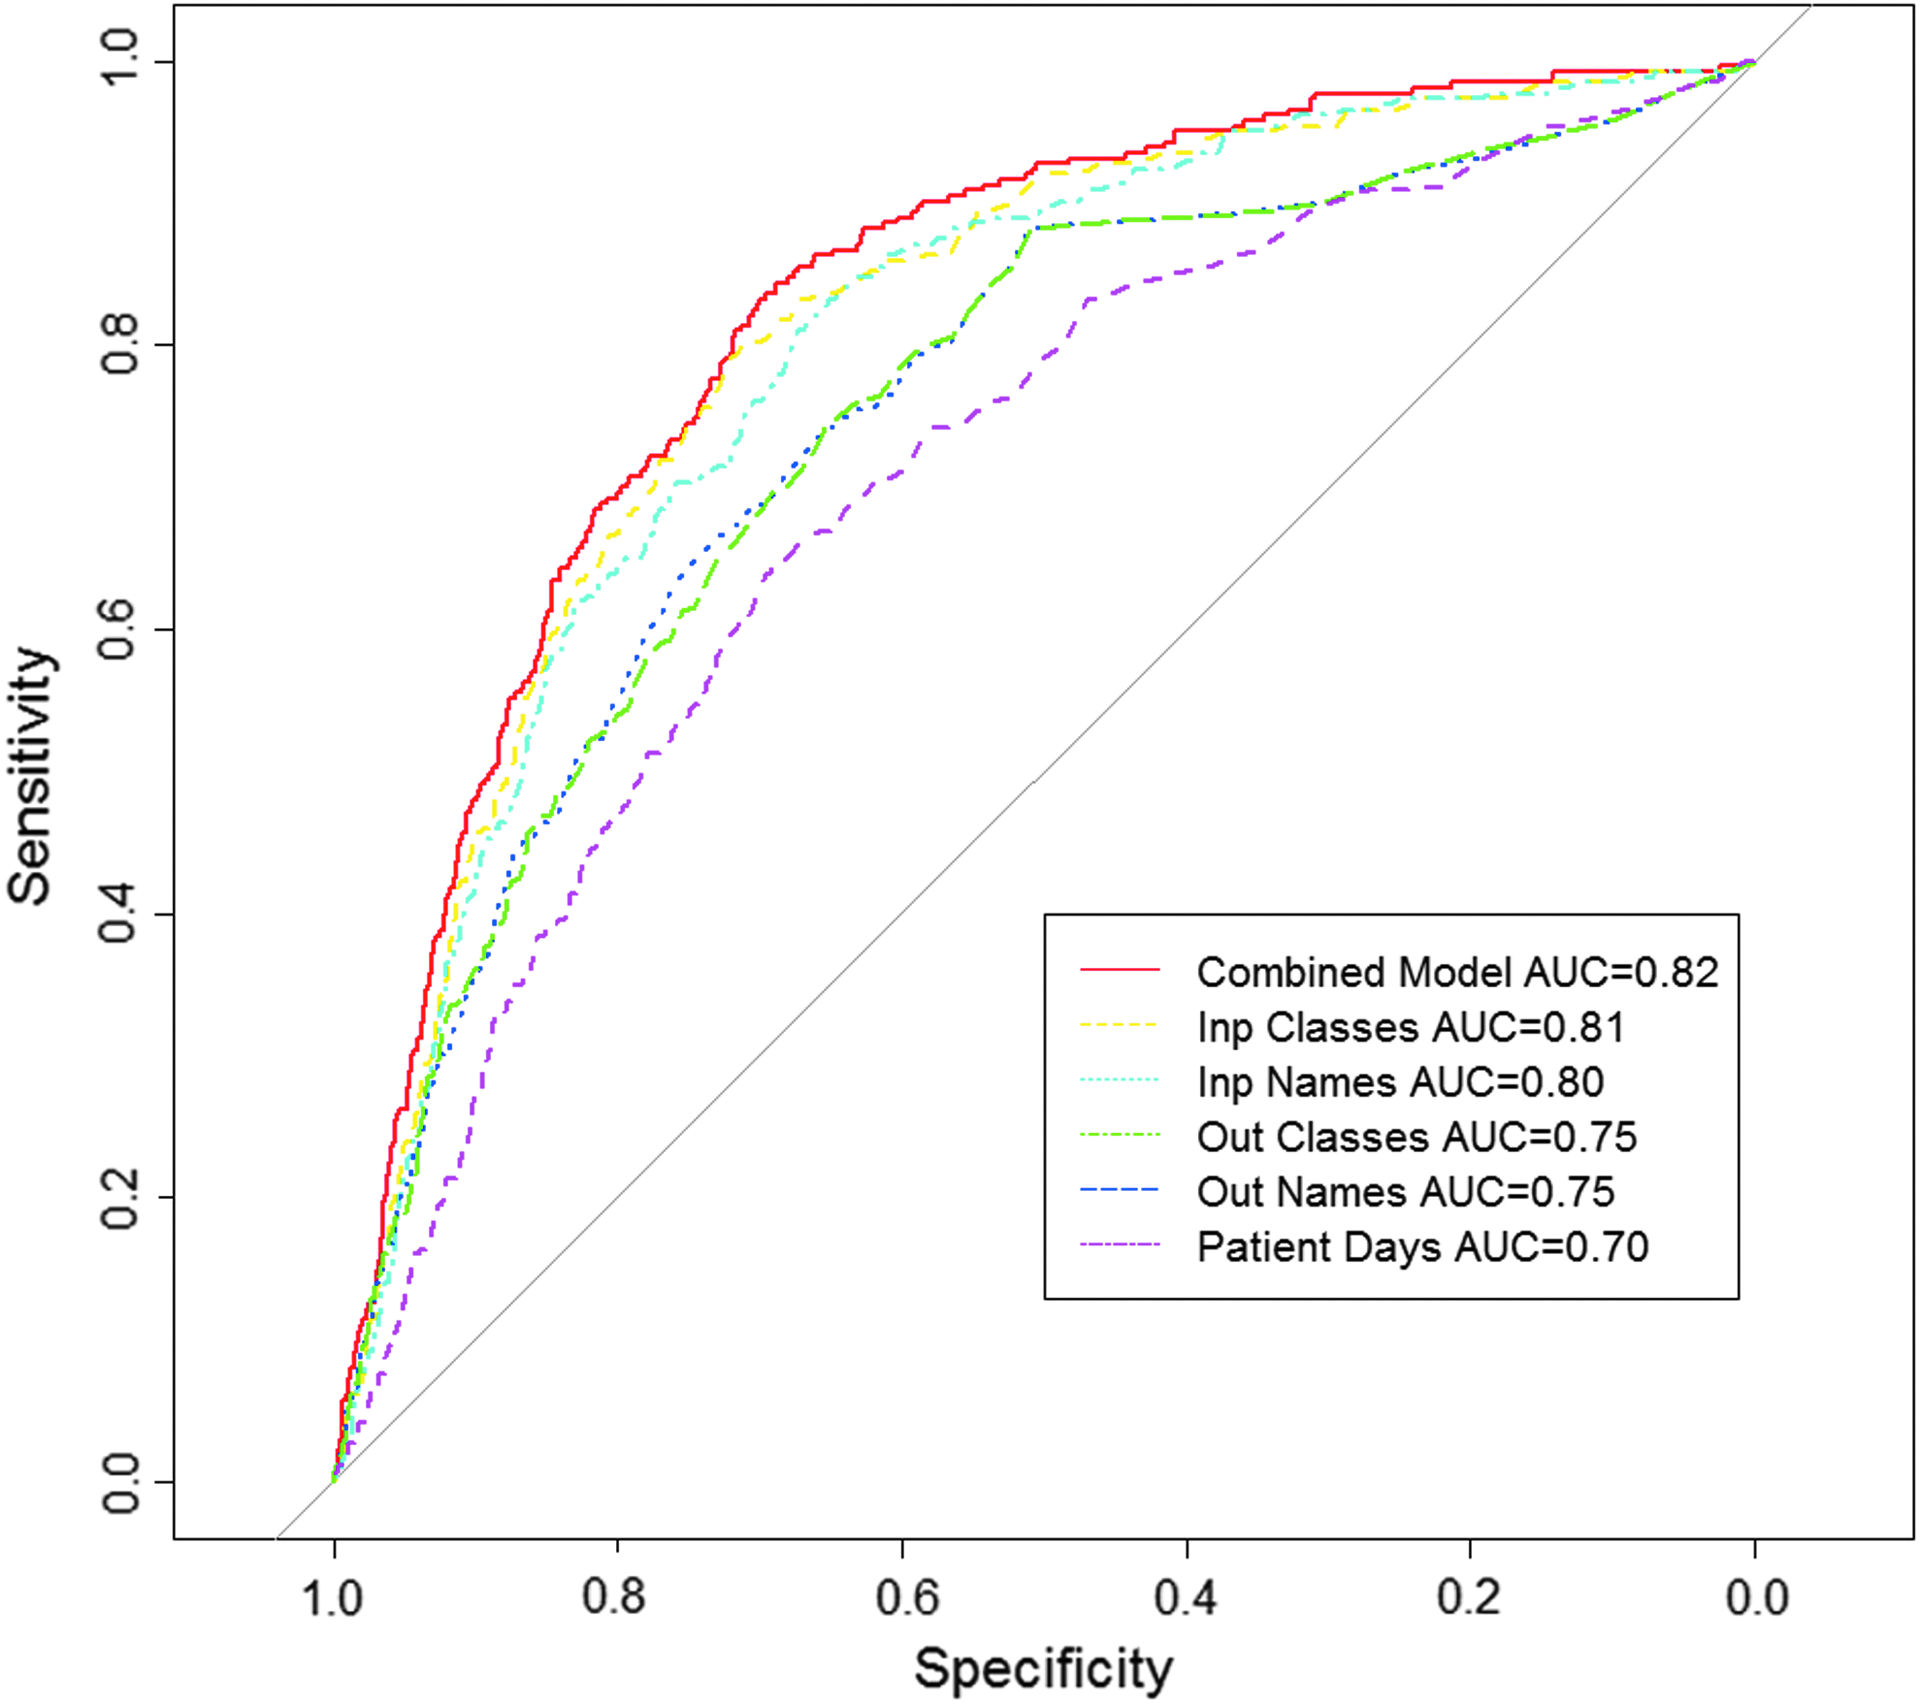
ROC curves comparing the predictive abilities: trade-off between identifying MCCs and excluding non-MCCs of composite models of medication counts, individual medication counts, or patient-days. The drug count model is simple and performs nearly as well as or better than all other models. AUC, area under the curve.
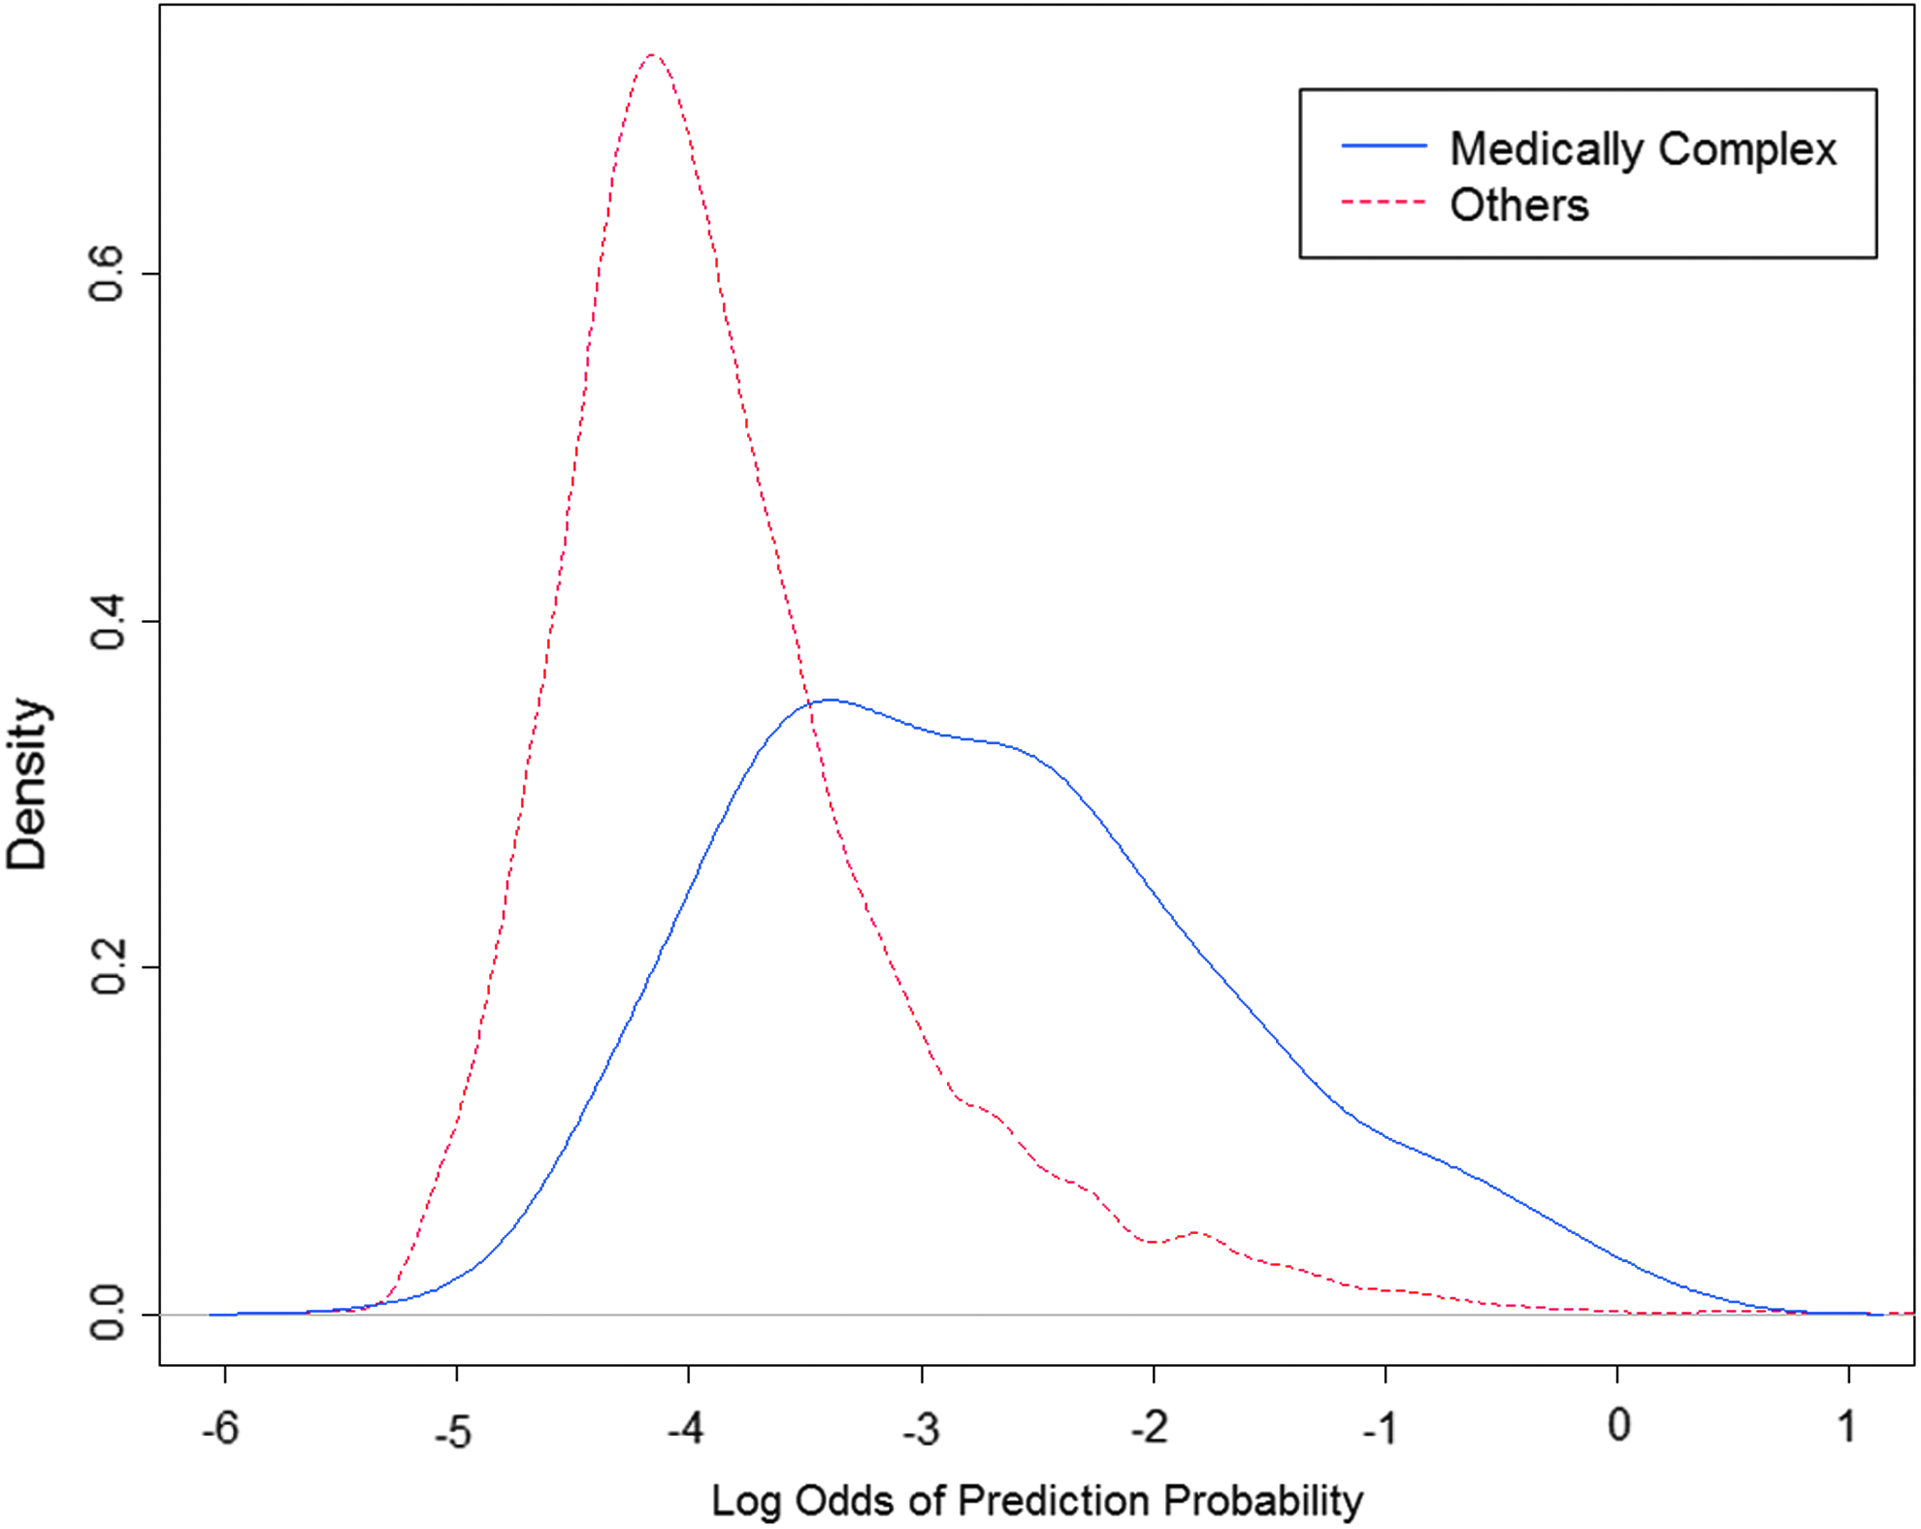
Comparison of the distribution of scores (log-odds of prediction probabilities) between medically complex and other patients. The plot shows the scores of medically complex patients shifted to the right but still overlapping other patients.
Predictive models based on individual and combinations of medications were also evaluated. The cross-validation of these models showed no improvement over the prediction made by the corresponding simple count of medications. This result is possibly because of the large number of possible medications and low amount of overlapping usage of any particular combination.
Model to maximize positive predictive value
Positive predictive value (PPV) is an important measure of the clinical utility of a screening test. PPV measures the probability of a patient actually being MCC when passing the screen. 27 Although there is a significant correlation to each predictor with MCC status, the PPV of individual counts is not of high operational value. As can be seen in Figure 4 (3% prevalence), a threshold identifying 60% of MCCs results in a relatively low PPV of 10%. However, it is probable that many patients in the hospital population are medically complex but have yet to be classified as such. To account for this, we performed a sensitivity analysis. In Figure 4, PPV is compared with sensitivity for the medication model, assuming different prevalences of MCCs in the patient population. Prevalence could range from 3% (assumes that none of the non-MCCs are medically complex) to 20%. When prevalence is low, it requires high sensitivity to detect MCCs, resulting in a relatively low PPV (Fig. 4).
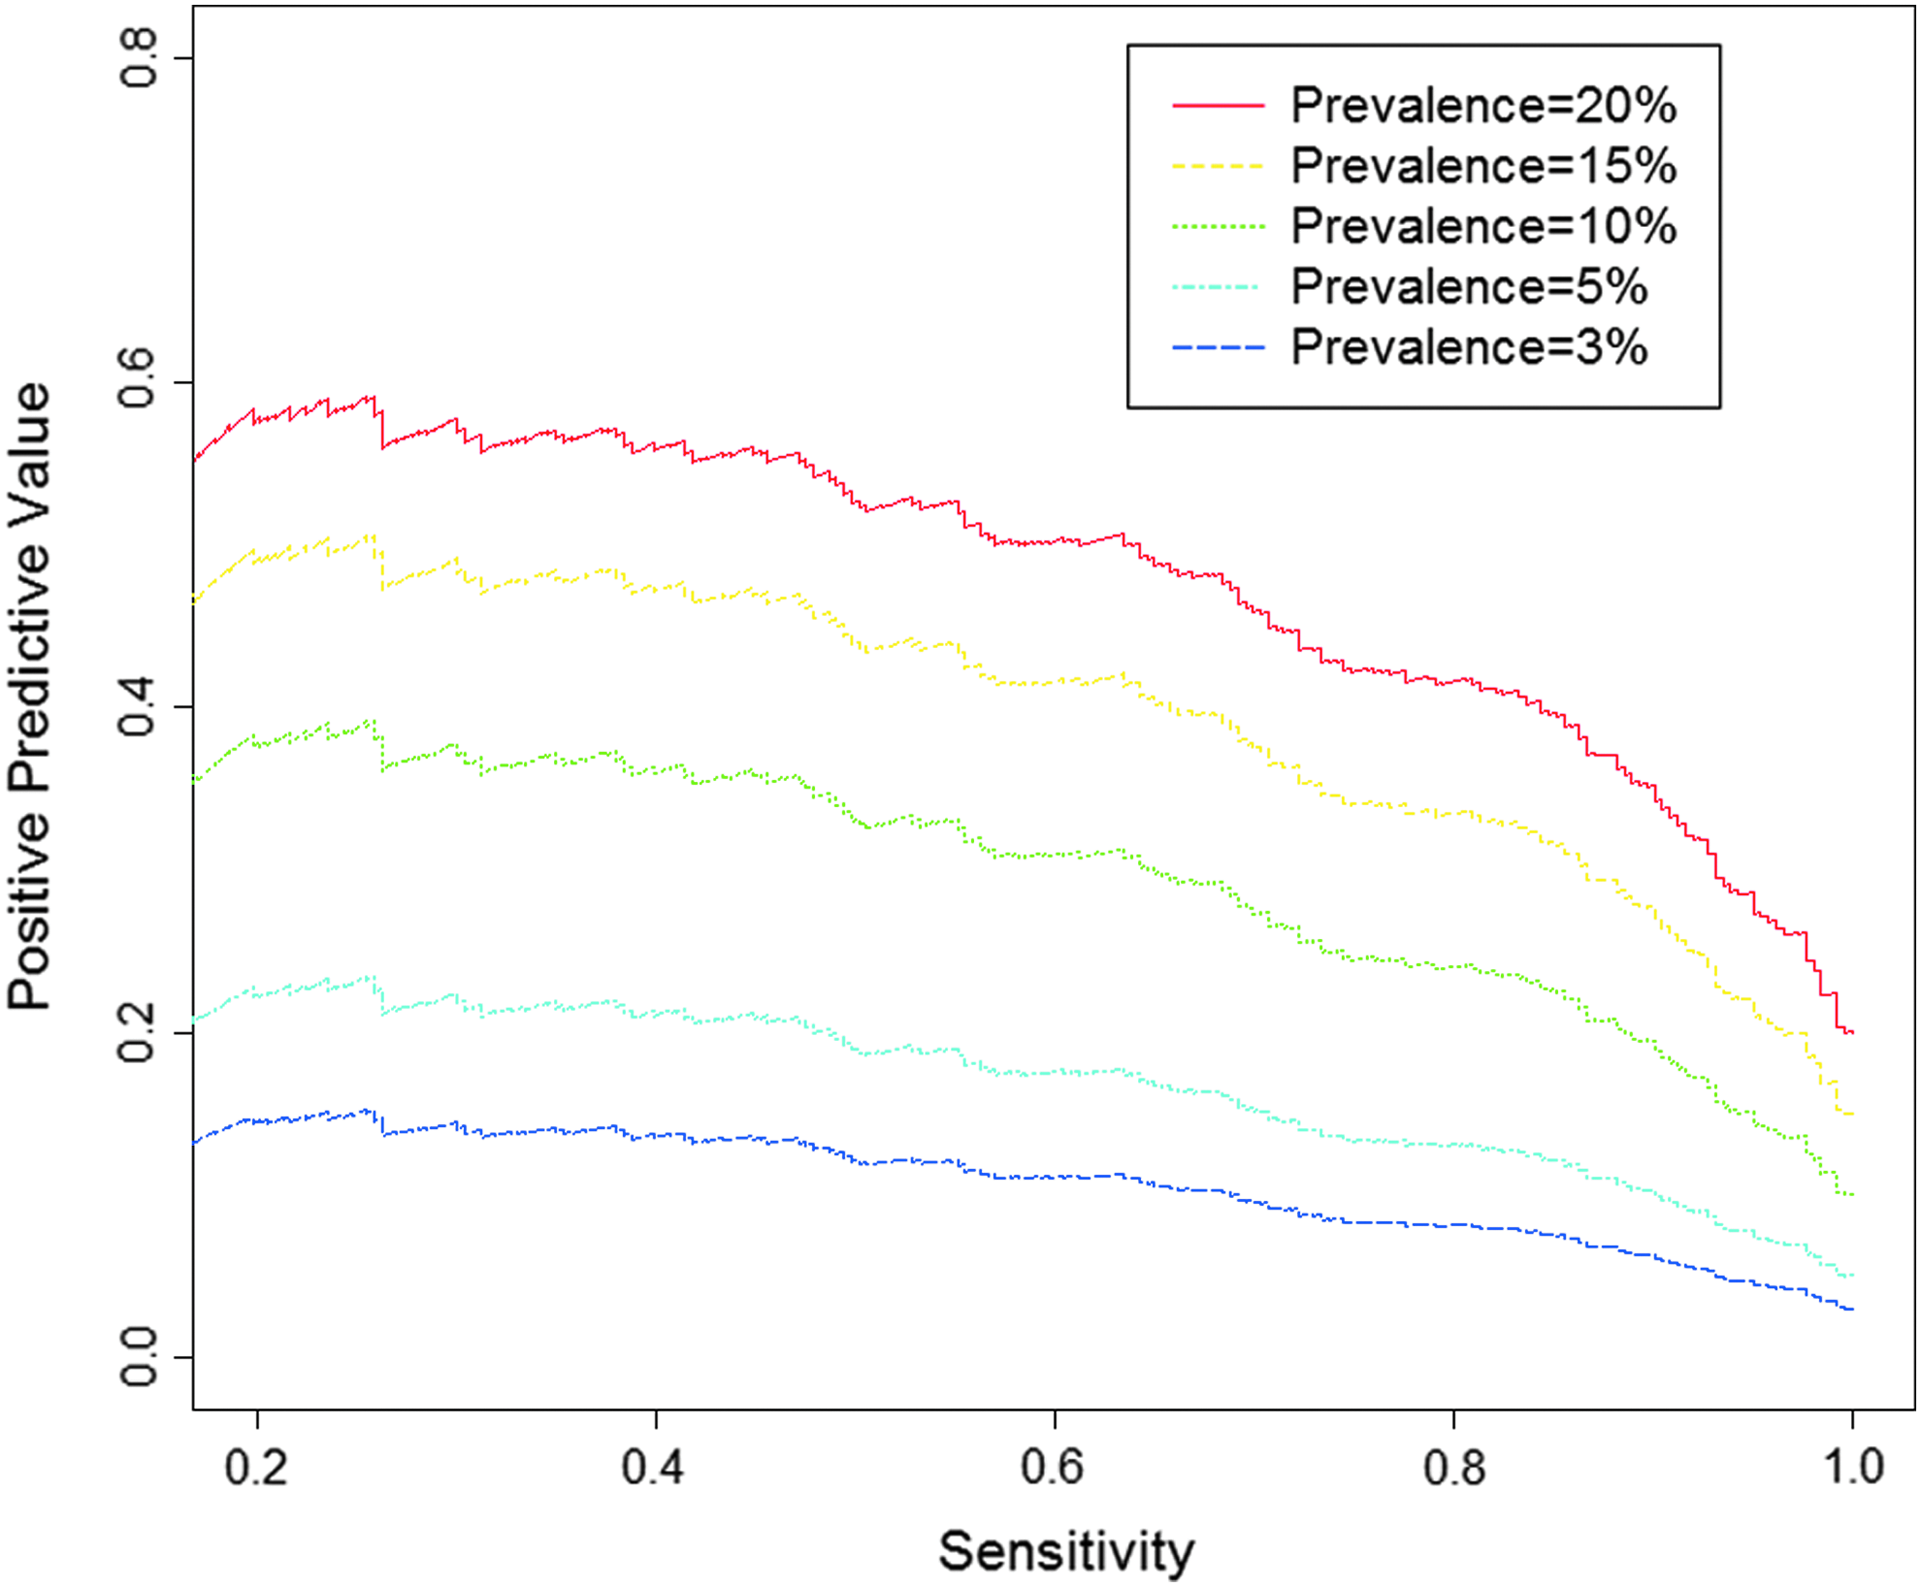
PPV versus sensitivity at different prevalences for the medication count model. The true prevalence of MCCs in the Seattle Children's Hospital population is unknown, but is unlikely to be more than 20. A 3% prevalence would exist if none of the non-MCCs are medically complex. PPV increases with prevalence and decreasing sensitivity.
Discussion
Identifying MCCs at admission is critical to improving care, optimizing resource usage, and reducing costs. Developing a simple, accurate screening method is complicated by inherent variability in MCC cases and large data volumes accumulated by the hospitals. Healthcare data can also be heavily influenced by the human factor; for example, doctor-to-doctor variations in treatment can cause data variations that must be considered. In addition, data that are generated outside the hospital (outpatient drug counts) are not always reliably captured and therefore can lead to incorrect evaluations.
At SCH, we have demonstrated that information in the medication record is highly associated with medical complexity and can aid in classifying pediatric MCCs. The best predictive model was based on both outpatient and inpatient medication counts. For most classification purposes, we concluded that medication predictors should be used in combination with other predictors.
“IDENTIFYING MCCS AT ADMISSION IS CRITICAL TO IMPROVING CARE, OPTIMIZING RESOURCE USAGE, AND REDUCING COSTS.”
Our results demonstrate value in considering the inpatient and outpatient medical records separately. Correlation between these datasets is high but incomplete, and separate consideration can yield more information than a combined predictor. In addition, both inpatient and outpatient medication variables have drawbacks relative to one another; inclusion of both can make up for these deficiencies. In the present dataset, many patients have no outpatient drug orders (11.8% of MCCs and 51% of non-MCCs) because of not capturing prescriptions filled outside SCH. Most patients have recorded inpatient drug orders (99.3% of MCCs and 98.7% of non-MCCs); however, inpatient records often have many medications related to acute episodes or standard order sets that are less correlated with MCC status than outpatient medication lists.
MCC status is largely determined by complex illness and comorbidities. Patients with more complex illnesses tend to have more medications, and additional medications may be prescribed for each comorbidity. Our non-MCC group likely contains MCCs who were not identified even by the manual curation process before this study. This effect, as seen in Figure 4, likely artificially lowered the PPV of the medication screen applied to our data. Even if the test's ability to find MCCs is high, the PPV may be low because of the low prevalence of identified MCCs. Figure 3 indicates that unless prevalence is high, the medication model by itself is insufficient to completely identify MCCs. However, the model provides a useful component to rank patients for additional screening.
Applying big data analysis models to a classification process must be done carefully in circumstances such as this, in which the determined classifier might in the future be used to define the category, thereby corrupting any further analysis. Identification of predictor variables could lead to a circular process in which future classification of MCCs overly relies on these variables. If, in turn, this newly identified set of patients is used to revise successive predictive models, the association of these variables with medical complexity will be artificially inflated. Our predictive medication count model can aid in classifying patients as medically complex. However, it should not be used as an exclusive aid. Training sets for future predictive models should not be chosen entirely on the basis of our prior predictive models or should at least account for prior models in training to avoid bias.
“IDENTIFICATION OF PREDICTOR VARIABLES COULD LEAD TO A CIRCULAR PROCESS IN WHICH FUTURE CLASSIFICATION OF MCCS OVERLY RELIES ON THESE VARIABLES.”
Our primary goal is to efficiently screen for CSHCN and MCCs. Once these patients are identified, the most appropriate specialized resources can be assigned to the patient. Our analysis of admissions data has led to predictive models that open the door for creation of one or more standardized “complexity scores.” These scores need to rely on a simple and robust model that can be reliably applied with accuracy in diverse hospital settings. The models should also reflect family fragility and social support since these factors greatly influence the care of MCCs. As further refinements in classification and analysis occur, the model will continue to be improved. Rather than simply classifying a patient as an MCC or not, our models can produce a quantitative score reflecting the likelihood that a patient is medically complex as well as the overall degree of complexity, therefore providing an indication of the quantity of care needed. Such complexity scores could refine hospital planning, resource allocation, and assignment of inpatients to the MCC Service. Our current analysis led to the amendment of standard operating procedures in admissions at SCH for improved patient care and better management of resources.
A future goal will be to develop an automated screen to rank all patients during admission. If this analysis can be done in near real time, necessary services can be assigned quickly. Predictive classification of new admits will have to be done without any prior data from admissions. Therefore, additional predictive variables from intake records should be identified to realize the full potential of automated real-time screening for MCC or CSHCN status. As the pediatric health-care field changes, more MCC care may be taken on by community-based resources, and it may be increasingly critical that data on these patients are adequately gathered and shared for comprehensive care plans.28–30
Conclusions
Healthcare data can be used to improve patient care and hospital efficiency. There are challenges to overcome, such as the high degree of variability and the degree of difficulty in complete capture and access; however, even with these challenges, the potential for improving patient care and hospital efficiencies is immense. The number of medications a patient takes is predictive of medical complexity with simple models based on counts of the number of medications as effective as more complex models. A composite predictor based on both outpatient and inpatient medication counts yielded the best results. Numerous variables were considered, and the best predictor of MCC status was a simple model based on three medication variables. That model can be used to help rank the patient population for medical complexity and thus improve patient care and resource allocation.
Footnotes
Acknowledgments
We would like to thank John Neff for the introduction to the issue of medical complexity and Ron Dick for providing details of the MCC Service; Ted Corbett, Ann Samuelson, and Deborah Curley for their assistance with PowerInsight; Jim Hendricks, Skip Smith, Drex DeFord, Nate Anderson, Courtney MacNealy-Koch, Greg Yandl, Maggie Lackey, and John Neff for their critical reading and editing of the article; and Tom Hansen, Jim Hendricks, David Fisher, Lisa Brandenburg, Bruder Stapleton, Kelly Wallace, Sandy Meltzer, and Wes Wright for their encouragement and help in this project.
Author Disclosure Statement
No conflicting financial interests exist.