
Abstract
Abstract
Big data in healthcare can bring significant clinical and cost benefits. Of equal but often overlooked importance is the role of patient satisfaction data in improving the quality of healthcare service and treatment, where satisfaction is measured through feedback by patients on their meetings with medical specialists and experts. One of the major problems in analyzing patient feedback data is the nonstandard research designs often used for gathering such data: the designs can be uncrossed, unbalanced, and fully nested. Traditional measures of data reliability are more difficult to calculate for such data. Also, patient data can contain significant proportions of missing values that further complicate the calculation of reliability. This paper describes a reliability approach that is robust in the face of nonstandard research designs and missing values for use with large-scale patient survey data. The dataset contains nearly 85,000 patient responses to over 2,000 healthcare practitioners in five different subtypes over a 15-year period in the United Kingdom. Reliability measures are calculated to provide benchmarks involving minimum numbers of patients and practitioners for deeper drill-down analysis. The paper concludes with a demonstration of how regression models generated from big patient feedback data can be assessed in terms of reliability at the total data level as well as drill-down levels.
Introduction
ONE OF THE AIMS OF PATIENT FEEDBACK IS TO ENSURE THAT HEALTH SERVICES ARE ‘PATIENT CENTERED’ IN TERMS OF RESPECT, CHOICE, AND EMPOWERMENT, PATIENT INVOLVEMENT IN HEALTH POLICY, ACCESS, AND SUPPORT, AND INFORMATION PROVIDED.
“INCREASING EMPHASIS ON PATIENT FEEDBACK HAS IN TURN LED TO INCREASING EMPHASIS ON ENSURING THAT THE DATA OBTAINED FROM PATIENTS IS RELIABLE, ESPECIALLY WHEN THE STAKES CAN BE HIGH.”
Increasing emphasis on patient feedback has in turn led to increasing emphasis on ensuring that the data obtained from patients is reliable,
19
especially when the stakes can be high (e.g., revalidation, recertification and ongoing accreditation).
4
The main tool used to obtain patient feedback is a questionnaire20,21 that patients complete after a consultation or visit to a healthcare provider, with the aim of obtaining information on what patients “really think” of the services provided through patient assessment of the interpersonal skills of the medical expert. Such feedback can help with comparisons between services provided by public healthcare and private healthcare, for instance,
22
provided that the data is reliable. But most patient and customer satisfaction data collection methods embody three aspects of research design that are problematic to deal with from a statistical reliability perspective:
(a) Patient data is nearly always unbalanced, in that there will be variable numbers of patients (raters) for every healthcare professional rated. This leads to issues concerning the minimum number of raters required to obtain a reliable set of performance scores for the person or service rated (the “ratee”). (b) Patient data is nearly always uncrossed, in that a patient very rarely provides feedback on a ratee on more than one occasion. There is little opportunity of a second rating from the same rater for the same ratee to check on the reliability of the first rating. (c) Patient data is nearly always fully nested, in that a ratee's patients will very likely be unique to that ratee. This leads to issues of ratee scores being totally dependent on the context in which they are being rated and the subjective experience of the raters providing a single judgement.
There are also other major developments in clinical governance that may require “practices” or services to undertake periodic (e.g., annual) reviews of performance using patient and/or customer feedback. For instance, the United Kingdom National Health Service (UK NHS) now requires pharmacies to not just undertake annual patient surveys, but also to publish identified strengths and areas of improvement, with proposed actions. 23 Publication can include posters, leaflets, or the pharmacy's website. But currently it is not known how to assure a pharmacy that its rater satisfaction results are sufficiently reliable for public dissemination or what benchmarks should be adopted for a pharmacy to compare itself against other pharmacies.
“IF ARCHIVES OF PATIENT SURVEY DATA ARE TO BE FULLY EXPLOITED, THE PROBLEM OF CALCULATING RELIABILITY OF DATA COLLECTED THROUGH UNBALANCED, UNCROSSED, AND FULLY NESTED RESEARCH DESIGNS MUST BE OVERCOME.”
If archives of patient survey data are to be fully exploited, the problem of calculating reliability of data collected through unbalanced, uncrossed, and fully nested research designs must be overcome. As will be discussed below, a variety of statistical tools, including reliability and predictions of minimum numbers of raters, can provide confidence measures that apply to the dataset as a whole. However, there are no known techniques that can reliably compare or benchmark subtypes of healthcare professionals or services against each other because of the complicating research design issues (a)–(c) above. This in turn could prevent effective drilling down. For instance, if for performance enhancement purposes a validation organization (e.g., a Royal College) wants to drill down to a particular practitioner type (e.g., general practitioners [GPs], consultants, registrars) to identify patterns of patient feedback for that subtype in comparison to other subtypes, there is currently no understanding of how to calculate the minimum number of ratees or practitioners in that subtype in comparison to other subtypes for a reliable conclusion to be drawn about that subtype, even if a minimum number of raters has been achieved for that subtype. In other words, there is an additional unbalanced aspect that is of growing importance: (d) the minimum number of ratees in variable ratee subsets of large-scale feedback data for effective drill-down and comparison.
While there is much emphasis on the use of big data in healthcare as far as reducing costs and clinical innovation are concerned, 24 with the assumption that such data is objectively measurable, there is much less recognition of the role that big patient feedback data can play in improving healthcare performance. The reliability of objectively measured big data can usually be estimated or calculated from a class value (in the case of supervised data mining techniques through, for instance, measures of accuracy, specificity, sensitivity, etc.) or, if no class value exists, from expectations of normal distributions of values. But patient satisfaction data can be highly skewed towards the positive end of a Likert scale, 25 making it difficult to apply statistical techniques that assume normal distributions. Given the large number of patient satisfaction surveys now in existence (a meta-analysis article in 1998 reported over 200 patient satisfaction studies in 1994 alone), 26 there is a need to identify objective measures of reliability so that future studies can report statistical results that are sound, robust and generalizable to a number of different feedback designs. Another possibility is that, as part of the big data in healthcare agenda, current satisfaction survey data can be integrated into much larger datasets for trends and drill-down analysis, at which point reliability measures can be attached to individual datasets to inform researchers of estimated reliability of the data when performing their analysis.
In summary, the volume of patient feedback data continues to grow as healthcare organizations and trusts collect increasing amounts of such data for the purposes of ensuring quality assurance, meeting equity and diversity targets, and satisfying legal and regulatory requirements, as well as enhancing quality of service and reducing costs. There is increasing evidence of patient feedback leading to enhanced direct nursing time at hospital bedsides as well as improving staff satisfaction and teamwork, which in turn results in such organizations prioritizing patient surveys as a critical part of their quality monitoring as well as strategic operations with regard to design of services and physical infrastructure. 27 Nevertheless, there are many open questions about the reliability of such feedback data. The aim of this paper is to demonstrate the use of reliability techniques on large-scale patient feedback data that will provide assurance that (1) minimum numbers of raters have been obtained to return a reliable score for ratees [problems (a)–(c) above] and (2) that a minimum number of ratees has been obtained for drill-down purposes [problem (d) above].
Materials and Methods
Questionnaire
The patient questionnaire (interpersonal skills questionnaire, or ISQ) is an extensively validated tool28,29 developed to contribute to quality and improvement in healthcare, and has been used in the United Kingdom for 15 years in both primary and secondary care settings by a wide range of health professionals in a variety of clinical specialties. It is used to inform personal development and appraisal, and more recently in conjunction with a colleague feedback tool (the Colleague Feedback Evaluation Tool [CFET] 30 ) to provide 360-degree feedback for use as a component in doctors' revalidation in the United Kingdom.4,5 ISQ has 13 five-point Likert-scale questions (1=poor, 2=fair, 3=good, 4=very good, 5=excellent). The first 12 of these questions are “performative,” in that they ask raters to assess the interpersonal skills of the practitioner they have seen, and the final question is “summative” (asking for an overall recommendation). Table 1 provides a brief description of these 13 items.
Data collection
A total of 84,599 patient responses were collected for 2,110 practitioners across a number of practitioner types and specialities over a 15-year period (1998–2012). Of these responses, 36,348 (43%) were complete (i.e. responses to all questions) (Table 1). The ISQ is administered as a paper-based, post consultation exit survey. To achieve a representative picture of performance, 50 questionnaires are handed out to consecutive patients for each participating practitioner and, after completion, placed in a sealed envelope to encourage authentic response. A typical return is between 30–40 patient questionnaires per practitioner.
Data analysis methods
Generalizability (G theory) methods 31 of reliability based on analysis of variance have been successfully applied to research designs that are balanced and nonnested (i.e., p×i×r designs, where p is the ratee or ratees, i is the item or items, and r is the rater or raters (or occasion). When raters are nested within ratees who themselves are nested within types s, the design is (r:p):s×i. Calculating variance components becomes more complex in such cases, especially when the number of raters can vary for ratees and the number of ratees can vary for type. Also, variance component approaches are known to have problems with missing data because, to decompose sums of squares to appropriate variance components, differences must be calculated between mean values and every raw score item i produced by every rater r. Rater responses with missing data are either removed from the analysis or replaced by imputed values or a grand mean. Removal of a rater's entire set of ratings can lead to loss of important and valuable information. Replacement of missing values with the grand mean or imputed values can lead to greater error in reliability estimation as the number of missing values grows. 32 Finally, these methods can produce problematic negative variance components 33 (problematic because it is not possible to calculate the square root of a negative value when attempting to obtain a probability distribution or standard deviation from the variance).
The reliability measure chosen here is a two-level, signal-to-noise measure previously used to demonstrate reliability of unbalanced, uncrossed, and fully nested medical34,35 and hospital 36 doctor, patient, and colleague feedback data that included significant amounts of missing data. The formulae are extended here to deal with drill-down reliability. The basis of the two-level reliability measure is an especially adapted hierarchical linear model 37 that identifies two general sources of variability and hence reliability: variability between ratees (σb2) and variability within the scores for each ratee (σw2), as follows:
Formula 1
where R is data reliability. If the variability between ratees (practitioners) is considered the true signal and the variability within a ratee's ratings from raters (patients) the noise, the above formula calculates a signal to noise ratio.38,39 In an unbalanced, uncrossed, and fully nested experimental design there are, however, three signals at two different levels: the variability between ratees as measured on a number of item mean scores (ratee variance); the variability between the mean item scores supplied by raters irrespective of ratee (uncrossed design); and the variability between raters themselves (fully nested design). The first two variabilities are at the level of ratee (mean scores on items leading to average scores for ratees at the aggregated level), whereas the last variability is at the level of raters (raw item scores). The noise or error in this case is the interaction between all these variabilities. Reliability also needs to take into account another source of noise, which is the unbalanced aspect of varying numbers of raters per ratee within the raw score item level. This is isolated noise that does not interact with the other components. Taking all these components into account leads to the following two-level signal-to-noise formula: 34
Formula 2
where the true signal (numerator) consists of the following:
• avs is the average ratee variance (the variance between practitioners at the average score level for the 12 performative items of this questionnaire); • avi is the average aggregated mean item variance (the variance between items at the mean score level, irrespective of practitioner); and • vr is the average variance of patients providing raw scores (the variance between patients at the raw score level, irrespective of practitioner rated).
The noise (denominator) consists of the following:
• vi/n, the raw score item variance divided by the average number of patients/raters per practitioner contributing to this variance; and • interactions between the three signals.
Variance (squared difference between a raw or mean score on an item and the average score for that item) will be calculated only from the item scores actually available and not from missing values. Hence, all rater item scores can be included in the analysis with no need for removal of ratings or replacement of missing values. Formula 2 also applies to subtypes if all variability is restricted to those subtypes (more details below).
Formula 2 can be amended to introduce a third and fourth variability to model the number of raters (if assurance is needed that a sufficient number of raters have provided scores for a subset of practitioners) and/or practitioners (if assurance is needed that a sufficient number of practitioners exist in a particular subtype for their scores to be reliable) for a subtype, Rs, as follows:
Formula 3
where:
• h is the harmonic mean number of practitioners for a practitioner subtype s, and j is the hypothetical (varying) number of practitioners within that practitioner subtype s; • n is the average number of raters for a practitioner subtype, and k is the hypothetical (varying) number of raters within that practitioner subtype; and • all other terms in RS are localized to the specific subtype s.
The harmonic mean reduces the effect of gross outliers, 31 which can occur more frequently with ratees than with raters in unbalanced and fully nested designs. If rater numbers also contain gross outliers, the average number of raters can be replaced by the harmonic mean if desired.
Formula 3 shows how it is possible to separate the question of whether there are enough raters to give a reliable score for a ratee from the question of whether there are enough ratees to give a reliable score. Modeling the effects of different numbers of raters on reliability while keeping the variances constant is called a decision study, or D-study. 40 Formulae 2 and 3 can also be used to simulate the effects of different variances on reliability, as will be seen through simulation in the Discussion. If necessary, the effect of varying the number of items can be modeled by moderating avi in the denominator of Formula 3 with different numbers of items (not shown here). However, the number of items is kept constant at 12 (the performative items) in the reliability analysis below.
As far as we are aware, this is the first time that modeling the effects of different numbers of ratees (rather than raters) has been shown to be possible in the context of reliability at both the gross practitioner level as well as subtypes of practitioner (Formula 3). For ratees falling within highly specialized subtypes where there may not be as many co-ratees as in other subtypes, this within-practitioner-subtype D-study modeling is an especially important consideration if these ratees are to have confidence in the reliability of their raw scores and aggregated data.
A reliability coefficient R of, say, 0.85, has the intuitive interpretation that 85% of practitioners' true scores can be attributed to ratings from patient raters, with the remaining 15% due to noise and differences among and between the raters. That is, for any future cohort of different patient raters and the same practitioners we would expect the ratings to be 85% similar. Typically, an R value of 0.80 is considered a good reliability coefficient to attain. 5
All applications of Formulae 2 and 3 were undertaken on Excel spreadsheets and linear regression through SPSS version19.
Results
Table 1 provides an indication of the number of patient responses that would be included in reliability analysis if only full responses to the 13 questionnaire items are used (36,348 out of 84,599, or 43%; 36,794, or 43.5% if the summative item “recommendation” is removed). Table 2 shows that nearly 44% of patient responses were for the GP practitioner type, followed by registrars (36%). Table 3 shows that GPs constitute nearly 45% of the population of practitioners and registrars 31%. The practitioner types “health professionals,” “allied health professionals,” and “training” were removed from analysis (13 practitioners in total), as were two practitioners in other categories who had only one or two patient scores. This resulted in 2,095 practitioners for further analysis in five subtypes plus “other.”
Allied health professionals, health professionals, and training practitioners were removed due to low numbers (<1.0%). Also removed were two practitioners with one or two patient responses only, resulting 2,095 practitioners for further analysis.
Tables 2 and 3 show the possible fluctuations in the proportions of patients' responses in comparison with the number of practitioners because of the unbalanced and fully nested nature of the research design. For instance, while patient responses to registrars constitute 35.9% of all responses, registrars themselves constitute 30.9% of the proportion of practitioners.
Table 4 shows the variance measures calculated for the 2,095 practitioners as a whole and for subtypes of practitioner by type. R (Formula 2) for the cohort as a whole is 0.89, with an average of 36 patients per practitioner for all 2,095 practitioners. The R (Formula 2) values for each type are calculated only from the variances for that type, and the average number of patient responses for that type. These R (Formula 2) values treat each type as an independent data set and vary from 0.87 for “other” to 0.91 for “primary nursing.” A different picture emerges when the data is combined into a “big data” set, where RS (Formula 3) values for each practitioner type are moderated by the number of practitioners, j, of that type in comparison to all practitioners using the harmonic mean, h, of practitioners (60). “Registrar” is now the most reliable subtype (0.94) due to a low average rater variance (0.12) as well as above average number of raters (47) and second highest number of practitioners (651). “Primary nursing” drops to 0.89 due mainly to the relatively few number of practitioners of that type (27) in comparison with the harmonic mean (h) of practitioners. RS for the total cohort (“all practitioners”) is the same as R (0.89), since the harmonic mean is the same as the total number of practitioners at this level. The least reliable on both measures is “other,” which can contain a mixture of practitioner types not categorized elsewhere.
Data reliability measure (R) provides reliability for the cohort as a whole and for individual practitioner types as independent datasets. RS provides reliability for each type of practitioner relative to other types if all the data is combined into one big dataset.
avi, average item mean score variance; avs, average ratee variance; vi, average raw score item variance; vr, average rater variance.
Formula 3 has also calculated the effects of modeling different numbers of raters (D-study) for the cohort as a whole and for subtypes (Table 5). The value n in this case is the average number of patient responses for each subtype (n in Table 4), and k is the varying numbers of raters (first column of Table 5). These models show that a benchmark reliability of 0.80, achieved by the total cohort (all practitioners) with an average of 30 patient responses, is also attained by primary nurses and SAS (specialty doctors and associate specialists—typically, senior career grade doctors working in the UK NHS) at between 25 and 30 patient responses, and by GPs at between 30 and 35 patient responses. Registrars need almost 40 patient responses to attain this benchmark figure. The variances found in the data are kept constant for these decision study models.
Finally, Table 6 shows the minimum number of practitioners required within a subtype for reliable drill-down purposes. In this case h is the harmonic mean of practitioners (60) and j is the varying number of practitioners (first column of Table 6) using Formula 3. For primary nurses, the models show that a high reliability of 0.92 can be attained if 100 ratees of this type are included, for instance. Tables 5 and 6 model the effects of varying the number of raters and the number of ratees independently using Formula 3. The formula also allows the modeling of varying rater numbers and ratee numbers together, if wished (not shown here).
Discussion
These reliability measures provide a reliability context for further analysis. For example, linear regression produces the following three significant models for the cohort of practitioners as a whole, and for GPs and primary nurses as drill-down subtypes, using the 12 performative items as the independents and the 13th summative item as the dependent:
According to M1, all practitioners' scores on the summative item can be fitted with about 92% accuracy (adjusted R2, which signifies the amount of variance accounted for in the dependent variable by the model), where, in addition to a negative constant, various questionnaire items are weighted by the coefficients shown in the model. For GPs only, M2 indicates about 93% fitting accuracy using a smaller negative constant and coefficients associated with the same items but without “time for visit” or “expressing concerns.” M3 provides a model for only primary nurses using a positive constant and the two items “ability to listen” and “concern for patient.” These three models could be useful in planning future educational or personal development enhancement strategies for healthcare practitioners as a whole, as well as for subtypes of practitioners. But how reliable are these models, given research design problems (a)–(d)?
M1 is reliable to the extent that the data making up the entire cohort attains R=0.89 (Table 4). So there is an additional 11% uncertainty in M1 due to the unbalanced, uncrossed, and fully nested aspects of the research design. Similarly, models M2 and M3 are reliable to the extent that the data making up these subtypes attain RS=0.92 and 0.89 reliability for GPs and primary nurses, respectively (Table 4). So M2 appears more reliable than M3 and in comparison to the cohort. However, M2 (for GPs) is reliable at 0.92 if there are on average 40–45 raters per GP (Table 5) and at least 300 GPs in that practitioner subtype included in the regression analysis (Table 6). There are in fact 39 raters per GP and 697/944 GPs included in the regression analysis due to missing values, so M2 has effectively achieved the benchmark 0.92 reliability for this model. M3 (for primary nurses) is only reliable at 0.89 if there are between 30 and 35 raters per primary nurse (Table 5) and at least 30 primary nurses included in this practitioner subtype (Table 6). But only 17 of 27 primary nurses were included in the regression analysis subtype due to missing values, and according to Table 6, the reliability of M3 has to be reduced slightly to between 0.86 and 0.87. M3 will only attain the same reliability as M2 (0.92) if 80 such practitioners are included in the model (Table 6).
The estimated reliabilities of these three models were calculated from the actual variances found in the data. Tables 5 and 6 were produced through varying the denominator of Formula 3 to model the effects of different numbers of raters and ratees while keeping the variances found in the data constant. To check on the structural integrity and other properties of Formula 2 (from which Formula 3 is derived), a simulation was performed by interpreting all the variances in Formula 2 as statistically independent random variables and calculating the effects on R. The four average variances of Formula 2 were allowed to randomly change value uniformly between 0 (no variance or noise) and 3 (maximum variance or noise) for 1000 repetitions to produce a simulated variance dataset. The average number of raters n was kept constant at 36 (the actual average found in the data). The means of all four variables (avs_random, avi_random, vr_random and vi_random) in the simulated variance dataset were the expected 1.5±0.1 and standard deviation 0.85±0.01. The mean of R calculated from these random variances (R_random) across 1000 repetitions was 0.38 (minimum 0.15, maximum 0.91) with standard deviation 0.14. The 0.89 reliability of the actual big patient dataset (for all practitioners, Table 4) is 3.6 standard deviations away from the 0.38 simulated variance average reliability, indicating that in comparison to random variances the reliability of the variances in the actual dataset lies in an area that has only 0.1% to 0.01% chance of being included.
Fig. 1 provides graphical representations of the way that R changes in relation to the average of the four randomly valued variances (top-left graph) and then in relation to each of the four variables. The spikes and troughs are due to the effects of large-valued variances in combination with low-valued variances. For avi_random, avs_random, and vr_random, the trend is toward larger variances producing lower reliability scores, indicating that the “true signal” is likely to be found in these variables and that these variables are correctly located in the numerator of Formula 2. The exception is vi_random (bottom left graph of Fig. 1), indicating that locating this variance in the denominator of Formula 2 as noise is structurally sound. The final graph (bottom right hand corner of Fig. 1) clearly shows that the average of the three variances avi_random, avs_random, and vr_random are interrelated in terms of higher variances contributing to lower reliability, and vice versa.
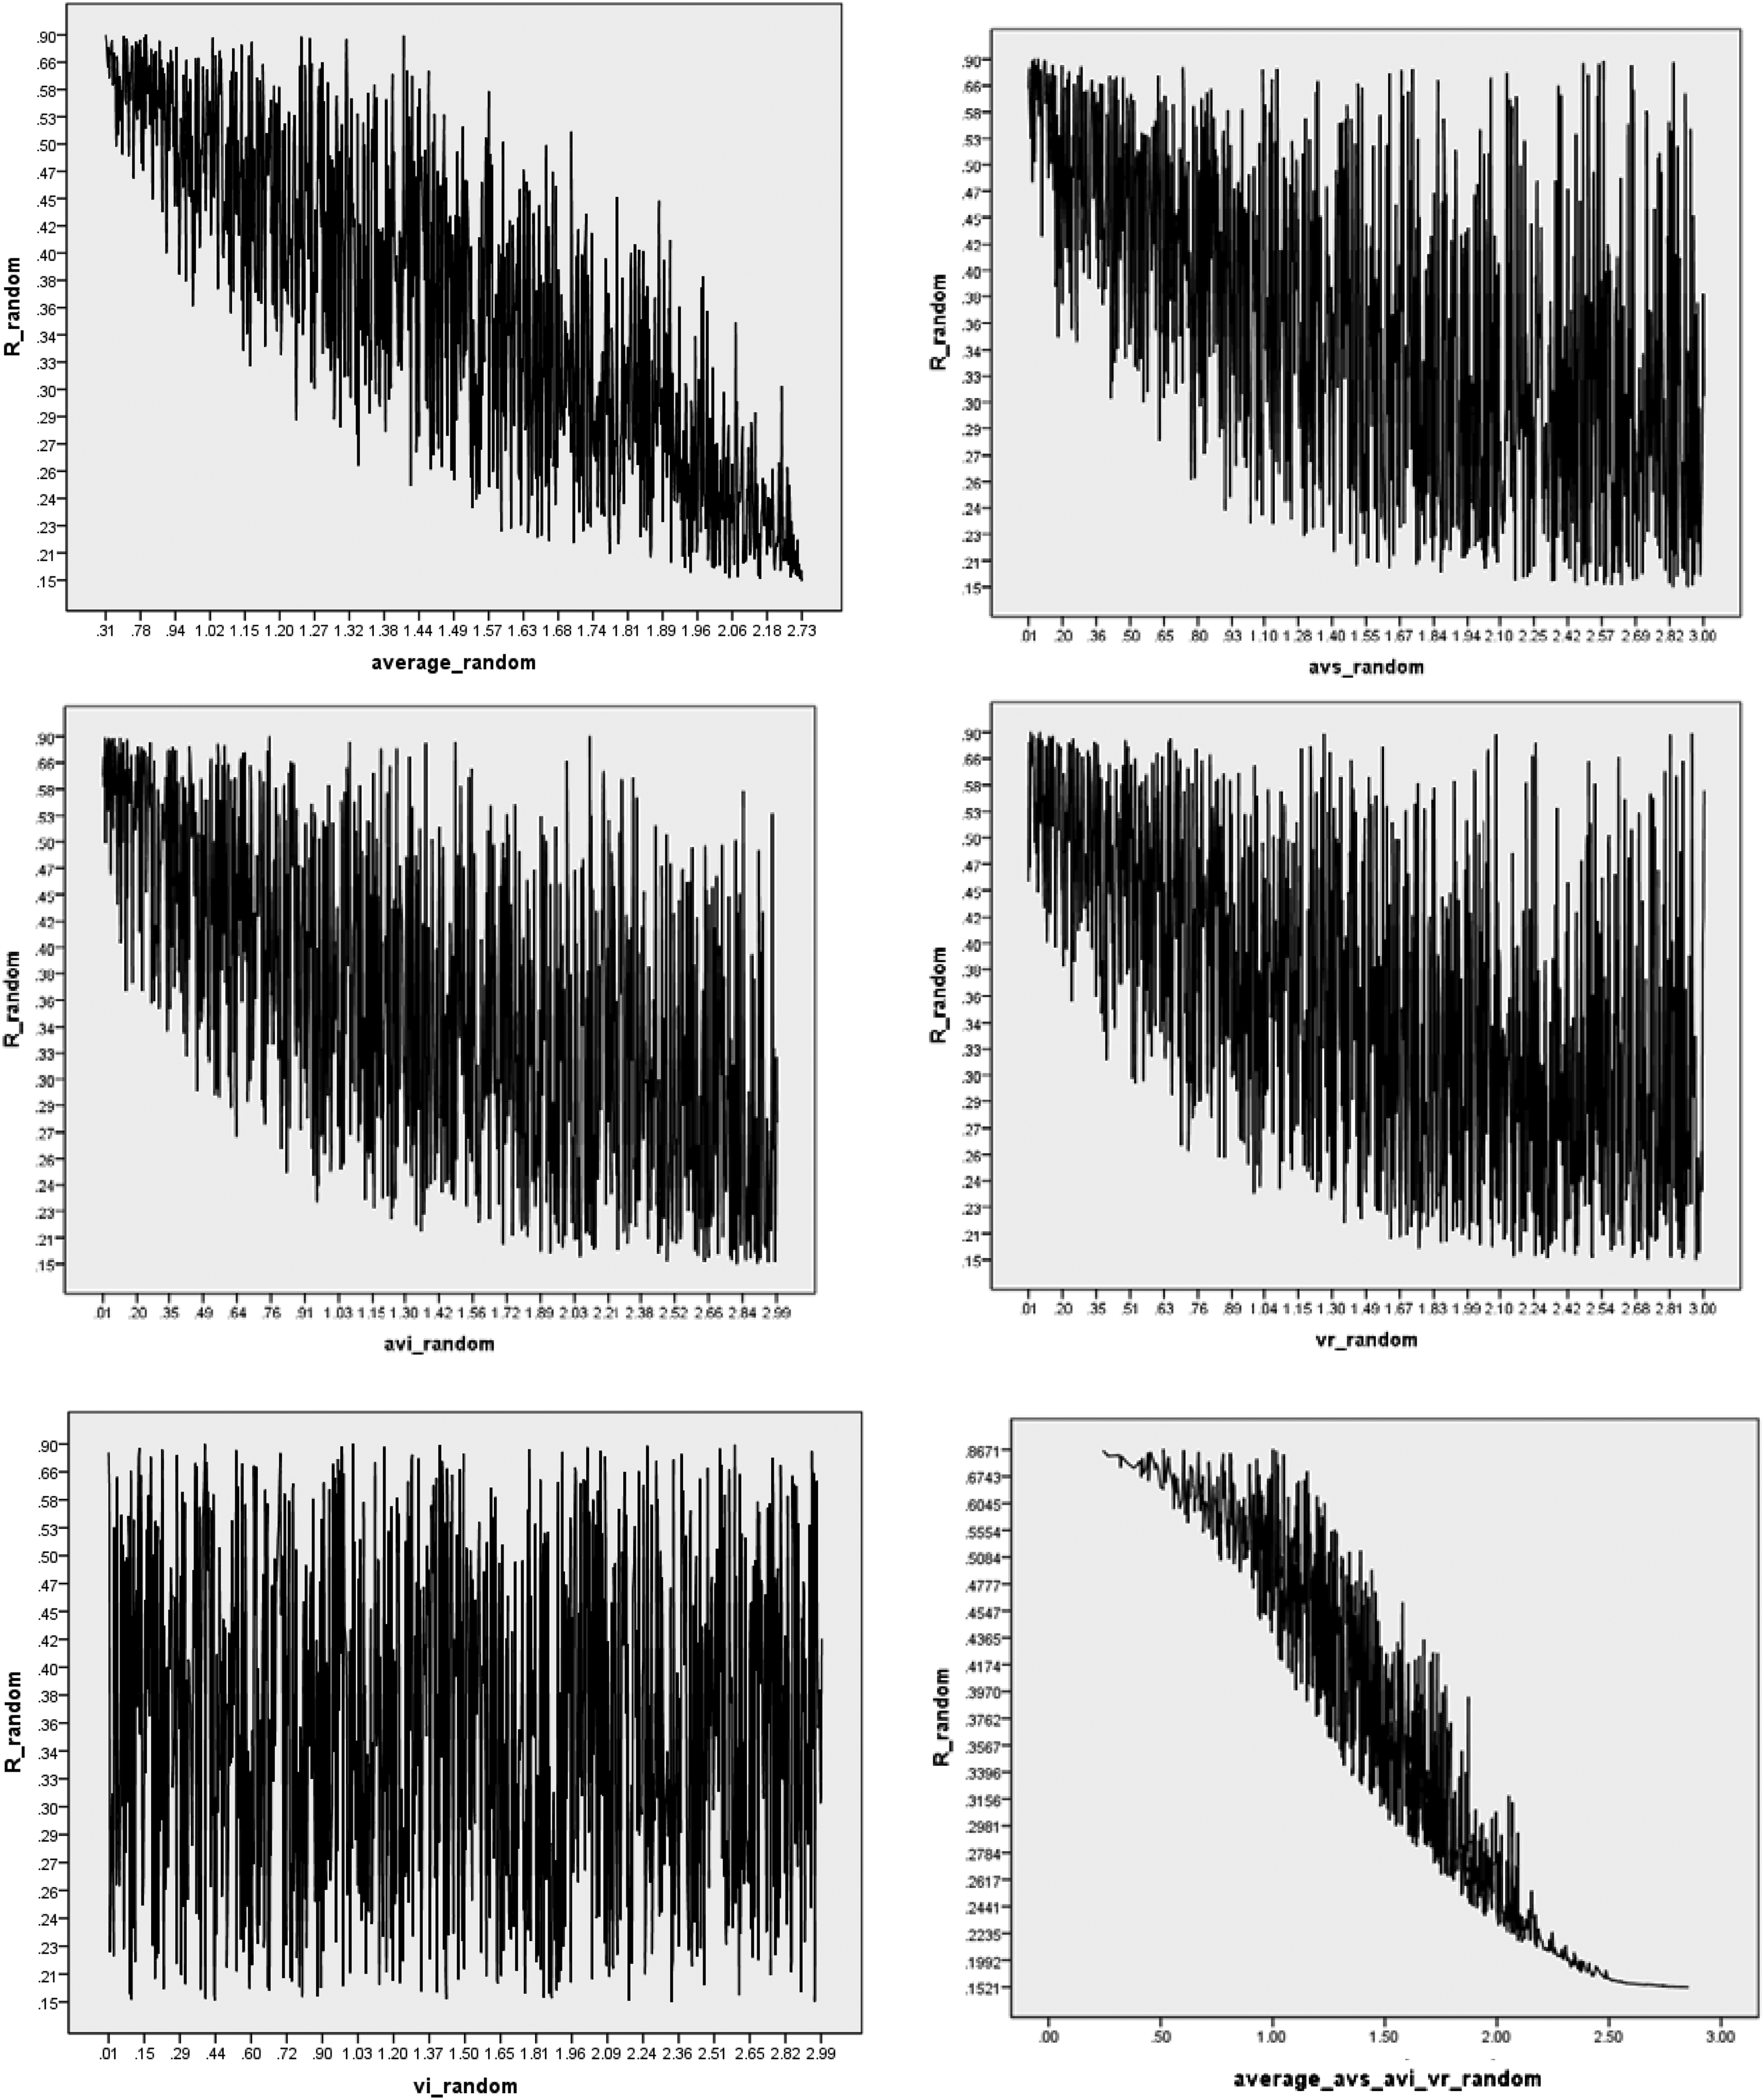
The simulated effects on reliability of each of the four measures used in Formula 2. The top left graph shows how reliability (R_random, y-axis) tends to decrease as the average of the four variances used in Formula 2 increases (x-axis). The next four graphs breakdown these effects by each of the four measures (avi_random, vi_random, avs_random, and vr_random. The final graph (lower right) plots reliability against the three variances (avi_random, avs_random, and vr_random) only.
For real-world data, it is unlikely that the four variances of Formula 2 would be independent of each other, since raw scores of items and rater variances are reflected in aggregated item and ratee variances depending on, for example, the number of raters per ratee. Nevertheless, this simulation indicates, firstly, that adding noise in the form of greater variance leads to reduced reliability for randomly generated variances, and secondly, that all four measures used in Formula 2 are appropriately located for calculating R. This in turn implies that Formula 2 is structurally sound in terms of the way that these four measures are combined across two different levels. Further simulations and analysis of real-world data are required to identify the interdependencies between the four measures in unbalanced, uncrossed, and fully nested data. Finally, raw scores provided by raters are dependent on the context in which the raters see medical professionals and some of the variance in the data will be attributable to a rater's medical situation rather than their interaction with medical experts. 41 The questionnaire has been designed to abstract away from the localized context as much as possible by asking raters to focus on the interpersonal skills of the medical practitioners they have visited rather than clinical or diagnostic skills in relation to patients' specific medical condition. Previous use of Formulae 2 and 3 has shown that predictions of reliability based on hypothetical patient numbers generated from patient feedback training sets and applied to unseen test sets produce highly accurate reliability figures for the test data. 35 These “train-test” studies indicate that any localized variances cancel themselves out if sufficient numbers of patient raters are used and the collection of feedback data is genuinely random. Any localized effects will then be distributed equally across all practitioners' ratings. In other words, Formula 2 and Formula 3 do not attempt to isolate such localized variance and then allocate them to different sources or remove them from analysis. Rather, these formulae accept that there will be localized variance because of the unbalanced, uncrossed and fully nested design aspects and that such variance will be dispersed equally across all practitioners because of these design aspects.5,28
Conclusion
“THE AIM OF BIG DATA IN HEALTHCARE IS TO IMPROVE HEALTHCARE IN TERMS OF BOTH CLINICAL AND COST IMPROVEMENTS”.
The methods described in this paper have also been applied to more than 20 subtypes of specialism in the data (not shown here) and are easily calculated from the raw scores and aggregated mean scores. Estimating the reliability of so-called “subjective” patient feedback data can allow such data and resulting models to complement results from objectively measured (e.g., clinical) data. The methods adopted in this paper provide a way forward for the collection, storage, and robust analysis of unbalanced, uncrossed, and fully nested big patient satisfaction data to complement objectively collected sources of big healthcare data. The aim of big data in healthcare is to improve healthcare in terms of both clinical and cost improvements. If the feedback loop is not closed from clinical innovation to patient satisfaction, the financial and clinical enhancement advantages of big data in healthcare could be minimized or lost.
The techniques described in this paper add to our knowledge of how to analyze survey data, which is a topic that has a long and rich history due to the challenges arising from stratification and unequal selection probabilities as well as complex research designs.42,43 Much emphasis is placed on demonstrating the reliability of the questionnaire through Cronbach's alpha 44 if traditional balanced, crossed, and nonnested designs are used. Other statistical techniques applied to survey data include descriptive statistics (e.g., variance estimation, weighting to deal with unforeseen sampling events) as well as linear regression for producing models. 45 However, the choice of analytical methods will depend on the application and purpose of survey data. The reliability formulae in this paper are neutral as to which modeling technique is used and serve the purpose of allowing researchers to compare the reliability of survey data subsets as big datasets are formed from smaller datasets.
Footnotes
Acknowledgments
The authors are grateful to the many practitioners and patients who contributed their data to the analysis undertaken in this article. The authors would also like to thank the anonymous reviewers for their constructive and helpful comments that have significantly improved the presentation of this article.
Data collection was undertaken at Client Focused Evaluation Programme (CFEP), Exeter, United Kingdom. Statistical analysis was undertaken at Auckland University of Technology, Auckland, New Zealand.
Author Disclosure Statement
No competing financial interests exist.