
Abstract
Abstract
As healthcare providers transition to outcome-based reimbursements, it is imperative that they make the transition to population health management to stay viable. Providers already have big data assets in the form of electronic health records and financial billing system. Integrating these disparate sources together in patient-centered datasets provides the foundation for probabilistic modeling of their patient populations. These models are the core technology to compute and track the health and financial risk status of the patient population being served. We show how the probabilistic formulation allows for straightforward, early identification of a change in health and risk status. Knowing when a patient is likely to shift to a less healthy, higher risk category allows the provider to intervene to avert or delay the shift. These automated, proactive alerts are critical in maintaining and improving the health of a population of patients. We discuss results of leveraging these models with an urban healthcare provider to track and monitor type 2 diabetes patients. When intervention outcome data are available, data mining and predictive modeling technology are primed to recommend the best type of intervention (prescriptions, physical therapy, discharge protocols, etc.) with the best likely outcome.
Introduction
However, there are landmark changes happening with major shifts in healthcare reimbursement. The passage of the Patient Protection and Affordable Care Act in 2010 challenges healthcare providers to do more with less. Specifically, outcome-based reimbursement models are pushing providers to shift to patient-centered care. The Affordable Care Act calls out how this should be implemented—movement toward “healthcare provider reimbursement structures that…improve the health outcomes through implementation of activities such as quality reporting, effective case management, care coordination, chronic disease management, and medication and care compliance initiatives….” 4 Toward these goals, healthcare providers need to focus on population health management. This involves “intensive care management for high-risk individuals, coordination of care between providers, performance measurement, improved care delivery processes, and methods to support patient self-management of care. Health information technology, such as electronic health records and decision-support systems, also are critical components of these models.” 5
“IT IS ESTIMATED THAT U.S. HEALTHCARE ORGANIZATIONS HAVE COLLECTED 150 EXABYTES OF DATA THROUGH 2011.”
Hospitals have big data assets. These are the raw materials needed for decision-support and proactive notification systems, but they have not yet been fully tapped to deliver improved care for reduced costs. It is estimated that U.S. healthcare organizations have collected 150 exabytes of data through 2011, 6 and by leveraging their big data assets, the healthcare industry could potentially realize $300 billion in annual value. 7 While great potential exists, bridging the gap to use these data to deliver improved health outcomes at a lower cost in a population health setting has not yet been realized. 8 Healthcare providers who make the investment in analytics, including partnering with analytics-focused firms, “are going to be the ones who end up the winners.” 9
In this article, we focus on how data mining and predictive modeling technologies process these big data assets to achieve the goal of delivering quality care for reduced costs.
Materials and Methods
The first step leverages a healthcare provider's big data assets by bringing together all relevant information at the patient level to construct a “patient-centered dataset.” After data cleansing, integration, and verification is done, we describe how probabilistic clustering models are derived from subsets of the patient-centered dataset and discuss how these can be used to analyze current health and financial risk and trajectories over time.
Constructing a patient-centered dataset
Healthcare providers have a treasure-trove of patient data. Oftentimes, it is stored in disparate silos. To use these value-rich data elements to proactively manage population health, these sources need to be brought together and integrated into a patient-level dataset.
Clinical data sources can commonly be extracted from electronic health records, hemodynamic systems, medication administration records, laboratory and information systems, and other various sources. These data elements include patient demographics and visit (account) level information including progress notes, problems, medications, vital signs, past medical history, immunizations, and laboratory data.
Similarly, financial systems typically contain patient demographic data and visit (account) -level information including type of visit (e.g., inpatient, outpatient, emergency), admit date, discharge date, diagnosis related group (DRG) codes (high-level diagnosis code for the visit), charges for the visit, International Classification of Diseases, version 9 or version 10 (ICD-9/10) diagnosis codes (a series of ordered codes describing the patient diagnosis), ICD-9/10 procedure codes (a series of ordered codes describing the procedures performed on the patient), admit source, discharge disposition, payer, reimbursement, and so on, often referred collectively as claim data.
The account level data attributes need to be aggregated up to the patient level in a meaningful way. For example, on a given visit, a patient will have a series of ICD-9/10 diagnosis codes assigned to them, along with a given order. The diagnosis code with order=1 is the “primary diagnosis code” for the visit. One way to aggregate these account level diagnosis codes is to take the most frequently occurring primary diagnosis code over the patient's visits, along with the most frequently occurring diagnosis code, irrespective of order. Similar approaches can be used for ICD-9/10 procedure codes. Additionally, average number of visits per year and average number of visits by inpatient, outpatient, and emergency are helpful when aggregating to the patient level. Derived values of average time between consecutive visits and the variance of the time between consecutive visits capture frequency of visit information.
Cost data at the account level are an informative data source that can be used to zero-in on financial risk. When cost data are not available, Medicare cost reports can serve as a proxy.
The goal in creating patient-centered datasets is to bring together, aggregate, and verify the source data at the patient level so that the resulting patient-level attributes effectively characterize the interactions that the healthcare provider has had with the patient over time. In the next section, we discuss how this dataset is used to determine health and financial risk status over the patient population.
Managing population health via data-driven clustering
Determining patient health and financial risk and identifying the most effective care patterns are key to managing the health of a patient population and intervening over time. If a patient is starting to exhibit patterns that are indicative of decreasing health or increased financial risk, those managing the patient population (doctors, nurses, care coordinators, case management) need to be alerted. In these cases, an intervention plan can be put in place to avert or delay such a migration, but monitoring and tracking the health of a large population of patients can be daunting.
This monitoring and tracking can be done efficiently by identifying distinct subpopulations of patients who have very similar interactions and care patterns. We propose a high-level two-step process: (a) segmenting the patient-centered dataset by primary diagnosis group, and (b) then applying a statistical clustering algorithm to further determine distinct patient clusters within this group of patients (Fig. 1).
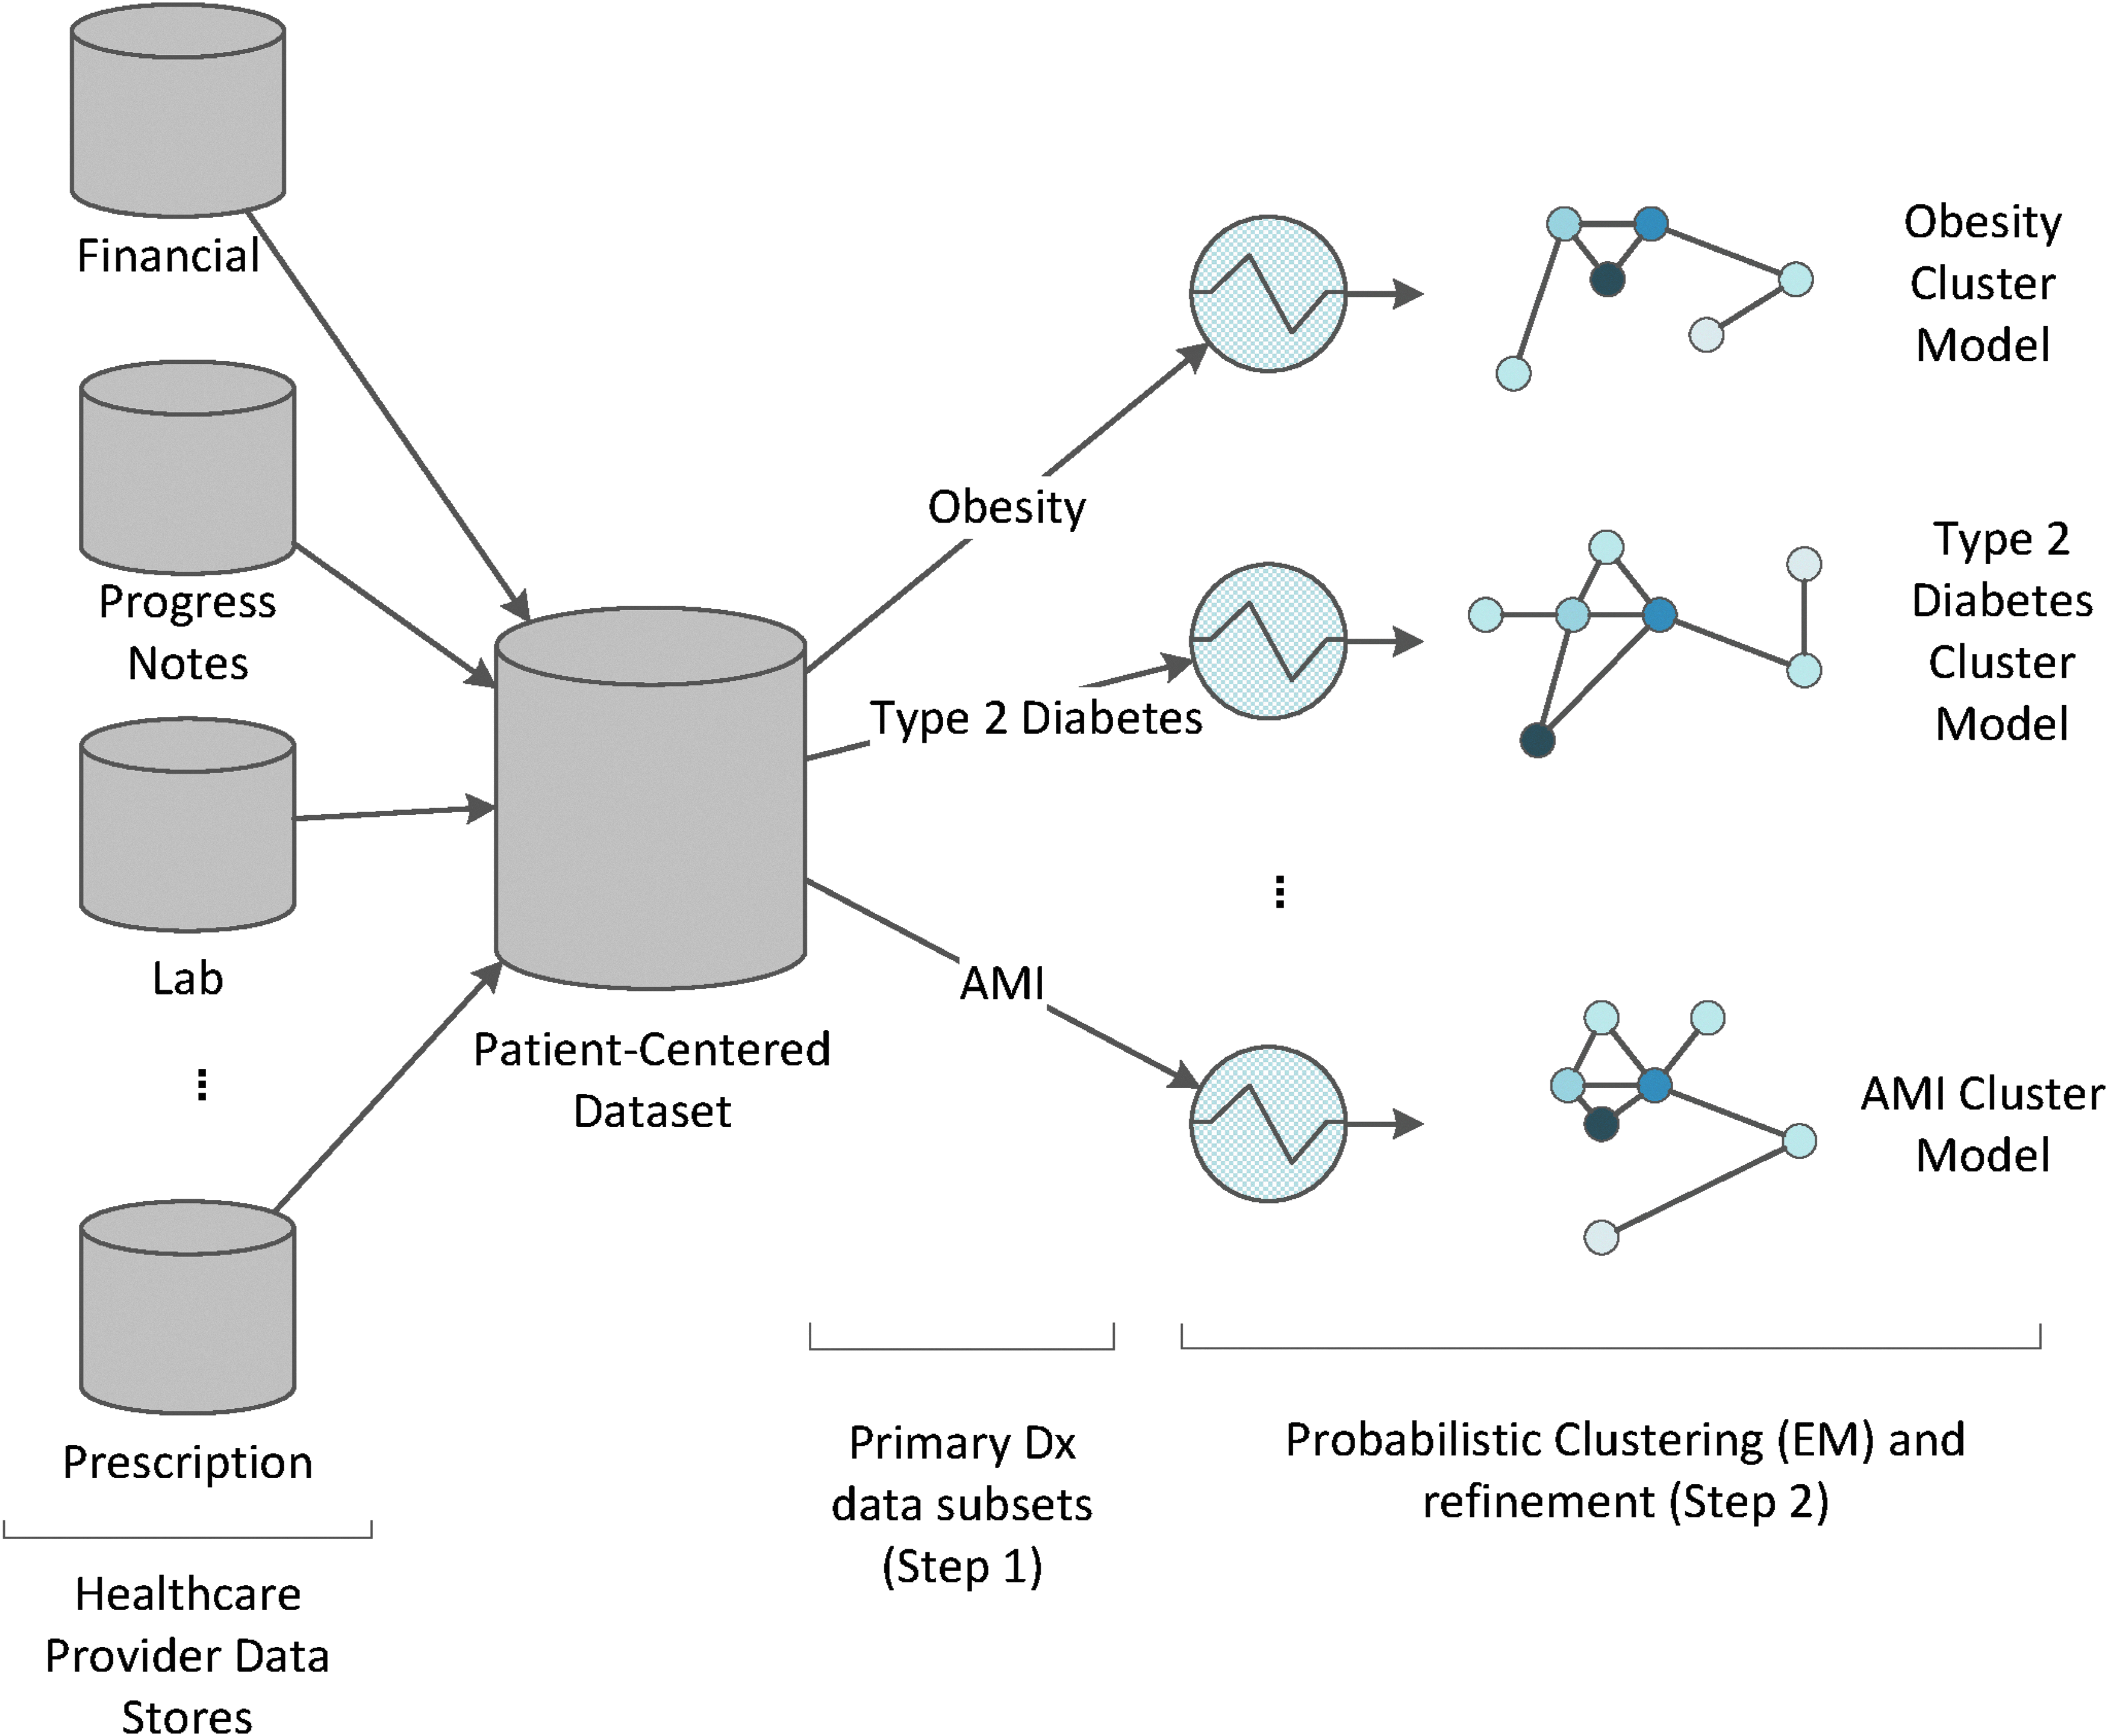
Overview of building cluster models from the patient-centered dataset.
The process of segmenting the patient-centered dataset based on primary diagnosis is as follows:
1. Determine ICD-9/10 diagnosis code groups relating to conditions. For example, there are 20 ICD-9 diagnosis codes with “type 2” and “diabetes” in the name. 2. Segment patients based on their most frequently occurring primary ICD-9/10 diagnosis code group (type 2 diabetes, pneumonia, etc.) over visits in the last year. 3. If the patient has multiple most frequently occurring primary ICD-9/10 diagnoses code groups over visits in the last year (i.e., a tie(s) for most frequent), choose the group with most recent ICD-9/10 code group.
It is also required that the number of patients in a primary diagnosis group be large enough to support statistical clustering. Any segment having a population of 500 or more is included. Those segments with population less than 500 are combined.
Next we will detail the process of using a data-driven statistical clustering algorithm to identify clusters of patients within the same primary diagnosis group. The goal is to determine clusters of patients that have very similar values across all of the patient-centered dataset attributes included in the model. If the attributes that make up the patient-centered dataset characterize patient health, costs, recency/frequency of interactions, and information on those interactions, the patients belonging to the same cluster will tend to interact with the provider in a very similar way. Patients in the same cluster will then tend to have similar health and financial risk.
“THESE PATIENTS WILL DIFFER IN THEIR INTERACTION WITH THE HEALTHCARE PROVIDER IN FREQUENCY, OTHER DIAGNOSES (E.G., OBESITY), TYPES OF VISITS, AND SO ON.”
For example, consider the segment of patients with most frequently occurring primary ICD-9/10 diagnosis of “type 2 diabetes.” These patients will differ in their interaction with the healthcare provider in frequency, other diagnoses (e.g., obesity), types of visits, and so on. Statistical clustering algorithms will further identify similar groups with the type 2 diabetes population identifying those who are caring for themselves, those that are not, those that have other common diagnoses, and so forth.
Building and evaluating data-driven patient clusters for fixed diagnosis
We apply a statistical clustering algorithm to one of the primary-diagnosis groups (e.g., those patients with frequent primary diagnosis of type 2 diabetes). Specifically, we are fitting a probabilistic mixture model to this portion of the patient-centered dataset. 10
We use the expectation–maximization (EM) algorithm to optimize the parameters of this model to cluster patients in the primary diagnosis segment. The EM algorithm iterates between assigning data points to clusters and then updates the parameters of those clusters until it converges to a local maximum likelihood solution.
11
The EM algorithm estimates the following distribution over the data:
Here p(x|h) is the distribution over the h-th cluster, p(h) is the proportion of patients belonging to cluster h, and
Here pm(xm|h) is the probability distribution over the m-th attribute of the patient-centered dataset and xm is the m-th attribute value of patient x.
Given this form of the distribution, the function to determine the membership of patient x in the h-th cluster is
The distance between two clusters hi and hj can then be computed via the symmetric Kullback–Leibler (KL) divergence 12 computed between p(x|hi) and p(x|hj). Similarly, the difference between clusters hi and hj over attribute m is computed using the symmetric KL divergence between pm(xm|hi) and pm(xm|hj).
One issue when applying mixture models to real-world data is determining the number of clusters k to estimate. Common implementations for estimating mixture models require the end-user to specify k. There are data-driven approaches that employ additional criteria that attempt to automatically determine k.13,14
The process of estimating a cluster model for patients in the same primary diagnosis group consists of the following high-level steps. Given a minimum threshold for cluster pairwise symmetric KL divergence ɛ>0, a maximum threshold for attribute-level pairwise symmetric KL divergence τ>0, and a maximum threshold for log-likelihood difference between models ρ>0:
1. Apply EM over the dataset to estimate a mixture model for a given number of clusters k. Begin by utilizing a method to autoselect k13,14 and by using all of the attributes in the patient-centered dataset. 2. Evaluate the cluster model computed in step 1 utilizing the following criteria: a. Are the distributions that define the clusters sufficiently distinct and is the pairwise symmetric KL divergence between all clusters greater than ɛ? If not, increase the value of k in the next iteration. b. Are the distributions of certain attributes similar across clusters and is the symmetric KL divergence applied to attribute m across clusters less than τ? If yes, remove these attributes in the next iteration since these are not distinguishing clusters. 3. While there is not an objective criteria to stop iterating, here a few guidelines: a. Are the cluster models changing minimally with different runs (with small differences in k and the attribute set used) and is the difference in log-likelihood of the current and previous models less than ρ? If yes, this indicates that the model is accurately summarizing the underlying data. b. When reviewing the distributions over the cluster models with domain experts (MDs, RNs, etc.), they confirm the distinct clusters found. c. If these guidelines are satisfied, stop iterating. Otherwise, return to step 1 above with altered values of k and altering the set of patient-level attributes to use in the next modeling iteration.
“THE GOAL IS TO CALCULATE A PROXY MEASURE FOR A PATIENT'S OVERALL HEALTH, REGARDLESS OF CONDITION…”
The next step is to define the health and the financial risk status across clusters. There has been work on assessing a patient's overall health status for different conditions leveraging clinical and survey data.15,16 The goal is to calculate a proxy measure for a patient's overall health, regardless of condition, then aggregate over patients in a cluster to determine a cluster health score. If the proxy measure's computation is not dependent upon a specific condition, this allows for comparison of health status across cluster models over different patient conditions—a benefit for population health management.
The score uses ED intervention level values for emergency room visits, clinic intervention levels for outpatient visits, and DRG weights for inpatient stays to approximate the complexity of the visit. ED and clinic intervention levels are on a scale of 1–5, reflecting the level of resources used in providing service. 17 All inpatient visits have a DRG code associated with them. DRG codes have associated positive weights reflecting the average level of resources for an average Medicare patient in the DRG, relative to the average level of resources for all Medicare patients. Higher values indicate that more complex inpatient services have been provided. 18
Leveraging these levels and weights, the patient's health score is computed as follows:
1. Compute the patient-level scores: a. Initial score=0 b. For each emergency visit, add the ED intervention level to the score. c. For each outpatient visit, add the clinic intervention level to the score. d. For each inpatient visit, add 3+(DRG weight for the inpatient stay) to the score. Adding 3 to the weight value accounts for its minimum being 0 and makes it comparable to ED and clinic levels. e. Sum the score and divide the total number of patient visits to normalize for frequency. 2. Determine quintiles based on patient scores. a. Quintile 1 corresponds to 20% of the lowest scores (healthier patients). b. Quintile 5 corresponds to 20% of the highest scores. 3. The average of the quintile value over the patients in each cluster becomes the cluster's health status score.
The following process is used to compute the “risk score” for each cluster. If cost data are available, then the financial risk for a patient is the average of (reimbursement – cost) over all patient visits (accounts). In this case, when determining quintiles, sort by the negative of (reimbursement – cost) so that lower values correspond to lower risk. If cost data are not available, costs can be estimated via Medicare cost reports and (reimbursement – estimated cost) is a proxy for risk.
These health and risk scores provide a fast, high-level overview of the current healths and risks of patients under care. Additionally, clusters with particularly high scores for health and/or financial risk can quickly be identified and tracked. Since we know which patients belong to clusters with higher health scores and financial risk, these patients can be targeted for intervention to lower their scores over time, improving their health and lowering the associated financial risk.
Cluster migration
The probabilistic models constructed also form a foundation for proactive alerts when a patient starts tracking from a healthy, low-risk cluster toward an unhealthy, higher-risk one.
Let's assume that a patient x is currently in a healthy, low-risk cluster h1. This means that
As time goes by and patient x has more interactions with the healthcare system, the patient-level data for x may start to change so that s/he is starting to fit better into cluster h2. So we now have
If h2 is a cluster with higher health and financial risk scores, an alert can be raised to develop an intervention that, ideally, will avoid or delay the transition from h1 to h2. The ability to identify when a patient is migrating from a healthy, low-risk cluster to an unhealthy, higher-risk cluster provides powerful insight into managing the health of the patient population.
When to build new models
“THE QUESTION BECOMES ‘DOES THE MODEL NEED TO BE REBUILT?’”
The cluster models built are a probabilistic representation of the patients sharing a particular primary diagnosis at that time. As time goes by, more data are collected and the patient-centered datasets are updated accordingly. The question becomes “does the model need to be rebuilt?”
Since the cluster models are a probabilistic representation of the underlying data, it is possible to measure the fit of the model to the patient-centered dataset at any given time. If the fit of the model to the data decreases by a relatively large amount, this is an indicator that the model needs to be updated. Specifically, the log-likelihood scores of the model's fit to data are tracked over time, and using Kolmogorov–Smirnov statistics, the mean and standard deviation are computed. If a log-likelihood value over new data is more than 3 standard deviations from the mean, a new cluster model should be built. 19
Results and Discussion
We applied the approach to an urban healthcare system's data based on the following account-level data elements, aggregated to the patient level:
• ICD-9 procedure and diagnosis codes • Revenue codes • Charges (CPT/HCPCS codes) • Patient type • Discharge disposition • Present on admission status • Payer reimbursement rates
Additionally, the following patient-level attributes were used: sex, age, and locale. We also derived frequency attributes such as average days between visits. In this analysis, we focused on patients with a frequent primary diagnosis of type 2 diabetes (ICD-9 diagnosis codes in the range of 250.00–250.92).
Figure 2 is a graphical representation of the cluster model built over this dataset. The model identified 10 distinct clusters. Each node corresponds to a cluster. Nodes with a darker shade indicate that there are more patients belonging to that cluster. The cluster layout is obtained by first computing the symmetric KL divergence between all pairs of clusters. This forms a k×k distance matrix. The cluster nodes in the image are laid out by applying multidimensional scaling to this distance matrix. 20 This process plots the cluster nodes to visually preserve distance information. Lines connecting cluster nodes indicate smaller cluster distances, indicating that patient belonging to these clusters are more similar.
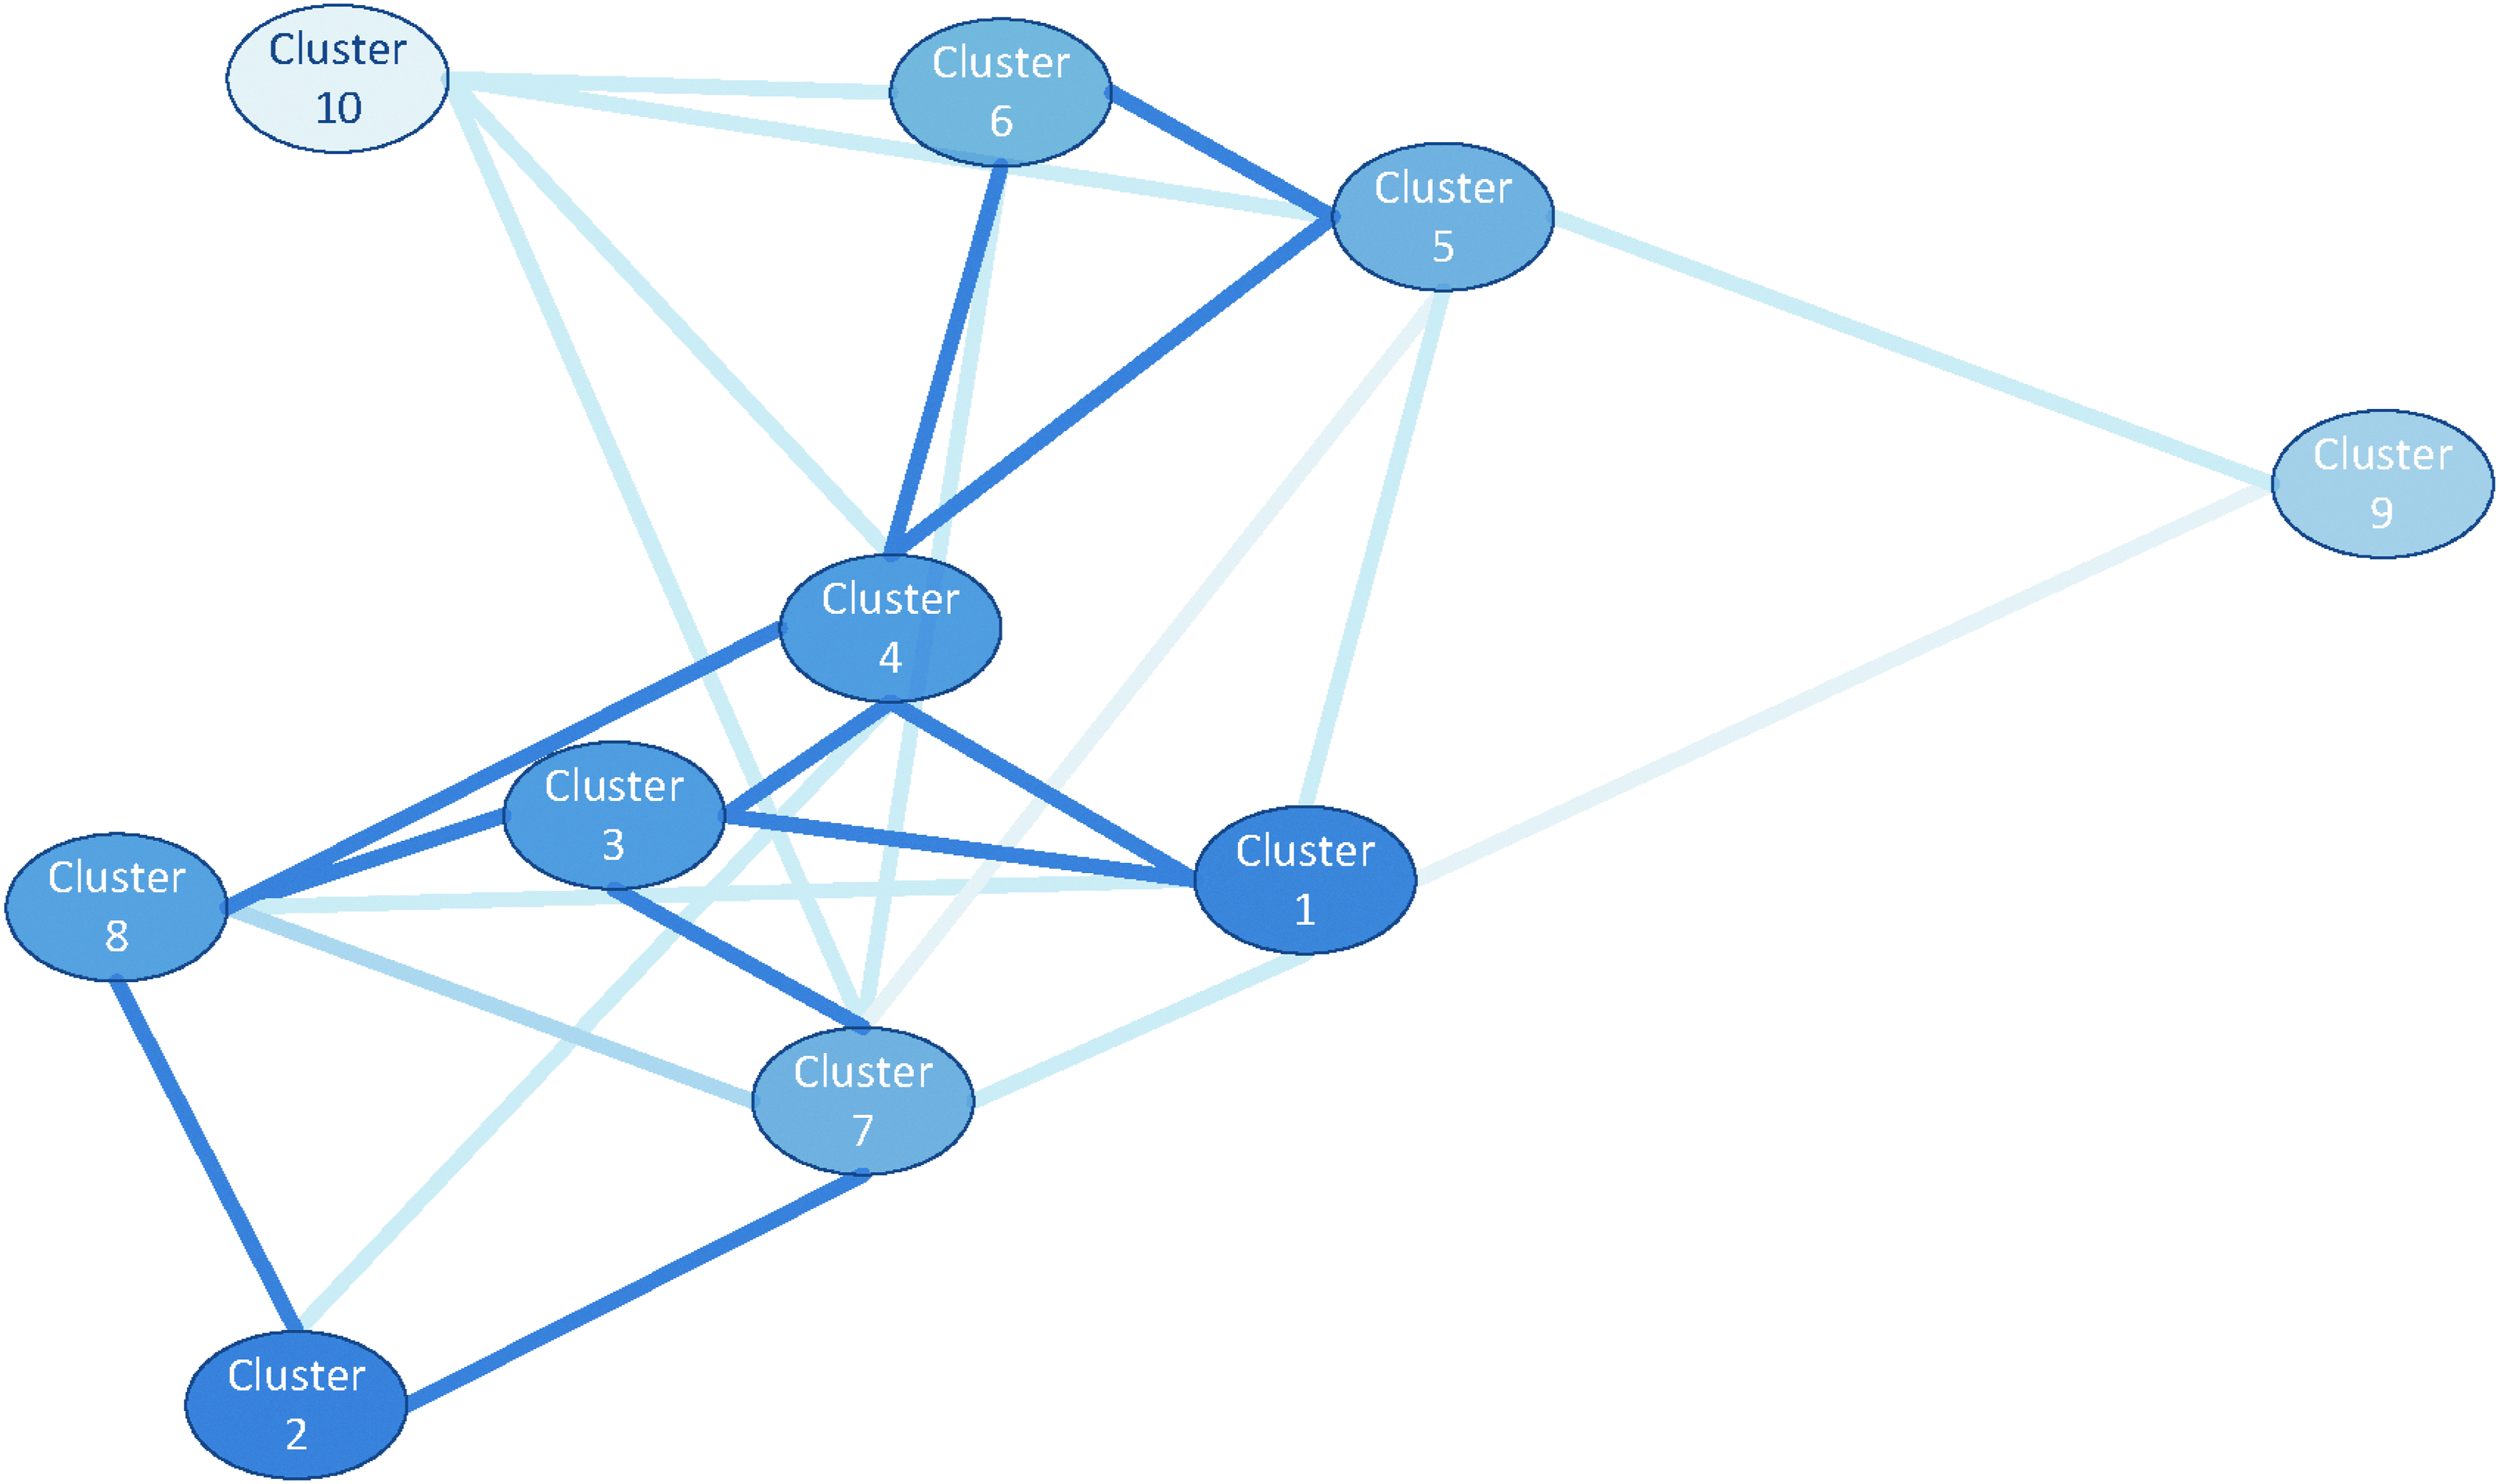
Type 2 diabetes cluster model built over the patient-centered dataset.
There were two particularly interesting clusters identified. Cluster 2 consists of patients who are controlling their condition (have few and regular outpatient visits, with low total charges). Cluster 9 consists of patients who are not controlling their condition (have more frequent visits with high total charges).
Figure 3 graphically presents attribute–value pairs that distinguish patients in cluster 2 (labeled “proactive care”) versus the remaining population. The bars under “Favors Proactive Care” graphically represent large discrimination scores for the cluster:
Top properties distinguishing patients in the “proactive care” type 2 diabetes cluster versus the remainder of the type 2 diabetes population. Bars to left indicate properties favoring the proactive care population (logarithm of probability ratio value used to derive bar length is in parentheses). Bars to the right indicate properties favoring the remaining population (logarithm of probability ratios is in parentheses).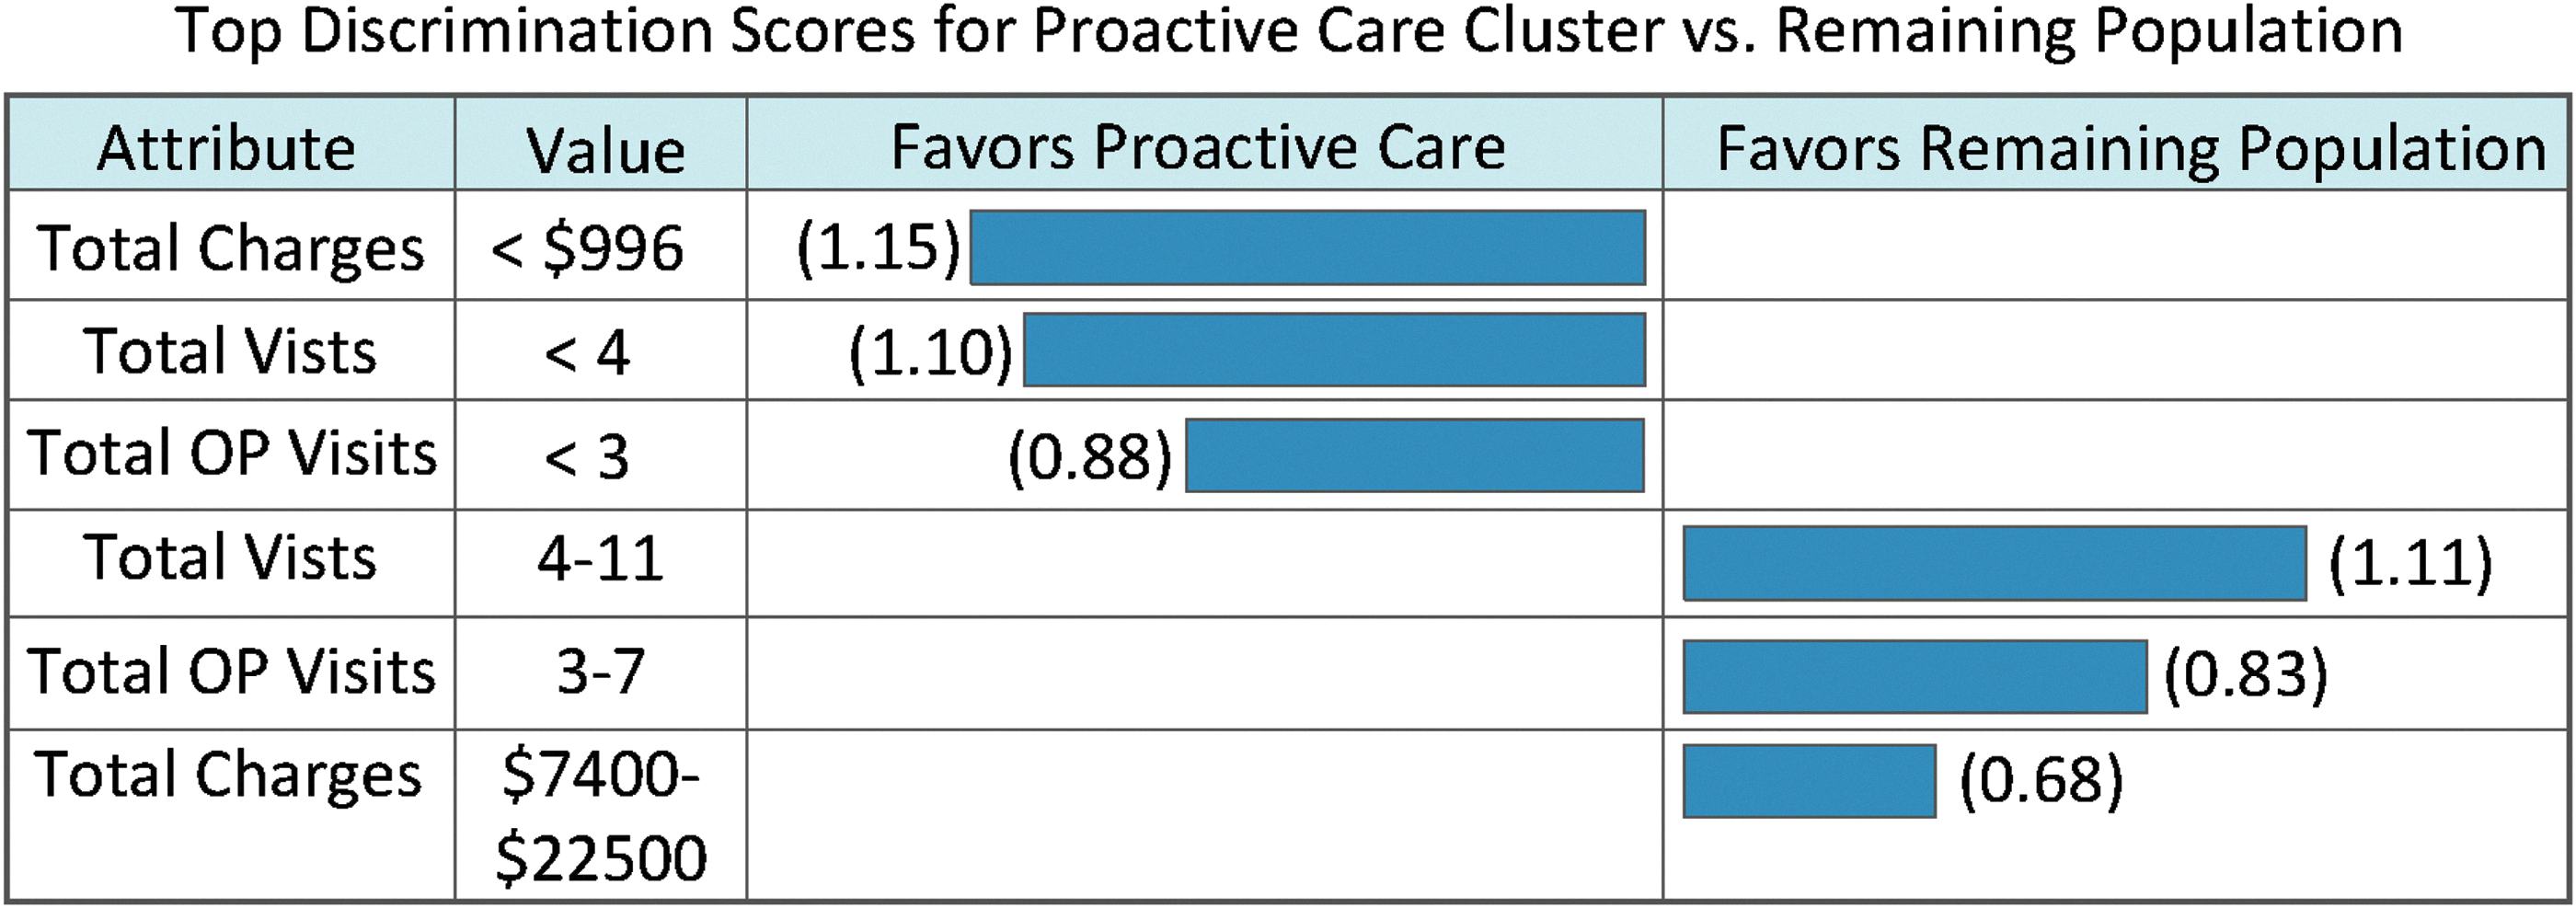
where ¬h2 indicates all clusters except h2 (remaining population) and E is the attribute–value pair (e.g., in the first row, E is the event “Total Charge <$996”). Similarly, the bars under “Favors Remaining Population” graphically represent large discrimination scores for the remainder of the population:
Figure 4 is the same graphical representation of distinguishing features for cluster 9 (“uncontrolled” type 2 diabetes condition). The hospital system found these two clusters particularly interesting and is identifying the next steps to take to track migration to/from them as they manage their patient population.
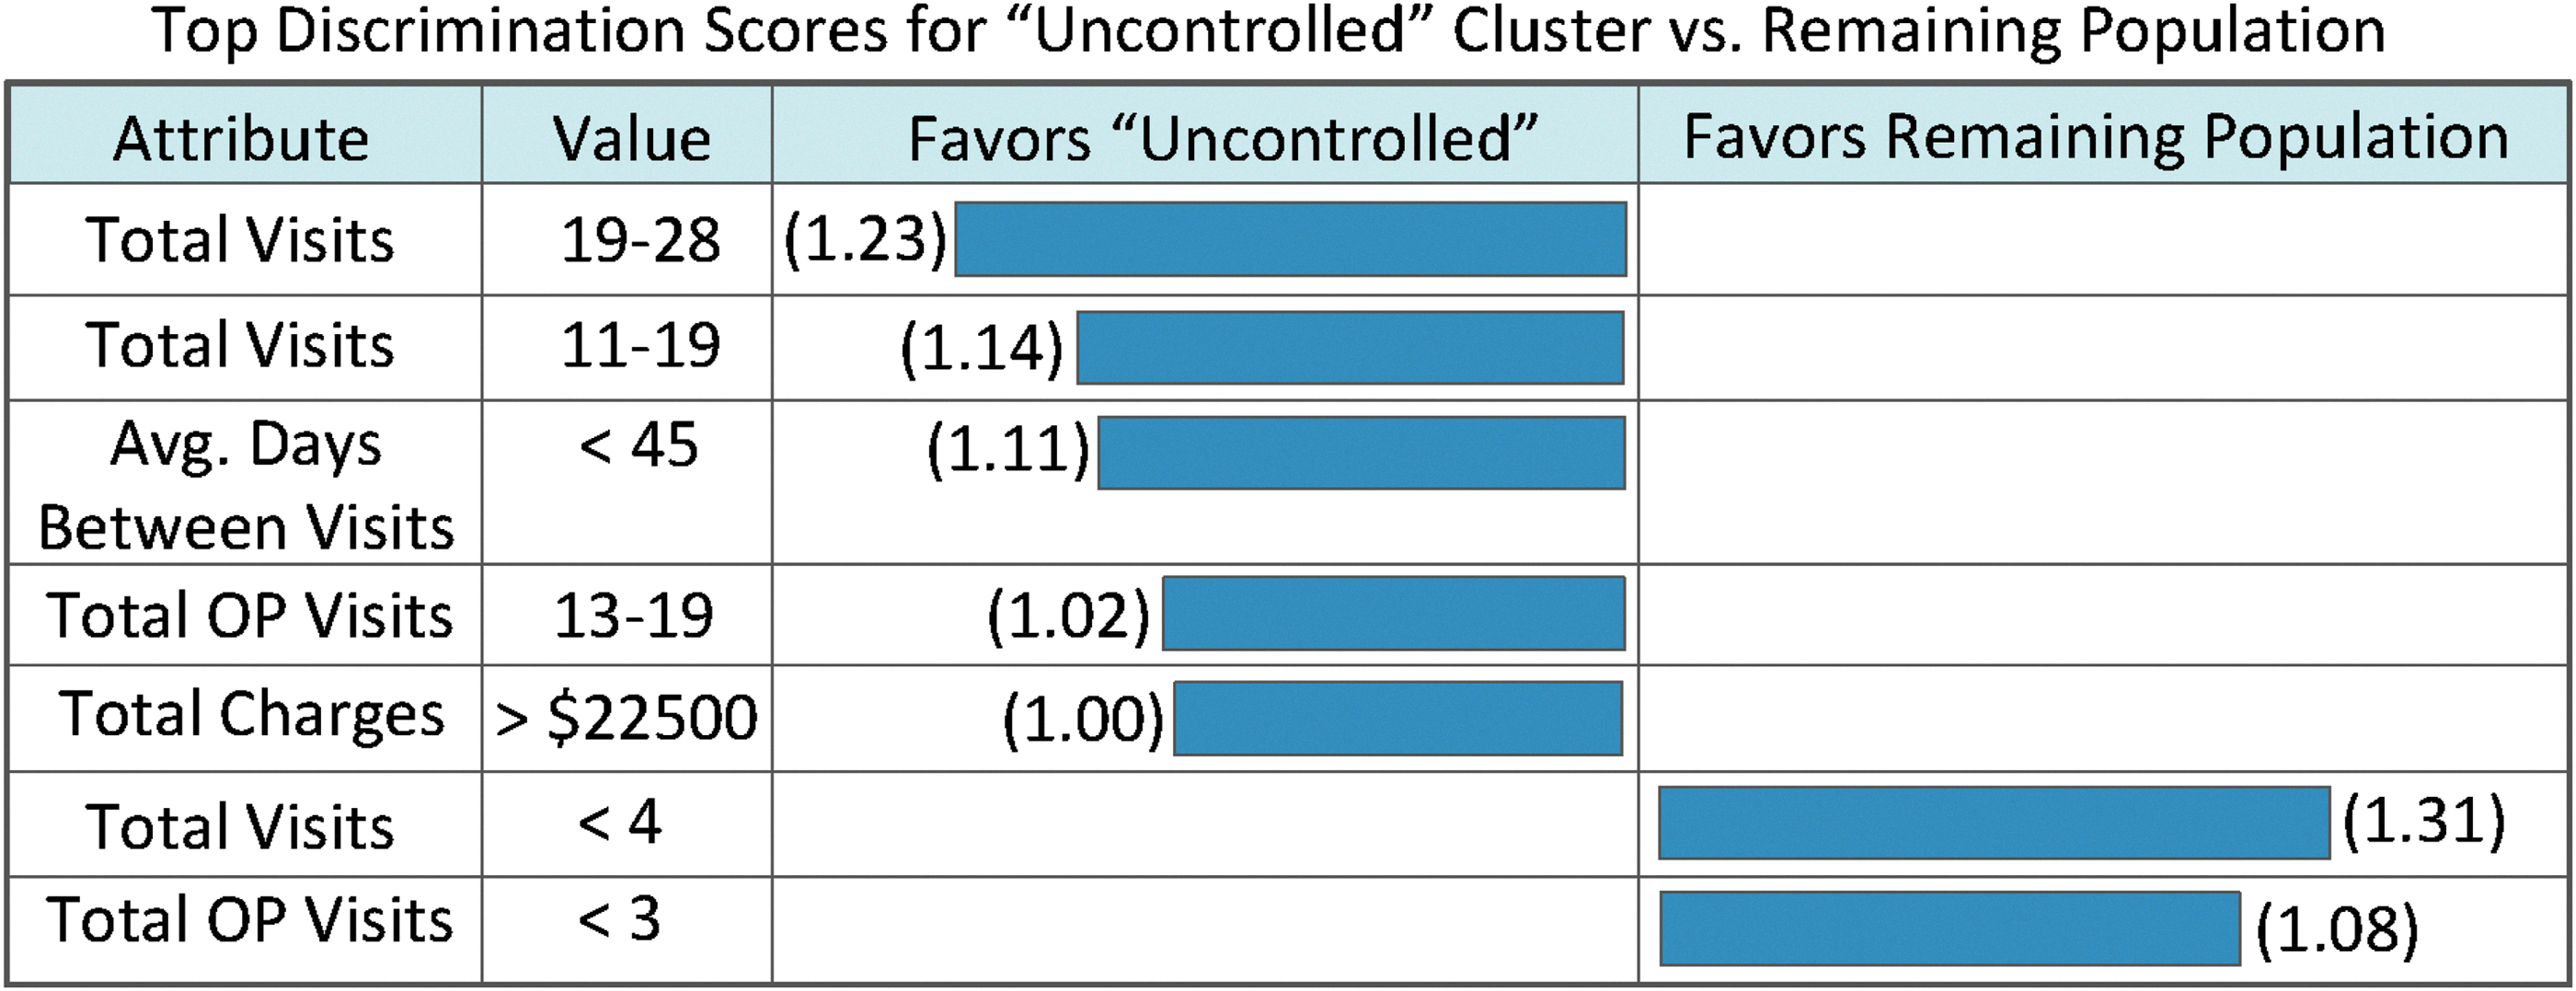
Top properties distinguishing patients in the “uncontrolled” type 2 diabetes cluster versus the remainder of the type 2 diabetes population. Bars to left indicate properties favoring the uncontrolled population (logarithm of probability ratio value used to derive bar length is in parentheses). Bars to the right indicate properties favoring the remaining population (logarithm of probability ratios is in parentheses).
Conclusion and Other Work
As healthcare reimbursement shifts in the United States toward outcome-based models, hospitals need to make the transition to population health management to stay viable. Analyzing the patient population with probabilistic cluster models provides a powerful foundation for up-to-date health and financial risk status while also allowing for proactive alerts as patients may trend toward a less healthy, higher-risk state. These models provide the analytic horsepower to achieve success, as outcome-based reimbursement becomes the norm.
Footnotes
Acknowledgments
I would like to thank Jeff Kaplan, Dan Ward, Sager Chowlera, and Jason Merck at MethodCare for many conversations and analyses that resulted in this work. I would also like to thank Samantha Schaul, Jeff Kaplan, and Brad Aaron for help with the article.
Author Disclosure Statement
The author is chief data scientist at MethodCare, Inc.