
Abstract
Community Brief
Why is this an important issue?
Social functioning in autism is complex. Simply knowing someone is autistic or has many autistic traits does not tell us which aspects of their social preferences are positive or neutral and which might cause challenges. Research needs to focus more on identifying specific social differences that harm quality of life (QoL) rather than treating autistic traits as one general category.
What was the purpose of this study?
The study aimed to (1) identify specific social functions linked to autistic traits and (2) find out which of these might lower QoL.
What did the researchers do?
They recruited 366 adults, including 78 autistic individuals. Participants completed questionnaires about various social traits, including social reward (enjoying interactions), mentalizing (understanding others’ thoughts), empathy (sharing others’ feelings), social anxiety, alexithymia (difficulty understanding one’s own emotions), and face blindness (difficulty recognizing faces). Participants also reported autistic traits, QoL, and various background factors.
What were the results of the study?
All tested aspects of social function, except empathy, were linked to classic autistic traits. However, only alexithymia and low social reward negatively affected QoL.
What do these findings add to what was already known?
The study provides a more detailed understanding of how specific social traits contribute to autistic social behaviors and identifies traits that may harm QoL. The statistical methods used ensure that the findings are broadly applicable while recognizing individual differences.
What are potential weaknesses in the study?
Using self-report and anonymous participants might have led to errors or biases. Other unknown factors may also have influenced the results.
How will these findings help autistic adults now or in the future?
Separating natural personality traits in autism from social challenges that may need treatment can guide the development of personalized, effective interventions that respect individual needs and priorities.
Introduction
Autism is possibly the most heterogeneous neuropsychiatric diagnosis in existence, with identifying behaviors ranging from low-level sensorimotor functions to the highest levels of social cognition. To receive the diagnosis of an autism spectrum disorder according to the Diagnostic and Statistical Manual of Mental Disorders, Fifth Edition (DSM-5), a person must show evidence of difficulties with social-emotional reciprocity, nonverbal communication, and the ability to develop and maintain relationships. In addition, the person must show autistic characteristics in two out of four nonsocial domains: stereotyped or repetitive behaviors, insistence on sameness or rituals, restricted or intense interests, or sensory symptoms (Rigid and Repetitive Behaviors, RRB). Individuals can fulfill each of these criteria in numerous ways and with various levels of severity, leading to enormous variability in the autistic group. While some autism cases are associated with a known or suspected pathology, such as a monogenic syndrome or environmental cause (e.g., valproate in pregnancy), the majority (∼85%) of cases are idiopathic and attributed to polygenic variations.1,2 Autism has increasingly been reconceptualized as personality rather than pathology, with some autistic characteristics showing evolutionary, societal, or personal benefits, and much of the impairment arising from an environment that is incompatible with the individual.3B4 -6 Yet, autistic individuals and people with high autistic traits (AT) generally need, or can benefit from, support systems and psychosocial interventions to improve quality of life (QoL) and other outcomes. However, interventions that focus on removing the “autisticness” of individuals (such as social training aiming to achieve a more typical function) can be very harmful to mental health,7,8 illustrating the importance of distinguishing treatable difficulties from personality differences that can be embraced and respected.
In the domain of social function, autism/ATs are associated with potentially disadvantageous characteristics (e.g., reduced theory of mind) and positive traits (e.g., strong sense of loyalty and fairness). Neural systems underlying social function extend far beyond the classical “social brain”/default mode network, comprising networks for perception, reward, aversion, mirroring, and higher-order systems controlling attention and theory of mind. 9 Autistic social function likely involves individual differences across all of these systems. The patterns of differences are likely as heterogeneous as the individuals themselves and are not necessarily pathological in nature. To better understand autistic neurotypes and identify treatment targets that would improve outcomes judged to be prioritized by the community, it will be necessary to adopt a more nuanced multidimensional perspective on social function and other aspects of autism.
One way of realizing such a perspective is to fractionate social function into measurable social dimensions with potential relevance to function and well-being in individuals on the spectrum. This approach is consistent with a broad paradigm shift in psychiatry, implemented through large-scale initiatives such as the Research Domain Criteria (RDoC).10,11 The RDoC is an ongoing effort to fractionate and classify human behavior according to the underlying neural, molecular, and genetic mechanisms, and pairing the smallest separable components of behavior (constructs and subconstructs) with research paradigms suitable for quantifying them. For example, social anhedonia and mentalizing difficulties, which are both elevated on average in autistic populations, are in the RDoC matrix classified under Social Processes > Affiliation and Social Processes > Perception and Understanding of Others > Understanding Mental States, respectively. The RDoC approach is entirely transdiagnostic, based on the growing consensus that most psychiatric and neurodevelopmental conditions have poor construct validity or construct legitimacy. 12 The framework encourages investigation of constructs across multiple units of analysis, from self-report or behavioral readouts to molecular and genetic measures. A long-term consequence of a transdiagnostic, dimensional perspective on human function is that individual function and dysfunction may be described using a combination of constructs that are both biologically specific and objectively testable. For example, autistic social function may ultimately be more usefully described as variation across multiple different transdiagnostic constructs than as results on the low-dimensional tools provided by the diagnostic manuals or AT questionnaires.
Several social dimensions have been suggested as potential endophenotypes for autism or as transdiagnostic factors affecting autistic mental health.13,14 In this study, we focused on a set of social dimensions with the following properties: (1) measurable with validated psychometric scales optimized for individual differences research, (2) a distribution indicating polygenic heritability and spectrum nature, and (3) a theoretical or demonstrated potential to contribute to autistic well-being or social function. While ATs, measured by questionnaires, have these properties too, their social subscales are composites of many potential RDoC constructs, thus likely engaging a variety of neural systems with great interindividual variability. The chosen candidate constructs were social anhedonia, theory of mind, affective empathy, social anxiety, alexithymia, and prosopagnosia. While social anhedonia and theory of mind are related to classical diagnostic characteristics,13,15,16 the others have been associated with the autistic phenotype as co-occurring phenomena or possible endophenotypes (see Supplementary Data).14,17,18
The first part of the study addressed to what extent the six social dimensions explained variance in social ATs, utilizing a Bayesian model comparison approach. Dimensions that explain unique variance in ATs are likely to be relevant to autistic and high-AT people, either as a co-occurring phenomenon or as an intrinsic component of social autistic function. The second part of the study used contemporary causal inference methods to estimate the effects of the social dimensions/endophenotypes on QoL. This allowed separation of social characteristics that may impact individuals’ well-being and need clinical attention, from those more likely to be acceptable to the individual as part of their personality.
Methods
The study was conducted in accordance with the Declaration of Helsinki. It was exempt from ethical review in accordance with the Swedish law (2003:460) on ethical review of research, because the participants were anonymous, and we collected no data that could identify their identity. All participants provided digital informed consent before participating and were free to exit the study at any time. The participants were reimbursed for their time through the recruitment service Prolific.co.
Participants
A sex-balanced sample of 393 participants residing in North America were recruited from Prolific.co 19 and directed to the questionnaire study hosted on Gorilla.sc. 20 Prolific allows the researcher to recruit specific sub-populations within their large database, through a range of optional pre-screening filters. We first recruited a sample (n = 201) using the following set of exclusion filters: Not fluent in English, multiple sclerosis, mild cognitive impairment/dementia, known hearing loss, not having normal or corrected-to-normal vision, having completed less than 10 previous Prolific studies, and having an approval rate of less than 100%. Because this open recruitment was biased toward young, neurotypical participants, we next ran two more waves of recruitment, both with the same inclusion/exclusion filters as above, except for (1) age range 40–70 years in the second wave (n = 100) and (2) autism diagnosis in the third wave (n = 92). There was no overlap in participants across the three recruitment waves. The recruitment resulted in a transdiagnostic sample of 393 participants with a broad range of ages and ATs. Out of the 393 participants, we excluded individuals who reported vision impairment (n = 11), schizophrenia (n = 3), neurological degenerative disorder (n = 1), genetic disorder (n = 1), brain tumor (n = 1), or stroke (n = 2). One participant was excluded due to omitting questions, and six were excluded because they admitted not answering truthfully (see below). The final sample contained 366 participants (Tables 2–3).
Questionnaires
The questionnaire study consisted of a background questionnaire and nine psychometrically valid questionnaires (see below) probing the constructs of interest and confounding constructs. Their internal consistencies are shown in Table 1. After the background questions, the psychometric questionnaires were presented in randomized order. Because social ATs is a large composite construct, whereas the others measure narrower constructs (e.g., theory of mind, social motivation), there is some item overlap. We viewed such overlap as natural due to the very wide scope of the AT construct and the conceptual overlap of some of the latent variables.
Measured Constructs, Instruments, and Their Internal Consistency (Cronbach’s α, Estimated in the Study Sample, N = 366)
See the Methods section for more information on the questionnaires. Some total scores were reversed to ensure a higher score always indicated a greater deficit, with the exception of quality of life. General anhedonia and generalized anxiety were included as confounders.
Background questionnaire
After providing digital consent, participants completed a questionnaire about their demographic and clinical background. We used the following variables for our analyses: age, gender identity, sex assigned at birth, education, parental education, and employment status. The clinical section of the questionnaire asked about potentially confounding neurodevelopmental or psychiatric diagnoses. Neurodevelopmental diagnoses included attention-deficit/hyperactivity disorder (ADHD), specific learning disorders, communication/language disorders, tic disorders, and intellectual disability. Psychiatric diagnoses included mood disorders, stressor-related disorders (adjustment disorders, posttraumatic stress disorder), eating disorders, personality disorders, and schizophrenia. We also asked about progressive neurological disease, genetic syndromes, and traumatic brain injury. Next, we asked whether the participant had received social and clinical support pertaining to neuropsychiatric challenges (e.g., difficulties with learning, social function, communication, motor development, or concentration) during childhood and adolescence. Specifically, we asked about medication/therapy for mood or anxiety, medication to help concentration (e.g., Ritalin), extra support at school (e.g., through an individualized education plan), or other extra professional support (e.g., speech therapy). Lastly, we used the following “conscience-evoking” question: “Did you choose to respond (truthfully) on this page?” Participants who answered “No” to this question received payment but were excluded from the analysis.
The Comprehensive Autistic Trait Inventory
The Comprehensive Autistic Trait Inventory (CATI) is a modern AT measure with very robust factor structure and non-pathologizing language and has been previously validated in both the general 21 and autistic populations. 22 It measures levels of ATs across six subscales divided into two general factors. 21 The Social Factor (“CATI-Social”) contains the Social Interactions, Communication, and Social Camouflaging subscales, while the RRB Factor contains the Cognitive Rigidity, Repetitive Behavior, and Sensory Sensitivity subscales. The questionnaire contains 42 questions that participants rate from 1 (definitively disagree) to 5 (definitively agree). To isolate the social domain, we used CATI-Social, with potential scores between 21 and 105. The CATI has excellent convergent validity with more established measures, especially the Social Interactions and Communication subscales, which were highly correlated with the corresponding Autism Spectrum Quotient subscales. The Social Camouflage subscale targets behaviors more commonly reported by autistic females than males, such as using social scripts or following certain rules to get by in social situations. It is a newer, more contested, construct, but it loads onto the same latent social factor as the other sociocommunicative CATI subscales. However, to ensure that our results were not driven solely by the Social Camouflage subscale, we report a replication of our main results using only the sum of the Social Interactions and Communication subscales (Supplementary Data).
The Anticipatory and Consummatory Interpersonal Pleasure Scale
The Anticipatory and Consummatory Interpersonal Pleasure Scale (ACIPS) tests an individual’s capacity for social enjoyment (hedonic response to social input). 23 Statements are rated on a six-point Likert scale, ranging from 1 (Very false for me) to 6 (Very true for me). The ACIPS has been previously used to study the relationship between ATs and hedonic capacity. 16 Total scores range from 17 to 102. We reversed the original score so that higher scores meant higher levels of social anhedonia (lower social enjoyment).
The 20-item Prosopagnosia Index
The 20-item Prosopagnosia Index (PI-20) measures prosopagnosia with 20 questions scored on a 5-point Likert scale. 24 The items ask participants about their face memory and indications of face blindness. The PI-20 has previously been used in studies of face perception in neurotypical and autistic samples.25-27 The response options were rated on a Likert scale from 1 (Strongly Disagree) to 5 (Strongly Agree), and the total scores range from 20 to 100. We reversed the original score so that higher scores meant higher levels of prosopagnosia.
The 20-item Toronto Alexithymia Scale
The 20-item Toronto Alexithymia Scale (TAS-20) measures alexithymia using 20 items rated on a 5-point Likert scale ranging from 1 (Strongly Disagree) to 5 (Strongly Agree), with total scores ranging from 20 to 100. 28 The TAS-20 is one of the most commonly used alexithymia instruments and has been validated in a small clinical autism sample. 29 The questions ask participants about their ability to identify, describe, and utilize emotional information.
The Questionnaire of Cognitive and Affective Empathy
The Questionnaire of Cognitive and Affective Empathy (QCAE) measures participants’ empathy across five subscales divided into two larger constructs: cognitive empathy (theory of mind) and affective empathy (emotion contagion), 30 with theory of mind comprising the subscales perspective taking and online simulation, and affective empathy comprising the subscales emotion contagion, proximal responsivity, and peripheral responsivity. 30 The QCAE has not been validated in an autistic sample but has highlighted differences between autistic and neurotypical populations in previous research. 31 The questionnaire consists of 31 questions scored on a 4-point Likert scale. Total scores range from 31 to 124. Scores were reversed so that higher scores corresponded to a higher degree of impairment.
The 7-item Generalized Anxiety Disorder Scale
The 7-item Generalized Anxiety Disorder Scale (GAD-7) measures symptoms of generalized anxiety. 32 The questionnaire asks about the frequency of symptoms within the last 14 days. GAD-7 is a widely used anxiety measurement and has been validated in autistic populations. 33 The scoring ranges from 0 (Not at all) to 3 (Daily). Total scores range from 0 to 21, with higher scores indicating more severe generalized anxiety.
The Ryerson Social Anxiety Scale
The Ryerson Social Anxiety Scale (RSAS) consists of two separate scales, the social situations scale and the severity scale. 34 The severity scale contains follow-up questions for participants with high scores on the social situations scale. To avoid administering different numbers of questions to different participants, we used only the social situations scale. Participants rate their level of experienced anxiety in 23 theoretical situations. Responses range from 0 (No fear or anxiety) to 4 (Extremely severe fear or anxiety). Total scores range from 0 to 92, with higher scores indicating more social anxiety. The scale is a relatively new instrument and has not yet been evaluated in autistic samples.
The Temporal Experience of Pleasure Scale
The Temporal Experience of Pleasure Scale (TEPS) measures the disposition toward pleasurable experiences 35 and consists of 18 questions framed as statements about the respondent. The participants answer on a 6-point Likert scale ranging from 1 (Very false for me) to 6 (Very true for me). The TEPS is a commonly used questionnaire for investigating anhedonia and has previously highlighted differences between autistic and neurotypical samples. 36 Scores range from 18 to 108. We reversed the score so that higher scores corresponded to higher generalized anhedonia.
The 26-item World Health Organization-Quality of Life scale
The World Health Organization-Quality of Life (W-QoL) is a 26-item shortened version of the original 100-item scale. Participants answer on a 5-point Likert scale. The collection of QoL questionnaires created by the World Health Organization are some of the most widely used methods for measuring QoL. W-QoL has been validated for use in autistic populations. 37 For this study, we chose not to include physical health as an outcome and thus excluded the physical health section (seven items) from total scores. The total scores in this study ranged from 19 to 95.
Statistical analysis
Data were preprocessed with in-house MATLAB scripts, and all analyses were conducted in JASP v.0.16.4. 38 Continuous variables were Z-transformed and sign-reversed where needed to ensure that a higher score always indicated greater difficulty. For continuous-binary correlations, Pearson’s r was used due to it being mathematically identical to point-biserial correlations for continuous-binary relationships. For continuous-continuous correlations, Spearman’s rho was used. For binary–binary correlations, we calculated Phi coefficients. Two-tailed tests were always used.
Model selection was conducted using Bayesian multiple regression, aiming for the most probable model(s) and determining coefficient inclusion probabilities. Prior distributions were determined using Jeffreys–Zellner–Siow (r scale = 0.354), and model prior probabilities were set to uniform. The sampling method was Bayesian Adaptive Sampling. All analyses used a seed of 1. The alpha level for coefficient inclusion was set at p(inclusion|data) > 0.5. Coefficients were determined as averages across all models and credible intervals were determined over 1000 samples. Effect estimation (see Causal Inference below) utilized similar settings but did not consider any R2 or inference about model probabilities to avoid the Table 2 fallacy. 39
Demographic Information
Percentages indicate proportion of the column total.
SD, standard deviation.
Each dependent variable was inspected for normality assumptions, with both CATI-social factor (Shapiro–Wilk = 0.985, p < 0.001) and QoL (Shapiro–Wilk = 0.989, p = 0.007) showing non-normality. However, the skewness and kurtosis of both CATI-social factor (skewness = 0.077, kurtosis = −0.769) and QoL (skewness = −0.234, kurtosis = −0.363) revealed no extreme violations and can thus be considered to be approximately normal. Visual inspection of normality and heteroscedasticity of residuals (Supplementary Data, Supplementary Fig. S1) revealed no assumption violations in the analyses. Furthermore, complementary frequentist analysis did not reveal any problems with multicollinearity (Tolerance > 0.2; Variance Inflation Factor < 4) or with influential cases (Cook’s distance ≥ 1, n = 0). Performance of the Bayesian regression analyses was diagnosed by visual inspection of residuals (Supplementary Fig. S1).
Bayes factors (BF) were translated in the text to reflect Lee and Wagenmaker’s classifications: Anecdotal (BF = 0.33–3), moderate (BF = 0.1–0.33 or BF = 3–10), strong (BF = 0.03–0.1 or BF = 10–30), very strong (BF = 0.01–0.03 or BF = 30–100), and extreme (BF < 0.01 or BF > 100). 40
Causal inference
Causal inference methods make it possible to estimate causal effects from observational data. 41 Causal relationships are stated via directed acyclic graphs (DAGs). In a DAG, all variables are placed in a temporal order determined by the research question and previous knowledge. Important to note is that causal relationships are assumed from theory and literature, and the effect is estimated in a subsequent statistical analysis based on our assumptions. In our DAG (Fig. 1), we visualize our causal assumptions across four main categories of variables: exposures (green), outcome (blue), confounders (red), and mediators (yellow).
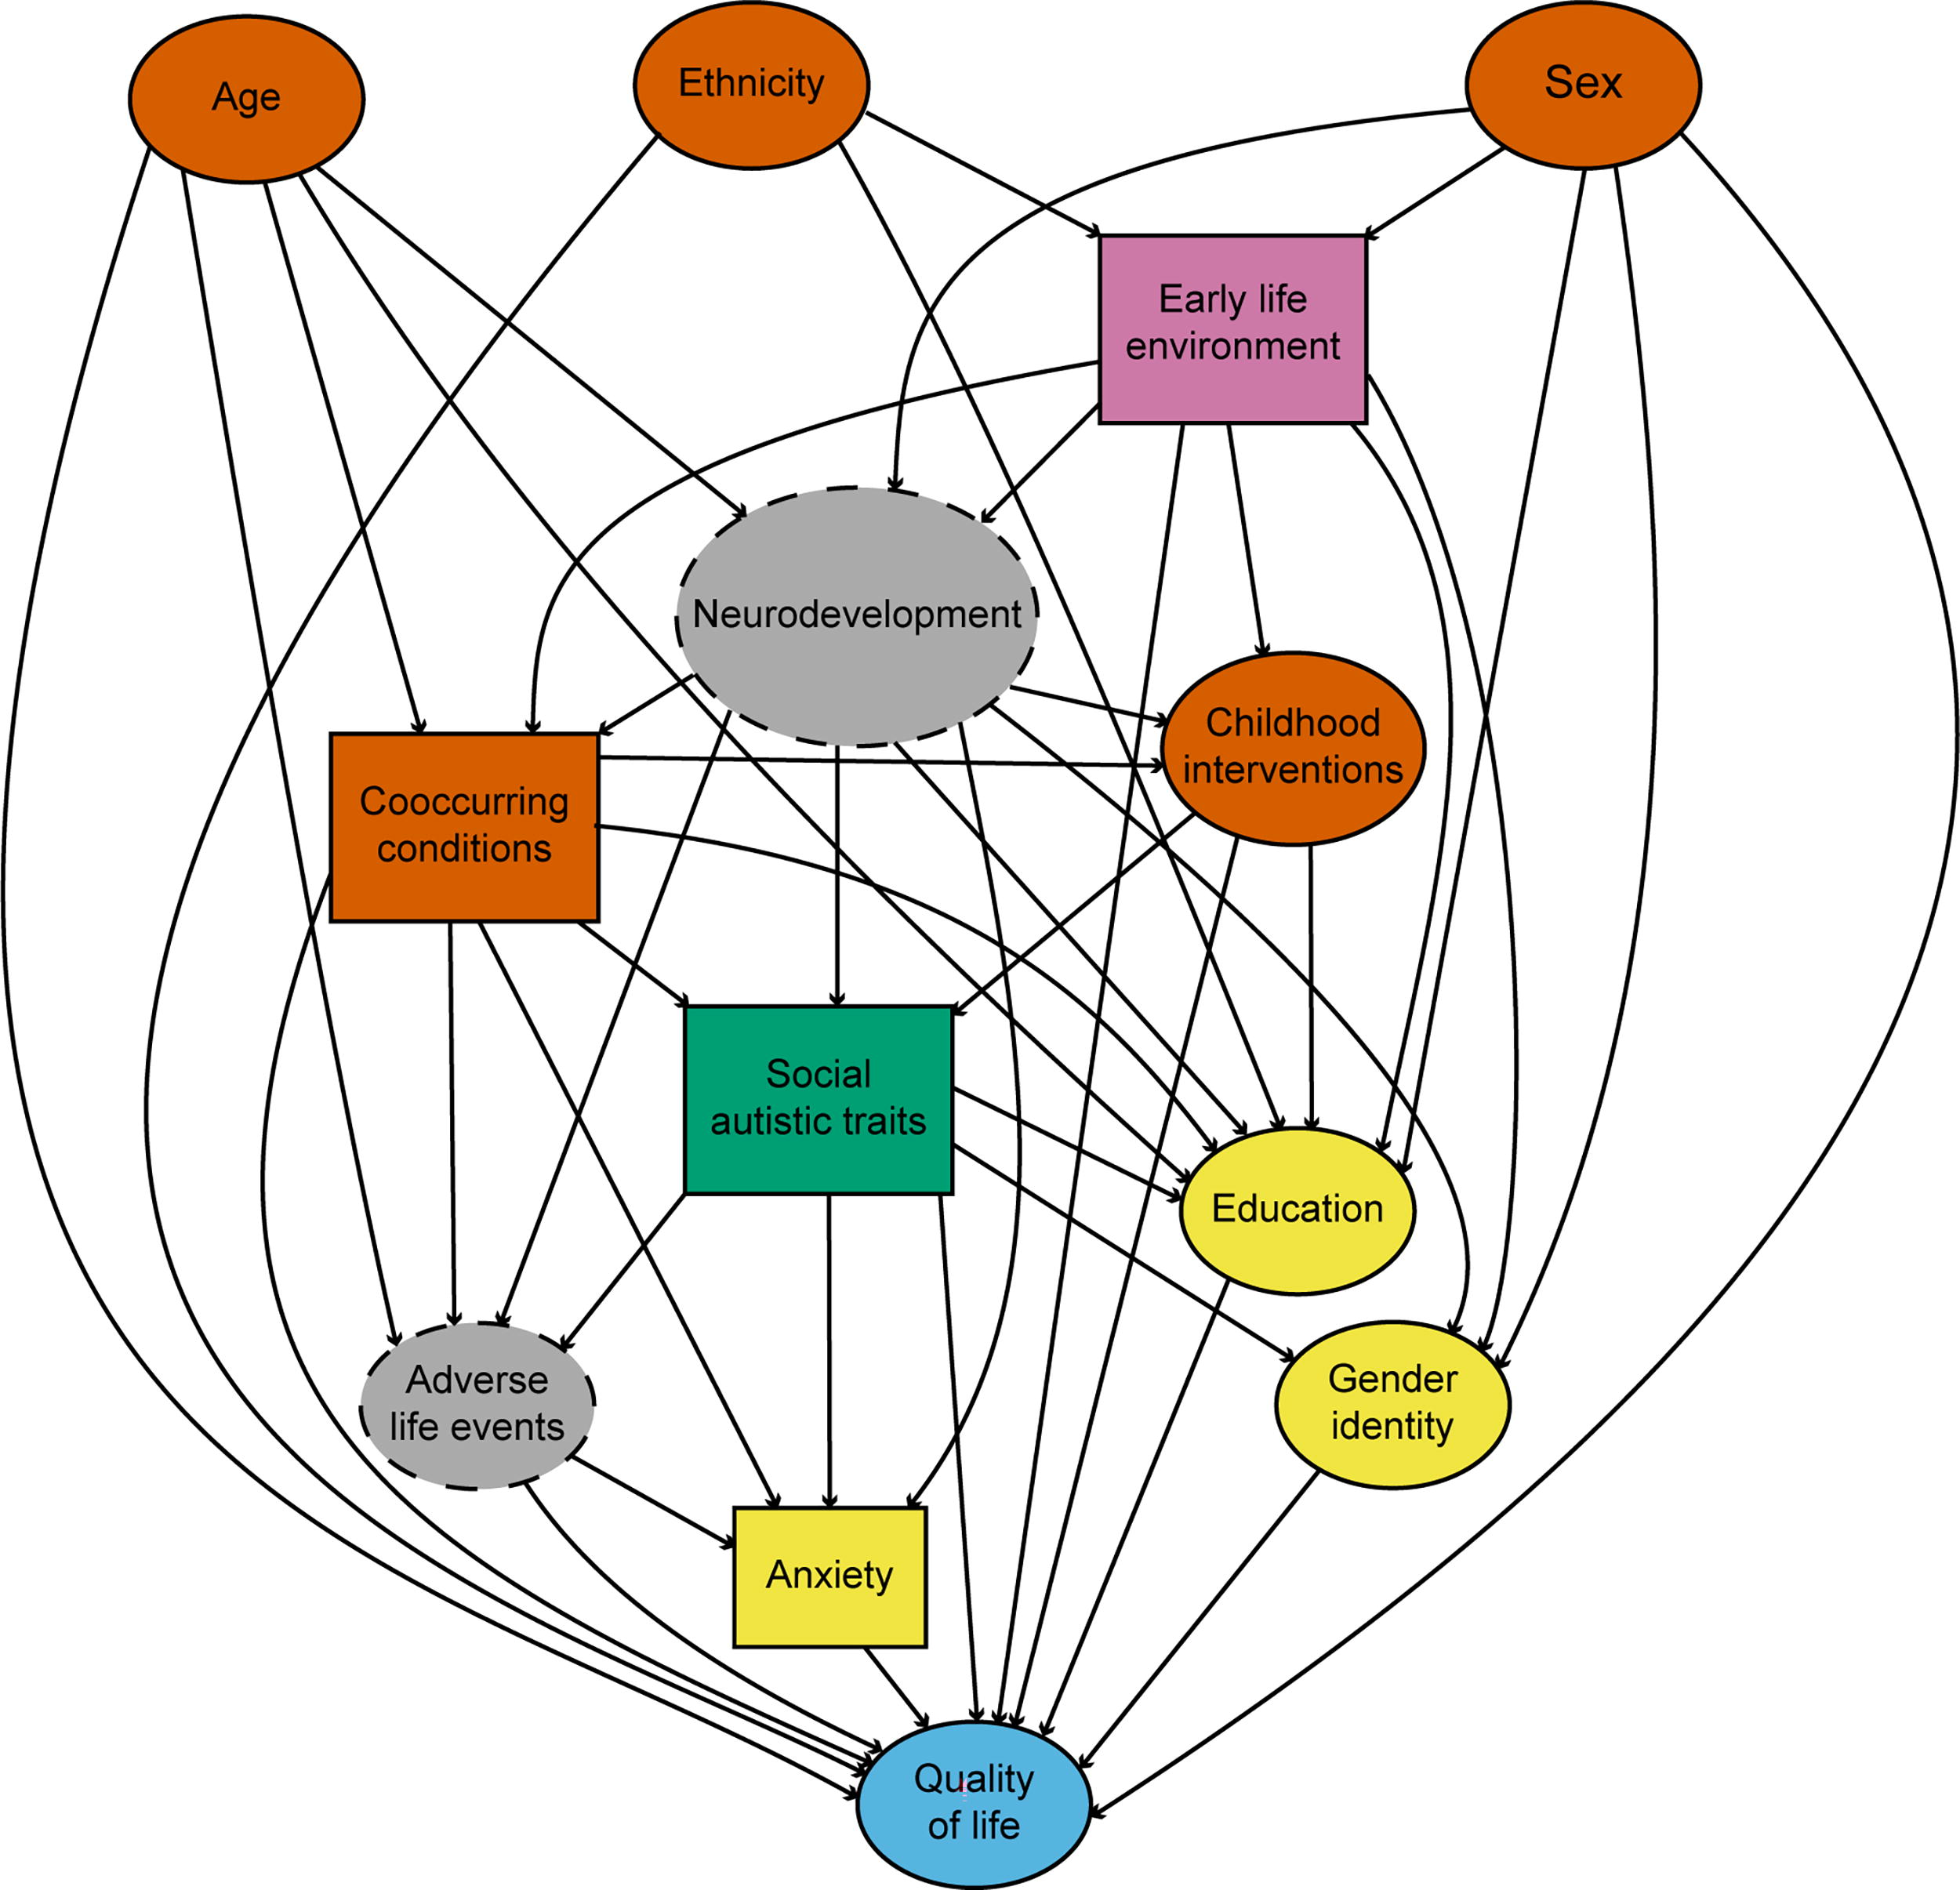
Directed acyclic graph for the focal relationship of adult social autistic traits and quality of life. Nodes are color-coded as follows: Green: Exposures; Red: Confounder; Yellow: Mediator; Blue: Outcome; Gray with dashed lines: Latent/Unmeasured variables; Pink: mixed confounder. The square variables are supernodes containing additional variables (see Methods and Supplementary Fig. S2 for details).
Exposures and outcomes
The focal exposure–outcome relationship in our analysis was the effect of adult social ATs (green in Fig. 1) on QoL (blue), with neurodevelopment as a latent variable (gray). Our basic causal assumption is that autism and other psychiatric conditions—by clinical definition—have a causal effect on QoL, which is proposed as the causal path between ATs and QoL, and the path between co-occurring conditions and QoL. We assume that there are no events that will cause a non-autistic individual to suddenly become autistic. While there are environmental factors associated with an increased propensity of autism, these tend to exert influence early in development, especially during the pre- and perinatal periods, interacting with the polygenic vulnerabilities associated with autism. 42 We also considered the measurement of ATs to reflect the same underlying construct as autism,43,44 placing ATs early in the causal graph, where it may influence all subsequent events. With support from the Bayesian evaluation of endophenotype models in the first part of the study (Table 4), we replaced social ATs with the four RDoC-compatible social dimensions of theory of mind, social anhedonia, alexithymia, and prosopagnosia (see Mediators for our treatment of social anxiety, and Confounders for generalized anhedonia). For clarity, this model is represented as the supernode of “Social autistic traits” in the main DAG in Figure 1, but it is illustrated in full in Supplementary Fig. S2a. Because the model of autistic social function contained four different exposures, one would normally require four separate estimation models for our focal relationship to avoid the Table 2 fallacy.38 However, we instead treated the components of autistic functioning as competing exposures, with all components being subject to the same confounders. We analyzed the impact of this assumption in the Sensitivity Analysis section. Considering them simultaneously as independent from each other with a possible common cause (neurodevelopment) should increase the accuracy of their estimated effects. 45
Confounders
Factors that might affect both AT scores and QoL (positively or negatively) were considered confounders, irrespective of potential effect size. We opted for the cautious approach of conditioning on neurological and psychiatric conditions and certain demographic factors, even if their effect on the focal relationship was ambiguous (acknowledging possible confounding is a smaller claim than assuming a complete absence of a causal relationship).
Early life environment, such as parental socioeconomic status, environmental factors, and parental education, may affect manifestations of ATs. 46 This was represented as a mixed confounder (pink in Fig. 1, fully illustrated in Supplementary Fig. S2b), where some factors were unmeasured. We also included age, sex assigned at birth, and ethnicity 47 (Fig. 1) as early life factors with potential effects on the development of an autistic personality, for example, via developmental environment, and QoL. Controlling for sex assigned at birth also controls for sex differences, sex-specific environmental factors, and sex-driven differences in the presentation of autistic behaviors.21,48
Neurological and psychiatric conditions were collapsed in the supernode called “Co-occurring conditions” in the DAG (Fig. 1), including neurological conditions, non-autism neurodevelopmental disorders, and psychiatric disorders 49 (fully illustrated in Supplementary Fig. S2c). Some more severe confounding conditions were controlled for by exclusion, including genetic disorders affecting neurodevelopment (e.g., Fragile X 50 ) and degenerative brain diseases (e.g., Alzheimer’s). Psychiatric and neurodevelopmental diagnoses were coded into separate aggregate variables, corresponding to any non-autism neurodevelopmental diagnosis and any psychiatric diagnosis, respectively (Supplementary. Fig. S2c). We adjusted for confounding effects of different neurodevelopmental trajectories, or stages, by recruiting an adult sample. We also conditioned on generalized, non-social anhedonia (Supplementary Fig. S2a) to isolate the social aspects of anhedonia. 36
Finally, we controlled for confounding effects of childhood interventions with the potential to modulate autistic symptoms (help for neuropsychiatric challenges during childhood or adolescence; see Supplementary Data), since they might affect both expressed social ATs and QoL. 51
Mediators
We positioned anxiety as a potential mediator (yellow in Fig. 1), based on the assumption that autism can cause anxiety but not vice versa. Autistic individuals are more prone toward adverse life events (latent variable in Fig. 1), such as bullying and social ostracization 52 with the likely outcome of social and generalized anxiety. Hence, we propose this as the dominant causal relationship between the two variables (Fig. 1) within this context. In the DAG, both generalized and social anxiety are contained in the supernode anxiety (Supplementary Data).
We treated gender identity and education as potential mediators (yellow in Fig. 1), assuming that education and gender identity cannot cause ATs to increase. Autistic individuals do not participate in higher education at the same rate as other individuals, 53 but variance in education should not cause variance in ATs according to the current assumptions. The link between autism and gender diversity is understudied, but there is a significant overlap between the two. 54 During neurodevelopment, autistic characteristics usually crystallize before gender identity; therefore, we placed ATs before gender identity in the DAG.
Results
Participants
We analyzed psychometric data from 366 adult participants representing the entire spectrum, including 78 (21%) who self-reported to be clinically diagnosed with autism, and 43 (12%) who self-reported to suspect autism or self-identify as autistic. The sample was sex-balanced, and 77% reported “White” ethnicity. About two-thirds reported having completed higher education. Detailed information is shown in Table 2.
Table 3 shows descriptive statistics of social ATs, candidate endophenotypes, and co-occurring conditions. It also shows correlations between all constructs and conditions with clinically diagnosed autism and social ATs. All the social constructs except affective empathy, as well as the confounders generalized anhedonia and generalized anxiety, were significantly associated with both autism and social ATs. Autism and social ATs showed similar patterns of associations with co-occurring conditions, with very strong associations with anxiety disorder, mood disorder, and social anxiety disorder (Table 3).
Psychiatric and Psychometric Information
See Table 1 for a list of instruments used to measure the constructs. Higher scores indicate a greater deficit. Pearson’s r (point-biserial; DF = 364) was used to test correlations between one continuous and one binary variable, Spearman’s rho (DF = 364) between continuous variables, and Phi coefficient for binary variables (DF = 1).
p < 0.01.
p < 0.001.
AUT, autism spectrum conditions; DF, degrees of freedom.
Social autistic function is best modeled by multiple social dimensions
To evaluate which combination of the candidate constructs best described variance in social ATs, we used Bayesian multivariable regression to compare model probabilities using BF. A BF around 1 (0.3–3) was interpreted as inconclusive, a high BF (>3) was interpreted as evidence for the alternative hypothesis, and a low BF (<0.3) was interpreted as evidence for the null hypothesis (see Methods). Age, sex, ADHD, mood disorder, generalized anxiety, and generalized anhedonia were included in the null model in this part of the study, as they might affect how individuals rate themselves on the CATI.
The most likely model explained a large portion of social ATs (R2 = 0.756) and included theory of mind, social anhedonia, social anxiety, alexithymia, and prosopagnosia, but not affective empathy (BFinclusion < 0.3; Table 4). The second most likely model was moderately less likely than the most likely model (BF < 0.3). The null model explained roughly a third of the variance in social ATs (R2 = 0.323) and was extremely less likely than the most likely model (BF < 0.01). The third and subsequent most likely models were all extremely less likely than the most probable model (BF < 0.01). Thus, a very large proportion of social ATs could be modeled as a combination of social anhedonia, theory of mind differences, social anxiety, alexithymia, and prosopagnosia. Figure 2 shows the broad and overlapping distributions of individual differences in the five potential endophenotypes when split by high-versus-low total ATs (CATI ≥ 134, 21 Fig. 2a) and autism versus neurotypical (no neurodevelopmental condition, n = 257; Fig. 2b). Supplementary Table S1 shows the inclusion probabilities and model selection coefficients for each construct. Excluding the Social Camouflage construct from the social AT variable had no effect on the conclusions (Supplementary Tables S2–S3).
Bayesian Multivariable Regression for Model Selection
Results from the Bayesian multivariable regression analysis used for model selection. The table displays the three most likely models of social autistic traits (dependent variable). All models included the variables used in the null model. p(M) is the prior probability of the model (uniform across all possible models), and p(M|data) is the posterior probability of the model given the data. BFM is the Bayes factor of the model compared with the average likelihood of all other models. BF10 is the Bayes factor of the model compared with a given model. R2 shows the proportion of variance in social autistic traits explained by the model. The questionnaires used to measure the constructs are shown in Table 1.
BF, Bayes factor.
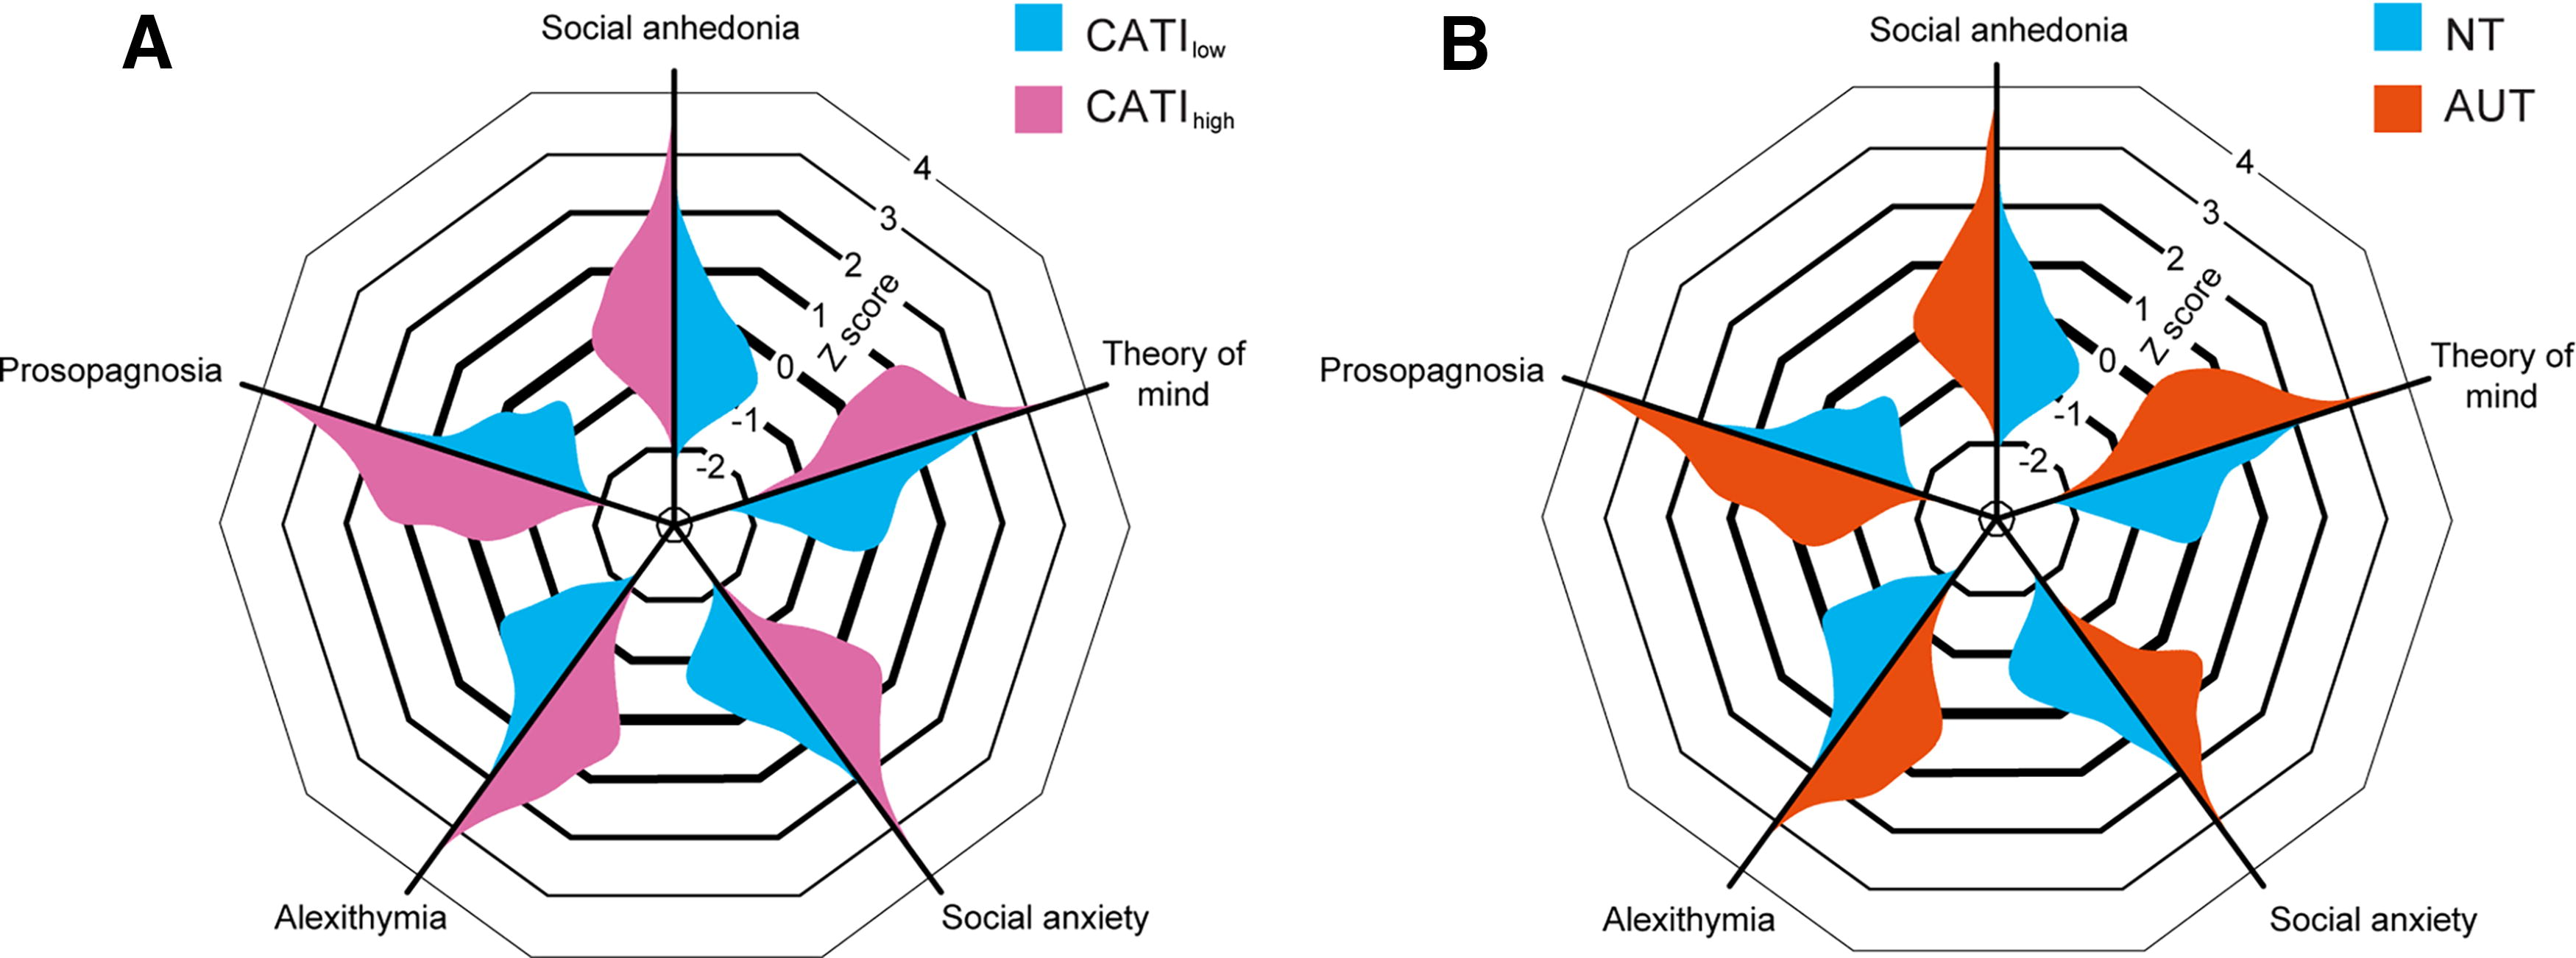
Distributions for five components of social autistic traits, split by high/low ATs
QoL is likely affected by social anhedonia and alexithymia
Even though the candidate endophenotypes explained the majority of variance in social ATs and were elevated in autism/high-AT individuals, not all of them may adversely affect QoL. To estimate the causal effects of each component on QoL, we implemented causal inference methodology to identify a sufficient adjustment set for a subsequent Bayesian regression analysis (DAG in Fig. 1; see Causal Inference in Methods). The potential endophenotypes were treated as competing exposures to each other to control for latent overlapping neurodevelopmental factors. 45 As outlined in the Methods section, we treated anxiety (both social and generalized) as a broad construct that can be a consequence of ATs but also carries a potential to amplify expression of symptoms (including ATs), making it a mediator rather than a competing exposure. We adjusted for the variables in the adjustment set identified from our DAG to estimate the causal effects of the social dimensions on QoL under this set of assumptions. This analysis identified likely effects on QoL for two of the potential endophenotypes: extreme evidence for alexithymia (–0.262 [–0.384, –0.165]; BFinclusion > 100), and moderate evidence for social anhedonia (–0.121 [–0.246, 0.00]; BFinclusion = 4.628) (Table 5).
Coefficients from the Bayesian Multivariable Regression Analysis
Alpha was set to 0.5 [p(incl | data)] for likely effects. Effect sizes reflect Z-scored variables. BFinclusion is the Bayes factor for including the covariate as an effect. Effects were estimated using Bayesian adaptive sampling across 1000 models, and the credible interval was determined over 1000 samples. The mean represents the posterior average value of the coefficient across all models.
Sensitivity analyses
To test our underlying assumptions in our model selection and causal estimation models, we conducted several sensitivity analyses.
Model selection using Bayesian regression
The inclusion of nuisance variables in the null model was not the main reason for high variance explained in the model selection analysis, as removing the nuisance variables did not meaningfully alter the explanatory power of the most likely model (R2 = 0.756 vs. R2 = 0.734). Because we had assumed that social anxiety is a consequence rather than a component of ATs, we tested the model after removing social anxiety. This analysis selected affective empathy as a predictor for social ATs with extreme evidence (BFinclusion > 100). We further wanted to know how well our model predicted ATs in isolation from any other variables. Theory of mind, social anhedonia, alexithymia, and prosopagnosia together explained 57.4% of the variance in social ATs when no other factors were considered.
Effect estimation using causal inference
The main purpose of this section of sensitivity analyses was to examine the impact of our causal assumptions on the results. Hence, sensitivity analyses that were less central to the causal assumptions of the study are reported in the Supplementary Data. We tested altering the assumption of independence between candidate constructs to potential causal relationships by repeating the main analysis once for each component of the model without the other components included. This doubled the effect of social anhedonia (from −0.121 [−0.246, 0.000] to −0.262 [−0.367, −0.153]) and slightly increased the effect of alexithymia (from −0.262 [−0.384, −0.165] to −0.301 [−0.394, −0.210]). It did not dramatically impact the width of the credible intervals or alter the effect for prosopagnosia (0.039 [−4.773e−4, 0.133] vs. −0.019 [−0.111, 0.020]). The greatest effect change was seen for theory of mind, where the previous near-zero effect changed to a negative effect (from −0.006 [−0.068, 0.052] to −0.172 [−0.277, −0.076]).
Treating anxiety and social anxiety as competing exposures instead of mediators (i.e., adjusting for them) reduced the strength of the effects of both alexithymia (−0.111 [−0.222, 0.000]) and social anhedonia (−0.059 [−0.183, 0.000]). Treating only social anxiety as a competing exposure reduced the effect of social anhedonia (−0.026 [−0.148, 0.017]).
These sensitivity analyses suggest that our model of ATs explains a large portion of social ATs, regardless of nuisance variables or social anxiety. Both alexithymia and prosopagnosia’s effects on QoL were robust with no dramatic changes in effect size when varying the competing exposures assumption. Alexithymia and social anhedonia were sensitive to the mediation assumption of anxiety in general, suggesting that their effect on QoL may be mediated or confounded by anxiety. Theory of mind was the most sensitive to the presence of other model components in the regression model.
Decreased QoL was associated with both diagnosed autism (Mann–Whitney test, W = 14725, p < 0.001) and total ATs (Spearman’s rho = –0.514, p < 0.001). As an exploratory analysis, we wanted to know how the relationship between an autism diagnosis and QoL changed when conditioning on symptom dimensions, and vice versa. Including autism diagnosis as a covariate in the effect estimation model caused the association between autism and QoL to become positive rather than negative (mean effect 0.217 [0.000, 0.487]; BFinclusion = 2.961) and did not meaningfully alter the coefficient probabilities for social anhedonia and alexithymia.
Discussion
We found that all tested social dimensions, except affective empathy, explained unique variance in social ATs, whereas only social anhedonia and alexithymia showed negative effects on QoL. Given the strong negative effects of alexithymia and social anhedonia on well-being and their higher neural specificity compared with autism/ATs, they may be useful as targets for interventions in the future.
The identified social dimensions span several RDoC domains and constructs, including perception (prosopagnosia), approach motivation (social anhedonia), potential threat (social anxiety), perception and understanding of self (alexithymia), and perception and understanding of others (theory of mind). All of these constructs have previously been reported as autism-relevant.13-15,17,55-57 Our results also provided evidence against a role of affective empathy, consistent with previous work.58-60 The remaining, unexplained, variance in social ATs is likely to be explained at least in part by differences in social communication, in particular social pragmatic communication differences, which are part of the core autism criteria and part of the social factor of the CATI. Including such communication differences was beyond the scope of this study, as they are difficult to accurately address with psychometric methods and are confounded by language ability. Measurement error, originating from, for example, individual differences in the interpretation of questions, was probably another source of unexplained variance. However, the ability of our five-dimensional model to explain the majority of variance in social ATs suggests that it is a reasonable representation of autistic-like social differences. The relevance of so many RDoC domains to autistic function strongly supports efforts of deep and transdiagnostic phenotyping of research participants.
The association between the social dimensions and autism/AT indicates that they are relevant to autistic social experiences. However, the observation may further be consistent with them being components of a composite social-AT construct. This possibility has a profound statistical consequence: Any analysis based on autism/ATs that simultaneously controls for a trait, symptom, or co-occurring condition that is a component of autism/ATs would then be confounded by collider bias (see Supplementary Data for more details). While we cannot yet conclusively say whether variations in, for example, prosopagnosia or alexithymia, contribute to determining a person’s expression of social ATs (making them components of ATs), we cannot yet exclude this possibility. Therefore, we strongly urge researchers to be very cautious when choosing covariates in autism studies. In practice, this means that if we have a psychiatric composite construct (such as autism or ATs) as an independent variable, and want to control for a neurobehavioral dimension (such as social anhedonia), we must first consider the possibility that this covariate reflects a component of autism. If it does, and we include it in the statistical model, we risk collider bias. In other words, if a neurobehavioral dimension is part of autism, it has different statistical implications than if it is a consequence of, or is entirely independent of, autism. To increase transparency about how our assumptions about this may affect the conclusions of our studies, we recommend (1) explicitly outlining our assumptions about the potential relationships between the studied constructs and (2) conducting sensitivity analyses to show how these assumptions may affect the results. Collider bias was likely the cause of our finding that, when autism diagnosis was included as a covariate together with the social dimensions (its potential components) in the estimation model, autism appeared to have a positive effect on QoL despite showing a negative relationship when considered in isolation (Sensitivity Analyses).
Modeling social ATs as a composite of neurally and behaviorally specific components is in line with RDoC and has the advantage of allowing for the extreme phenotypic heterogeneity observed throughout the research literature. Instead of averaging out individual differences by looking at group means, multidimensional models of social function may more accurately reflect the complex reality of the autistic experience and the variation between individuals.
Alexithymia and social anhedonia as transdiagnostic risk factors
Alexithymia is considered a heritable transdiagnostic risk factor for many psychopathological states and involves difficulties with awareness and differentiation of one’s own emotions. It has previously been linked to life satisfaction 61 and mental health.62,63 While alexithymia is not a social function per se, it has been linked to variation in emotion regulation and social skills. 64 General emotion regulation deficits have been shown to be associated with social impairment in autistic populations.65,66 The total effect of alexithymia on QoL observed in our study might involve direct effects of emotion dysregulation but could also include a mediating effect of social differences. Disentangling these possibilities, as well as understanding the interactions of alexithymia, emotion regulation, and social function during development, will require longitudinal studies. Given the dominant effect of alexithymia on QoL in this study, together with its contribution to variance in social ATs, we suggest that it is important to further characterize its heritability, neural correlates, and clinical significance within and across diagnostic borders. It may be possible to provide interventions for alexithymia. For example, dialectical behavior therapy, focused on improving emotion regulation, has illustrated positive results. 67
The effect of social anhedonia on QoL was not as likely as that of alexithymia, but it was supported by moderate evidence (BF > 3). We corrected for general anhedonia in the current study, to isolate the social aspects of hedonic responses, which lessened the influence of depressive traits on the results. A tendency to focus on and enjoy activities in solitude is common in autism and is not in and of itself a source of suffering. Therefore, even though the effects of social anhedonia on QoL might be related to differences in social motivation systems, 68 they may alternatively be mediated by downstream effects of lower participation, such as missed opportunities to form social support structures. 69 A lack of social support is directly linked to QoL and is included as a construct in the QoL measure used here. This might provide an avenue of explanation for co-occurring conditions, such as depression and anxiety, which could be the result of adverse social outcomes common in autistic adults. 70
Theory of mind exhibited a robust association with social ATs in our model selection step, consistent with the construct’s status as a core feature of autism.13,57 While theory of mind did not show a likely effect on QoL in our complete model, sensitivity analyses revealed that theory of mind negatively affected QoL when considered in the absence of the other constructs. One possible explanation was an overlap of effects between theory of mind and social anhedonia, as social anhedonia also showed an increased negative effect in the sensitivity analysis compared with the main analysis. Like social anhedonia, theory of mind may influence social interaction, so the overlap between social anhedonia and theory of mind might be explained as a shared causal path to QoL. Alternatively, social anhedonia might causally affect theory of mind, 71 which would suggest that the non-robust effect of theory of mind represents collider bias. Assuming that differences in theory of mind can occur with or without co-occurring alexithymia or social anhedonia, and are a core feature of social ATs, we tentatively suggest that theory of mind skills do affect QoL but share causal paths with other constructs.
We excluded social anxiety from our main effect estimation model, due to our theoretical assumptions about its temporal order relative to the other components. We placed social anxiety downstream of autism/ATs, together with generalized anxiety, in a supernode. This supernode was created due to the potential overlap and high co-occurrence of generalized and social anxiety disorders.72,73 Determining how the two constructs might interact and differentially affect QoL was outside the scope of our study but would be useful to explore in the future. The current analysis also leaves the possibility that social and/or generalized anxiety play roles as mediators of the effects of alexithymia or social anhedonia on QoL. If anxiety is a significant mediator of autism-related QoL changes, it is possible that interventions for anxiety would have a better effect (or at least be cheaper and more accessible) than targeting alexithymia or anhedonia per se. On the flip side, if such a mediating role of anxiety exists, early treatment of alexithymia or anhedonia might alleviate the very severe individual and societal costs of anxiety disorders. It will be important in future studies to distinguish between trait anxiety (including the propensity for social anxiety), which may be placed early in a causal chain just like other autism endophenotypes, and clinical anxiety disorders. Our assumption was that ATs carry the potential to increase the probability of state anxiety regardless of the degree of trait anxiety, more so than state or trait anxiety causes ATs. Sensitivity analyses suggested an overlap between the effects of social anxiety and social anhedonia on QoL. However, given that we assumed that anxiety may be caused by ATs but not vice versa, the non-effect of social anhedonia in the sensitivity analysis could be explained by collider bias (i.e., anxiety is a mediator between social anhedonia and QoL).
Limitations
The study might be subject to endogenous selection bias as we recruited participants from the Prolific platform. Such bias may be present if the subject pool disproportionally attracts participants with, for example, high ATs or certain levels of QoL. However, the participant pool is known to contain a large sample of possible participants shown to be relatively diverse and naïve, 19 probably making it one of the better recruitment choices to limit this type of bias. The sample was biased toward White, educated individuals without intellectual disability, presumably with typical IQ and language ability (given their educational attainment and demands of our study). Therefore, the results may not be generalizable to autistic individuals with intellectual or language disability, or to individuals of other ethnicities or cultures. Our model conditioned on ethnicity, addressing some of this potential bias.
Another limitation is our use of self-report questionnaires. While self-reports are excellent for quantifying clinically relevant individual differences, they are subject to their own set of biases. These can distort relationships and inflate associations if both independent and dependent variables are subject to the same bias (through unmeasured confounding). 74 However, if all self-reports are subject to the same bias, and competing exposures influenced by the same confounder adjust for each other via proxy, 45 our inclusion of multiple self-report instruments as independent variables may mitigate this bias (see Supplementary Data).
We did not measure social impairment in terms of the objective need for support (as would be done in a DSM-5 evaluation). Instead, we considered clinical impairment to be placed downstream of ATs, as a mediator to lowered QoL, which statistically meant that they did not need to be corrected for.
The causal model relied on an assumption that psychiatric conditions have a causal effect on QoL. If this assumption is correct, all events that cause a condition and cause variation in QoL are potential confounders. Because the causes of ATs and autism are unknown, there was a risk of such unmeasured confounders in this study. Hence, we had two options: (1) including all our components of social ATs in the same analysis (i.e., treat them as competing exposures), which partially controls for unmeasured confounding but risks collider bias 45 ; and (2) conducting a separate analysis for each component, which invites unmeasured confounding to influence our results. We chose the first option for our main analysis, and used sensitivity analyses to also address the second option. This allowed us to estimate how the assumptions and decisions impacted our results.
There were also limitations in the way we controlled for confounding effects of other neuropsychiatric disorders. Co-occurring conditions may not all be separable from autism and may interact with it in various ways. For example, it is possible that depression in part is a consequence of ATs, making it a mediator between traits/endophenotypes and QoL. Our conservative approach of conditioning on many co-occurring conditions may have subjected effect estimations to collider bias (due to the aggregate variables possibly containing both confounders and mediators). However, sensitivity analyses indicated that this limitation had minor effects on the conclusion.
Future directions
Our approach builds on recent developments to capture heterogeneity, complexity, and meaningful outcomes in psychiatric settings75,76 but breaks new ground by combining causal inference with the dimensional perspective. Causal inference via causal graphs provides a framework that illustrates assumptions and hypotheses while incorporating previous knowledge within the field. We argue that the fields of psychology, psychiatry, and neuroscience may benefit from adopting causal inference more often, to improve transparency, replicability, and validity of research. This methodology is especially valuable in observational human neuropsychiatry studies, where experimental manipulation of neural structures is often impossible or unethical. When explicitly conceptualizing research questions as causal in nature, we are forced to consider obstacles that hamper causal conclusions, such as the common practice of accidentally adjusting for colliders, ultimately improving the validity of conclusions and transparency about limitations. 77
Our study reinforces the usefulness of committing to the dimensional perspective to identify meaningful symptoms while embracing the inherent heterogeneity of autistic function. Diagnostic criteria for autism remain unspecific to a point where a wide array of social behaviors could qualify as fulfilled criteria, whereas none of the behaviors in the RRB domain qualify as sufficient nor necessary in isolation, and only sufficient in tandem with other criteria. Because diagnoses are often defined and determined (and to some extent caused) by the presentation of symptoms and not by biological reality, 78 the traditional relationship in medicine of condition causes symptoms is not generally applicable in psychiatry. Instead, we may opt for investigating a relationship where condition causes impairment while substituting condition for a heterogeneous model that contains variation in function across several dimensions. By carefully studying how individual differences across relevant dimensions contribute to important health outcomes, we may ultimately be able to offer interventions that are simultaneously transdiagnostic and biologically specific. If this is successful, it might become possible to opt for individualized medical or psychological help with traits that have negative effects and receive the community’s acceptance of other individual needs and qualities. Knowing which traits have negative effects can also motivate and guide others (employers, general public, etc.) to better support autistic individuals in the most relevant ways. Our approach of appealing to the RDoC rationale combined with causal inference methodology adds to a growing library of tools available to researchers for understanding psychiatric phenomena.
Authorship Confirmation Statement
J.F.P.: Conceptualization, methodology, formal analysis, investigation, writing—original draft, writing—review and editing, and visualization. E.I.: Methodology and writing—review and editing. K.I.: Conceptualization, methodology, investigation, writing—review and editing, supervision, and funding acquisition. The article has been submitted solely to Autism in Adulthood.
Footnotes
Author Disclosure Statement
No competing financial interests exist.
Funding Information
The work was funded by a starting grant from the Swedish Research Council to KI (2018-02131). E.I. received funding from the Medical Research Council (MC_UU_00022/2) and the Scottish Government Chief Scientist Office (SPHSU17).
References
Supplementary Material
Please find the following supplemental material available below.
For Open Access articles published under a Creative Commons License, all supplemental material carries the same license as the article it is associated with.
For non-Open Access articles published, all supplemental material carries a non-exclusive license, and permission requests for re-use of supplemental material or any part of supplemental material shall be sent directly to the copyright owner as specified in the copyright notice associated with the article.