
Abstract
Background:
Autistic individuals' enrollment in universities is increasing, but we know little about their study progress over time. Many of them have poor degree completion in comparison to students with other disabilities. However, longitudinal studies on study progression over time of autistic students (AS) in comparison to their peers are absent. It is essential to study AS outcomes during the first year, controlling against the results of students without disabilities.
Methods:
This preregistered population study examined first-year progression and retention within the same area of study of autistic bachelor students (n = 96; age M = 20.0 years, 95% confidence interval [CI] 18.0–21.0) in comparison to students without disabilities (n = 25,001; age M = 19.0 years, 95% CI 18.0–20.0), enrolled in the same area of study at a major Dutch university. To control for substantial differences in sample sizes and differences in demographics or prior education, we applied propensity score weighting to balance outcomes. We analyzed progression and retention, examining the average grades, the number of examinations, resits, no shows, the credit accumulation in each period, and the average retention after the first year.
Results:
Over the course of the first bachelor year, AS received grades similar to students with no disabilities. We found no statistical differences in the number of examinations, resits, and no shows. Credit accumulation was generally similar during the academic year except for one of seven periods, and retention within the same area of study revealed no differences.
Conclusions:
This study shows that AS have similar success rates compared with students with no disabilities but could benefit from additional support on test-taking. Improved insights can enable universities to develop appropriate and timely support for often-talented students, improve first-year retention, and advance degree completion.
Lay summary
Why was this study done?
Autistic individuals increasingly enroll in colleges and universities, but we know little about their study progress during their education. Many autistic students (AS) do not finish their degrees. Long-term studies on study progression over time of AS in comparison to their peers are rare or do not take into account the background differences between these two groups.
What was the purpose of this study?
We aimed to study first-year outcomes of autistic and neurotypical bachelor students at a Dutch university. We wanted to examine differences in study progression and retention, and, if there were any, to understand when and why they occur within that first year.
What did the researchers do?
We examined first-year progression and retention of 96 autistic bachelor students in comparison to 25,001 students with no recorded neurodevelopmental or health conditions at a major Dutch university between 2010 and 2016. To balance the outcomes, we took group differences into account, such as highest pre-education, gender, and high school mathematics grades. Finally, we analyzed progression and retention.
What were the results of the study?
Over the first bachelor year, the grade point average of AS was mostly similar to students with no neurodevelopmental or health conditions. The number of examination attempts, failed examinations, and no shows of AS showed no differences. The accumulation of credits was generally similar during the academic year except for one of seven periods, and there was no difference in retention after the first year.
What do these findings add to what was already known?
AS have a lower credit accumulation in the first bachelor year, but not to the extent as we expected based on studies so far. Moreover, the results show that AS do not have difficulties due to the academic level of courses.
What are the potential weaknesses of the study?
Students with foreign pre-education and students with other conditions (e.g., Deficit Disorder/Attention Deficit Hyperactivity Disorder or dyslexia) could not be examined, and our findings are limited to the first bachelor year. We do not know if AS received academic accommodations that influenced their study results and progress.
How will these findings help autistic adults now or in the future?
Institutions in higher education can use these insights to inform AS on study progression and retention. Furthermore, student counselors can use these findings to encourage AS to seek counseling as soon as possible when they arrive at university, ideally before study issues arise.
Introduction
Autism (Autism Spectrum Disorder, ASD 1 ) is a neurodevelopmental condition characterized by qualitative differences in sensory perception, social interaction, communication, and repetitive stereotyped behavior. A growing number of autistic students (AS) are finding their way to higher education,2,3 but many of them have poor degree completion in comparison to their peers. The National Longitudinal Transition Study-2 (United States) showed that up to 8 years after leaving high school, 38.8% of AS graduated with a college degree, compared with 40.7% of students with any disability and 52.4% of the general population. 4 In a national survey in the United Kingdom, 21 universities reported graduation rates over a period of at least 5 years. In 71.9%, the graduation rate of all students exceeded that for AS, in 26.3%, it was reversed, and in 1.8%, it was equal. 5
However, the timing of educational challenges of AS 6 and therefore when interventions would be appropriate and beneficial to AS is unknown. Since students with study delays in their first year are more prone to dropout or to take more time to graduate, it is essential to analyze first-year education outcomes.6–9 Improved insights can enable universities to develop appropriate and timely support for this often-talented group of students. 10
Although the body of research on students' attainment in higher education is growing, sample sizes are typically small, formal ASD diagnoses are limited, 11 and outcomes are often only self-reported.5,12–14 Furthermore, administrative data sets on student progression or first-year retention on an institutional level are mostly unavailable. 5 Consequently, longitudinal studies on study progression over time of AS in comparison to their peers are absent. Studies often do not control for substantial differences in sample sizes, demographics, prior education, and previous education outcomes. 15 These limitations make the attribution of differences in outcomes to autism, and not these confounding factors, hard to justify. 16 To overcome these issues, it is important to analyze outcomes while weighing results.
In this preregistered study, 17 we examine educational outcomes in a population sample of AS and students without disabilities at a major Dutch university. We use propensity score weighting (PSW) to balance the distribution of the measures and control for group size differences and selection biases in nonexperimental studies.18,19 The propensity score is a number between 0 and 1 and represents the conditional probability that a person is assigned to a particular group, given a set of confounders. 20
To the best of our knowledge, only one population study exists looking at first-year college grade point average (GPA) and showed a similar GPA in 22 AS compared with 8861 students without disabilities from 2008 to 2017 in two 4-year colleges in the United States. 15 Therefore, we expect AS to perform similarly in GPA in comparison to their peers. However, we expect slower study progression since AS have more problems with executive functions21,22 and procrastination. 2 AS have more difficulties with nonacademic skills (e.g., social interactions and mental health) and specific academic skills (e.g., group work or presentations, time management, and planning). Therefore, we expect a higher percentage to cease their study program after the first year.11,22,23
Based on these current findings, we propose the following hypotheses:
H1: We expect AS to have a similar GPA in the first-year of their bachelor studies in comparison to students without disabilities.
H2: We expect AS to have a significantly lower exam participation rate in the first year of their bachelor studies in comparison to students without disabilities.
H3: We expect AS to accumulate significantly fewer credits in the first year of their bachelor studies in comparison to students without disabilities.
H4: We expect AS to have a significantly lower retention rate in the same area of study rate after the first year of their bachelor studies in comparison to students without disabilities.
Methods
Study population
Our sample included 25,097 first-year full-time students in 52 bachelor programs at a major university in the Netherlands from 2010 to 2016 (M = 19 years of age, 55.0% female) about whom we had access to relevant data from the university's student information system. 13 The university's Scientific and Ethical Review Board granted ethical clearance (reference no. VCWE-2017-123).
The study population consisted of two participant groups: (1) 96 students with a clinical diagnosis of ASD (0.38%) and (2) 25,001 students without disabilities (99.62%). AS were restricted to those who are formally diagnosed and decided to disclose their disability. 13 Qualified clinicians provided diagnoses for ASD and other disabilities independent of this study. In the Netherlands, a psychiatrist gives the diagnostic classification of ASD according to the established DSM-IV-TR or DSM-5 criteria, based on an elaborate examination, including observations and parent interviews by multiple experienced clinicians (psychologists, psychiatrists, and educators).
Table 1 presents the descriptive statistics of AS and students without disabilities.
Descriptive Statistics and Educational History for the Two Participant Groups (N = 25,097)
AS, autistic students; VWO, “Voorbereidend Wetenschappelijk Onderwijs” in Dutch, meaning “University Preparatory Education”; ND, students without disabilities; n.s., not significant.
Measures
Appendix Table A1 lists all variables and their measurement scales.
Demographic and enrollment characteristics: Sex was male or female. Age (in years) in Dutch higher education is recorded on October 1 in the year students enroll. Cohort was the academic year a student enrolled for the first time in the academic program of choice. Days between application and enrollment were the number of days between the date of application and the date of enrollment. Parallel programs was true when a student enrolled in more than one program. Language test total score was a Dutch language test taken after the first enrollment. 19
Educational background: Highest pre-education: In the Netherlands, there are five learning paths to higher education: (1) high school VWO (which stands for “Voorbereidend Wetenschappelijk Onderwijs” in Dutch, meaning “University Preparatory Education”), (2) a vocational foundation year (high school HAVO [which stands for “Hoger Algemeen Voortgezet Onderwijs” in Dutch, meaning “Senior General Secondary Education”] with a first-year qualification from a University of Applied Sciences), (3) a qualification in Dutch higher education (academic or vocational), (4) other Dutch qualifications (e.g., a university entrance examination [Colloquium Doctum]), or (5) a foreign qualification equivalent to VWO. 13 Average Grade Secondary Education was the average grade of all examination subjects chosen by a student to graduate in, grades range from 1 to 10. For three examination subjects (Dutch, English, Math Algebra), the average grade was available.
Progression and retention in the same area of study: Exam participation, Credits, and GPA: Academic years consisted of six periods with courses, examinations, and resits, and one additional period with resits only. Information was available for each period on exam participation (number of attempts, resits, and no shows), the number of European credits (ECs), and preliminary and final GPA. The university enrolled students for a course and a corresponding examination at the end of the same period as the course. Students could take one resit for each course in the following period or at the end of the academic year. All first-year bachelor programs consist of 60 ECs. Retention means enrolled in the same study program in the following academic year.
Analytical strategy
We used R for statistical computing 24 for data wrangling and data analysis. To address biases associated with the differences in group sizes, we analyzed the outcomes using PSW. We assessed covariate balance using the COBALT package. 25 We analyzed progression and retention, examining the average GPA, the number of examinations, resits, no shows, the credit accumulation in each period, and the average retention rate after the first year.
Data selection and imputation
We selected possible confounders related to both group assignment and the outcome (Sex, Age, Cohort, Highest pre-education, Days between application and enrollment), and to increase the power to test the effect, 26 we added measures that were outcome proxies (Grades in Secondary Education 27 and Parallel programs). We imputed missing data using the MICE package 28 and VIM package. 29 We explored several imputation methods: mean, median, k-nearest neighbor, and multiple imputations.30,31 For each imputed measure, we added an additional variable, indicating if the measure was imputed: Average Grade Secondary Education (5.6% missing), Average Grade Dutch Secondary Education (6.6% missing), Average Grade English Secondary Education (6.6% missing), and Average Grade Math Secondary Education (7.2% missing). See Table 1 for the selected measures.
Propensity score estimation and covariate balance evaluation
To calculate propensity scores, we followed the average treatment effect among the treated procedure for propensity matching. 32 We tested different combinations of measures to determine the subset of measures with the best balance. We included measures of previous achievements as outcome predictors because they increase the power to test the treatment effect.33–36 We applied a correlation matrix to cancel out highly correlated measures: Average Grade Secondary Education, Average Grade Dutch Secondary Education (+0.58), Average Grade English Secondary Education (+0.48), and Average Grade Math Secondary Education (+0.57). We used generalized boosted models for estimation of the necessary propensity score weights and assessed the balance using box-and-whisker plots, the overlap of the interquartile range (IQR), slope plots, and love plots. The measures Sex, Highest pre-education, Cohort, and Average Grade Math Secondary Education with median imputation and stop method maximum absolute standardized mean difference (es.max) gave the best balance for the AS and No Disabillity groups, with an overlap in IQR of 31.9%. We excluded Days between application and enrollment, Parallel programs, and Language test total score. We kept the sample size of AS constant on 96 and reduced the sample size of ND from 25,001 to a weighted size of 184.65. Table 2 presents the balance of autistic students and students without disabilities. We measured effect sizes using Cramer's V. We created a two-way weighted frequency table for each value and group using the questionr package, 37 applying the weights from the PSW. We then calculated Cramer's V on the two-way weighted frequency table using the rcompanion package. 38
Balance of Autistic Students and Students Without Disabilities
ND, students without disabilities.
In contrast to our preregistered methods, we applied an additional weighted Kolmogorov–Smirnov test to all continuous outcome measures, to establish equal distribution between AS and ND. 39 To estimate effects, we applied weighted multiple regression analysis using the survey package. 40 We applied the Benjamini–Hochberg correction within each period to adjust for multiple testing. 41 To provide support for the absence of a meaningful effect, we performed equivalence testing using the toster package. 42 For each measure, we applied an appropriate smallest effect size of interest: GPA Preliminary and GPA Final: 0.5; Failed final results, Attempts, Resits, and No shows: 1; EC per period: 6; Retention: 0.5.
Preregistration
Following the preregistration of this study, we report how we determined our sample size and all data exclusions. 17 The original data set contained 28,525 first-year full-time bachelor students. In the imputation procedure, we removed students with a foreign pre-education due to missing data (n = 1116; 3.91%), resulting in a sample set of 27,409 students. After the covariate balance evaluation, 33 we removed students with other disabilities, such as Attention Deficit Disorder/ Attention Deficit Hyperactivity Disorder and dyslexia (n = 2312; 8.44%, close to a national estimation of students with a disability in universities in the Netherlands of 10% 43 ). The balance for AS and students with other disabilities was too low in any combination of imputation method and stop method; therefore, we removed students with other disabilities. As a result, the final sample size became 25,097 students.
Results
We analyzed four sets of outcomes during seven periods of the first-year of students' bachelor studies: (1) GPA and failed final results, (2) accumulated credits, (3) exam participation, and (4) retention rate.
H1: We found no differences between weighted means for AS and ND for Preliminary GPA and Final GPA. Based on the equivalence test and the null-hypothesis test combined, we can conclude that the observed effect is statistically not different from zero (equivalence test statistically different [ETSD]: no) and statistically equivalent to zero (equivalence test statistically equivalent [ETSE]: yes) for the majority of GPA-related measures (Preliminary GPA: four of seven periods; Final GPA: five of seven periods). We found no differences between weighted means for AS and ND for Failed final results: ETSD: no, ETSE: yes.
H2: We found no differences in Average Attempts per Period, Average Resits per Period, or Average of No shows per Period; ETSD: no, ETSE: yes.
H3: We found significantly lower credit accumulation for AS in period 3 compared with weighted ND (P3: AS: 3.86, ND: 5.68, p < 0.001, V = 0.25). We found no differences between weighted means in credit accumulation for AS compared with weighted ND in all other periods: ETSD: no, ETSE: yes.
H4: We found no differences between weighted means of retention rate for AS and ND after the first year of their bachelor studies (AS: 77%, ND: 71%, p = 0.154, V = 0.07); ETSD: no, ETSE: yes.
Table 3 and Figures 1–3 present the results.
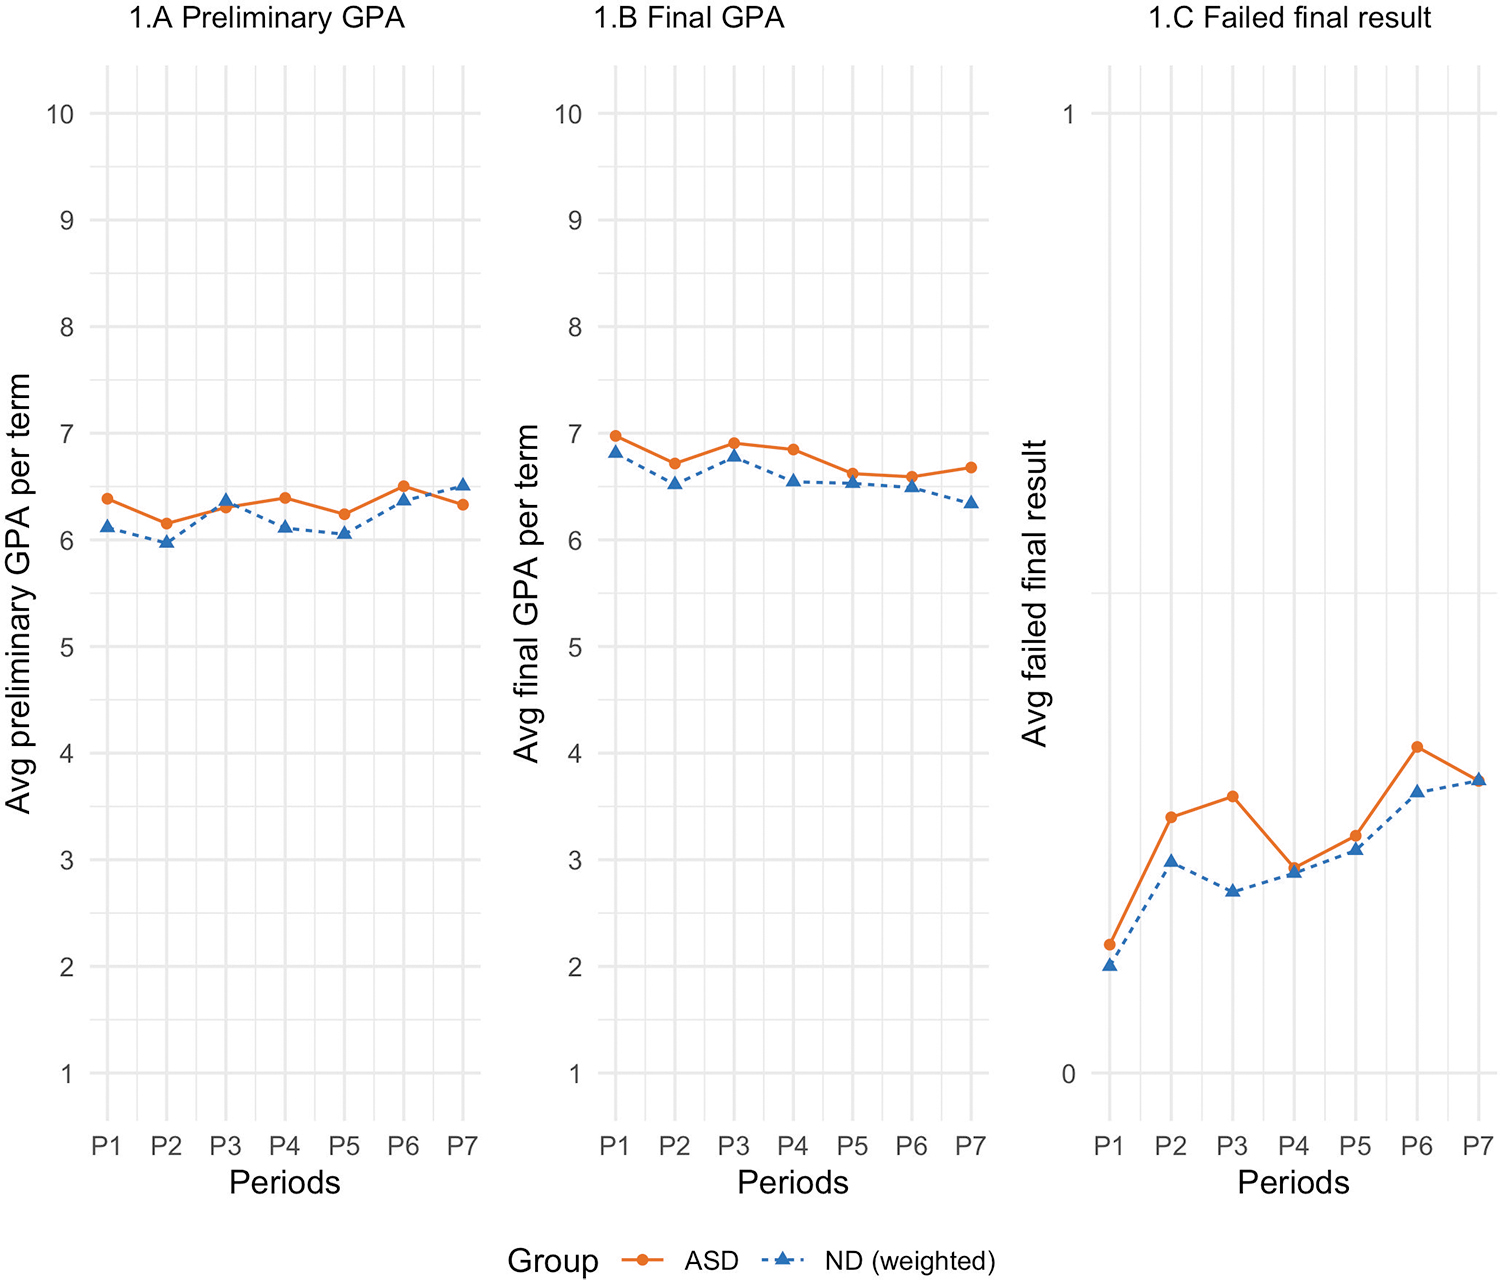
AS/ND weighted versus average GPA and average failed final results for each term. AS, autistic students; GPA, grade point average, ND, students without disabilities.
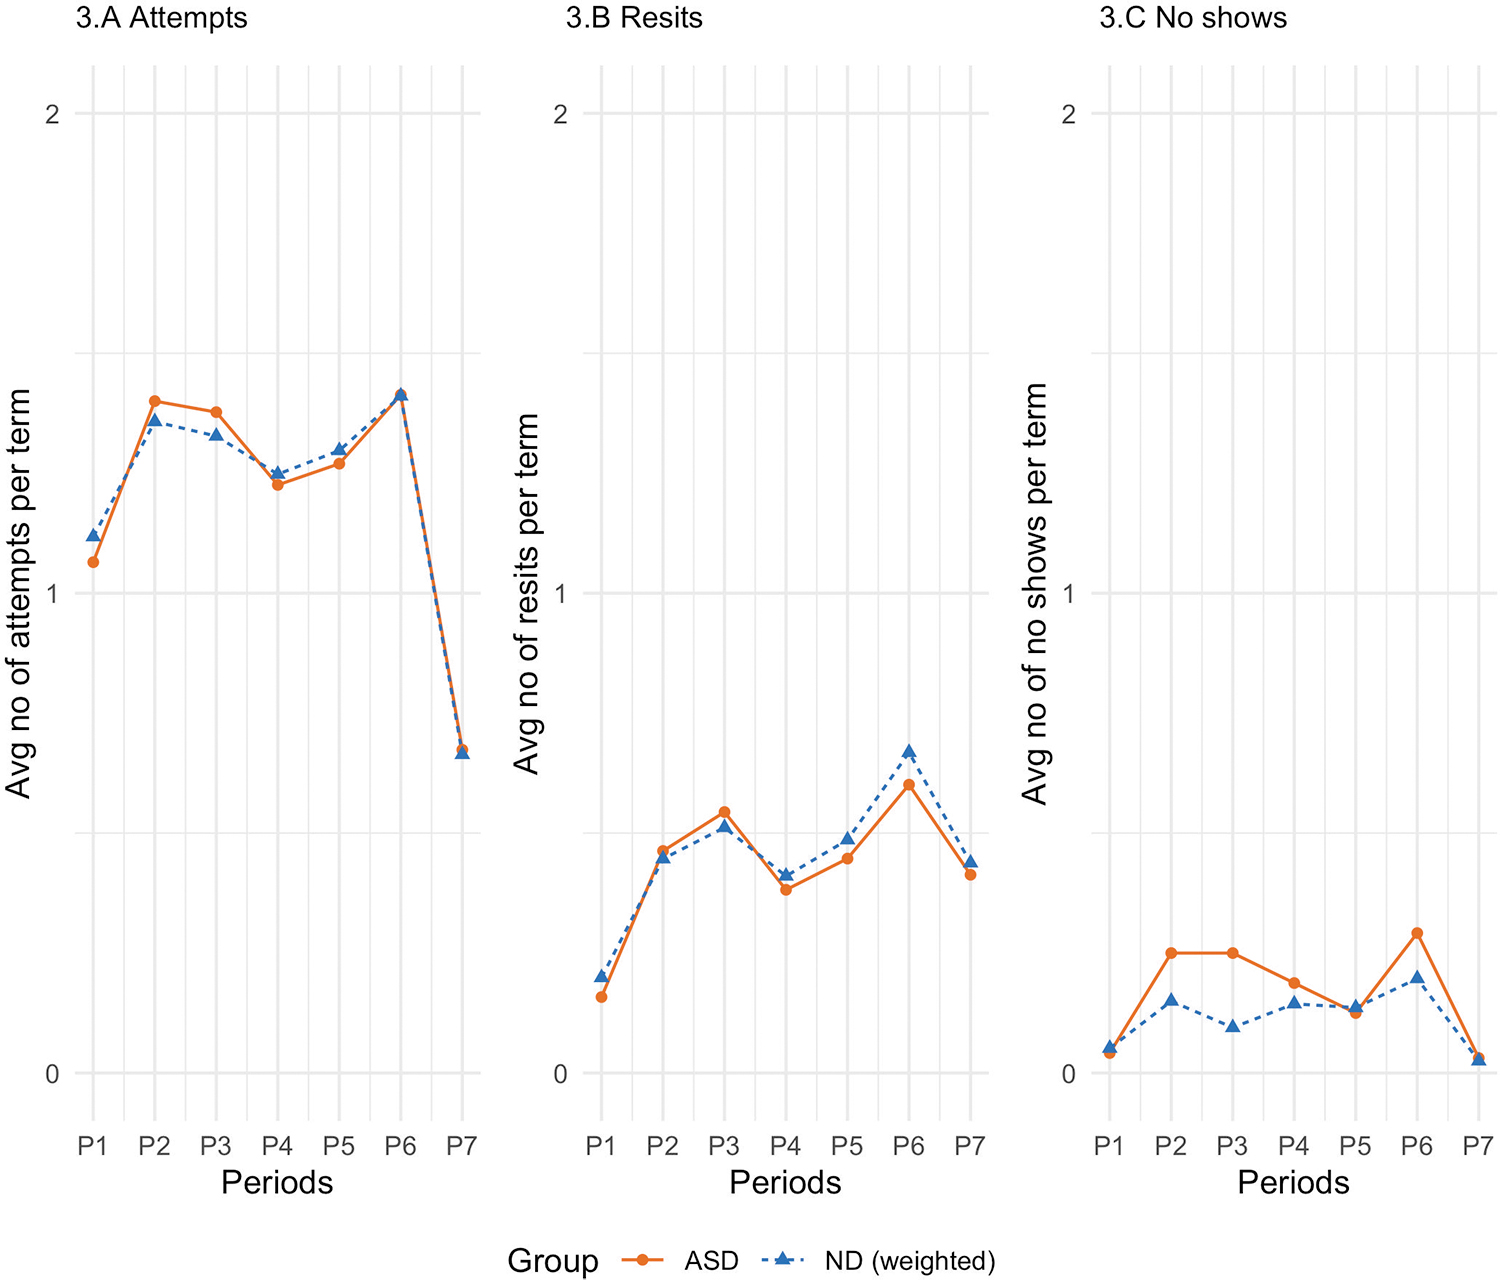
AS/ND weighted versus average attempts, average resits, and average no shows for each term.
Success Measures of Autistic Students and Students Without Disabilities
All p-values for AS are <0.001.
Lower CI <0 for all measures are capped at 0; upper CI >10 for GPA preliminary and GPA final are capped at 10; upper CI >1 for retention is capped at 1.
All p-values for KS are <0.001.
p < 0.05.
p < 0.001.
EC, European credit; GPA, grade point average; KS, Kolmogorov–Smirnov test; ND, students without disabilities.
Discussion
This study compared progression in GPA, exam participation, credit accumulation, and retention rate of AS and students without any reported disability over the first bachelor year of higher education within the same area of study. Using PSW, progression on all outcomes was similar in the AS versus ND groups, except for lower credit accumulation in the third period in AS. Retention rate in the same area of study revealed no differences.
AS do not differ from their classmates in their ability to attain the academic level of higher education. In accordance with earlier findings, 15 AS had a similar (preliminary and final) GPA compared with students without disabilities in almost every period. We found support for a lower study pace. AS appear to have more academic difficulties with test-taking in the first half of the first year in comparison to students without disabilities. The number of attempts and resits of AS was similar to students without disabilities. Although not significant, the number of no shows and the average percentage failed final results tended to be higher in the third period. As a result, AS earned significantly lower credits in the same period compared with students without disabilities. Contrary to our expectations, we found no significant differences between AS and students without disabilities and retention rate in the same area of study.
Study delay of AS occurred at the end of the first semester of the first year. We found no evidence for growing or surging study delays in the second semester. AS started in the first period with the same participation rates as their peers and similar grades and credit accumulation. In the second and third period, the level of no shows and failed final results of AS increased slightly (Fig. 2), although not significantly. Previous studies suggest that AS can experience more study stress during the first period, 44 need more time to adjust to higher education, 45 or might face problems with planning and organizing.14,21–23,46 Also, executive dysfunction may result in difficulty with time management or finding alternative solutions after failure.2,15 For these reasons, we assumed that AS would have more difficulties adjusting their study behavior or have a different coping strategy in response to failure. While students without disabilities who have failed in earlier periods keep trying and continue to attend examinations, evidence suggests that AS tend to procrastinate.11,47 An additional explanation could have been that AS are advised to take fewer examinations or take a resit only to reduce workload and stress. 48
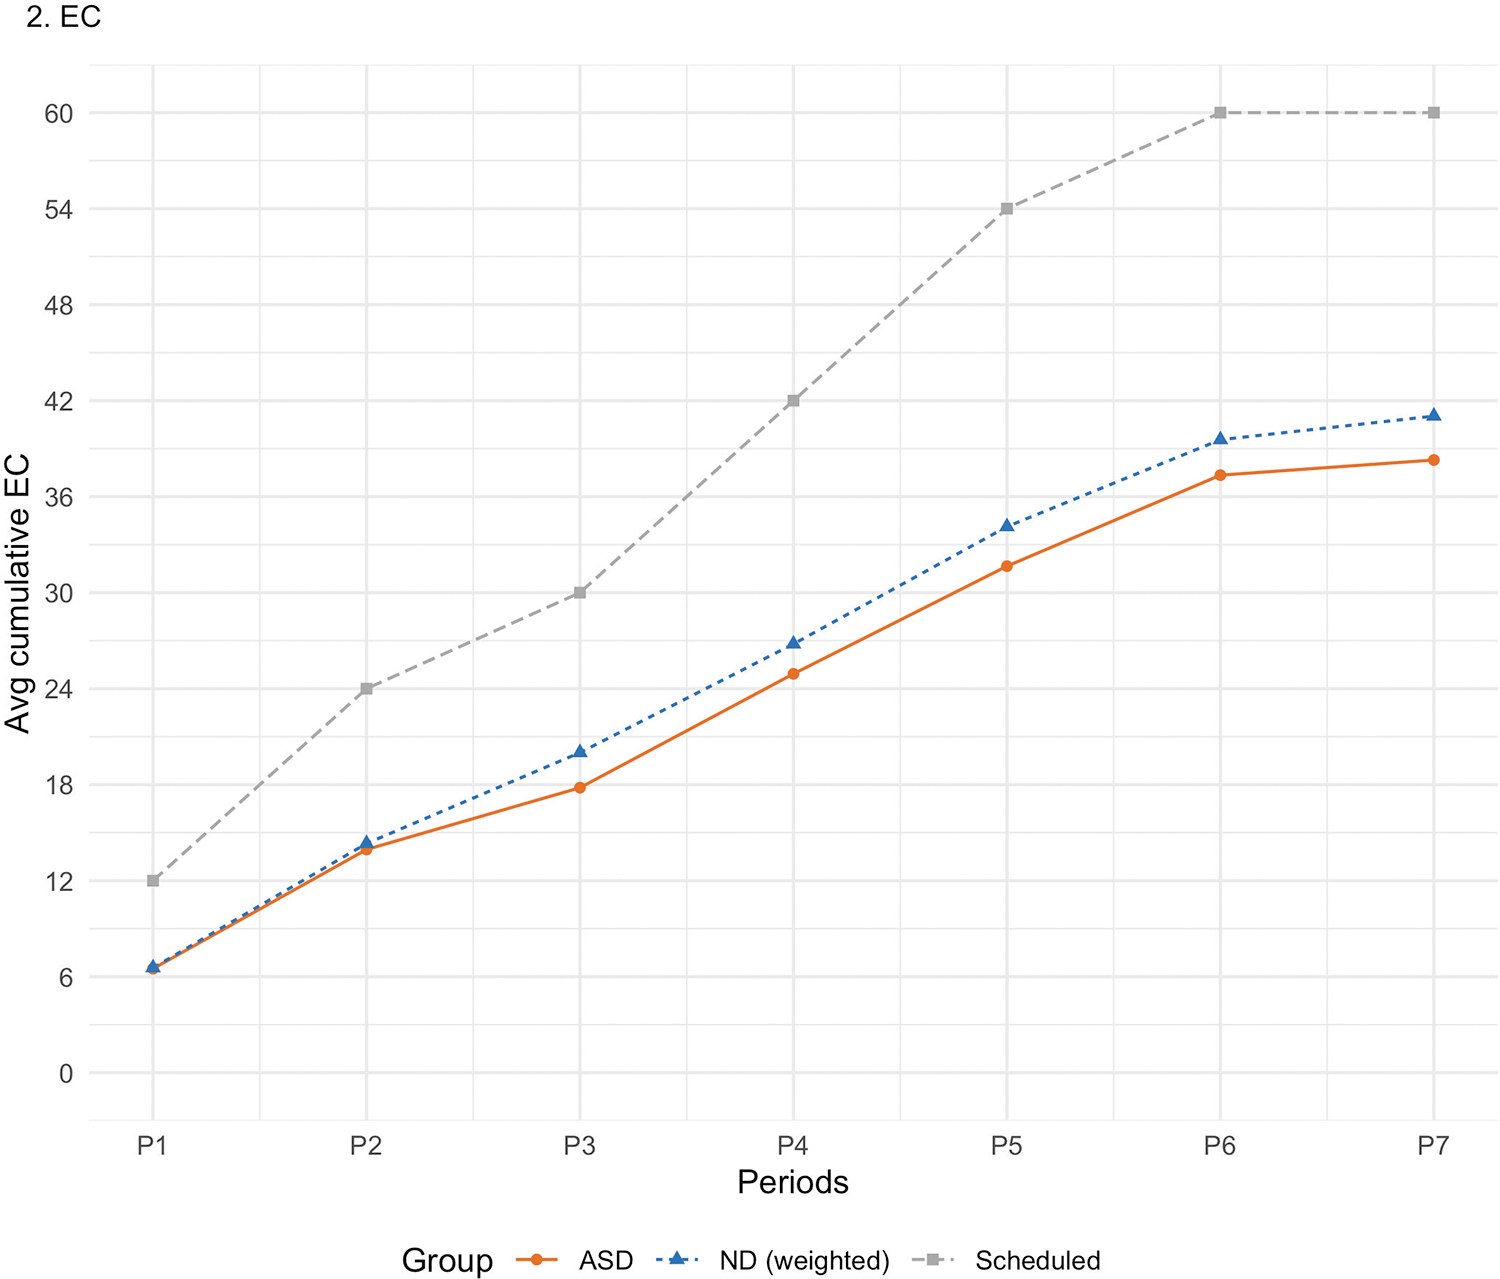
AS/ND weighted versus cumulative EC for each Term. EC, European credit.
This study confirmed some of the earlier reported problems with study delay of AS but not to the extent as expected, and difficulties with retention within the same area of study were not confirmed. We studied a large population sample spanning seven year-group cohorts of formal data and weighted outcomes based on background characteristics as well as earlier achievements of AS (average grade in Math in secondary education) using PSW.33–36 We assume that because we achieved this balance and used earlier outcomes as an outcome predictor, we canceled out unweighted differences in study progression and retention in comparison to earlier studies. Furthermore, our results show that AS do not have difficulties with the academic level of courses but face challenges with examination participation resulting in a lower credit accumulation at the end of the first year. Previous research may have disproportionally highlighted AS with educational problems. The current study circumvented this possible bias, as we rely on a population sample of formal data.
Limitations and future directions
We need to recognize several limitations of the current study. First, it is unknown to what extent these findings apply to students with foreign pre-education or other disabilities. We removed students with a foreign pre-education from the data set because data on average grades in secondary education were not available for students with a foreign pre-education. We left students with other disabilities out of the analysis, as we could not achieve enough balance with AS. An additional level of analysis of AS and students with different classifications of other disabilities could give more insights into differences and commonalities in student outcomes. Future studies are necessary to address these questions. Second, it is unknown to what extent AS received academic accommodations, such as additional examination time, or a quiet testing environment, and whether this influenced their study results and progress. Third, it is unknown if there were any differences between AS and students without disabilities in adjusting to higher education by subject area (e.g., math and science vs. writing-intensive subjects), as we did not have access to this type of information on courses and examinations. Fourth, earlier studies often span several years of student experiences, while our findings are limited to the first bachelor year. Finally, the method discussed in this study has its limitations. PSW eliminates the effects of confounding observed variables. The estimates can be biased if there are unmeasured factors that predict outcomes and differ among AS and ND groups. However, this limitation is not specific to PSW. All causal modeling approaches that use observational student data have to deal with this constraint. 32
Significance
To the best of our knowledge, this is the first population study to use PSW to analyze the first-year outcomes of AS in comparison to a major control group of students without disabilities. This innovative methodological approach demonstrates that AS have similar success rates as students with no disabilities. These quantitative insights are a valuable addition to the more qualitative evidence so far. As predicted, AS have a lower credit accumulation in the first bachelor year, but not to the extent as we expected based on prior studies. Furthermore, these results reveal that exam participation is an area that needs greater consideration and additional support for these students who are clearly grasping the academic material as reflected in their GPA. Insights in test-taking show that difficulties with the academic progress of AS appear to start at the beginning of the first year. Higher education institutions can use these insights to counsel AS proactively in test-taking. Student counselors can use these findings to encourage AS to seek tailored support as soon as they enroll at university.
Authorship Confirmation Statement
T.C.B. conceived of the study, participated in its design and coordination, performed the measurement and the statistical analysis, and drafted the article. L.K. conceived of the study, participated in its design and coordination, and helped to draft the article. S. Bhulai conceived of the study, participated in its design and coordination, and helped to draft the article. S. Begeer conceived of the study, participated in its design and coordination, and helped to draft the article. All authors read and approved the final article before submission. The article has been submitted solely to this journal and is not published, in press, or submitted elsewhere.
Footnotes
Acknowledgments
We thank Erna Klein Ikkink, Director of the Department of Student and Educational Affairs of the Vrije Universiteit, for supporting this research.
We thank Reubs Walsh for proofreading the article.
Author Disclosure Statement
No competing financial interests exist.
Funding Information
The Department of Student Affairs of the Vrije Universiteit Amsterdam and the Dutch Association for Autism funded the costs of open access publication of this article.
Description of Variables and Measurement Scales
| Category | Variables | Measurement scales |
|---|---|---|
| Enrollment | Cohort | 2010, 2011, 2012, 2013, 2014, 2015, 2016 |
| Days between application and enrollment | 336–0 | |
| Language test total score | 0–100 | |
| Parallel programs | False = no, true = yes | |
| Demographics | Sex | Female, male |
| Age (in years) | Age | |
| Disabilities | ASD | False = no, true = yes |
| ADD/ADHD | False = no, true = yes | |
| Chronic illness | False = no, true = yes | |
| Dyslexia | False = no, true = yes | |
| Physical disability | False = no, true = yes | |
| Psychological disability | False = no, true = yes | |
| Other disability | False = no, true = yes | |
| Secondary education | Highest pre-education | High school VWO, Vocational foundation year, Degree in higher education, Other pre-education, Foreign degree |
| Secondary education examination grades | Average grade secondary education | 1–10 |
| Average grade Dutch secondary education | 1–10 | |
| Average grade English secondary education | 1–10 | |
| First-year success | GPA preliminary results | 1.0–10.0 |
| GPA final results | 1.0–10.0 | |
| Failed final results | False = no, true = yes | |
| EC | 0–159 | |
| Attempts | 0–65 | |
| No shows | False = no, true = yes | |
| Retention after the first year | False = no, true = yes |
ADD/ADHD, Attention Deficit Disorder/Attention Deficit Hyperactivity Disorder; ASD, autism spectrum disorder; EC, European credit; GPA, grade point average; VWO, “Voorbereidend Wetenschappelijk Onderwijs” in Dutch, meaning “University Preparatory Education.”