The search for life in the solar system often focuses on water and on environments where habitable conditions exist, persistently or occasionally. In this search, dry permafrost (ice-free frozen soil) has received minimal attention. It was previously proposed that within martian dry permafrost the water activity (, an essential property for habitability) could be enhanced by diurnal thermal cycles and water desorption from soil grains, but the details remain unexplored. We examined in dry soil (which contained only vapor and adsorbed water) through experiments and numerical simulations and contrasted the results with a habitability threshold for terrestrial organisms (). We found that heating cycles in a soil raised . As water vapor desorbs from warming soil grains, it diffuses toward cooler adjacent soil, where a fraction of this incoming vapor enhances the local . In laboratory tests with loess and clay soils, we observed to increase by 0.06–0.12. Extrapolating from laboratory to permafrost conditions by using numerical simulations, we found that some Antarctic soils can be boosted periodically into a habitable range. In contrast, the current martian climate is too dry or cold for this -enhancement process to impact habitability. However, high-obliquity periods on Mars are analogous to the Antarctic case.
Introduction
Habitability in extreme environments is of primary interest in planetary exploration. While much of Earth is generally warm with abundant moisture, many extraterrestrial locations are permanently frozen and relatively dry. The surface of Mars, for example, is globally below freezing, as are some Mars-analog locations in Antarctica. In both of these regions, attention has been paid to the presence and habitability of ice-rich permafrost in relation to the capabilities of known terrestrial extremophilic organisms. However, relatively little attention has been given to the habitability of the “dry permafrost,” a layer of ice-free but frozen soil often found atop ice-rich soil. Dry permafrost is widespread in the Antarctic Dry Valleys and globally blankets the surface of Mars as a layer centimeters-to-meters thick. While dry permafrost does not contain water ice, it does contain water in the form of adsorbed films on grain surfaces and vapor in the pore space. Adsorbed water is physically bound to the mineral substrate, such that it exists in equilibrium with the water vapor as a function of temperature (deBoer, 1953). The abundance and accessibility of dry-permafrost water to microorganisms are important components in defining the habitability of this layer of planetary surfaces.
Dry permafrost by definition lacks sufficient water vapor to saturate and form an interstitial condensed phase. As such, it experiences relative humidities below 100% and water activities <1. However, Rummel et al. (2014) proposed that on Mars diurnal cycles in soil temperature could result in the periodic buildup of water vapor within the soil pores relative to the local atmosphere, and that the magnitude of this effect has largely been unexamined. In such a scenario, soil heating results in the desorption of water from grain surfaces and a rise in the pore-space vapor pressure. A balance of heat conduction and vapor diffusion could result in cycles of increased and depleted relative humidity and water activity within the pores. If the water activity were increased above a certain minimum threshold, periodically habitable conditions might occur. These periodic conditions are distinct from “continuously” or “instantaneously” habitable conditions (e.g., Cockell et al., 2016) and represent diurnal or seasonal periods where active metabolism may be supported.
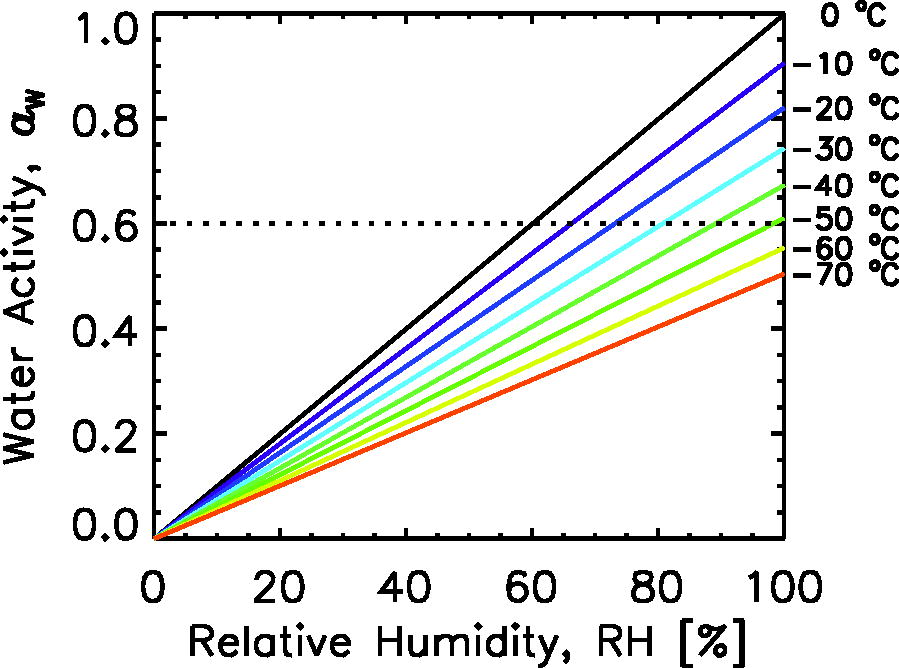
Habitable conditions in any planetary environment fall broadly into four main categories: (1) a source of energy; (2) the availability of chemical nutrients; (3) favorable environmental conditions; and (4) accessible water (e.g., Jakosky and Shock, 1998; Hoehler, 2007; Cockell et al., 2016). In the present work, we focus primarily on the fourth condition: the availability of accessible water. Water is essential for life. It acts as a universal solvent that facilitates metabolic reactions, nutrient uptake, and waste expulsion. While liquid water is often cited as a basic requirement for life (e.g., Merino et al., 2019), some organisms can obtain the water needed to maintain metabolic functions and photosynthesis from nonliquid phases, such as vapor (e.g., Nash et al., 1990; Palmer and Friedmann, 1990; Omelon, 2016) and adsorbed films (e.g., Rivkina et al., 2000; Jakosky et al., 2003; Price and Sowers, 2004; Boxe et al., 2012). The accessibility of water to a microorganism is expressed in terms of the thermodynamic water activity, independent of the presence of a liquid water phase. Water activity, , is defined as the ratio of the partial pressure of water in a system to the saturation pressure relative to pure liquid water at the same temperature. Above freezing, the relative humidity, , and water activity are effectively synonymous, . Below freezing, the water activity is defined relative to supercooled liquid, whereas relative humidity is defined relative to ice; thus, the two differ in a predictable way (see Fig. 1).
The relationship between relative humidity with respect to ice and water activity at temperatures below freezing. The dotted line indicates a limit of habitable conditions (see text).
Temperature, a component of the third habitability condition, affects the rates of metabolic reactions; indeed, temperature is integral to many biological processes from the molecular to ecosystem level (e.g., Precht, 1973; (Clarke, 2014)). Taken together, temperature and water activity establish the habitability conditions in pressure–temperature phase space relative to a planetary soil.
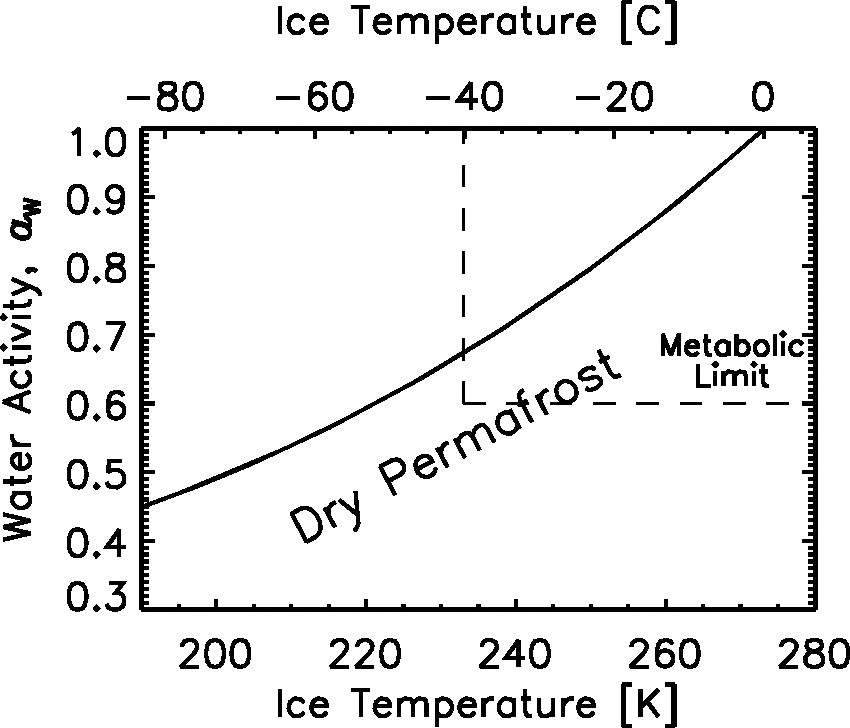
Many studies have examined terrestrial extremophiles as analog organisms to possible extraterrestrial life in order to constrain the limits of habitability. Rummel et al. (2014) reviewed these studies and discussed these limits (see also Mellon et al., 2024 for a summary). In brief, three types of limits can be defined: (i) a propagation limit where above a temperature of −18°C organisms appear to thrive and are able to undergo cellular replication and may increase their biomass; (ii) a metabolic limit of −33°C where organisms readily maintain cell functions without reproduction; and (iii) an extreme metabolic limit of −40°C, where some organisms are able to conduct some photosynthetic activity and carbon turnover. In each of these cases, a water activity above a limit of 0.6 appears to be required. Figure 2 illustrates the extreme metabolic limits compared with the water activity of pure ice. In dry permafrost, the water activity is below that of pure ice but may still be above the 0.6 limit for habitability.
The activity of water ice as a function of temperature below freezing. The water vapor pressure with respect to ice decreases with temperature faster than that of supercooled liquid; hence, the activity decreases. Dashed lines indicate extreme metabolic limits of 0.6 and −40°C (233 K) below which metabolic activity has yet to be observed. Dry permafrost exists at water activities below that of water ice, within a range that may or may not be within the habitable limits.
The main question posed here is, if dry permafrost occurs below the = 0.6 limit, are diurnal cycles in soil temperature capable of driving habitability conditions periodically above this water activity limit? To investigate this possibility and quantify the magnitude of this effect, we examined the potential for enhancing the pore-space humidity using a combination of laboratory experiments and numerical modeling. We tested several analog planetary soils at room temperature under precisely controlled humidity conditions by applying a selective heating pulse and measuring the humidity response. We then used a dynamic numerical model of water-vapor diffusive transport and phase partitioning in a soil to investigate the controlling physics and extrapolate our experimental results to Antarctic and martian permafrost conditions.
Methods
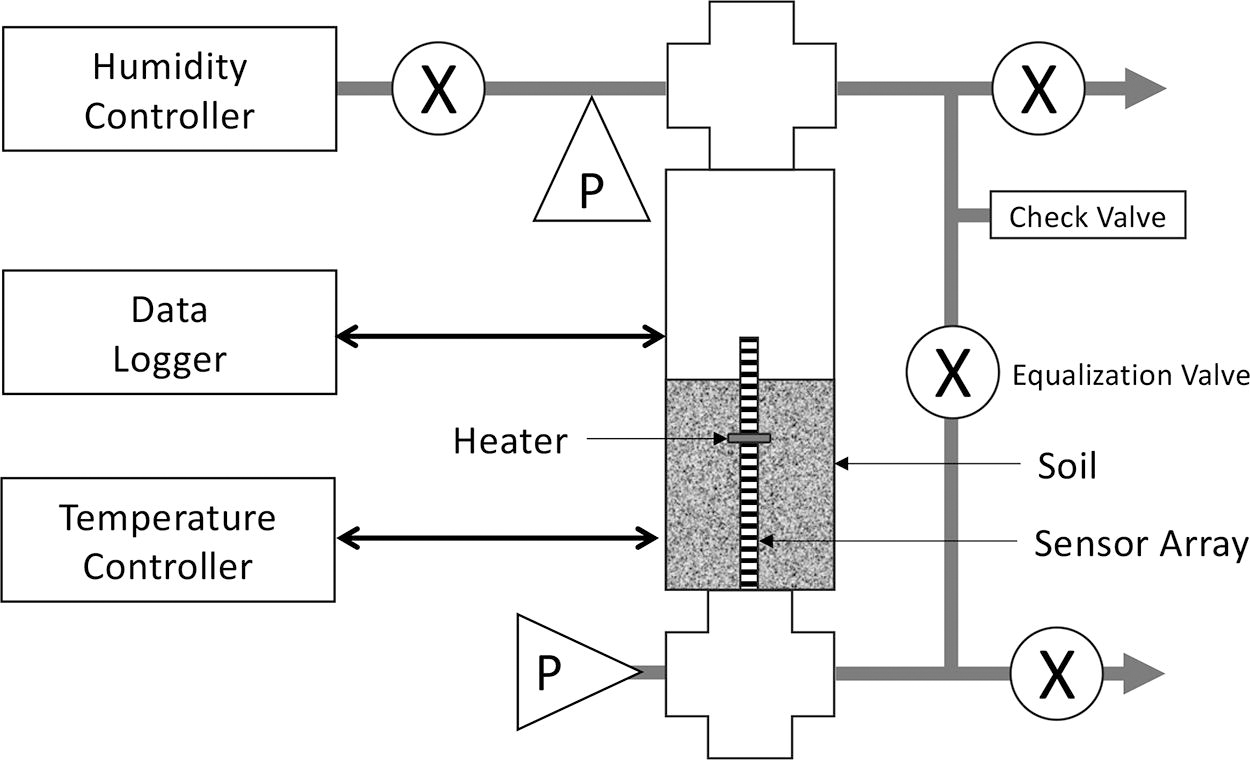
To investigate the changes in relative humidity and water activity in a soil in response to changing temperatures, we constructed a simple experiment in which a soil that contained a preset quantity of adsorbed water was subjected to a controlled heat pulse. The soil was instrumented with an array of humidity and temperature sensors to observe changes in these two properties. A schematic diagram of this apparatus is shown in Figure 3. The apparatus consisted of a 5-cm diameter, 20-cm long polycarbonate tube that contained about 10 cm of a soil under test. The headspace above the soil was humidity and pressure controlled. The space below the soil was vented, while the soil was held in place by a porous filter. A precision humidity controller was used to purge the head space with air that contained a chosen relative humidity. This air could also be purged through the soil column to load the grains with adsorbed water at a controlled or valved off to allow the system to come to pressure equilibrium. A check valve limited the headspace pressure to <70 mb over ambient while purging through the soil.
Schematic diagram of the experimental apparatus. A soil sample was instrumented with an array of 12 RH and temperature sensors with an imbedded heater. RH-controlled air was purged through the soil column to prepare it with adsorbed water. Pressure was equalized between the soil head space and base before heating via a temperature controller. Heater temperatures were logged a 1 s intervals and the RH sensor array at 5 s intervals.
Down the center of the soil, an array of 12 Honeywell HIH8121 humidity and temperature sensors were placed, spaced at 1 cm intervals. Located between the 7th and 8th sensor from the bottom of the soil (at ∼6.5 cm) was a Thorlabs HT10KR1 washer-shaped ceramic heater with a built-in thermistor. The heater was 1.2 cm in diameter, 0.1 cm thick with a central 0.7 cm opening, and located about 0.4 cm from the adjacent Honeywell sensing surfaces. The next sensors were located at 1.4 cm, 2.4 cm, and so on from the heater. The heater was connected to a controller, such that the heating current and the setpoint temperature could be adjusted. Additional sensors observed the headspace temperature, relative humidity, and pressure, as well as the pressure at the base of the soil. The HIH sensors are nominally interchangeable to ± 2% , and we further calibrated them to ∼1% using saturated brines. These sensors also have a nominal response time of about 6 s to changes in conditions. Temperatures are accurate to ± 0.5°C.
In an individual test, we began by purging a fixed relative humidity gas through the soil sample for several hours to several days, depending on the soil, until the readings throughout the column became steady at the source value. For the current work, we chose ∼55% and room temperature (∼20–21°C). Because a pressure gradient (usually 20–40 mb, limited by a check valve to <70 mb) across the soil column was needed to drive the humidifying gas purge, a linear gradient of ∼ 1–5% was unavoidable in the initial conditions; its effect on vapor diffusion was small and easily modeled. After equilibration, the purge was stopped and the pressure equalized between the headspace and the base to avoid Darcy flow of gas. The heater was turned on for 20 min via the heater controller so that it rose to and maintained a set point of 50°C. In most tests, we applied up to a maximum of 1.1 W of heating power, but we evaluated lower heating rates down to 0.5 W. After 20 min, the heater was turned off and the system was allowed to relax for an additional 30 min. Throughout each test, the temperatures and relative humidities along the soil column were recorded at 5 s intervals.
The heating rate generated by this apparatus varies over time. The heater temperature initially jumps rapidly at a peak rate of ∼1.3°C/s, which decays exponentially to <0.1°C/s after a few 10 s of seconds. The surrounding soil heats conductively at a slower rate, such that the HIH sensors never reach the 50°C setpoint of the ceramic heater. While these heating rates and mean temperatures are mostly higher than those found in nature (discussed below), they demonstrate the desorption and gas diffusion processes that affect the relative humidity and water activity.
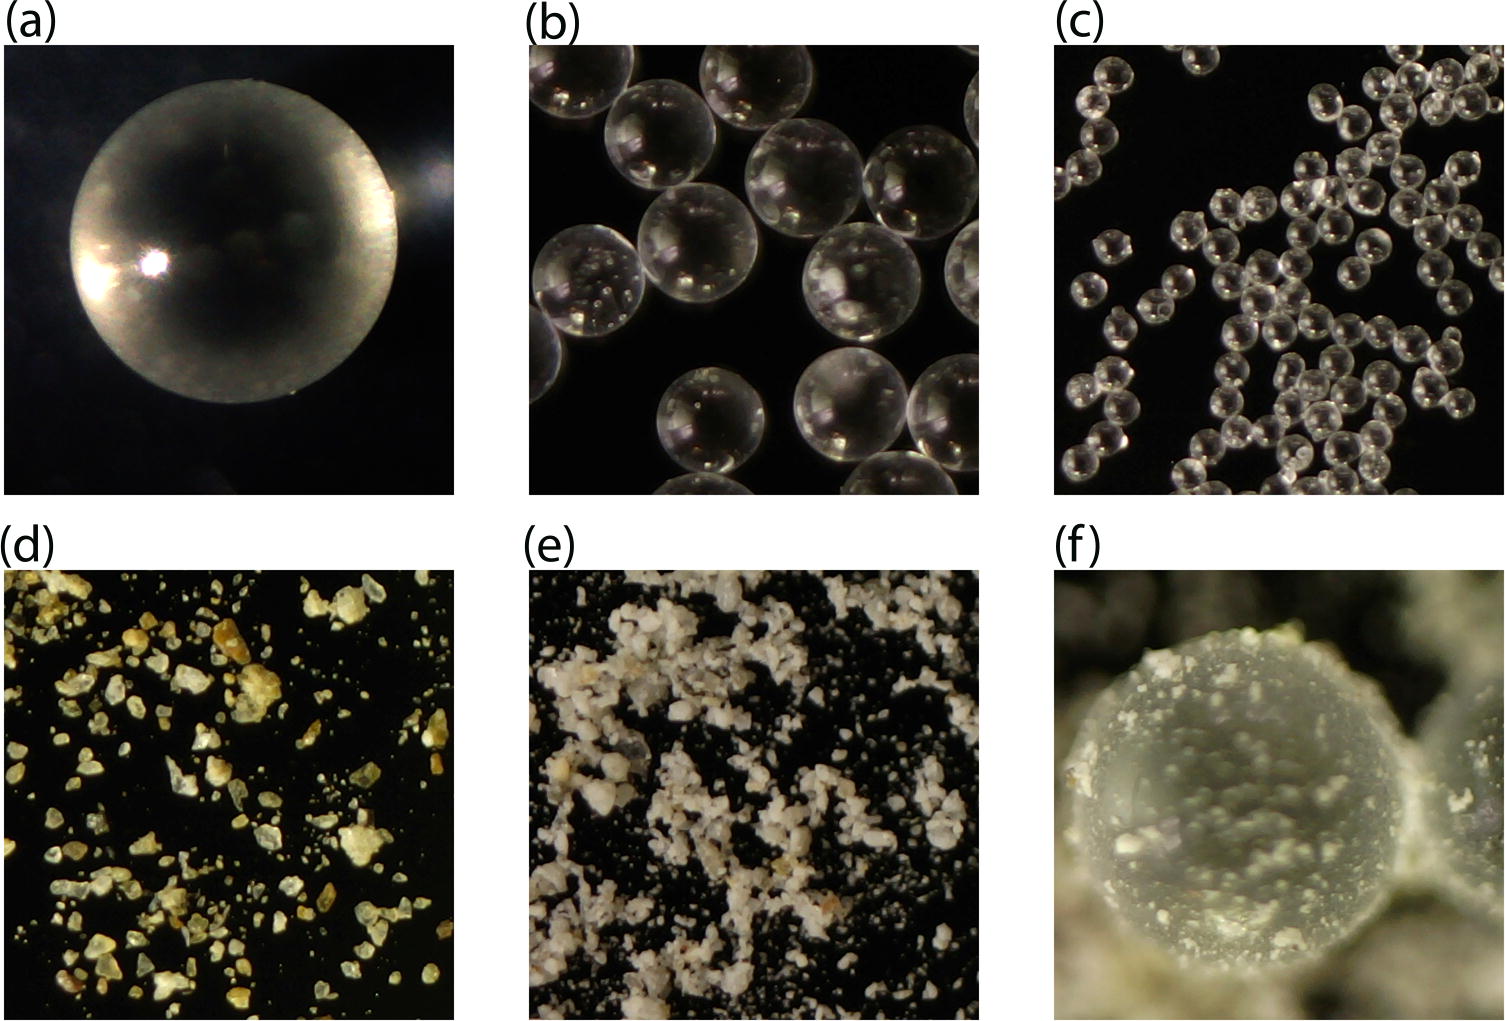
To span a range of soil characteristics of gas diffusivity and adsorptive capacity, we tested six soil analogs listed in Table 1: three sizes of glass beads, an arctic loess, a smectite clay, and a mixture of glass beads and clay. Figure 4 shows microscope images of each soil for comparison. The specific surface area (SSA, measured in m2/g) in large part controls the quantity of bound water in equilibrium with a given vapor pressure and temperature, to a much greater extent than does the grain mineralogy. A change in temperature results in a change in interstitial vapor pressure through adsorption or desorption and an adjustment to a new adsorption equilibrium. A larger SSA provides a greater adsorbed water reservoir for this process. Glass beads (1 mm, 325 µm, and 100 µm) were chosen for their low and easily modeled SSA (increasing with decreasing grain size) and uniform pore structure for near-unimodal packing. Diffusive properties of similar beads were previously measured (Sizemore and Mellon, 2008). Birch Hill loess, a Late Pleistocene loess from near Fairbanks Alaska (Péwé, 1955; Johnson and Lorenz, 2000), was chosen as a moderate specific-surface-area soil. This silt-sized loess, derived from glacial flour from the Alaska Range, contains primarily feldspar and quartz grains with negligible clay-mineral content (Péwé, 1955) and exhibits a low organic content (Johnson and Lorenz, 2000). Montmorillonite clay from Wyoming was chosen as a high SSA smectite clay. Clays have some of the highest SSAs available for water due to the presence of stacked sheet-silicate layers, between which are abundant adsorption sites accessible to water. Nitrogen, typically used to measure SSA, cannot access these layers; hence, Table 1 also reports surface area measured using glycerol (see Zent and Quinn, 1997). The occurrence of clay minerals on Mars has been reported in spectral data (e.g., Poulet et al., 2005; Bibring et al., 2006; Ehlmann et al., 2008) and estimated to comprise about 4–5% of soils at the MER landing sites (McSween et al., 2010). Therefore, for a 6th soil analog, we mixed 1000 µm beads with 5 wt % of montmorillonite clay.
Soils and soil analogs used in our experiments. (a) 1 mm borosilicate glass bead, (b) 325 µm soda lime glass beads, (c) 100 µm soda lime glass beads, (d) Birch Hill loess, (e) montmorillonite clay, (f) a mixture of 1 mm glass beads and 5 wt % clay. Each frame is 1.2 mm wide. See also Table 1. In comparison, in situ observations of Mars soils show a dominance of fine-sand and silt-size grains (Goetz et al., 2010; Pike et al., 2011), with an estimated specific surface area of 17 m2/g (Ballou et al., 1978). Similar properties are reported for Antarctic Dry Valley tills (e.g., McKay et al., 1998; Sizemore and Mellon, 2008).
Weighted average of 95% 1 mm beads and 5% montmorillonite.
Theoretical estimate for spherical beads.
BET nitrogen desorption surface area.
Surface area of clay interlayer sites available for H2O adsorption (Zent and Quinn, 1997).
Experimental Results
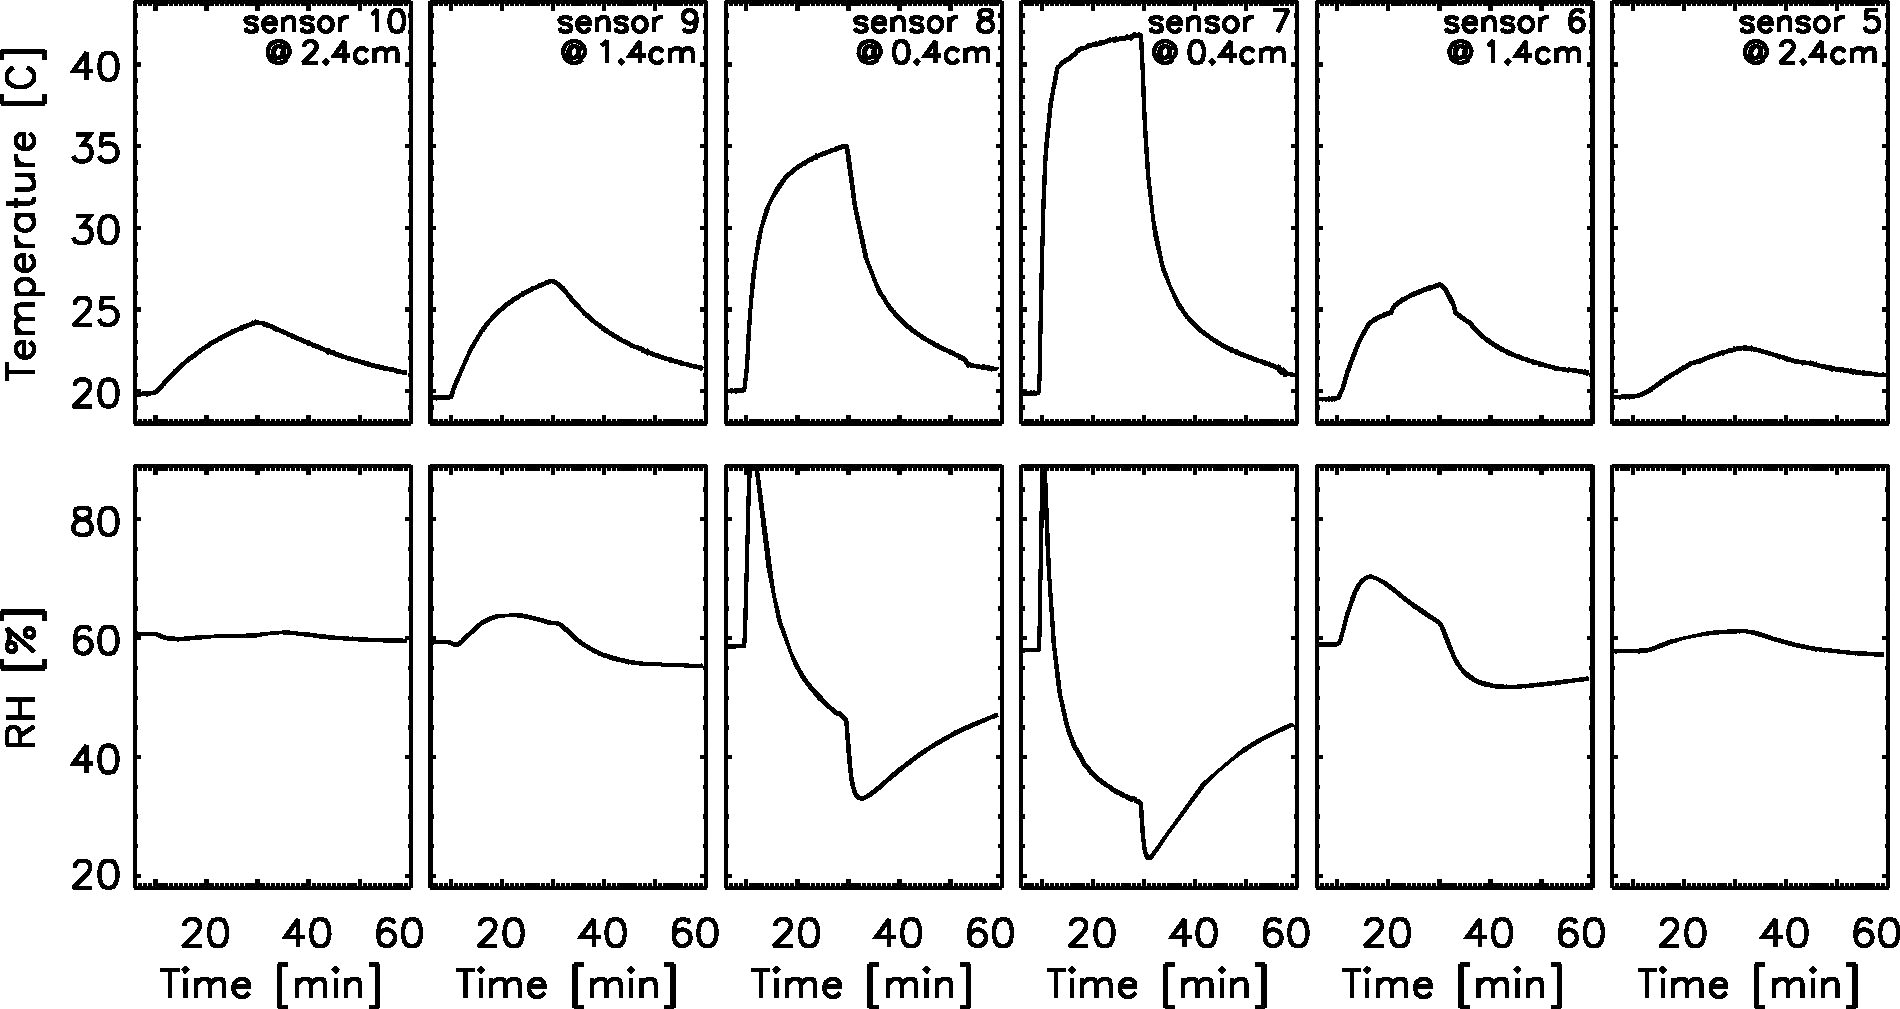
We tested the response to heating for each of the soil analogs listed in Table 1. Figure 5 shows an example result using Birch Hill loess. The top row shows temperatures for six of the sensors, three above and three below the heater; the position of the heater relative to the adjacent sensors can vary ±1 mm, which results in some asymmetry in heating. Originating from this heater, a temperature wave propagated axially up and down the soil column. The bottom row shows the response to the heating and subsequent diffusion of water from warmer soil to cooler soil. An initial spike in was observed in sensors closest to the heater, which we partly attribute to the washer shape of the heater creating a toroidal heating wave that partially focused water vapor radially inward. When this wave reached the first sensor about 0.4 cm from the heater, the warming front shape was best described as a horn torus transitioning to a spindle torus. By the time this wave reached the second sensor 1.4 cm away from the heater, the toroidal shape dissipated, and the heating and fronts were planar and relatively one-dimensional (1D) along the axis of the soil. Consequently, the maximum height of this initial spike in was not predicted by our 1D numerical model, whereas the subsequent behavior of this first sensor and the overall behavior of the adjacent sensors were predicted (see below).
Example of experimental results using Birch Hill loess initially in equilibrium with 58% and subjected to a 20-min heat pulse. Top row: temperatures for six HIH sensors, three above and three below the heater spaced at 1 cm intervals. The heater was located between sensors 7 and 8. While the heater was approximately centered, in this test, it was offset <1 mm deeper. Bottom row: relative humidities (same as water activity × 100) for these same sensors.
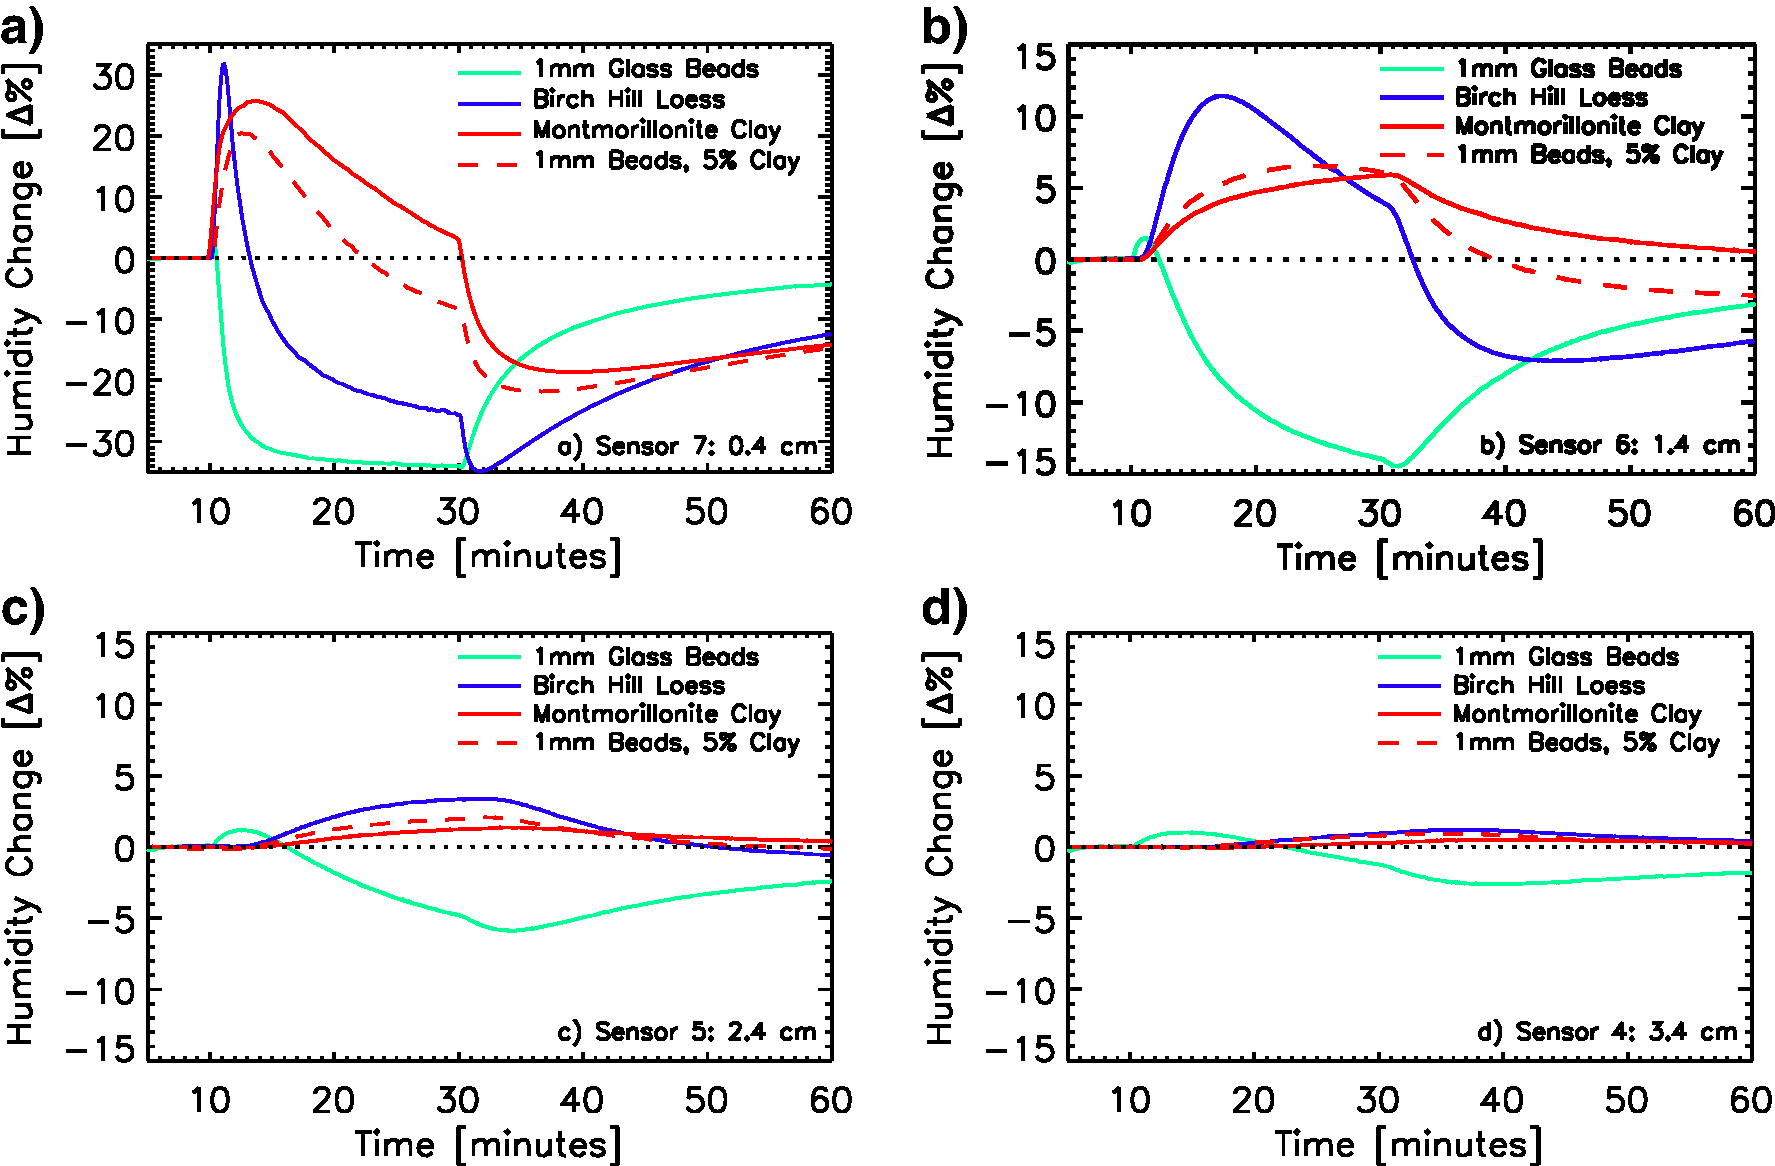
Figure 6 shows a comparison between four of the soils (1 mm beads, loess, smectite clay, and a bead-clay mix) at the first four sensors below the heater, shown as a percentage point change in , . In each case, the soils were subjected to the same heat pulse, up to 1.1 W, for the same time, 20 min, followed by a cool down for 30 min. Overall, we observed an initial rise or an enhancement in () followed by a gradual decline.
Measured changes in relative humidity for four of the analog soils in Table 1. Panels (a–d) indicate distances from the heater of 0.4, 1.4, 2.4, and 3.4 cm, respectively. Changes are shown as relative to the starting . Since temperatures in these tests are above freezing .
The enhancement is generated by water vapor diffusing from regions of warming soil into neighboring regions of cooler soil. Within the cooler soil, some of the incoming water vapor is sequestered into an increase in adsorbed mass to maintain a continuous equilibrium, whereas some water remains in the vapor phase and adds to the relative humidity ().
Subsequently, this cooler soil region will also begin to warm. As it does, the holding capacity (or saturation capacity) of its interstitial air will grow. In addition, within this cooler soil region, warming and desorption will add to the water vapor and initiate a shift from a net diffusive gain of water vapor toward a net diffusive loss. Combined, these effects will cause the enhancement to begin to decline. In some cases, this decline causes a transition from net enhancement to net depletion of () during the 20-min heating interval relative to the initial condition (e.g., loess in Fig. 6a or glass beads in Fig. 6a–d).
Closest to the heat source, the enhancement is largest, while further from the heater the soil experiences these same effects but delayed and muted. Glass beads, which possess the lowest SSA (≪0.01 m2/g, see Table 1), exhibit only a brief and relatively small rise in followed by a large drop at all distances from the heater. In this case, the lack of adsorptive capacity limits the production and thus diffusion of water vapor from warming layers, such that the majority of change in (a depletion) is simply due to increased saturation capacity of the warmed interstitial air and not due to diffusion. In contrast, loess exhibits an intermediate SSA (∼1–5 m2/g), which results in the largest enhancement at all distances from the heater. In all cases, when the heating ceases, the soil cools, and diffusion slowly reverses direction toward regions now depleted in adsorbed water.
Soils containing smectite clay are more complex. With the highest SSA (∼663 m2/g), clays do not show the largest enhancement, especially at sensor distances greater than 0.4 cm. Montmorillonite is known to exhibit a hysteresis between desorption and adsorption rates, which complicates the effects (see discussion below).
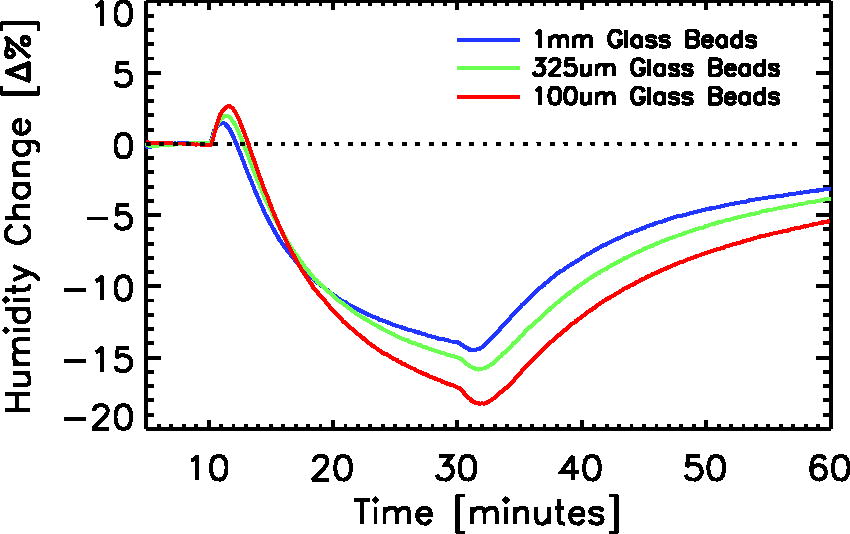
A comparison of at 1.4 cm from the heater for the three glass-bead sizes is shown in Figure 7. While each of the sizes possesses a low SSA, they differ from one another by nearly an order of magnitude (see Table 1). Smaller bead sizes exhibit a slightly larger enhancement in during the initial heating, consistent with the larger SSA. However, the subsequent depletion in is inconsistent with adsorption or gas diffusion. Inspection of the temperature data reveals that, while all beads started out heating at the same rate, smaller bead sizes heated to higher temperatures. It is likely that the smaller beads are more efficiently coupled thermally to the heater with more contacts and uniformly distributed contact points relative to the heater dimensions, whereas the diameter of the larger beads approaches the thickness of the heater, as well as the sensors, which disrupts grain packing and thermal coupling.
Measured changes in relative humidity for the three sizes of glass beads in Table 1 at a distance of 1.4 cm from the heater. Smaller beads show a slightly larger but brief enhancement. A subsequent decline in is observed in all bead samples.
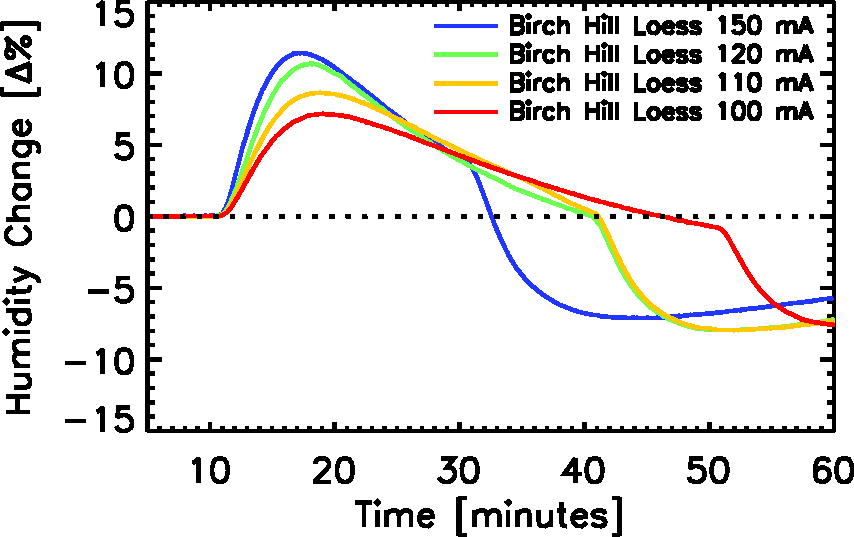
In Figure 8, we compare changes in heater current for tests on the Birch Hill loess. The heater controller applies current up to a maximum value and then reduces that current and the heating power as the set point temperature is approached. We tested maximum currents of 150, 120, 110, and 100 mA, which resulted in initial peak heating rates of 1.3, 0.9, 0.7, and 0.6°C/s, respectively. In each case, the heating rate peaked momentarily after 6 s and then fell immediately with an exponential decay in 30 s to 0.32, 0.19, 0.16, and 0.14°C/s, respectively. Because these tests focused on the slower heating, we extended the heating period in order for the heater to reach the set point of 50°C. Overall, the enhancement was observed to decrease with decreasing heating rate.
Measured changes in relative humidity for Birch Hill loess at four heating rates at a distance of 1.4 cm from the heater. Reducing the heating rate also reduces the observed peak enhancement in relative humidity.
Model Comparison
To investigate the physical processes that control the changes in and resulting from soil heating, we employed a numerical model of vapor diffusion and adsorption (see Mellon and Jakosky, 1993, for a detailed description). In brief, the model uses observed temperatures, initial humidity conditions, and the physical properties of the soil to calculate the diffusion of water vapor between soil layers in 1D. The model uses a forward time-centered space strategy to solve the molecular-diffusion equation for water vapor in a background gas within a porous medium, as well as the exchange of water between vapor and adsorbed phases, to determine the time evolution of the distribution of water in a soil column at 1 mm resolution. We included in our model the three available adsorption isotherms representing basalt powder (Fanale and Cannon, 1971), palagonite, and montmorillonite (Zent and Quinn, 1997). Although glass-bead and Birch Hill loess mineralogy are not precisely represented by these isotherms, the overall results are reasonably simulated. We also used this model to extrapolate from laboratory ambient conditions of temperature and pressure to those appropriate for Antarctic and martian dry permafrost.
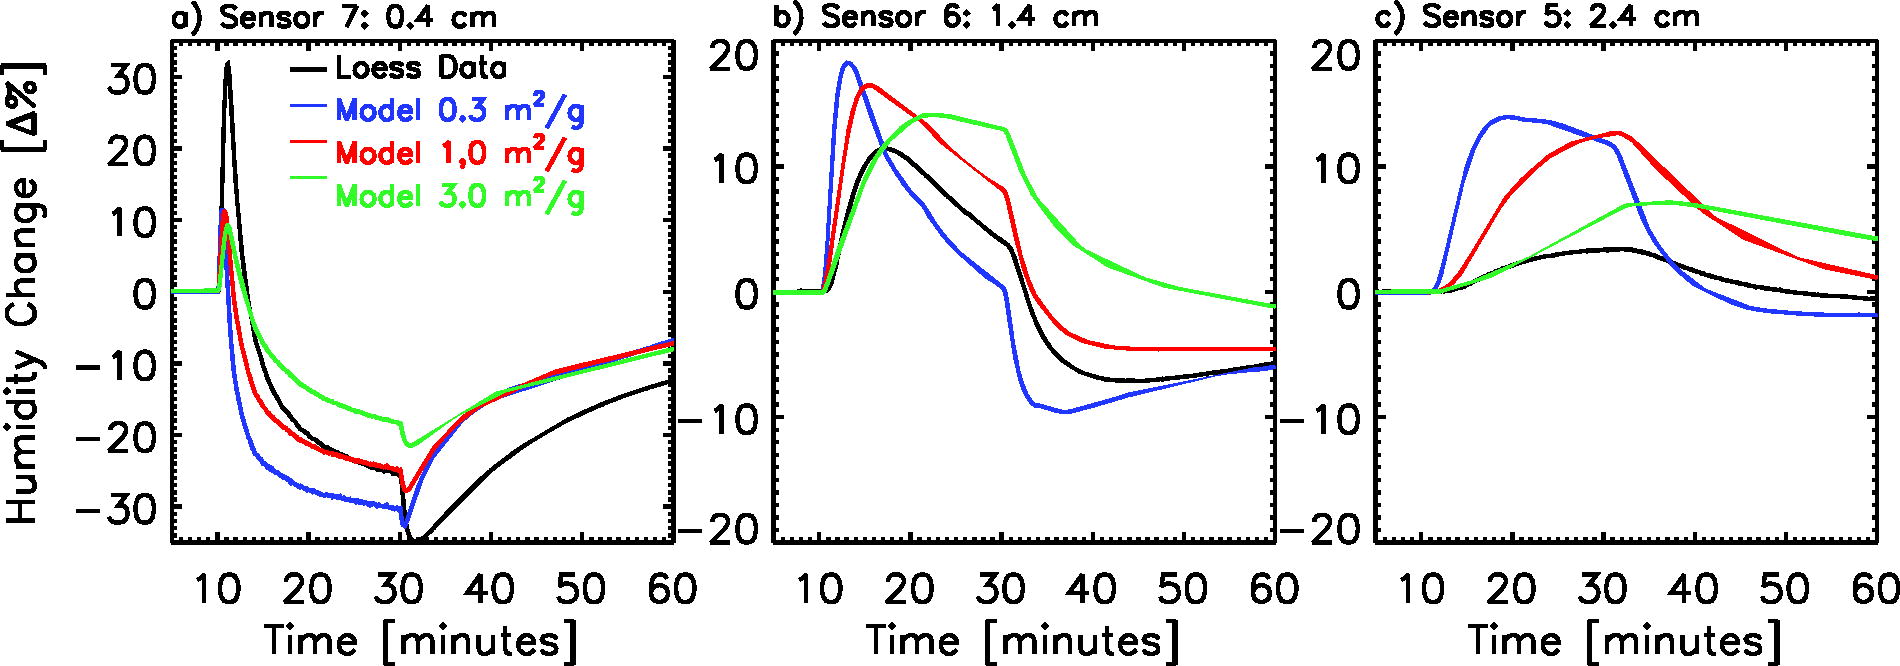
Figures 9 and 10 show the data for Birch Hill loess (Fig. 5) compared with model simulations of the experiment using basalt or montmorillonite adsorption isotherms. We assumed the diffusive properties of the soil given in Table 1 and adjusted the SSA. Figure 9 compares the Birch Hill loess data with three SSA values that assume a basalt adsorption isotherm (Fanale and Cannon, 1971). Figure 10 compares these data with models using basalt and montmorillonite adsorption isotherms. The palagonite adsorption isotherm did not agree with the trends in these data; the overall desorption was much lower than that observed for reasonable SSA values, so we do not consider it further.
Comparison between observed changes in for Birch Hill loess (black) and modeled changes in (colors) assuming a basalt adsorption isotherm and three values of specific surface area, SSA. Comparisons are at distances (a) 0.4 cm, (b) 1.4 cm, and (c) 2.4 cm from the heater.
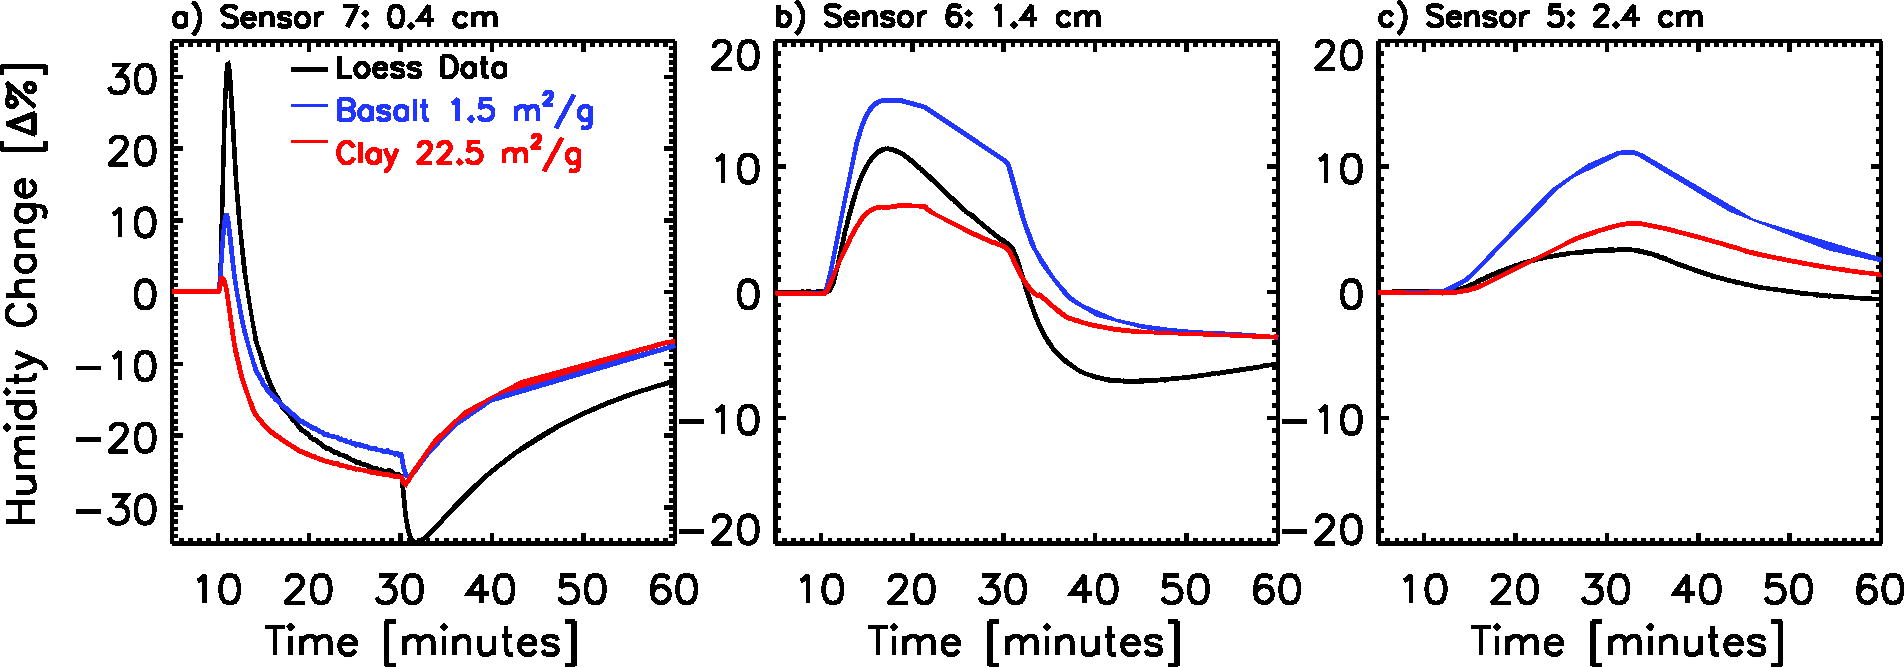
Comparison between observed changes in for Birch Hill loess (black) and modeled changes in (colors) assuming adsorption isotherms for basalt at 1.5 m2/g and montmorillonite clay at 22.5 m2/g. We assumed a tortuosity of 1.9. Comparisons are at distances (a) 0.4 cm, (b) 1.4 cm, and (c) 2.4 cm from the heater.
The models in Figures 9 and 10 are not precise fits to the data but are intended to illustrate the similarity between the modeled physics and observed data. In Figure 10, the basalt adsorption model assumes an SSA of 1.5 m2/g; however, the BET surface area of this soil was measured to be larger at 4.7 m2/g (Table 1). It is important to keep in mind that the Birch Hill loess is mineralogically different from basalt (and montmorillonite) and that these isotherms were developed from adsorption measurements largely below freezing for planetary applications (e.g., Zent and Quinn, 1997). Nevertheless, there are striking similarities between the models and the data. These similarities include (1) an initial spike closest to the heat source (0.4 cm), followed by a large decline; (2) an enhancement of further from the heater (1.4 and 2.4 cm); and (3) inflections and general amplitudes in each of the curves. Although the amplitudes of these changes are not matched exactly, these general trends are reproduced. These comparisons suggest that a more tailored adsorption isotherm specific to the granitic mineralogy of Birch Hill loess (Péwé, 1955) could improve the comparison.
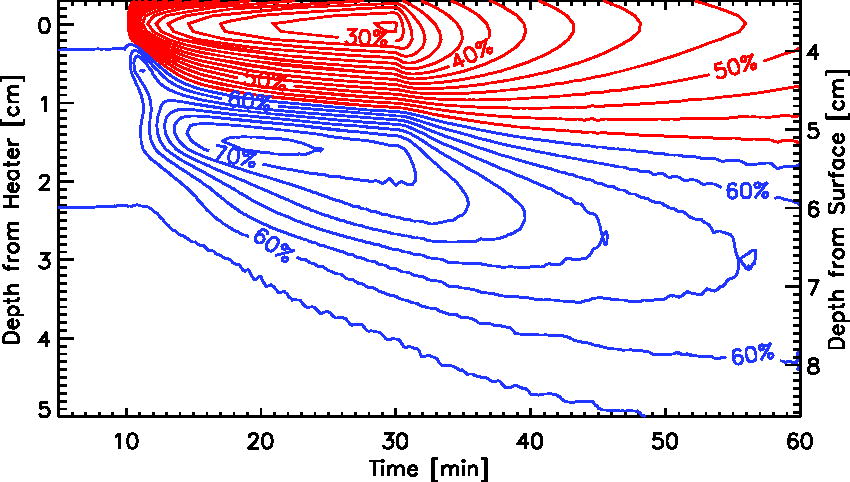
By using the modeled results for Birch Hill loess with a basalt adsorption isotherm, Figure 11 illustrates the propagation of the enhancement as a wave into the subsurface. In the region of the heat source, about 3.7 cm depth from the surface, the soil experiences a strong desorption of water, which coincides with a large rise in the saturation vapor pressure, which together results in a net reduction in the relative humidity. Below this depletion zone is an enhancement in due to water vapor diffusing into cooler soil. It can be seen that the peak propagates downward as both diffusion and heat conduction drive water to greater depths.
Modeled contours for Birch Hill loess assuming a basalt isotherm (same model as in Fig. 10) as a function of depth from the heater (0–5 cm) and below the experimental soil surface (3.7–8.7 cm). Reduced (red contours) results from a combination of increasing the saturation limit and diffusion away from this soil region. Enhanced (blue contours) shows the accumulation of diffused water ahead of conductive heating. The peak is about 75% (up from the starting 58%) occurring at about 1.5 cm depth form the heater.
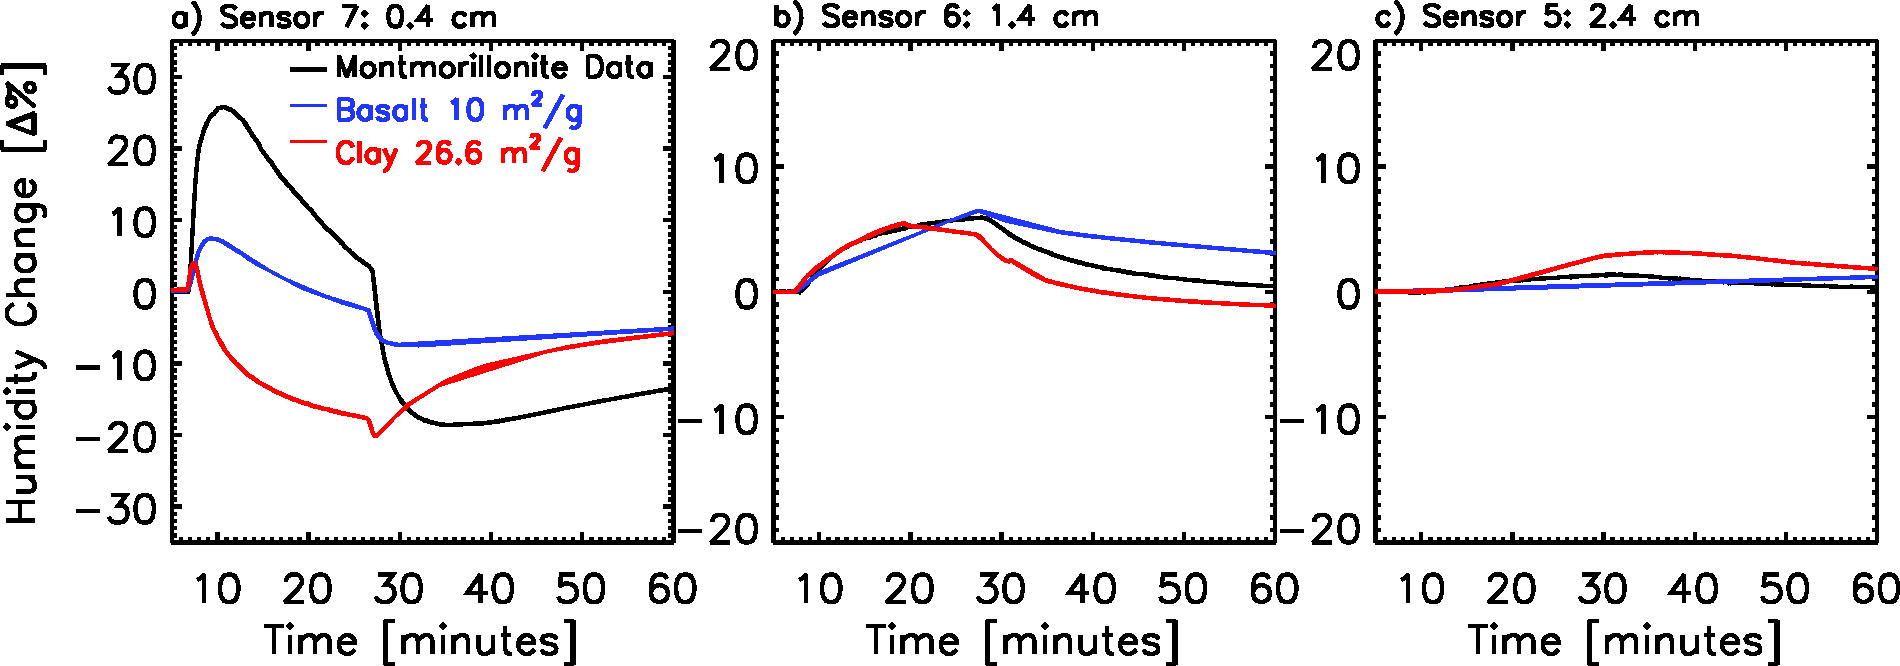
A comparison between the montmorillonite soil data and model simulations is shown in Figure 12. In this case, at 1.4 and 2.4 cm (Fig. 12b and c), both adsorption isotherm models provide relatively close agreement with the data but deviate significantly at 0.4 cm (Fig. 12a). We chose montmorillonite to represent a high SSA smectite clay and because an adsorption isotherm that uses the same mineral was available to incorporate in our modeling (Zent and Quinn, 1997). The differences in agreement between distances of 0.4 and 1.4 cm from the heater may be explained by montmorillonite’s adsorption kinetics. Our model assumes adsorption equilibrium is constantly maintained, a reasonable assumption for most mineral surfaces. Zent and Quinn (1997) pointed out that the uptake of water on montmorillonite is slowed by the migration of water molecules to interlayer sites where much of the adsorptive surface area is found. Indeed, Zent et al., 2001 indicated that the uptake of water requires a higher activation energy than for desorption, which creates a hysteresis between the two processes. This hysteresis effect is consistent with our observations, where a good match using a low montmorillonite SSA (26.6 m2/g) is obtained between model and data at 1.4 and 2.4 cm during adsorption, but a high SSA is needed close to the heat source to account for the quantity of water being desorbed. It is also consistent with the differences in surface areas measured by nitrogen desorption and glycerol (see Zent and Quinn, 1997; Table 1). Our current model is not capable of reproducing this hysteresis between rates of desorption and adsorption.
Comparison between observed changes in for montmorillonite clay (black) and modeled changes in (colors), assuming adsorption isotherms for basalt at 10 m2/g and montmorillonite at 26.6 m2/g. We assumed a tortuosity of 2.1. Comparisons are at distances (a) 0.4 cm, (b) 1.4 cm, and (c) 2.4 cm from the heater.
Discussion
Balance of physical processes
What controls the changes in the within the soil pores? We can illustrate the physics of this process if we define the relative humidity in terms of the vapor density and the saturation vapor density , where . The rate of change in relative humidity with time, , can then be expressed as
The first term on the right can be expressed in terms of the diffusion equation with sources and sinks due to adsorption,where is the diffusion coefficient of water vapor in a background gas within a porous medium (see also Mellon and Jakosky, 1993). The function is the vapor density that is in equilibrium with adsorbed water on the soil grains at a given temperature, , defined by the specific adsorption isotherms (e.g., Fanale and Cannon, 1971; Zent and Quinn, 1997). On the right side of Eq (2), the first term represents added water vapor by molecular diffusion, the second term represents the removal of vapor to maintain equilibrium with adsorption, and the third term represents the desorption of vapor due to heating.
Substituting Eq. (2) into Eq. (1) and expanding in terms of temperature, we obtain
The first term (within brackets) on the right represents the diffusion of vapor into or out of a region of the soil and the partitioning between vapor and adsorption at constant temperature. The second term represents the adsorption or desorption of water due to temperature changes. The third term represents changes in the capacity of the air to hold vapor before saturating. In the absence of a temperature change, the second and third terms vanish. Water vapor diffusing into a region of soil is portioned between vapor and adsorbed phase, such that both and will increase, as well as the relative humidity, . In the absence of significant diffusion, the bracketed first term vanishes, and the third and fourth terms balance desorption and saturation. For the adsorption isotherms (basalt, montmorillonite, and palagonite), the third term is always larger than the second term with any increase in temperature, such that the will decrease even as the overall vapor density in the pore space increases due to heating and desorption.
Noting that (which equals ) within a soil depends on thermal conductivity, , it becomes apparent from Eq. 3 that competing rates of heating and vapor diffusion strongly effect the enhancement. The Lewis Number is a dimensionless number defined as the ratio of the thermal diffusivity to the mass diffusivity , such that , where and are the density and specific heat capacity, respectively. If the vapor diffusion is large relative to thermal conduction, will be small, and the enhancement will be relatively large. Conversely, if vapor diffusion is small relative to thermal conduction, will be large, and the enhancement will be relatively small or even negative. Defining a threshold Lewis Number to predict the amount of enhancement is complicated by the addition of competing temperature dependences of both the adsorption isotherm and the saturation function.
Additionally, soils with small SSAs desorb less water when heated, which produces a smaller diffusive flux regardless of the diffusion coefficient and thus reduces or eliminates the enhancement (e.g., glass beads, Fig. 7). The opposite is true of larger surface area soils (e.g., loess). Very high surface areas, though capable of desorbing more water in the heated zone and thus driving a larger diffusive flux toward cooler soils, also readsorbed the majority of this water within those cooler regions, which left relatively little in the vapor phase. Smectite clay minerals, however, complicate such predictions due to kinetic hysteresis between desorption and adsorption (Zent et al., 2001). Nevertheless, enhancement is optimized by soils that have high vapor diffusivity, low thermal diffusivity, and moderate surface area but lack interlayer hysteresis effects.
Our experiments were conducted at room temperature and ambient pressure to evaluate the physical process and the potential for enhanced water activity in dry permafrost. Using the numerical model, we can make some predictive estimates of what the enhancement, if any, of and in dry permafrost might look like. There are three main differences between laboratory conditions and the environmental conditions in Antarctic and martian dry permafrost: temperature, atmospheric pressure, and heating rate. A reduction in ambient temperature below freezing will mainly affect the relationship between and (Fig. 1) and will thus act to mute the enhancement of relative to . Lower temperatures also reduce the vapor diffusivity and vapor density ; both reduce the overall quantity of transported water vapor. Lower temperatures increase adsorption for a given but decrease adsorption for a given . Ambient pressure , in contrast, has the opposite effect, because is proportional to (Mellon and Jakosky, 1993). While the ambient pressure is slightly lower in alpine dry-permafrost locations in Antarctica, the ambient pressure on Mars is more than 100× lower than that in laboratory conditions, which results in 100× higher rates of vapor diffusion. Additionally, the heating rate affects the rate of desorption relative to the rates of vapor and thermal diffusion.
Heating rates: Antarctica and Mars
In our typical soil tests, the heating rate of the ceramic heater jumped momentarily to ∼1.3°C/s but decayed exponentially to ∼0.3°C/s after 30 s and continued to decrease as the heater temperature approached the set point of 50°C. Tests conducted at lower rates down to a peak of 0.6°C/s, decaying to 0.14°C/s in 30 s, showed that the resulting enhancement declined about 0.7× as much as the decline in the heating rate (Fig. 8). Analysis of diurnal cycles of surface temperature from Antarctic ground-temperature data (e.g., McKay et al., 1998, see below) indicates soil-surface warming reached a maximum of 0.005°C/s (measured at 30-min intervals). Likewise, models of ground temperatures of Mars (e.g., Mellon et al., 2004) yield sustained post-dawn to mid-morning warming of about 0.007°C/s, assuming average martian surface properties. Both cases were about 40–60 times smaller than our nominal (30 s) experimental rates. At these lower heating rates, the enhancements would then be 28–42 times smaller and altogether negligible.
However, in a scenario where the soil surface is in shadow for part of the morning (e.g., behind a boulder or scarp) and emerges from the shadow later in the morning hours, the surface will receive abrupt and more direct sunlight than it would in a nominal sunrise. Such a scenario will result in a higher soil heating rate. A wide range of topographic, geographic, thermophysical, diffusive, and climate scenarios are possible, exploration of which is outside the scope of this work. Nevertheless, a simple application of a 10-AM-to-noon shadow emergence on Mars using the same thermal model of Mellon et al. (2004) raised the soil heating rate into a similar range as that achieved in the lab. Such modeled heating rates are higher in cases of lower thermal inertia or lower atmospheric dust opacity. For example, for an average martian soil surface (thermal inertia of 250J m−2 K−1 s−1 and albedo of 0.23), the peak heating rate at the equator for a 10 AM emergence from a shadow was about 0.3°C/s and increased to 1.3°C/s for at a thermal inertia of 50 J m−2 K−1 s−1.
Insolation, as the primary heat source in nature, causes surface temperatures to rise faster and with a higher amplitude than in the subsurface. Therefore, assuming adsorbed water is initially distributed somewhat uniformly with depth, surface heating will generate the most desorbed water at or close to the surface and drive some water vapor toward deeper cooler layers. Diurnal heating penetrates with an e-folding depth of roughly 7 cm in Antarctic soil and 3 cm in martian soil, at which point desorption effects will dissipate. We therefore expect the majority of enhancement and the potential for habitable conditions to occur in the upper centimeters of the dry-permafrost surface, near the source of heating.
Antarctica
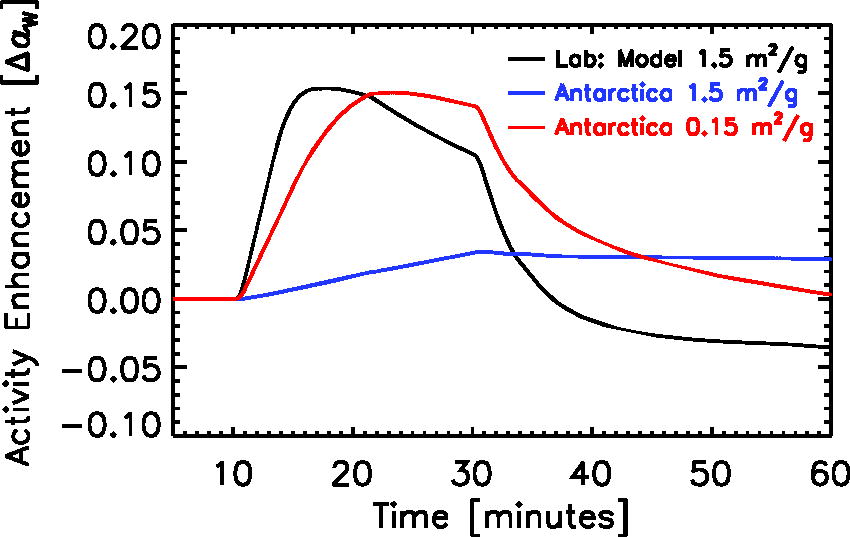
To demonstrate the application of our model to extrapolate laboratory conditions to Antarctic permafrost, we consider an example location of Linnaeus Terrace in the Antarctic Dry Valleys (McKay et al., 1998), where dry permafrost occurs at 1600 m elevation ( = 810 mb) above an ice table at 25 cm depth. The mean annual surface temperature is −25°C, and the mean water activity within the atmosphere is ∼0.5. We used these conditions of mean temperature, pressure, and initial humidity to extrapolate our model of the Birch Hill loess experiment (e.g., Fig. 10) to effective Antarctic conditions. The difference in the resulting is illustrated in Figure 13 for the example at 1.4 cm below the heater. (We focused on 1.4 cm to avoid the residual influence of the toroidal heating.) Assuming the same SSA (1.5 m2/g and a basalt adsorption isotherm) that mimics the laboratory result, the decrease in temperature from laboratory to Antarctic conditions significantly changed the enhancement from a peak of 0.15–0.03 and thus wiped out the majority of the enhancement. However, reducing the SSA by a factor of 10 restores the peak enhancement to 0.15. For the same relative humidity conditions, there is a large reduction in the absolute water-vapor density with the reduction in temperature. At the lower water-vapor density, less water is available to diffuse to cooler soils. Nearly all the water vapor that does diffuse is readily re-adsorbed on the cooler soil grains. When the surface area is reduced 10×, the cooler soil re-adsorbs less, which leaves more water vapor to raise the water activity. In general, a soil with a lower SSA will be more favorable to enhanced habitability conditions in subfreezing soils. Such a soil would be sandy, dominated by coarse grains with few fines or clay minerals. Indeed, the soil at Linnaeus Terrace is locally derived from weathered Beacon Sandstone and exhibits a modal size of 350 µm with more than 90% of the grains larger than 100 µm.
Comparison of modeled enhancement for Birch Hill loess, between laboratory pressure and temperature conditions (black), and Antarctic conditions (blue) of −25°C and 810 mb. Antarctic conditions with SSA reduced 10× are also shown (red). Because Antarctic conditions are below freezing, is no longer synonymous with . We define .
How does this process influence the habitability of dry permafrost at Linnaeus Terrace? To consider this question, we consider a simple scale analysis. The average water activity of the soil surface relative to seasonal atmospheric water-vapor density (McKay et al., 1998) is 0.55, below the 0.6 habitability threshold. However, due to diurnal and seasonal cycles in atmospheric water and soil temperature, periodically rises above the threshold during the year about 42% of the time. If we assume an enhanced in the soil pore space by an additional 0.1 (but only at times when the soil is warming), it will increase the integrated time the soil spends within the habitable range to 50% of the time, essentially lengthening the “growing season” by ∼20%. This analysis does not account for many aspects, such as heating rates, solar flux, temperature changes on time scales <30 min, surface topography, soil characteristics, or water transport dynamics between the atmosphere and subsurface. However, it does demonstrate one way that enhancement of water activity may influence habitability in dry permafrost.
Mars
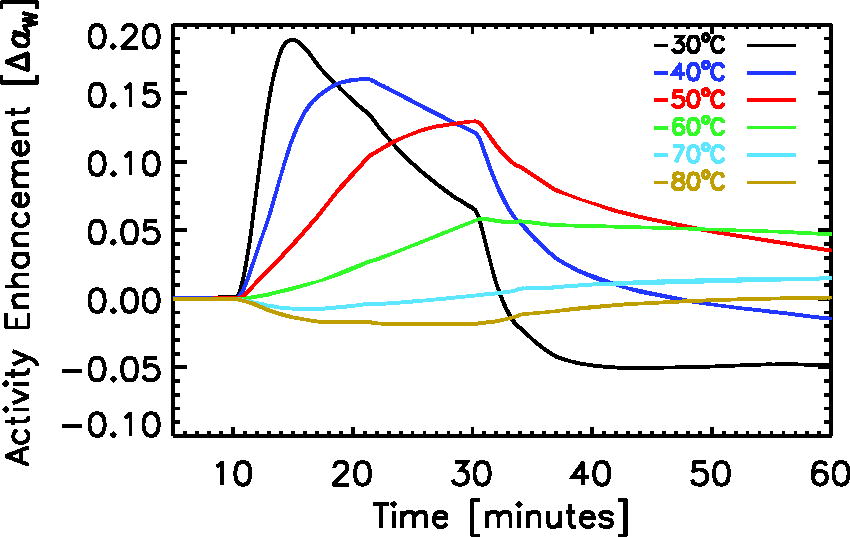
Mars is globally covered in permafrost, with annual mean surface temperatures that range from −110°C in the polar regions to −50°C at the equator (e.g., Mellon and Phillips, 2001). Dry permafrost is ubiquitous, either above ground ice at middle and high latitudes or exceeding many meters’ depth in equatorial regions (Mellon and Jakosky, 1993; Mellon et al., 1997). The average pressure of the martian CO2 atmosphere is ∼6 mb, more than 100× lower than Earth’s ambient pressure. In a similar model extrapolation as in the Antarctic case, Figure 14 shows the modeled effective changes in water activity at 1.4 cm from the heater, assuming a basalt adsorption isotherm with an SSA of 1.5 m2/g (e.g., Fig. 10), a martian pressure, a CO2 atmosphere, and a range of initial temperatures from −30°C to −80°C. The decreased atmospheric pressure increases the enhancement due to a 100-fold increase in the water-vapor-diffusion coefficient; water is transported faster to the cooler soil. In contrast, these lower temperatures decrease the enhancement due to the reduced vapor density in equilibrium with the adsorbate; less water vapor is available to transport to the cooler soil. Nevertheless, for initial temperatures of −60°C and above, the enhancement is estimated to be 0.06 to more than 0.19 for a martian soil analogous to the Birch Hill loess. For initial temperatures below −60°C, decreases with heating. Similar to the Antarctic case, the SSA of the martian soil will influence the magnitude of the , and this enhancement may be larger or smaller.
Comparison of modeled enhancement for Birch Hill loess scaled to martian conditions of 6 mb of atmospheric pressure and a range of initial temperatures. Because martian conditions are below freezing, is no longer synonymous with . .
In the current epoch, Mars is cold and dry. Atmospheric water (expressed as pr µm, precipitable micrometers of column abundance) is primarily controlled by seasonal sublimation from the polar caps. The global average water abundance is about 10 pr µm, and seasonally it can reach nearly 100 pr µm in the polar regions in summer (Jakosky and Farmer, 1982; Smith, 2002; Montmessin et al., 2017) and 20–24 pr µm in the equatorial regions (Smith, 2002). Dry permafrost would need to start at an initial temperature of −60°C or higher to generate appreciable enhancement upon heating (e.g., Fig. 14). However, for soil at −60°C the 10 pr µm of average atmospheric water vapor would equate to an equilibrium of 0.05, far too low to be elevated to 0.6 by heating. Even 24 pr µm (an equatorial peak abundance) would only raise the starting equilibrium to 0.12. In contrast, within the polar regions during summer periods when the atmosphere is approaching 100 pr µm, soil reaching equilibrium with this atmosphere and initially at −60°C would bring the starting to 0.48. However, the low soil-surface temperatures that occur in these polar regions may suppress any enhancement. Initial morning temperatures in summer are likely colder than −60°C, and by the time temperatures are within the −60°C to −40°C range mid-day, the heating rates will have slowed substantially. These concepts assume the dry-permafrost water is in equilibrium with the atmosphere (seasonally or on average), which is generally consistent with Mars observations (e.g., Mellon et al., 2004; Montmessin et al., 2017). Nevertheless, it is possible that in some locations soil water may be out of equilibrium with the atmosphere, as might result from actively sublimating glacial ice under a thin layer of dry permafrost or sublimation till (e.g., Bramson et al., 2017). In this case, the starting may be substantially higher and become habitable through heating-induced enhancement.
During periods of high obliquity, increased sublimation from the polar caps is expected to increase the quantity of atmospheric water vapor to a global average on the order of 100 s of pr µm, with peak values perhaps >1000 pr µm (Jakosky and Carr, 1985; Richardson and Wilson, 2002; Mischna et al., 2003; Vos et al., 2023). Under these climate conditions, ground ice beneath dry permafrost is expected to be globally distributed (e.g., Mellon and Jakosky, 1995; Mellon et al., 2024). Barring accumulation of surface ice, dry permafrost in equilibrium with this high-obliquity climate would become more substantially laden with adsorbed water than at the current epoch. As such, diurnally heated soil may generate enough enhancement to exceed 0.6 at temperatures above −40°C. High-obliquity periods have occurred throughout Mars’ 4.5 Ga history; however, any climate conditions that similarly increase atmospheric water vapor and soil moisture may enable a periodic enhancement into a habitable range.
These examples are meant to place laboratory measurement into some real-world context. Planetary environments of dry permafrost are varied, especially when the entire surface of Mars is considered. A wide range of soils (SSA, pore structure, mineralogy, thermal properties, etc.), local environments, and climate conditions exist. A detailed exploration of this parameter space, and the range of possible enhancements and habitable niches, with a coupled climate and water transport model is outside the scope of the current study. Nevertheless, these experiments and model analyses demonstrate the magnitude of the effects of heating on water activity and habitability, and the applicability and limits of this process in the search for habitable locations in planetary permafrost. These findings point to favorable (and unfavorable) conditions in terms of soil temperatures, humidities, and adsorption characteristics, and they provide a proof of concept to the hypothesis proposed by Rummel et al. (2014).
Summary and Conclusions
To investigate the hypothesis that heating a soil can enhance the water activity and increase the potential for habitable conditions, we conducted simple soil heating experiments at laboratory-ambient conditions and measured the relative humidity response. For soils and soil analogs, we tested glass beads, arctic loess, and smectite clay. Using a numerical model of water transport dynamics within the soil, we examined these experimental results to identify the dominant physical processes and extrapolate experimental conditions to that which would occur in dry permafrost on Earth and Mars.
Experimental results have shown that and can increase in a soil undergoing periodic or secular heating. The enhancement occurs within cooler soil adjacent to the initially warming soil. Desorption of water from heated soil locally increases the vapor density, whereas molecular diffusion then drives water vapor toward adjacent cooler soil. Some incoming water within the cooler soil is adsorbed, whereas some remains in the vapor phase, which thus increases and . Enhancement of is controlled by the balance between vapor diffusion and thermal conduction, as well as the balance between adsorption and vapor saturation, both as functions of temperature. Optimal soil conditions for enhancement include an open porous structure that favors vapor diffusion, moderate adsorption, and low thermal conduction.
Clays (such as smectites) experience an adsorption hysteresis—a delayed readsorption relative to desorption. Warming clay soils can rapidly desorb water from interlayer sites, which results in large vapor diffusion toward adjacent cooler soils. However, the cooler soils are slow to uptake water except on exterior grain surfaces, which leaves more water vapor to raise and .
In our laboratory setting, we observed an increase in of about 6–12 percentage points (an increase in of 0.06–0.12) for loess and clay soils at a distance of 1.4 cm from the heater (using a nominal heating rate on the order of ∼0.3°C/s). enhancement appeared higher closer to the heat source and decreased with distance from the heat source. Lowering the heating rates reduced the and enhancement. Glass beads, which have the lowest SSA, exhibited a net decline in and upon heating. The low-SSA glass beads desorb little water to drive diffusion toward adjacent cooler soil, so water activity becomes a balance between local desorption and vapor saturation limits as a function of temperature. Natural diurnal cycles in ground temperature for a flat soil surface are subdued 40–60× relative to laboratory heating rates, which makes enhancement negligible. However, in the case where the soil surface emerges from a shadow cast by a boulder or topographic scarp, higher heating rates occur, which are comparable to those of the laboratory setting.
Using a numerical model of water transport and partitioning between vapor and adsorbed phases, we simulated and under laboratory conditions and extrapolated these results to Antarctic and martian dry-permafrost conditions. Comparison with laboratory conditions showed that our model mimics the laboratory observations and broadly captured the salient physical processes. In general, we find that locations with local topography (hills and scarps) or scattered boulders capable of casting morning shadows are more likely to generate large heating rates when emerging from shadow. Soil with a moderately low SSA (e.g., sandy to silty soil with minimal clay-sized grains) will maximize the enhancement, whereas soil with very a low SSA (e.g., coarse sand) may contain too little water to desorb sufficiently. Unrestricted gas diffusion and limited heat conduction are also favorable soil characteristics.
Assuming laboratory heating rates can be applied in nature, as in the case of shadow emergence, extrapolation to planetary permafrost involves reductions in both temperature and pressure. At lower temperatures, water-vapor density in equilibrium with adsorption is reduced, which in turn reduces the flux of water transported between warm and cool soils and mutes any enhancement. Reduced pressure accelerates vapor diffusion and increases enhancement. Antarctic results suggest that low SSA soils (e.g., sandy soils) may become periodically habitable or experience a longer “growing season,” if on average they persist close to but below the habitability threshold ( and ). Mars results suggest that the current climate is too dry for heating to have a sufficient effect on to approach habitable conditions in the dry permafrost. An exception may occur if local soil conditions are in disequilibrium with the climate. Martian polar regions in summer may be sufficiently more humid, but ground temperatures are unlikely to reach −40°C while maintaining rapid heating. However, at high obliquity, when the global atmospheric humidity is expected to be 10–100 times higher, results are similar to those of the Antarctic case.
In the search for potentially habitable conditions in dry-permafrost environments, our results offer a few clues for the identification of optimum locations. Detailed investigation of habitable niches in the dry permafrost of Mars or Antarctica will require a coupled diurnal, climate, and hydrological model of the dry permafrost, guided by these experimental results.
Footnotes
Acknowledgments
The authors would like to thank Thomas Douglas (Cold Regions Research and Engineering Laboratory) for help collecting the arctic loess used in this study. In addition, the authors would like to thank two anonymous reviewers for their constructive comments.
Authors’ Contributions
M.T.M. and C.P.M.: Conceptualization and funding. M.T.M., A.F.A., and H.G.S.: Investigation, data acquisition, and software. All authors contributed to methodology, analysis, interpretation, writing, and editing.
Author Disclosure Statement
There are no competing financial interests.
Funding Information
This work was partially supported by the NASA Habitable Worlds program via grant 80NSSC24M0041.
Supplementary Material
Supplementary Data
Associate Editor: Sherry L. Cady
Abbreviations Used
References
1.
BallouEV, WoodPC, WydevenT, et al.Chemical interpretation of Viking Lander 1 life detection experiment. Nature, 1978; 271(5646):644–645.
2.
BibringJP, LangevinY, MustardJF, et al.Global mineralogical and aqueous Mars history derived from OMEGA/Mars Express data. Science, 2006; 312(5772):400–404.
3.
BoxeCS, HandKP, NealsonKH, et al.Adsorbed water and thin liquid films on Mars. Int J Astrobiol, 2012; 11(3):169–175.
4.
BramsonAM, ByrneS, BapstJ. Preservation of midlatitude ice sheets on Mars. JGR Planets, 2017; 122(11):2250–2266.
5.
ClarkeA. The thermal limits to life on Earth. International Journal of Astrobiology, 2014; 13(2):141–154; doi: 10.1017/S1473550413000438
6.
CockellCS, BushT, BryceC, et al.Habitability: A review. Astrobiology, 2016; 16(1):89–117.
7.
deBoerJH. The Dynamical Character of Adsorption. Oxford Univ. Press: London; 1953.
8.
EhlmannBL, MustardJF, FassettCI, et al.Clay minerals in delta deposits and organic preservation potential on Mars. Nature Geosci, 2008; 1(6):355–358.
9.
FanaleFP, CannonWA. Adsorption on the Martian regolith. Nature, 1971; 230(5295):502–504.
10.
GoetzW, PikeWT, HviidSF, et al.Microscopy analysis of soils at the Phoenix landing site, Mars: Classification of soil particles and description of their optical and magnetic properties. J Geophys Res: Planets, 2010; 115(E00E22):1–25.
11.
HoehlerTM. An energy balance concept for habitability. Astrobiology, 2007; 7(6):824–838.
12.
JakoskyBM, CarrMH. Possible precipitation of ice at low latitudes of Mars during periods of high obliquity. Nature, 1985; 315(6020):559–561.
13.
JakoskyBM, FarmerCB. The seasonal and global behavior of water vapor in the Mars atmosphere: Complete global results of the Viking atmospheric water detector experiment. J Geophys Res, 1982; 87(B4):2999–3019.
14.
JakoskyBM, ShockEL. The biological potential of Mars, the early Earth, and Europa. J Geophys Res, 1998; 103(E8):19359–19364.
15.
JakoskyBM, NealsonKH, BakermansC, et al.Subfreezing activity of microorganisms and the potential habitability of Mars’ polar regions. Astrobiology, 2003; 3(2):343–350.
16.
JohnsonJB, LorenzRD. Thermophysical properties of Alaskan loess: An analog material for the Martian polar layered terrain? Geophysical Res Lett, 2000; 27(17):2769–2772.
17.
McKayCP, MellonMT, FriedmannEI. Soil temperatures and stability of ice-cemented ground in the McMurdo Dry Valleys, Antarctica. Antarct Sci, 1998; 10(1):31–38.
18.
McSweenHYJr, McGlynnIO, RogersAD. Determining the modal mineralogy of Martian soils. J Geophys Res: Planets, 2010; 115(E7).
19.
MellonMT, JakoskyBM. Geographic variations in the thermal and diffusive stability of ground ice on Mars. J Geophys Res, 1993; 98(E2):3345–3364.
20.
MellonMT, JakoskyBM. The distribution and behavior of Martian ground ice during past and present epochs. J Geophys Res, 1995; 100(E6):11781–11799.
21.
MellonMT, PhillipsRJ. Recent gullies on Mars and the source of liquid water. J Geophys Res, 2001; 106(E10):23165–23179.
22.
MellonMT, FeldmanWC, PrettymanTH. The presence and stability of ground ice in the southern hemisphere of Mars. Icarus, 2004; 169(2):324–340.
23.
MellonMT, JakoskyBM, PostawkoSE. The persistence of equatorial ground ice on Mars. J Geophys Res, 1997; 102(E8):19357–19369.
24.
MellonMT, SizemoreHG, HeldmannJL, et al.The habitability conditions of possible Mars landing sites for life exploration. Icarus, 2024; 408:115836.
25.
MerinoN, AronsonHS, BojanovaDP, et al.Living at the extremes: Extremophiles and the limits of life in a planetary context. Front Microbiol, 2019; 10:780.
26.
MischnaMA, RichardsonMI, WilsonRJ, et al.On the orbital forcing of Martian water and CO2 cycles: A general circulation model study with simplified volatile schemes. J Geophys Res, 2003; 108(E6):16.
27.
MontmessinF, SmithMD, LangevinY, et al.The water cycle. In: The Atmosphere and Climate of Mars, Vol. 18. Cambridge University Press: 2017; pp. 338–373.
28.
NashTH, ReinerA, Demmig‐AdamsB, et al.The effect of atmospheric desiccation and osmotic water stress on photosynthesis and dark respiration of lichens. New Phytologist, 1990; 116(2):269–276.
29.
OmelonCR. Endolithic microorganisms and their habitats. In: Their World: A Diversity of Microbial Environments (HurstC.J.. eds.). Springer: 2016; pp. 171–201.
30.
PalmerRJ, FriedmannEI. Water relations and photosynthesis in the cryptoendolithic microbial habitat of hot and cold deserts. Microb Ecol, 1990; 19(1):111–118.
31.
PéwéTL. Origin of the upland silt near Fairbanks, Alaska. Geol Soc America Bull, 1955; 66(6):699–724.
32.
PikeWT, StauferU, HechtMH, et al.Quantification of the dry history of the Martian soil inferred from in situ microscopy. Geophys Res Lett, 2011; 38(24):n/a–n/a.
33.
PouletF, BibringJP, MustardJF, et al.; Omega Team. Phyllosilicates on Mars and implications for early Martian climate. Nature, 2005; 438(7068):623–627.
34.
Precht, H., J. Christophersen, H. Hansel, and W. Larcher, 1973. Temperature and Life, Springer Verlag, New York.
35.
PricePB, SowersT. Temperature dependence of metabolic rates for microbial growth, maintenance, and survival. Proc Natl Acad Sci U S A, 2004; 101(13):4631–4636.
36.
RichardsonMI, WilsonRJ. Investigation of the nature and stability of the Martian seasonal water cycle with a general circulation model. J Geophys Res, 2002; 107(E5):7.
37.
RivkinaEM, FriedmannEI, McKayCP, et al.Metabolic activity of permafrost bacteria below the freezing point. Appl Environ Microbiol, 2000; 66(8):3230–3233.
38.
RummelJD, BeatyDW, JonesMA, et al.A new analysis of Mars “special regions”: findings of the second MEPAG Special Regions Science Analysis Group (SR-SAG2). Astrobiology, 2014; 14(11):887–968.
39.
SizemoreHG, MellonMT. Laboratory characterization of the structural properties controlling dynamical gas transport in Mars-analog soils. Icarus, 2008; 197(2):606–620.
40.
SmithMD. The annual cycle of water vapor on Mars as observed by the Thermal Emission Spectrometer. J‐Geophys‐Res, 2002; 107(E11):25.
41.
VosE, AharonsonO, SchörghoferN, et al.Paleo‐Evolution of martian subsurface ice and its role in the polar physical and isotopic layering. Journal of Geophysical Research: Planets, 2023; 128(E10)pp:1–16.
42.
ZentAP, HowardDJ, QuinnRC. H 2 O adsorption on smectites: Application to the diurnal variation of H 2 O in the Martian atmosphere. J Geophys Res, 2001; 106(E7):14667–14674; doi: 10.1029/2000JE001394
43.
ZentAP, QuinnRC. Measurement of H2O adsorption under Mars‐like conditions: Effects of adsorbent heterogeneity. J Geophys Res, 1997; 102(E4):9085–9095.
Supplementary Material
Please find the following supplemental material available below.
For Open Access articles published under a Creative Commons License, all supplemental material carries the same license as the article it is associated with.
For non-Open Access articles published, all supplemental material carries a non-exclusive license, and permission requests for re-use of supplemental material or any part of supplemental material shall be sent directly to the copyright owner as specified in the copyright notice associated with the article.