
Abstract
Mars has been exposed to ionizing radiation for several billion years, and as part of the search for life on the Red Planet, it is crucial to understand the impact of radiation on biosignature preservation. Several NASA and ESA missions are looking for evidence of ancient life in samples collected at depths shallow enough that they have been impacted by galactic cosmic rays (GCRs). In this study, we exposed a diverse set of Mars analog samples to 0.9 Megagray (MGy) of gamma radiation to mimic 15 million years of exposure on the Martian surface. We measured no significant impact of GCRs on the total organic carbon (TOC) and bulk stable C isotopes in samples with initial TOC concentration > 0.1 wt. %; however, diagnostic molecular biosignatures presented a wide range of degradation that didn’t correlate to factors like mineralogy, TOC, water content, and surface area. Exposure dating suggests that the surface of Gale crater has been irradiated at more than five times our dose, yet using this relatively low dose and “best-case scenario” geologically recalcitrant biomarkers, large and variable losses were nevertheless evident. Our results empasize the importance of selecting sampling sites at depth or recently exposed at the Martian surface.
Introduction
As we search for traces of ancient life or biosignatures on Mars, it is crucial to understand the impact of cosmic radiation. Since the time Mars lost its magnetic field and protective atmosphere around 3.9 to 4.1 billion years ago (Acuna et al., 1999; Mittelholz et al., 2020), the planet’s surface has been exposed to two types of ionizing radiation: (1) solar cosmic rays (SCR), which are emitted during solar events (flares and coronal mass ejections) and mostly composed of protons and alpha particles, and (2) galactic cosmic rays (GCRs), originating from outside the solar system (e.g., supernovas) and composed of 85% protons and 14% alpha particles, as well as ∼ 1% of heavy nuclei (HZE) (Dartnell et al., 2007). These two types of radiation differ not only in their sources but also in their energies and flux intensities on the Martian surface. Although SCRs abundances and energies greatly vary with solar flares activity (up to several hundreds of MeV/nucleon during a spike), GCRs are a constant flux (modulated by solar activity) and have much higher deposited energies (between 0.5 and 1 GeV/nucleon) (Dartnell et al., 2007). Because they are more energetic, GCRs penetrate much deeper under the Martian surface. At depths of ∼5 cm under the surface, and independently of the Martian atmosphere thickness, GCRs dominate (Pavlov et al., 2012). In the regolith, when high-energy particles interact with nuclei in the surrounding rock or soil, they may produce a shower of secondary radiation (protons, neutrons, gamma rays, and electrons), which further decay into muons, gamma rays, and electrons, creating a cone of electromagnetic radiation (Fig. 1) (Dartnell et al., 2007). GCRs can also produce secondary radiation showers in the Martian atmosphere, but not as effectively because of the atmosphere low density. The current NASA rovers Curiosity and Perseverance drill up to 5 cm (Okon, 2010; Moeller et al., 2021), depths that are primarily irradiated by GCRs. ESA’s future Rosalind Franklin rover is planned to launch in 2028 and will be capable of drilling down to 2 m in depth at its landing site in Oxia Planum (Vago et al., 2015). Even if GCR exposure is greatly attenuated under 2 m of rocks (Pavlov et al., 2022), it still may play an important role in biomarker degradation.
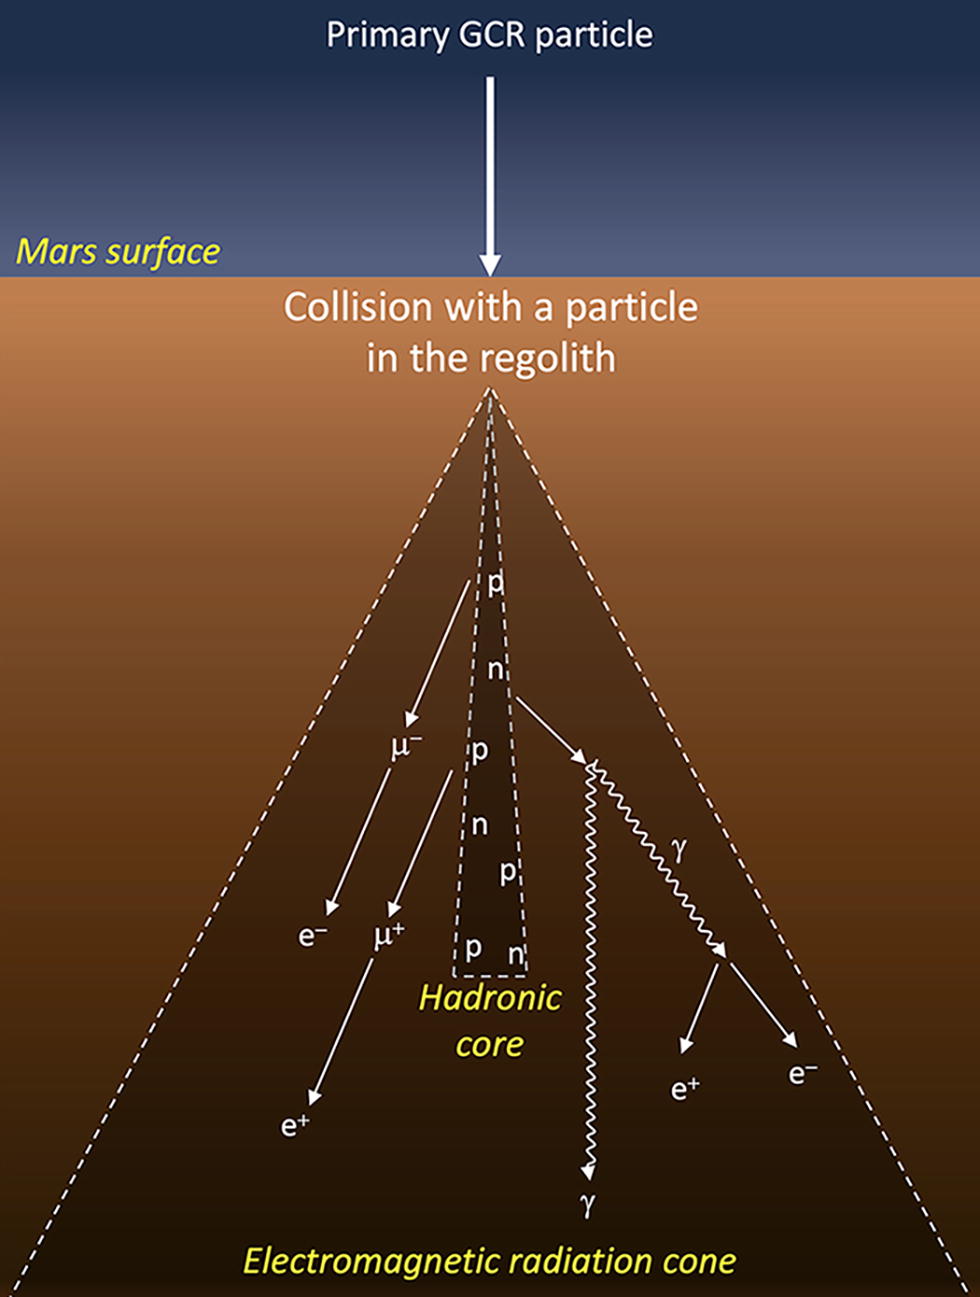
Shower of secondary radiation induced by the reaction of one primary GCR particle with a particle from the regolith on the Martian surface (adapted from Nordheim et al., 2015). When the GCR particle collide with the regolith, it creates a shower of secondary radiation, mostly composed of protons (p) and neutrons (n), that will shortly decay into gamma rays (γ), muons (µ), and electrons (e). The radiation shower can be divided into the narrow hadronic core and the more extended electromagnetic radiation cone. GCR, galactic cosmic rays.
Currently, the only measurements of cumulative GCR exposure on Mars have been collected by the Curiosity rover at Gale crater (Farley et al., 2014; Vasconcelos et al., 2016, Martin et al., 2017, 2020). Using cosmogenic isotopes, these studies determined that the Sheepbed mudstone, the Windjana sandstone, and the Mojave 2 mudstone had been exhumed and exposed to GCRs for a total time of 78 ± 30, 46 ± 15, and 1240 ± 220 Myr, respectively, even though the sediments were deposited in the early Hesperian, between 3.7 and 3.2 billion years ago (Le Deit et al., 2013; Grant et al., 2014). Both the Perseverance and Rosalind Franklin missions have the objective of finding biosignatures in Jezero crater and Oxia Planum, respectively, both regions dating from the Noachian-Hesperian boundary, around 3.7 billion years ago (Tanaka et al., 2014; Mandon et al., 2020). These landing sites may have received radiation doses within the same order of magnitude as Gale crater, though neither Perseverance nor Rosalind Franklin have the onboard capacity to measure the exposure age of the local terrain. In addition, the Perseverance rover is collecting samples to be returned to Earth as part of the NASA Mars Sample Return (MSR) mission, which will enable detailed cosmological dating in terrestrial labs.
Much research has been done on standards to understand how chemical biosignatures degrade under GCRs and at what rate. These studies range from small organics like amino acids (Kminek and Bada, 2006; Gerakines and Hudson, 2013; Pavlov et al., 2012; Pavlov et al., 2022) to large macromolecules like kerogen (Fox et al., 2019, 2023). In this work, we focus on the radiolytic degradation of organic molecules in natural samples (with varying mineralogies, water content, formation context, porosities, etc.) to study a radiolytic process analogous to one on Mars. The samples have naturally preserved a range of biosignatures (molecular, isotopic, and morphological), and we have specifically focused on two of the most resistant chemical biosignatures on Earth, hopanes and steranes, which are abundantly used in the field of terrestrial paleo-environments research. We would not expect to detect either hopanes or steranes on Mars unless Mars and Earth share a common ancestor (Pavlov et al., 2006); nevertheless, these molecules can serve as chemical analogs of recalcitrant hydrocarbons of possible biological affinity on Mars. Hopanes and steranes are molecular fossils of hopanols and sterols that are found in lipid membranes of bacteria and eucaryotes, respectively (Brocks and Summons, 2003). They are diagnostic of life. No abiotic pathways are known to create such molecules, which are among the most resistant biomarkers that have been discovered and are preserved deep into the geologic record (Brocks and Summons, 2003; Vinnichenko et al., 2020). We selected organic-rich Mars analog samples that harbor these diagnostic, chemically recalcitrant biomarkers to examine a “best-case” scenario.
In a previous study (Roussel et al., 2022), we found that hopanes and steranes were destroyed up to twice faster than models and standards analyses predicted. Here, we mimicked GCRs using 1 MeV gamma radiation up to a dose of 0.9 Megagray (MGy) to gauge the potential effects of a 15 million year (Myr) exposure age on the surface of Mars (conservative estimation, using models of Pavlov et al., 2012). On Mars, the gamma radiation energy level at 1 m depth ranges from 1 to 10 MeV (Dartnell et al., 2007). Here, we included more diverse mineralogies, including clay-rich and carbonate-rich Mars analog samples to better understand which parameters impact the preservation of chemical biosignatures in natural samples under simulated GCRs and how much variation we observe. We also investigated whether certain chemical structures were more resilient than others and whether potential patterns of destruction could create unique signatures for cosmic radiation, akin to thermal degradation, that we could later use as a proxy for gauging the exposure age of a sample on Mars.
Sample geology
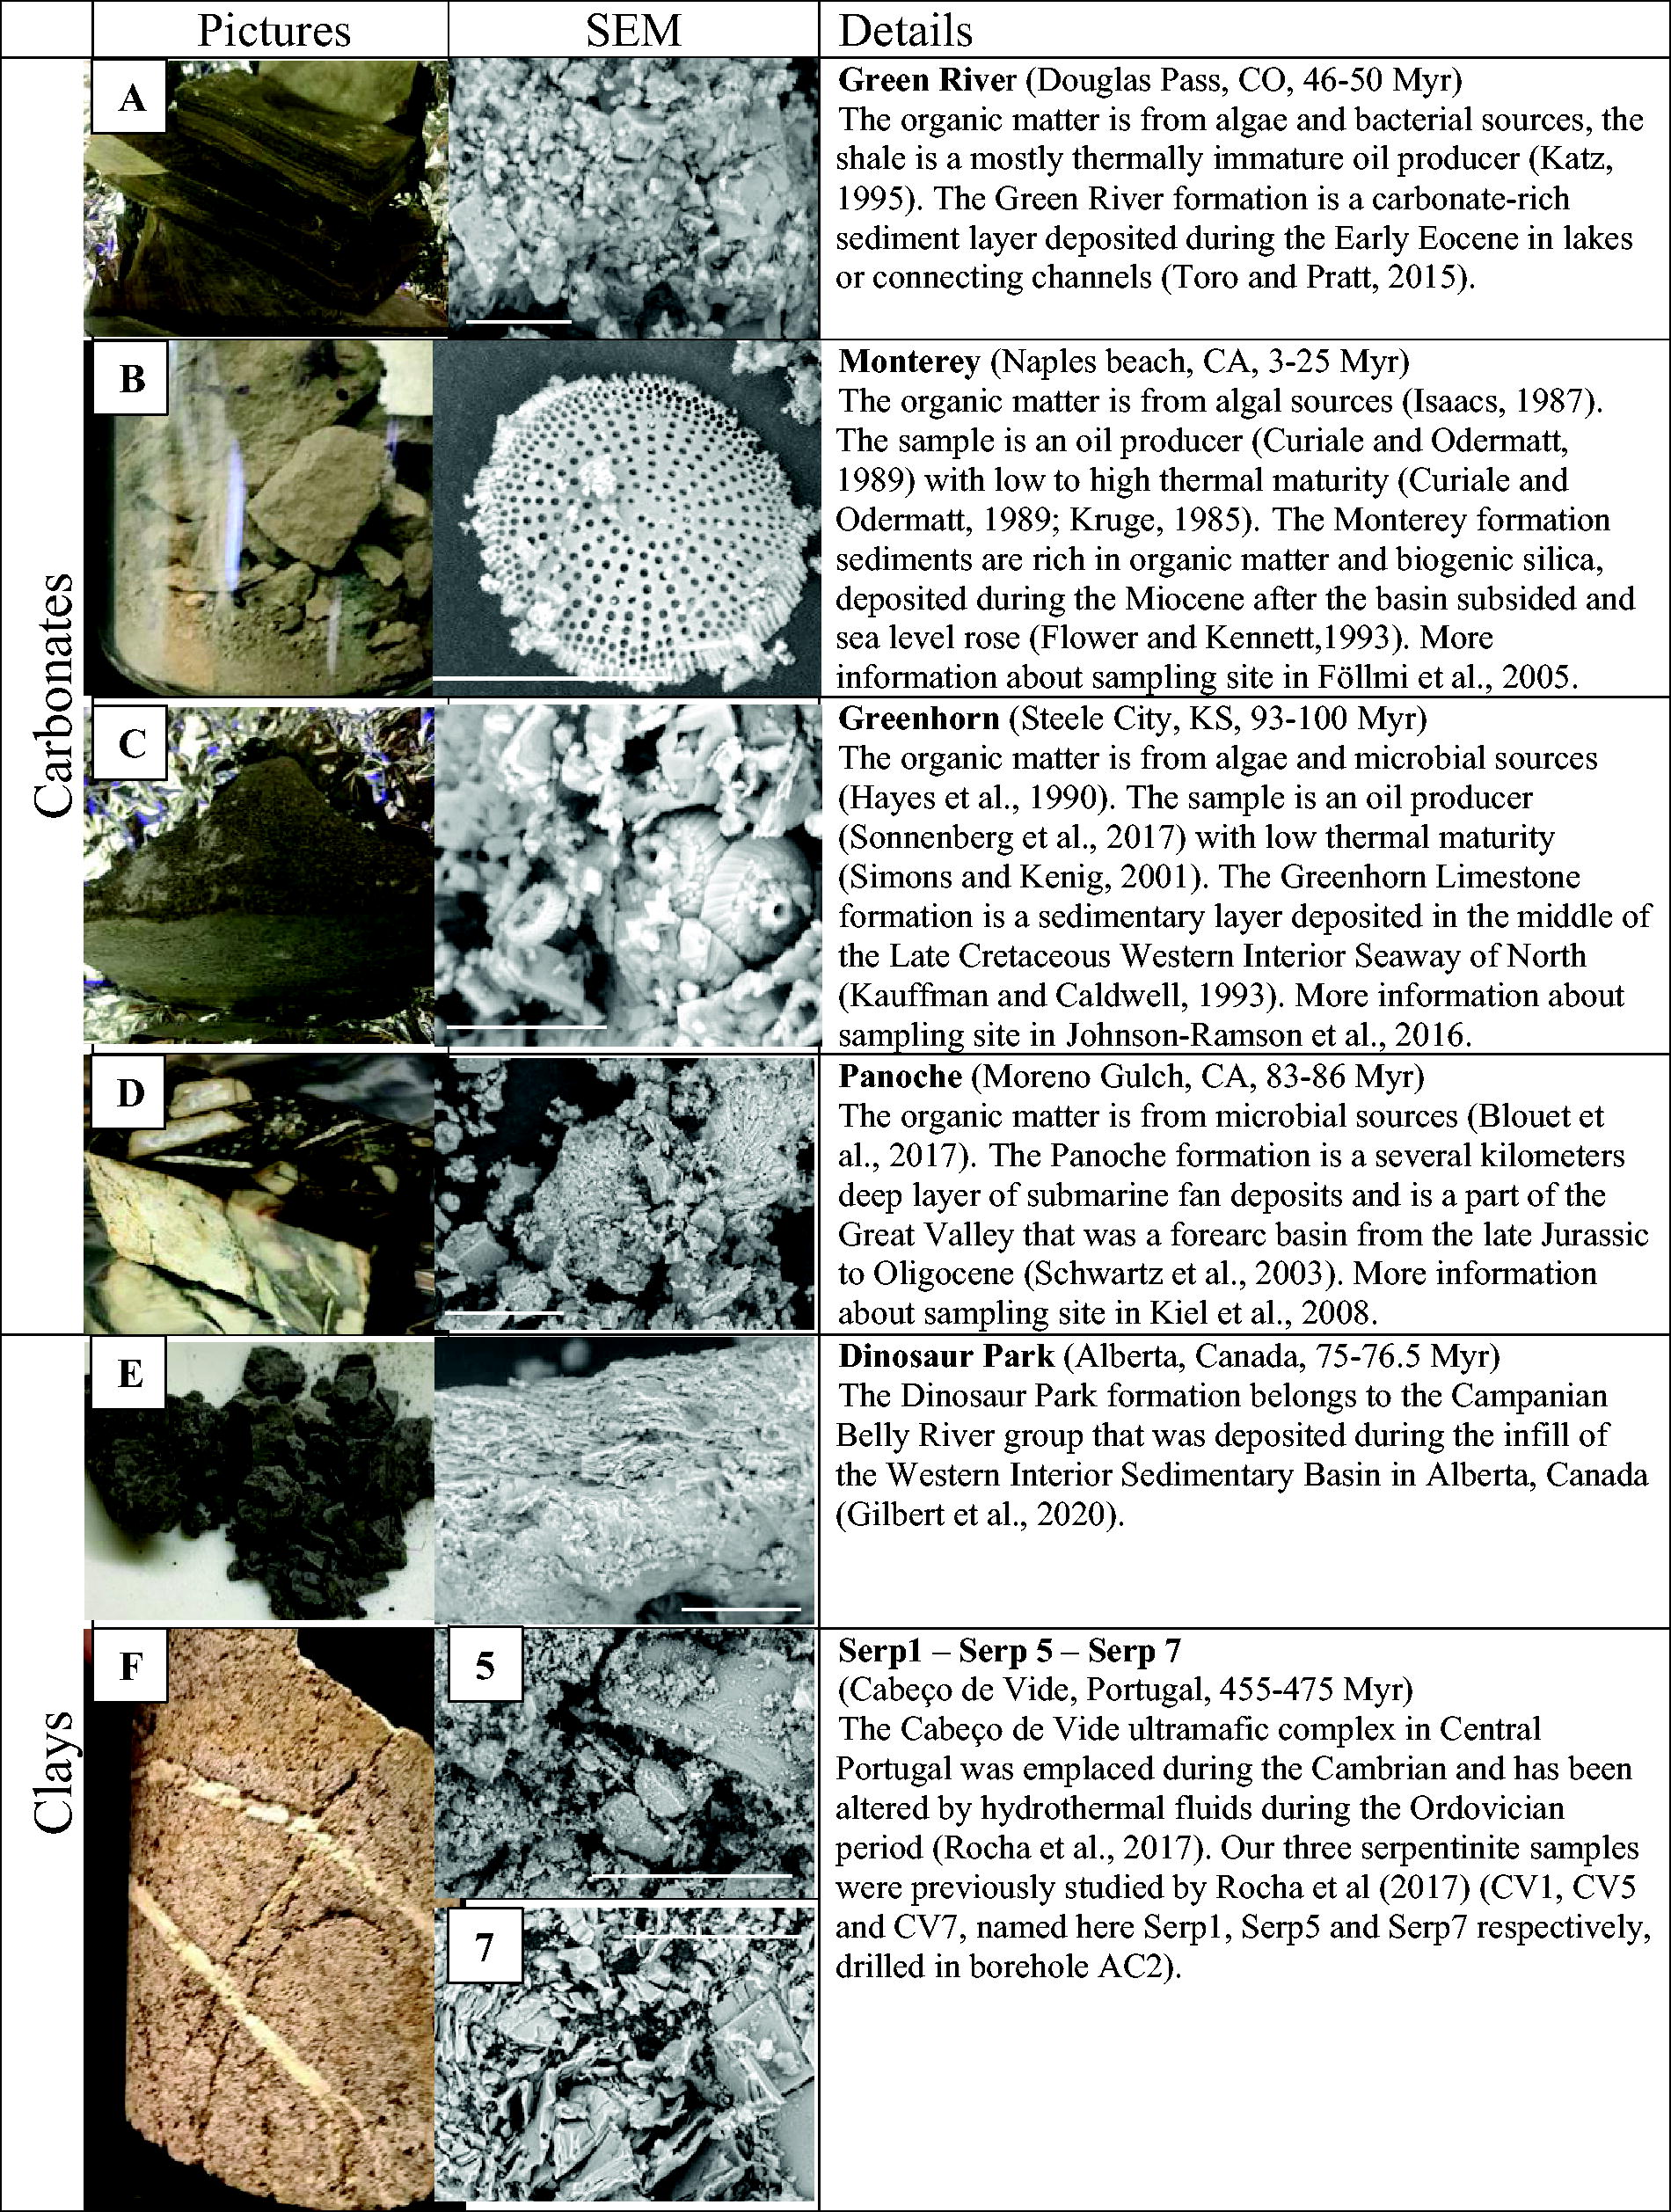
The samples are listed and described in Table 1. These samples are not exact Martian analogs—they have different deposition and sedimentary histories—but are used here to study radiolytic processes analogous to Mars in sedimentary samples dominated by clay and carbonate mineralogies. Both of these mineralogies were detected orbitally and in situ on Mars by the Chemistry and Mineralogy (CheMin) instrument aboard the Curiosity rover in Gale crater (Vaniman et al., 2014; Bristow et al., 2018; Thorpe et al., 2022; Tutolo et al., 2023) and by the SuperCam instrument aboard the Perseverance rover in Jezero crater (Royer et al., 2022; Clavé et al., 2023).
Sample Set Description (Picture, SEM Images, Age, Location, and Details). (A) Green River, (B) Monterey, (C) Greenhorn, (D) Panoche (E) Dinosaur Park (F) Cabeço de Vide. The SEM Images Scales Are: 10 µm for Green River and Greenhorn, 20 µm for Dinosaur Park, and 30 µm for All Other Samples. Detailed Mineralogies Are Listed in Table 2
Sample Set Description (Picture, SEM Images, Age, Location, and Details). (A) Green River, (B) Monterey, (C) Greenhorn, (D) Panoche (E) Dinosaur Park (F) Cabeço de Vide. The SEM Images Scales Are: 10 µm for Green River and Greenhorn, 20 µm for Dinosaur Park, and 30 µm for All Other Samples. Detailed Mineralogies Are Listed in Table 2
Mineralogy Results from XRD Analyses, Listed from High to Low Abundances. The Relative Proportion of Minerals and Clay Fractions (in %) for the Three Serpentinites Were Adapted from Rocha et al., 2017)
XRD, X-ray diffraction. Magn-Magh, Manetite-Maghemite
All tools and materials that came into contact with the samples were organically cleaned (heated at 500°C for 24 h or solvent cleaned for materials that could not be heated). Samples were powdered by using an aluminum mortar and pestle with a nonsmearing motion to avoid turbostratic disorder in clay-rich samples and then sieved (400 µm) for homogenization of the organic matter.
The powders were then packed in 13 mm (outer diameter) borosilicate tubes and blocked at the bottom with quartz wool. The sample densities in the tubes ranged from ∼1 to ∼2 g/cm3 (Monterey ∼1 g/cm3; Greenhorn, Dinosaur Park, Serp1 and Serp7 ∼1.5 g/cm3; Green River, Panoche, Serp5 ∼2 g/cm3). Each sample was irradiated in triplicate to account for natural variation (represented by the error bars in the Figs. and standard deviations in the Tables) as well as variation in irradiation dose. Lastly, the tubes were dynamically pumped until they reached ∼30 mTorr to remove air in the headspace and approximately equally degas each sample. The tubes were then flame sealed under vacuum to avoid the production of additional reactive oxidants under radiation. The samples were irradiated in the NASA Goddard Space Flight Center (GSFC) Radiation Effects Facility with 1 MeV gamma radiation from a 60 Co source up to a dose of 0.9 MGy with a rate of 37.4 Gy/min. We tested the variation of the total dose received by the samples by using standard sand to achieve 0.9 MGy (detailed in Supplementary Material). The sample’s temperature was monitored during the radiation exposure and never exceeded 30°C. Irradiating at room temperature would accelerate rates of biomarkers degradation compared with ambient Martian conditions (Pavlov et al., 2022); however, some aspects of our set-up might lead to less intense degradation than would be expected on Mars in 15 Myr. First, the Martian samples have likely received much higher rates of GCR exposure (e.g., more than 0.9 MGy). Second, the vacuum atmosphere during irradiation is presumably less deleterious than the thin CO2 Martian atmosphere that can react and form additional radicals that will damage the organics.
XRD mineralogy analyses
To determine the bulk mineralogy of our sample set (with the exception of the three serpentinite samples), we acquired X-ray diffraction (XRD) patterns from random powder mounts using a Bruker D8 Discover diffractometer at NASA GSFC. Patterns were acquired from 2 to 70°2θ, at 0.01°/step and at least 2 sec/step. For all mineralogical analyses, the samples were crushed and sieved to <53 µm. The three serpentinite sample mineralogies were acquired in a previous study (details in Rocha et al., 2017) by XRD analysis as well.
Brunauer–Emmett–Teller (BET) surface area measurement
To calculate the surface area of our powdered samples, we acquired a BET isotherm using a Quantachrome Nova 2200e at NASA GSFC. 500 mg of each sample were loaded in the instrument and degassed under vacuum overnight at room temperature. During the measurement, the samples were exposed to nitrogen gas at different ratios of the saturation pressure P0, while being kept at liquid nitrogen temperatures. Five data points in the pressure range of 0.05 < P/P0 < 0.35 were collected and used to determine the specific surface area (in m2/g).
Water content measurement
To estimate the amount of adsorbed and loosely bound water in the powders, we measured the difference between initial weight and dry weight. Approximately 15 mg of each powder was dried at 150°C for 48 h, and the samples were weighed before and after to estimate the amount of water present in weight %.
EA-IRMS TOC and bulk stable C isotopes
To measure the concentration of TOC and its bulk stable C isotope composition, we analyzed the samples by combustion in an elemental analyzer (Carlo Erba NC 2500) interfaced to a ConfloIII to a Delta V Plus Isotope Ratio Mass Spectrometer (IRMS) at the Earth and Planets Laboratory at the Carnegie Institution for Science (Foustoukos et al., 2021). Freeze-dried powders were first treated with 10% HCl solution to dissolve inorganic carbon (carbonates), and then they were rinsed abundantly with milipure water to remove any acid residue. During this preparation, some organic carbon could have been lost in the acid phase, which might have led to an underestimation of the TOC concentration and an error in the C isotopes ratios (Roberts et al., 1973). However, in the present study, our interest was in relative values of TOC and bulk stable isotopes as we compare them between unirradiated and irradiated samples. Because we are not aiming for absolute values, this caveat is not a concern for our discussion.
For the elemental and isotopic C analyses, samples were weighted into Sn capsules. Blank measurements in every analytical run always included Sn capsules. To account for natural variation, each sample was analyzed in triplicate (corresponding to the three irradiated tubes per sample), and to monitor the accuracy of the instrument measurements, we regularly analyzed acetanilide as a standard (C8H9NO) with an δ13C composition of −33.3 ‰. This in-house standard has been calibrated against international standard gases and solids of known isotopic composition (Oztech Trading Company, Isoanalytical Laboratory, National Bureau of Standards-22, IAEA-60, Standard Mean Ocean Water). The replicate samples were analyzed sequentially to check for sample heterogeneity. The reported uncertainties for the elemental and isotopic analyses correspond to the highest 1σ deviations, which is determined based on either replicate analyses of standards or analyses of at least two aliquots of individual samples, whichever is the larger. For bulk stable C isotopes, the internal uncertainty was 1.4 ‰. The detection limit for C elemental analysis is 0.01 wt. % (Foustoukos et al., 2024).
After checking the hypotheses of normality and equality of variances, we used a two-sample Student t test to compare %TOC and δ13C ratio before and after radiation. The decrease was considered significant if the t test p-value < 0.06.
Solvent extraction
To extract the biomarkers from the powdered sediments, we used organic solvent extraction. Depending on TOC content, between 1 and 5 g of powder were extracted using a MARS6 microwave digestion system with 30 mL of dichloromethane and methanol (9:1 by volume) at 100°C for 15 min. The solvent was then filtered on a glass vacuum column with two 1.1 µm glass filters to remove all sediment powder. Potential elemental sulfur was removed using acid-activated copper pellets overnight at −20°C. The solvent extracts were dried under ultra-high purity (UHP) N2 in a RapidVap Dry Evaporator at 30°C. ∼10 mL of hexanes was added to each dry total extract to resuspend the apolar fraction, which was then filtered on 1.1 µm glass filters to remove potential remaining debris. In this study, we worked with the resulting apolar fraction to focus on the hydrocarbon biomarkers. Each sample was irradiated in triplicate and extracted separately.
GC–MS-FID biomarkers identification and quantification
The biomarkers were identified by using a gas chromatography—mass spectrometry (GC–MS) and quantified with a flame ionization detector (FID). The samples were manually injected in a split/splitless injector at 300°C, with a splitless glass liner in splitless mode for 1 min. The carrier gas was helium, which flowed at 1.2 mL/min into a 60 m Rxi-5ms capillary column (0.25 mm ID, 0.25 µm). The oven was heated from 40°C (hold 2 min) to 200°C at 20°C/min, then to 320°C at 1.5C/min (hold 20 min) to have optimal separation of hopane and sterane isomers. The end of the column splits into two deactivated columns (∼1:1 split ratio). The first one (150 µm × 0.363 mm × 240 cm) leads to the MS with the transfer line and source held, respectively, at 300°C and 250°C and the electron energy at 70 eV. The second deactivated column (170 µm × 0.363 mm × 60 cm) leads to the FID held at 330°C and with air, H2, and N2, respectively, at 350, 35, and 40 mL/min. All samples were injected along with an internal standard (10 ng of D-5-a-cholestane; Sigma-Aldrich, St. Louis, MO, USA) for precise quantification. Analytical and instrumental blanks were performed regularly during analyses, and no contamination of our target molecules was observed.
Every sample was irradiated, solvent extracted, and analyzed in triplicate to take into account natural variation (the error bars in Fig. 2 represent the standard deviation between the three replicates). To test whether a concentration of biomarker was significantly changed or not after radiation, we used a two-sample Student t test after checking the hypotheses of normality and equality of variances. The t test is robust to violation of normality, and if the equality of variances was violated, we ran a t test for unequal variances. The decrease is considered significant if the t test p-value < 0.07.
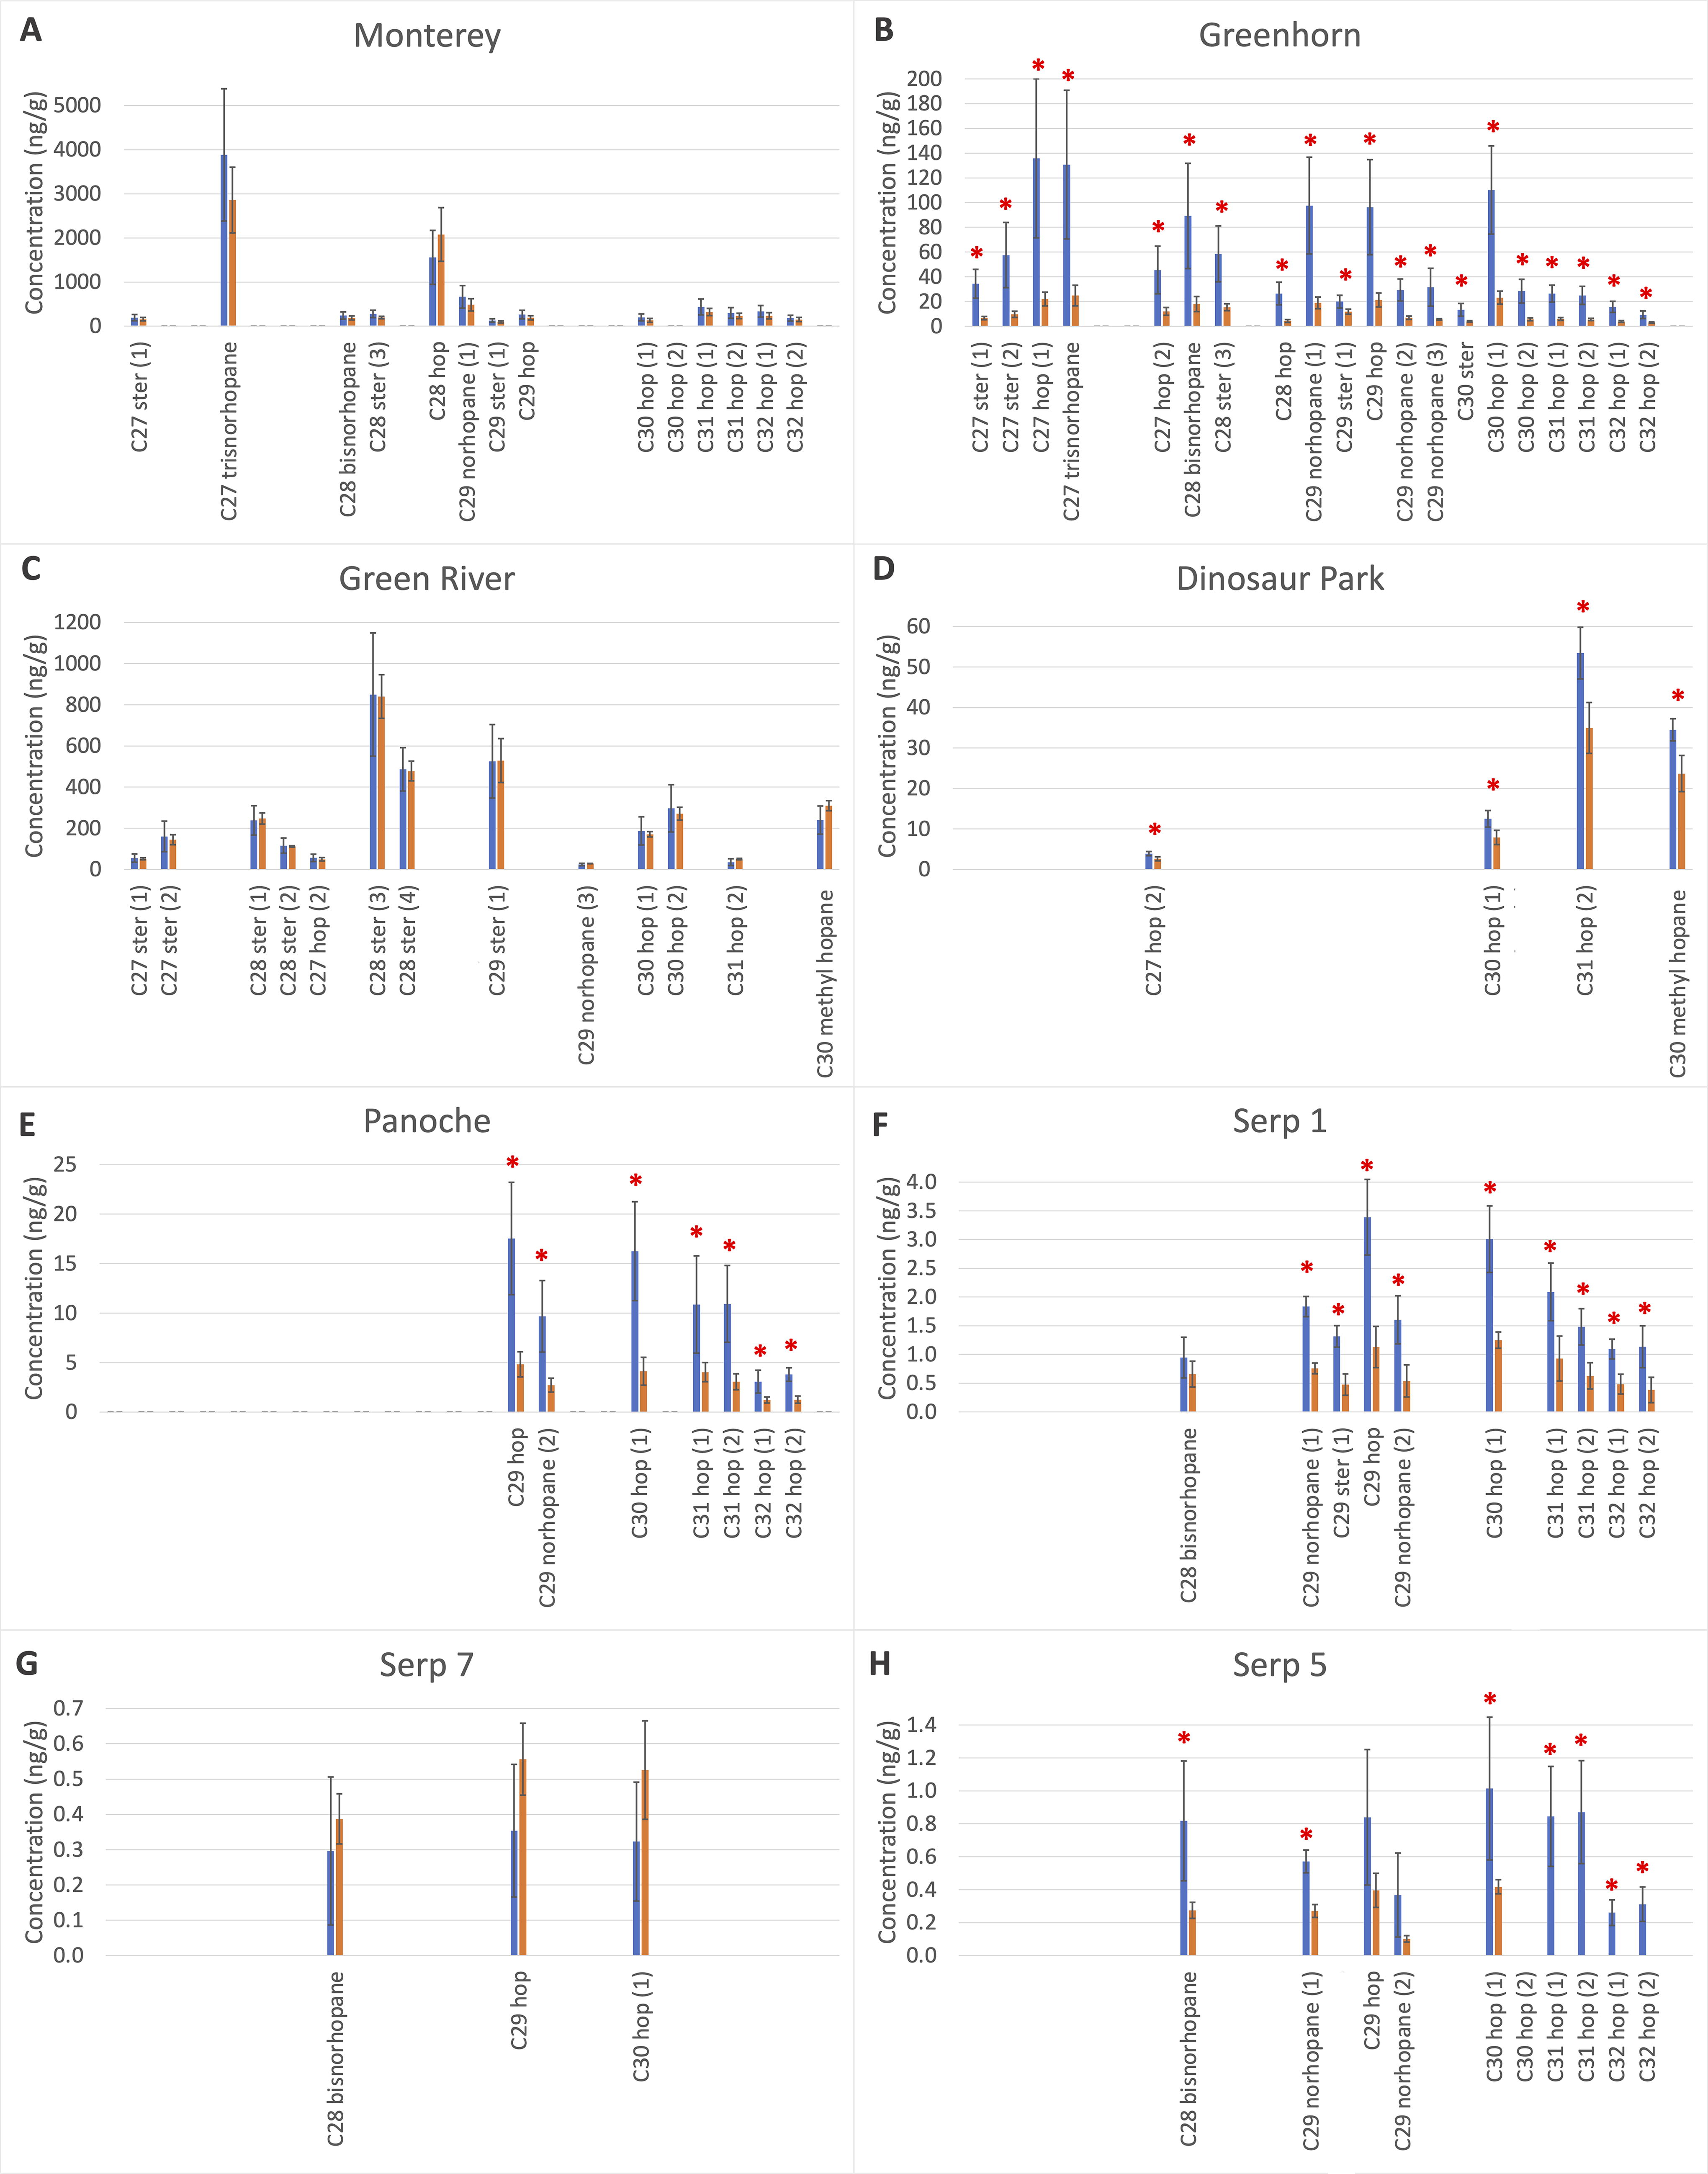
Histogram concentrations in ng/g sample before (blue) and after (orange) radiation of samples ordered in decreasing initial TOC concentrations
Lastly, to detect preferential preservation of certain biomarkers across samples, we used a one-sample t test and compared ratios of biomarkers. There was no significant preferential preservation if t test p-value > 0.04.
Mineralogy, surface area, and water content
The samples we analyzed fall into two dominant mineralogies, as described in Table 2 (XRD patterns in Supplementary Fig. S1). The carbonate-rich sediments were (1) the Green River Formation (Fm.) sample containing mostly dolomite and K feldspar, plus some calcite and quartz, (2) the Monterey Fm. sample with mostly fluorapatite and calcite, as well as some plagioclase and quartz, (3) the Greenhorn Fm. sample and (4) the Panoche Fm. sample, both largely dominated by calcite. We note that both Monterey Fm. and Green River Fm. also had some minor smectite phases (montmorillonite). The clay-rich sediments are the Dinosaur Park Fm. containing smectite (montmorillonite), and the three samples from Cabeço de Vide containing serpentine. To study preservation variation across a finer scale, we also compared the three serpentine-rich samples that were collected within the same core, only tens of meters from one another: two of them contained chlorite (Serp5 and Serp7), and all three had varying compositions of lizardite, antigorite, amphibole, magnetite-maghemite, and calcite (Rocha et al., 2017).
The sample surface areas and water contents are listed in Table 3. We can organize the samples in three groups by surface areas: (1) around 1 m2/g for Green River, Panoche, and Greenhorn, (2) around 6 m2/g for Monterey and the three Serp samples, and (3) more than 20 m2/g for Dinosaur Park because of its larger smectite content. As expected, the adsorbed water content was higher for the Dinosaur Park Fm. sample, as the interlayer of the clay minerals (smectite) and zeolite can trap water. Monterey Fm., Serp1, and Serp5 had around 5 wt. % water, and all the remaining samples had a water content around 3 wt. %. As surface area and adsorbed water were measured only once, we do not have standard deviation for these measurements. Nevertheless, variation can be noted among the samples in Table 3.
Surface Areas (in m2/g) Measured with BET Analyses, and Water Content by wt. %
Surface Areas (in m2/g) Measured with BET Analyses, and Water Content by wt. %
BET, Brunauer–E.mmett–Teller.
We can divide the initial TOC concentration (%TOC) of our samples into (1) high %TOC (>15%) for Greenhorn Fm. and Monterey Fm., (2) low %TOC (<10%) for Dinosaur Park Fm., Panoche Fm., and Green River Fm., and (3) very low %TOC (<1%) for the three serpentinites (all listed in Table 4). These lowest %TOC values are comparable with the organic carbon amounts measured by the Curiosity rover in a Yellowknife Bay mudstone of Gale crater that were between 0.2 and 0.9 wt. % (Stern et al., 2022). Except for Serp5 and Serp7, none of the samples presented a significant decrease (t test p-value > 0.06) in %TOC after irradiation within natural variation (Table 4). The standard deviation of these measures represents the natural variation between the three replicates. The %TOC of Serp5 and Serp7 after radiation was under the limit of detection (0.01 wt. %), so we could not assess the p-value and the significance of this change; however, trace biomarkers were still detected (see Section 3.3).
TOC Concentration in wt. % and Bulk Stable C Isotope Ratios (δ13C) from EA-IRMS of Control and Irradiated Samples. The Uncertainty Represents the Natural Variation Between Three Replicates. Except Serp 5 and Serp 7, No Samples Presented a Significant Change after Irradiation (t test p-value > 0.06). The TOC Concentrations for Serp 5 and Serp 7 Were under the Limit of Detection (0.01 wt. %, Foustoukos et al., 2024) after Irradiation so the δ13C Ratio Could not Be Measured (n/a)
TOC Concentration in wt. % and Bulk Stable C Isotope Ratios (δ13C) from EA-IRMS of Control and Irradiated Samples. The Uncertainty Represents the Natural Variation Between Three Replicates. Except Serp 5 and Serp 7, No Samples Presented a Significant Change after Irradiation (t test p-value > 0.06). The TOC Concentrations for Serp 5 and Serp 7 Were under the Limit of Detection (0.01 wt. %, Foustoukos et al., 2024) after Irradiation so the δ13C Ratio Could not Be Measured (n/a)
TOC, total organic carbon; Fm., Formation.
The bulk stable C isotopes were all depleted in heavy 13C (between ∼ −24.4‰ and ∼ −29.7‰, using acetanilide as a standard (C8H9NO) with an δ13C composition of −33.3 ‰), which indicates a biotic source of carbon, as expected for these organic-rich samples. Isotope values did not significantly change after irradiation (except for the two serpentinites Serp5 and Serp7, where the values were under the limit of detection).
Although the %TOC was not significantly affected by radiation in any samples except for Serp5 and Serp7, the concentration of specific chemical biosignatures was significantly reduced in most samples after exposure to gamma rays (Fig. 2). We identified (including isomers) eight steranes (C27 to C30), ten hopanes (C27 to C32), five nor-hopanes (C27 to C29 hopanes missing a methyl group), and one C30 methyl hopane (hopane bearing an extra methyl group). These are listed in Table 5, and their structures appear in Supplementary Figure S2. Concentrations ranged from less than 1 ng/g sample (e.g., the three serpentinite samples) to a few dozen ng/g sample (e.g., Dinosaur Park Fm. and Panoche Fm. samples), to up to several hundred ng/g sample (e.g., Green River Fm., Greenhorn Fm., and Monterey Fm.). The error bars on the Figure 2 histograms represent the natural variation between the three replicates for each sample. Even though the samples were powdered, sieved, and mixed, the heterogenous distribution or the organic matter in the samples could not be completely avoided and resulted in relatively large error bars (see replicates details in Supplementary Fig. S3).
Remaining Fractions of Biomarkers, Organized from Low (Left) to High (Right) Degradation. A Value of 1.0 Represents No Significant Change Before and After Radiation (t test p-value > 0.07, All p-Values Listed in Supplementary Table S1), and the Values Are the Average of the Three Irradiated Values Normalized by the Average of the Three Control Values. The Sum of Steranes and Hopanes per Sample (Excluding nor Hopanes and Methyl Hopanes) Are Listed at the Bottom of the Table. The Values Are the Sum of Irradiated Concentrations Normalized by the Sum of Concentrations in the Controls. The Numbers in Parenthesis Identify the Isomers (in Order of Elution)
Remaining Fractions of Biomarkers, Organized from Low (Left) to High (Right) Degradation. A Value of 1.0 Represents No Significant Change Before and After Radiation (t test p-value > 0.07, All p-Values Listed in Supplementary Table S1), and the Values Are the Average of the Three Irradiated Values Normalized by the Average of the Three Control Values. The Sum of Steranes and Hopanes per Sample (Excluding nor Hopanes and Methyl Hopanes) Are Listed at the Bottom of the Table. The Values Are the Sum of Irradiated Concentrations Normalized by the Sum of Concentrations in the Controls. The Numbers in Parenthesis Identify the Isomers (in Order of Elution)
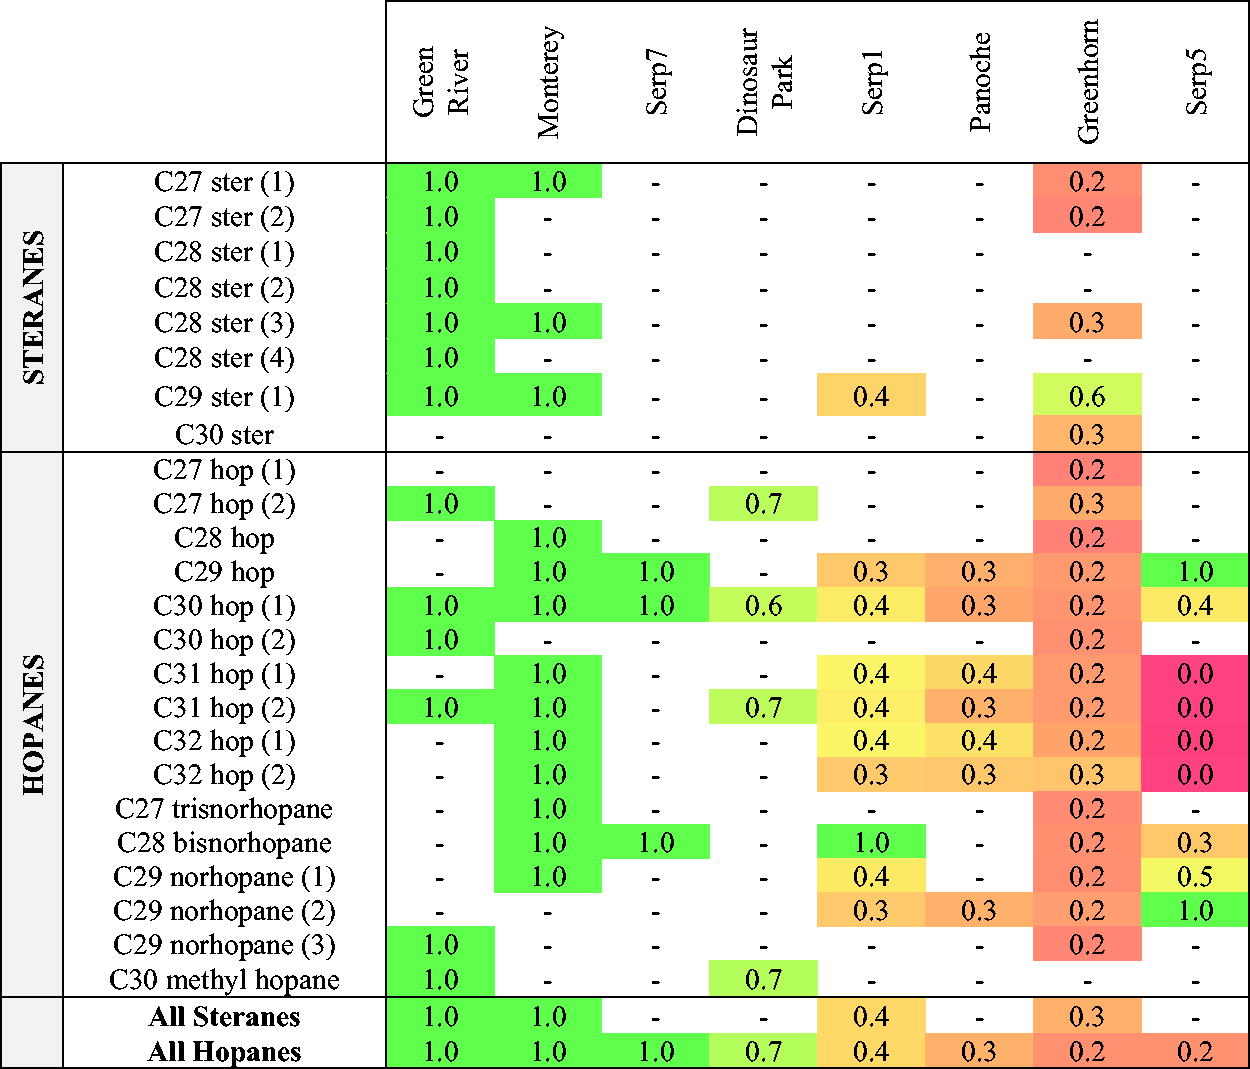
We observed a substantial range of biomarker loss across our sample set. For example, after irradiation, the Green River Fm., Monterey Fm., and Serp7 biomarker concentrations did not significantly decrease within natural variation (t test p-value > 0.07) (Fig. 2A, C, G). All five other samples, however, showed a significant decrease (t test p-value < 0.07) in compound concentration after irradiation (see Fig. 2B, D, E, F, H). All t test p-values of concentration comparison before and after radiation are listed in Supplementary Table S1. To compare the loss of biomarkers across our sample set, we calculated the remaining fraction after radiation (mean concentration after irradiation divided by mean concentration before irradiation). Results are presented in Table 5. From best to least preserving under gamma radiation, we have: Green River, Monterey, and Serp7 (100%), Dinosaur Park (60–70% preservation), Serp1 and Panoche (30–40% preservation), Greenhorn (most compounds showed only 20% preservation), and Serp5 (which fully lost several compounds but had varying preservation for others). We note that Serp5 and Serp7 starting concentrations were already close to the limit of detection.
We compared the degradation of the same organic compounds across our sample set to search for preferential degradation of certain structures. We compared hopanes and steranes of varying sizes, including four steranes (C27 to C30) and six hopanes (C27 to C32). We investigated the impact of an extra or missing methyl group by comparing hopane C30 degradation to a metylhopane (extra methyl group) and several norhopanes (missing methyl groups). Lastly, we compared degradation between two isomers of Sterane C27 and two isomers of Hopane C27 to C32. Overall, we did not identify preferential preservation of any structures across the samples. All compared chemical structures are presented in Figure 3, all histograms are in Supplementary Figure S4, the one sample t test results in Supplementary Table S2, and numerical results in Supplementary Table S3.
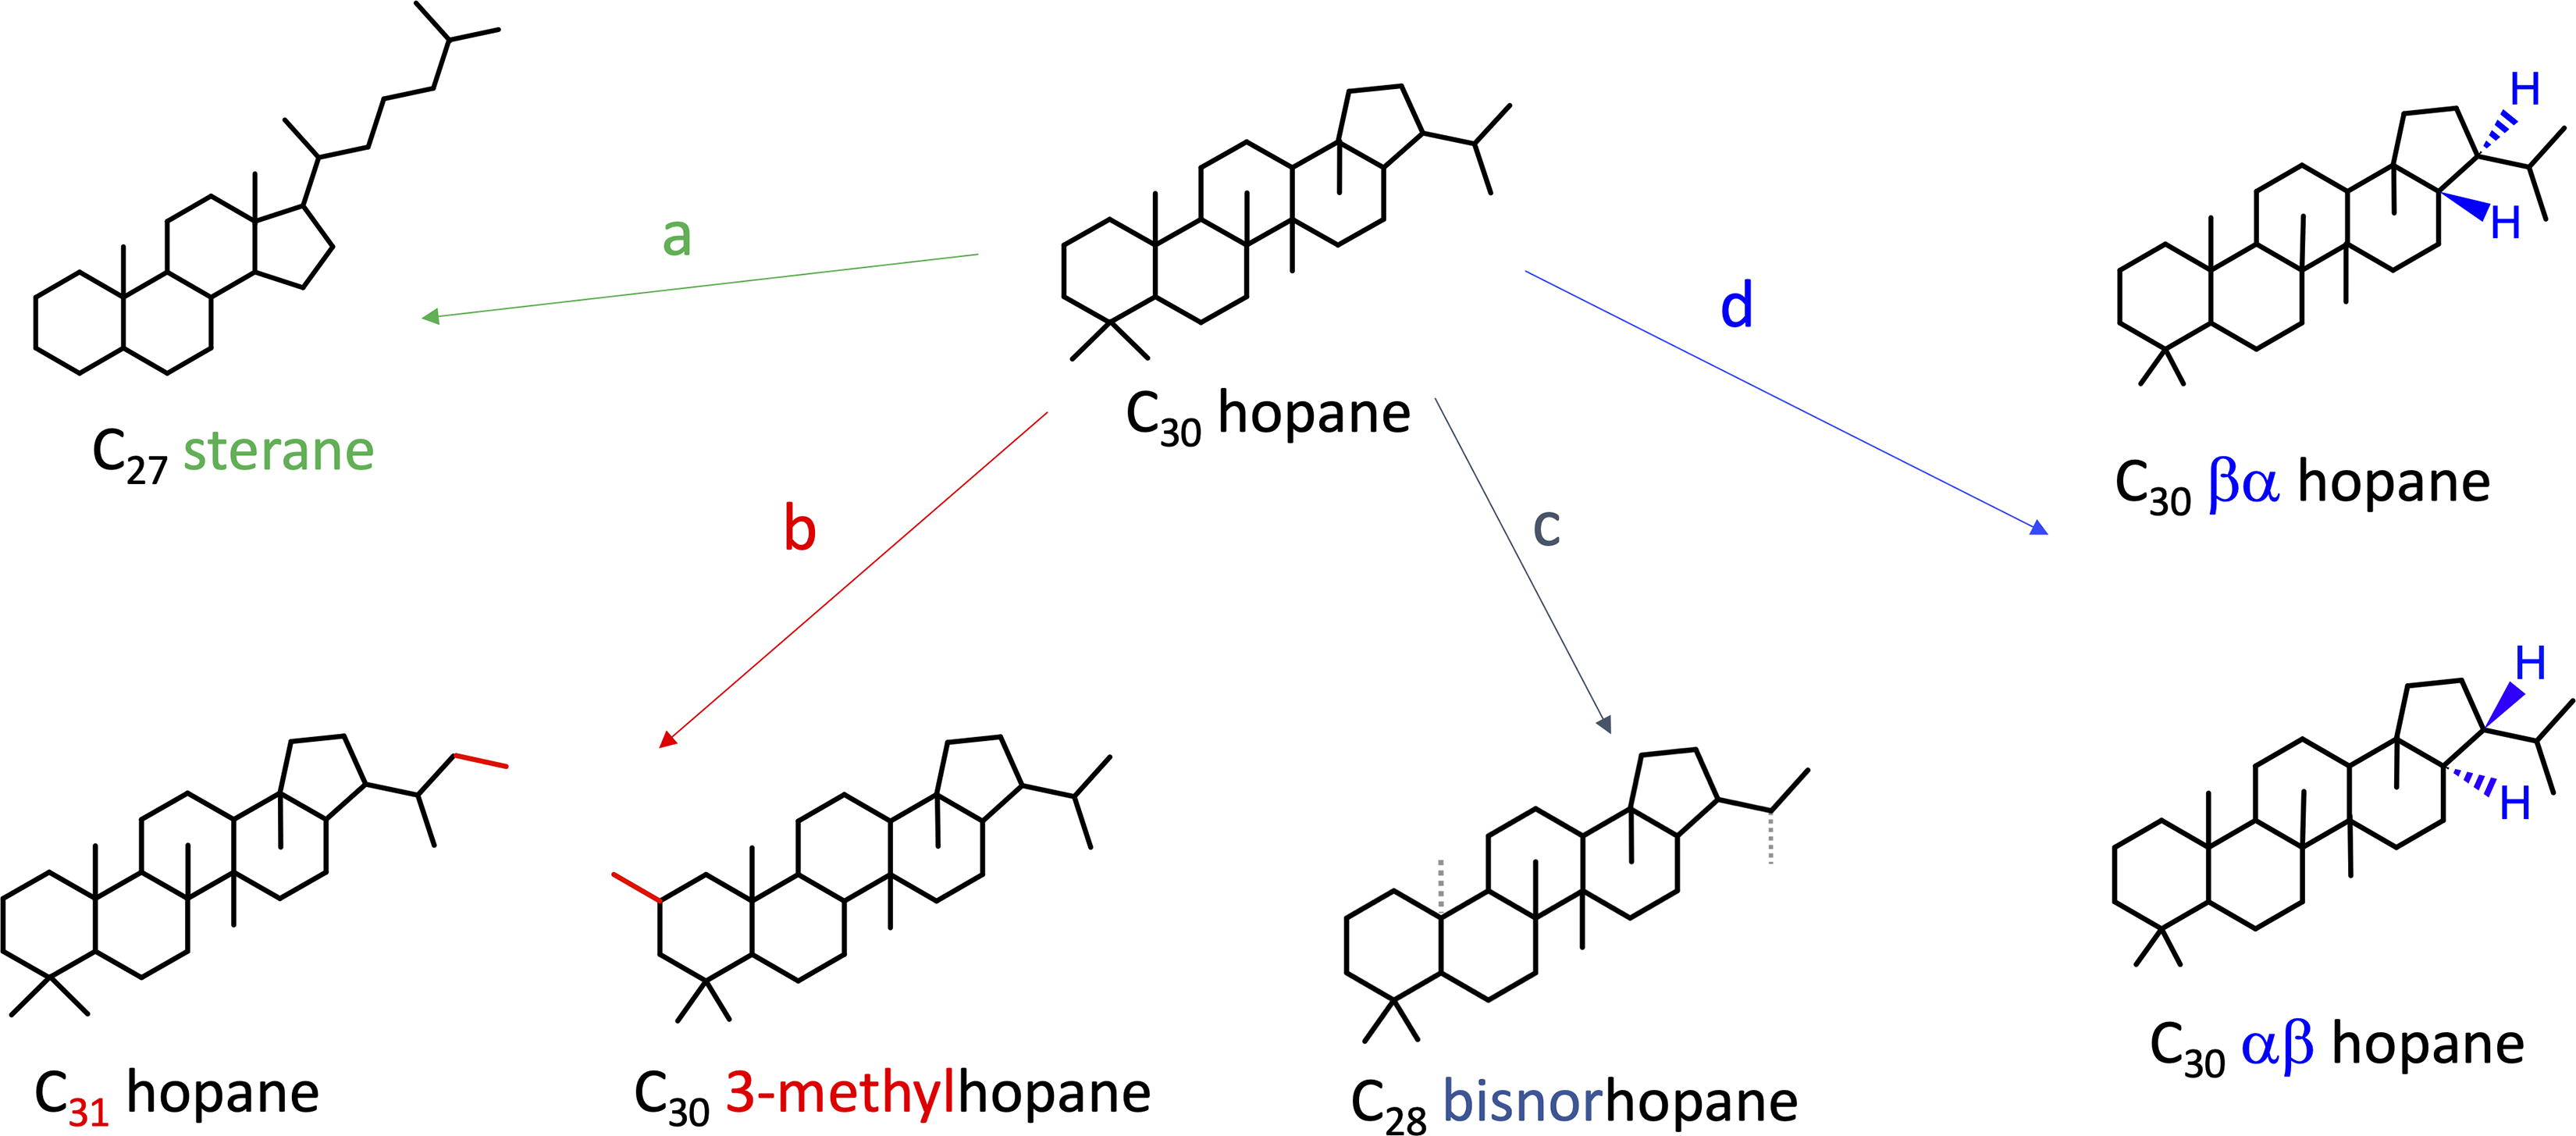
Type of structural differences we investigated in regard of preferential preservation. Each arrow represents a type of comparison, from left to right: (a, green) hopanes and steranes (with different numbers of rings and methyl groups), (b, red) additional (methyl hopanes) or (c, gray) missing methyl groups (norhopanes), and (d, blue) isomer conformations (all identified structures are in Supplementary Fig. S2).
Proxies for ionizing radiation exposure
Previous measures of stable carbon isotope ratios in samples naturally irradiated by uranium indicate significant changes after irradiation. Both bitumens (Court et al., 2005) and kerogens (Dahl et al., 1988) presented an enrichment of heavy 13C after a longer exposure (i.e., a higher uranium concentration), explained by the easier formation of isotopically light gases. In addition, Dahl et al. (1988) exposed a shale to electron radiation up to 10 MGy and observed a similar enrichment. However, a study that exposed bitumens and kerogens up to 8 MGy of gamma radiation observed no significant change in TOC concentration or isotopic composition (Lewan et al., 1991). This different result could be because of the nature of radiation, which varies from gamma rays to electron radiation to uranium radiation (composed of alpha particles, beta particles, and gamma rays).
Our findings concur with previous gamma ray results, including the Lewan et al., (1991) study and our previous study (Roussel et al., 2022): for most samples, 0.9 MGy of gamma radiation doesn’t affect the %TOC or bulk stable C isotope ratio within natural variation. However, the %TOC of Serp5 and Serp7 that were initially comparable to in situ measurements on Mars (∼0.1 wt. %, Stern et al., 2022) dropped below limit of detection after irradiation (0.01 wt. %, Foustoukos et al., 2024). Rojas Vivas et al. (2021) irradiated low TOC Atacama soil samples and measured a slower % TOC degradation than our results. After exposure to 0.9 MGy, the % TOC decreased in Serp5 and Serp7 more than 10 times (0.1 wt. %, to below 0.01 wt. %), while it decreased by approximately a factor of two in the Atacama soil samples (Rojas Vivas et al., 2021).
For the rest of our samples, our results indicate that, at our dose and for samples with initial %TOC > ∼0.1 wt. %, the %TOC and bulk stable C isotope ratio cannot be used as a proxy for ionizing radiation exposure. As we worked with natural samples, we have a large natural variation in biosignatures (large error bars between our triplicates) that might hide some fine variations in bulk stable C isotope ratios or isomer concentrations. In future work, these questions could be resolved more precisely by using irradiated standards (to avoid large natural variation) or with a higher dose of gamma rays, increasing the damage because of radiation.
We were also interested in whether potential preferential preservation of certain biomarkers or structural characteristics might arise across our sample set, specifically characteristics we could use to aid in target selection on Mars. These preferential preservations could potentially be used as tracers for a specific degradation. For example, ratios of biomarkers with different resistance to heat can inform on thermal maturity, and the Ts-Tm ratio measures the relative abundances of the thermally stable Ts (C27 18-α trisnorhopane) and the less stable Tm (C27 17-α trisnorhopane) (Peters et al., 2005). We compared several structures across our sample set, but none of them were significantly preferentially preserved (one-sample t test p-value >0.04, all histograms in Supplementary Fig. S4, and all ratios, samples, and p-values in Supplementary Table S2). The comparison of hopanes and steranes served to determine whether the extra ring of the hopane structure could make it more stable against radiation degradation. We compared steranes and hopanes with different C numbers (increasing methyl chain) and hopanes with extra or missing methyl groups (methylhopanes and norhopanes) to assess whether the heavier molecules would degrade faster (as it has been shown for amino acids, Kminek and Bada, 2006). At the finest scale, we compared different isomers of both hopanes and steranes to investigate whether a different spatial configuration could impact the degradation rate of a molecule (for instance, wider molecules could be more susceptible to breakage under radiation because of their larger surface areas). Again, no preferential preservation was observed for any of these tests in all our samples, even though our samples had different mineralogies, organic carbon sources, and thermal maturities, and some are known oil producers (e.g., Green River, Greenhorn, Monterey, see Table 1).
Similarly, given that we observed numerous fossil microstructures during SEM imaging of the control samples (Monterey and Greenhorn), we looked for analogous structures in irradiated samples. After a qualitative analysis, there also appeared to be no evident morphological changes of the microstructures after up to 0.9 MGy of irradiation (Supplementary Fig. S5).
Preservation of chemical biosignatures
Our sample set presented a large range of preservation, and to better understand what makes an optimal sample for preservation, we assembled in Table 6 the main parameters that might affect the loss of biomarkers under gamma radiation.
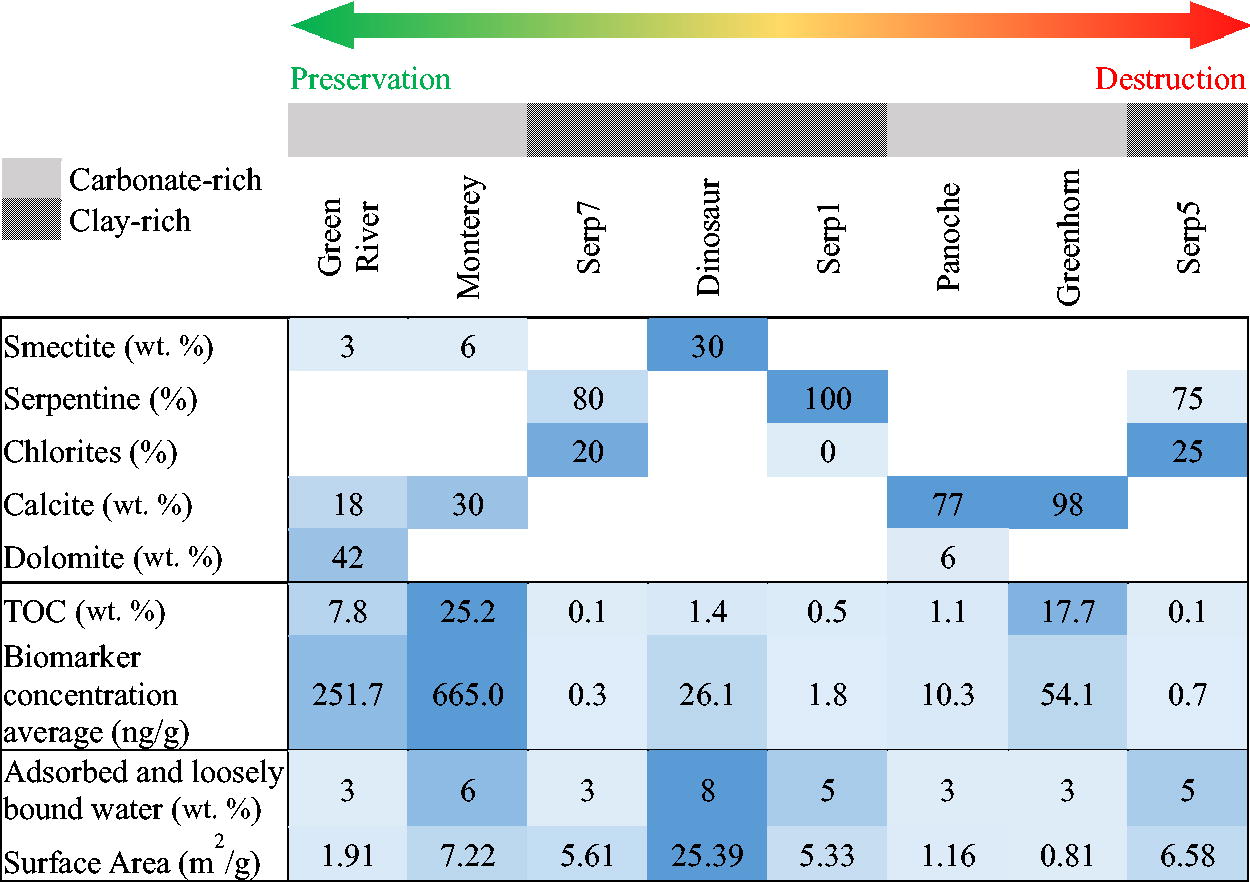
Summary of All Parameters Analyzed in Our Sample Set, Organized From Left to Right by Best to Worst Preservation (See Table 5, All Hopanes and All Steranes). (1) Upper Panel: Sample Carbonate and Clay Dominant Mineralogy (see Table 4 for All Mineralogy Data), (2) Middle Panel: %TOC and Biomarker Concentration Control Average, and (3) Lower Panel: Surface Area and Water Content. The Values Are Color Coded for Each Parameter in a Range of Blue, with Darker Tones for Higher Values
Summary of All Parameters Analyzed in Our Sample Set, Organized From Left to Right by Best to Worst Preservation (See Table 5, All Hopanes and All Steranes). (1) Upper Panel: Sample Carbonate and Clay Dominant Mineralogy (see Table 4 for All Mineralogy Data), (2) Middle Panel: %TOC and Biomarker Concentration Control Average, and (3) Lower Panel: Surface Area and Water Content. The Values Are Color Coded for Each Parameter in a Range of Blue, with Darker Tones for Higher Values
Mineralogy was one major focus of this investigation, as it has been observed to impact preservation under radiation. Several studies showed that a mineral matrix has a protective effect under gamma radiation compared with irradiating biomolecules by themselves (Baqué et al., 2018; Ertem et al., 2021). More research has been conducted under UV radiation and has shown the clear preservation effect of clay- and sulfate-rich mineralogies (Poch et al., 2015; Dos Santos et al., 2016; Fornaro et al., 2018). Here, we investigated for the first time the impact of mineralogy on the preservation of hopanes and steranes in natural samples exposed to gamma radiation. We compared not only carbonates and clay minerals but also smaller mineralogical differences within each category. For example, in the four carbonate-rich samples, two had detrital mineralogies with traces of smectite (Green River Fm. and Monterey Fm.). And within the four clay-dominated samples, Dinosaur Park had around 30% smectite, and the three serpentinites had subtle variations in serpentine proportions. We did not observe a clear preferential preservation for a single mineralogy. Yet the large losses we saw among some samples (between 50 and 80% loss of biomarkers in Greenhorn, Panoche, Serp1, and Serp5) cautions against underestimating the role of irradiation on Mars.
Both the Green River and Monterey samples presented no significant destruction of biomarkers despite their abundance in adsorbed water and large surface areas. Under ionizing radiation, the water contained in samples forms strong oxidizing radicals (Dartnell, 2011; Pavlov et al., 2022) that can further destroy the organics. And a higher surface area would similarly increase the destruction. We hypothesize that this total preservation is because of Green River and Monterey’s very high %TOC; it has indeed been suggested that a higher initial %TOC will lead to a lower degradation by ionizing radiation (Pavlov et al., 2022) because abundant reduced organic carbon can react with radiolytically produced oxidative radicals and thus preclude fast destruction of the organic biomarkers. Another characteristic shared by these two samples is their trace amounts of smectite minerals (discussed later in this section), which may help trap and protect organics.
Interestingly, the Greenhorn sample had a similarly high %TOC, a lower water content, and surface area similar to Green River and Monterey, but presented an unexpected and dramatic destruction of biomarkers (70–80% biomarkers destroyed), challenging our current way of understanding degradation in organic-rich samples. In a previous study (Roussel et al., 2022), we compared radiolytic constants from several experiments (Kminek and Bada, 2006; Pavlov et al., 2022) to show that, in high %TOC samples, we expect at most a 10% loss of the molecule concentrations at 0.9 MGy. The limit of this comparison is that these radiolitic constants were measured for amino acids, which are very chemically different from our lipid biomarkers. To get a more relevant radiolitic constant for our organics, we used the correlation between radiolitic constant and molecular weight from the work of Kminek and Bada (2006) and extrapolated it to 400 Da and obtained a radiolitic constant of 0.6 MGy−1, which predicts a loss of 40% of the molecule concentration at 0.9 MGy. Here, the Greenhorn sample shows a degradation two times more intense compared with the extrapolated prediction.
We hypothesize that traces of gypsum in Greenhorn (approximately 0.5 wt. %) might be responsible for this destruction. The structural water contained in the gypsum would not be part of the measured adsorbed water content and could have ionized and formed oxidative radicals under radiation (mechanisms in Dartnell, 2011) that further destroyed the hopanes and steranes. However, as the gypsum concentration is in trace amounts in this sample, there are certainly other parameters that accelerate the destruction of our biomarkers, and thus future research is needed to identify them. Allen et al. (1999) exposed gypsum to ∼1 MeV gamma radiation up 0.3 MGy and did not detect any change in the XRD pattern, that is, no development of an anhydrite peak, which suggests no loss of structural water at this dose. But our total dose, having been three times higher than theirs, we cannot completely rule out this hypothesis. Sulfate minerals, and specifically hydrated calcium sulfates such as gypsum, have been commonly detected by the Curiosity rover (e.g., Nachon et al., 2014; Rampe et al., 2020), and future work is called for on whether gypsum, even in trace amounts, can have such a drastic impact on biomarkers preservation under radiation. The final carbonate-dominated sample, Panoche, showed a similar destruction to Greenhorn, without containing gypsum or other salts; however, its %TOC was one of the lowest, which partially could explain these results. Lastly, both of these poorly preserving carbonate samples did not contain any smectite minerals (contrary to Green River and Monterey). As we hypothesized that the traces of smectite minerals participated in making Green River and Monterey better preserving samples than Panoche and Greenhorn, we assumed that the Dinosaur Park sample would be best preserved because of its higher smectite mineralogy. In contrast, Dinosaur Park presented an important decrease (40% loss), probably because of the high amount of water (8 wt. %) present in any residual adsorbed water, water trapped in the smectite interlayer and in the zeolite, and to its largest surface area. We note that this amount of water is comparable with levels detected in clay mineral-rich regions on Mars such as Mawrth Vallis and Nili Fossae (approximately 7–9 wt. %, Wernicke and Jakosky, 2021).
The Serp1 and Serp5 samples also presented an important loss of biomarkers, which might be explained by their lowest %TOC, similar to the values measured at Gale crater (Stern et al., 2022). Serp5 presents the highest degradation, potentially because of a slightly higher amount of chlorites and iron oxides (magnetite-maghemite, see Table 2) that may have produced reactive oxidants under ionizing radiation. However, Serp7, which was mineralogically very similar to the other serpentine-rich samples, showed no significant decrease, possibly because of its lower amount of water (3 wt. % instead of 5 wt. %). But this last result should be taken cautiously as Serp7 shows large errors bars in Figure 2 as its biomarker concentrations are close to our limit of detection (even if the data seem to suggest an increase in concentration, the variation is not statistically significant [p-value > 0.07]).
Overall, only samples with >7%TOC or at detection limits (and thus less reliable for interpretation) showed negligible losses in biomarker concentration. One exception is the Greenhorn sample that presented significant biomarker loss despite the high initial %TOC. It is not clear what the mechanism is for this loss. Strong differences are apparent at a large scale among carbonate and clay mineral-dominated samples (Green River vs Dinosaur Park), at a medium scale among different carbonate-rich samples (Green River vs Greenhorn), and also at our finest scale among serpentinite-rich samples extremely close in mineralogy, formed by the same process at the same location (Serp7 vs Serp5). This shows the difficulty in defining high preservation sampling sites for the rover missions and, once again, pushes for a sampling strategy that takes into account exposure to GCRs. Interestingly, the relatively low radiation dose of 0.9 MGy we used in this study is close to the accumulated dose in samples located 2 m under the surface of the Gale crater Sheepbed Mudstone (Farley et al., 2014) (Fig. 4). This indicates that, even with the deeper drilling capacities onboard ESA’s Rosalind Franklin rover, such damage could be observed if the radiation exposure is of a similar magnitude. In addition, more research on preservation under radiation is needed, for example, on the impact of water in smectite interlayer sites in samples with clay-rich mineralogies.
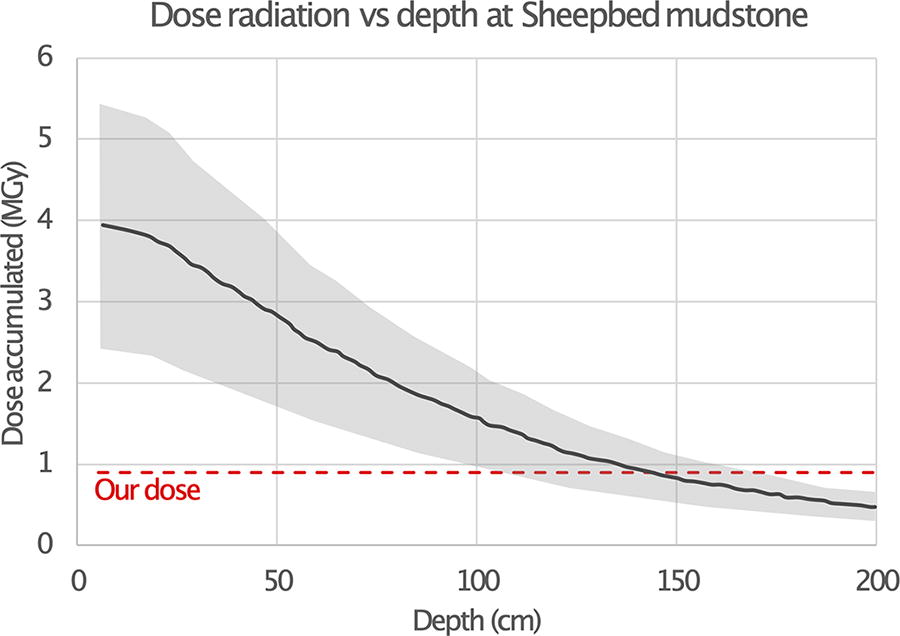
Dose of irradiation accumulated (MGy, Megagray) versus depth (cm) at Gale crater in the Sheepbed mudstone. The sample has been exposed to GCRs for 78 ± 30 Myr (Farley et al., 2014); estimation of GCR dose in depth profile by Pavlov et al., 2022 (Supplementary Fig. S6). The mean of the dose is represented by the full lines and the variations by the shaded areas. Our dose of 0.9 MGy is the red dashed line. GCR, galactic cosmic rays.
We investigated for the first time the fate of large diagnostic biosignatures (i.e., hopanes and steranes) when exposed to gamma radiation. Most previous research conducted with regard to biosignatures and gamma rays has focused on small organics such as amino acids (Kminek and Bada 2006; Pavlov et al., 2022) or synthetic powders (Kminek and Bada 2006; Baqué et al., 2018; Ertem et al., 2021; Pavlov et al., 2022) as opposed to the natural samples we used in our experiments.
We found no significant change in TOC and bulk stable C isotope ratios for samples with initial %TOC > 0.1 wt. %, probably because of our relatively low dose of radiation. However, the concentrations of hopanes and steranes showed a large range of loss (no change versus up to 80–100% loss) and could not be clearly correlated to one parameter, as several parameters probably interact together in such samples with complex mineralogies and organic compositions. The Monterey and Green River samples showed no significant loss of biomarkers after irradiation, probably because of their high %TOC. Interestingly, the Greenhorn sample, despite a similar high %TOC, showed a massive decrease in biomarkers, and we suggest that the presence of gypsum in trace amounts (0.5 wt. %) could potentially accelerate the degradation of organics under ionizing radiation, but further work is needed. Serp1, Serp5, and Panoche presented a higher loss, probably because of to their lower %TOC, similar to the %TOC measured at Gale crater. Here, another exception is Serp7, which showed no losses despite its low %TOC and proximity in sampling sites and mineralogies with Serp1 and Serp5. This could be because of the lower amount of water in Serp7 compared with the two others, but this result should be taken cautiously as the biomarker concentrations of Serp7 were close to our limit of detection. The Dinosaur Park sample presented pronounced losses, which might tie to its water content and its surface area, which is the highest of all the analog samples, but again, future work is needed. Finally, we did not identify any potential irradiation proxies (e.g., δ13C ratio, specific hopane or sterane, and morphological microfossils) that were preferentially preserved after up to 0.9 MGy of gamma radiation exposure.
Overall, we studied natural samples that contained molecular biosignatures considered to be the most resistant on Earth through geological timescales and exposed them to a dose of radiation that was much lower than the doses calculated by Curiosity at Gale crater. We observed an unpredictable and, in many cases, deleterious loss of molecular biosignatures. These results emphasize the importance of targeting samples on Mars that are protected from GCRs. The rover missions could aim for (1) deeper samples (like ESA’s Rosalind Franklin and its 2 m deep drill), (2) geologically young sampling sites where it is possible to measure the exposure duration of a sample (such as the measurements done by the Curiosity rover at Gale crater (Farley et al., 2014)), and (3) recently exposed materials after meteoritic impact (Daubar et al., 2019), beneath a wind scarp (Kite and Mayer, 2017; Williams et al., 2020) or under a large (meter scale) boulder displacement (Vijayan et al., 2022).
Footnotes
Acknowledgments
The authors are very grateful to all the following for sharing samples: Adrian Broz (Monterey, Green River, Greenhorn), Fernando Rocha (three serpentinites), and Russel S. Shapiro (Panoche). The authors thank Martin A. Carts and the Radiation Facility, as well as Frank T. Fergusson for his help with the BET analyses.
Authors’ Contributions
A.R. conceptualized the study, designed the experiments, and completed all GC-MS-FID analyses and molecular identification. D.I.F. completed EA-IRMS analyses. A.C.M, C.A.K., and C.N.A completed the XRD analyses. S.A. and D.M.B. assisted with sample selection, collection, and preparation. J.P.D. flame sealed the glass tubes under vacuum. A.C.M and A.A.P. assisted with data interpretation. S.S.J. supervised the study. A.R. wrote the original draft and all co-authors participated in reviewing and editing the article.
Data Availability Statement
All the data for this study have been deposited in FigShare repositories. They are available at https://figshare.com/s/b8827a518eeec809f7e8 (GC-MS-FID), https://figshare.com/s/bd3c1348bb51c2484a42 (EA-IRMS), and ![]() (XRD).
(XRD).
Authors Disclosure Statement
The authors declare that the research was conducted in the absence of any commercial or financial relationships that could be construed as a potential conflict of interest.
Funding Information
A.R. and S.S.J. acknowledge support provided NASA award
Supplementary Material
Supplementary Figure S1
Supplementary Figure S2
Supplementary Figure S3
Supplementary Figure S4
Supplementary Figure S5
Supplementary Figure S6
Supplementary Figure S7
Supplementary Table S1
Supplementary Table S2
Supplementary Table S3
Supplementary Table S4
Abbreviations Used
Associate Editor: Jorge L. Vago
References
Supplementary Material
Please find the following supplemental material available below.
For Open Access articles published under a Creative Commons License, all supplemental material carries the same license as the article it is associated with.
For non-Open Access articles published, all supplemental material carries a non-exclusive license, and permission requests for re-use of supplemental material or any part of supplemental material shall be sent directly to the copyright owner as specified in the copyright notice associated with the article.