
Abstract
At a Mars analog site in Utah, we tested two science operation methods for data acquisition and decision-making protocols: a scenario where the tactical day is preplanned, but major adjustments may still be made before plan delivery; and a scenario in which the sol path must largely be planned before a given tactical planning day and very few adjustments to the plan may be made. The goal was to provide field-tested insight into operations planning for rover missions where science operations must facilitate the efficient choice of sampling locations at a site relevant to searching for habitability and biosignatures. Results of the test indicate that preplanning sol paths did not result in a sol cost savings nor did it improve science return or optimal biologically relevant sample collection. In addition because facies variations in an environment can be subtle and evident only at scales below orbital resolution, acquiring systematic observations is crucial. We also noted that while spectral data provided insight into the chemical components as a whole at this site, they did not provide a guide to targets for which the traverse should be altered. Finally, strategic science planning must include a special effort to account for terrain.
Introduction
Planetary exploration relies primarily on remote observation, and an increasing amount of data are being provided by in situ landers and mobile scientific platforms. One of the most challenging aspects of rover-based science operations is the need for science teams to balance maximizing scientific return and minimizing expenditure of resources, such as time, energy, and data volume. The most frequently used strategy of maximizing science return is one that rarely retreads previously covered ground, which can mean leaving a site before certain observations can be conducted or limiting the number or type of activities that can be achieved during any given planning period. The trade-offs involved in resource conservation and data collection can therefore lead to an either real or perceived limitation of the scientific understanding of a field area.
The nature of assessing the success and efficiency of operational choices, however, is difficult, and understanding the most resource-effective ways to conduct remote fieldwork for maximum science benefit represents a challenging, yet critical, dimension of planetary exploration.
Terrestrial rover analog tests provide one mechanism to address the effectiveness of science operations for remote research (e.g., Greeley et al., 1994; Whittaker et al., 1997; Arvidson et al., 2000; Stoker et al., 2001, 2002; Lee, 2007; Lee et al., 2017; Fong et al., 2010; Eppler et al., 2013; Graham et al., 2015; Lim et al., 2018; Osinski et al., 2019). These tests, however, often rely heavily on the successful operation of complex technical equipment. In such cases, equipment error or malfunction often negatively impacts scientific decision-making processes and thus impedes the study's ability to isolate science operations as a variable distinct from equipment function (Eppler et al., 2013; Cohen et al., 2015; Graham et al., 2015; Yingst et al., 2015).
By contrast, the GeoHeuristic Operational Strategies Testing (GHOST) program isolates the science operations' decision-making process by using commercial, off-the-shelf technology, minimizing variables related to rover and equipment function (Yingst et al., 2018, 2020). Previous GHOST field tests have focused on investigating the relative efficiency of executing all science activities on a single traverse, compared with using a reconnaissance pass—a method of traverse previously termed a “walkabout,” in which the remote instruments are used to assess the site, and then the site is traversed again, with the more resource-intensive instruments used on a subset of high-priority targets—before detailed contact science on a subset of high-value targets (Yingst et al., 2016, 2018, 2020).
Building from the results of previous experiments, we provide in the present study results of a test designed specifically to explore the effect of these two science operation strategies, given an overall scenario in which the number of planning periods and the ability to adjust the plan of observations are both highly constrained.
Methods
Understanding rover operations in the context of GHOST field tests
Conducting field geology with a remote, roving science platform requires the use of instrument-acquired data to make interpretations comparable with those made by a traditional field geologist. In such a scenario, available science data directly inform decisions about subsequent observations and activities to plan (i.e., what observations to make), not the method of acquiring those data (i.e., what tools to use). To test the science protocols without having malfunctioning equipment, communication failures, or other such adverse condition derail results, GHOST field tests use a “roverless roving” approach, where generalized commercial, off-the-shelf instruments provide visual, compositional, and geochemical data similar to flight-ready instruments (Yingst et al., 2014). In such a scenario, humans stand in for the rover itself but do not allow their geologic knowledge to inform data acquisition or interpretation, thus replicating the rover's inability to yield independent analysis or suggest appropriate follow-on observations.
GHOST field tests also utilize a highly compressed planning schedule. Rover science operations with high latency (i.e., an extended time between commanding and execution, as experienced in most planetary missions) require significant planning to best utilize limited resources. For Mars, this typically means that, in a single tactical planning shift, scientists will plan activities for 1 to 4 martian days (or “sols”), then send that entire package up to the rover to be executed while subsequent sols are being planned. Limits to time, power, data volume, and other mission resources also change from sol to sol, requiring any test of science operation efficiency to estimate what science observations and enabling rover activities fit into a given planning cycle. GHOST tests use the Mars Science Laboratory (MSL) mission (Vasavada et al., 2014) as a baseline, leveraging multiple years of MSL science operation to estimate the duration and power costs of commonly executed activities. This estimate also encompasses data downlink, or the data available to the teams for planning subsequent sols; for simplicity of execution, it is generously assumed that all data acquired on one sol can be downlinked for availability to the teams planning the next sol. It is important to note that the sol cost utilized in this study is based on the unique payload of the Curiosity rover, which differs from that of the earlier Mars Exploration Rover (MER) missions (Arvidson et al., 2000; Squyres et al., 2003; Bass et al., 2005) and the Mars 2020 Perseverance rover mission (Milkovich et al., 2022).
In particular, the number and type of activities that Mars 2020 (currently operating as of this writing) may fit into any given planning period may differ somewhat from what is assumed here.
Based on MSL averages, we baseline activities during a single sol as 1 h of active remote data acquisition, plus either a drive of 50–100 m or multiple contact science observations. The estimated sol cost for each activity is shown in Table 1. To calculate the total sols used for each activity, each rover action requested during the field test was recorded and converted to an estimated number of sols that would be required to execute that action on Mars. This allowed the GHOST field team to use limited field time to perform multiple planning sols.
Estimated Sol Cost for Each Rover Activity
Estimated Sol Cost for Each Rover Activity
PDI = postdrive imaging.
Commercial off-the-shelf instruments were chosen to mimic the general data format and resolution that have been common to Mars rovers (e.g., Black and Hynek, 2018). These instruments include those dedicated to both landscape and hand lens scale imaging, visible to near-infrared (VNIR) spectrometry, and mineralogical analysis. Commercial instrument details are outlined in Table 2.
Field and Analogous Mars Instrumentation
Field and Analogous Mars Instrumentation
DSLR = Digital Single-lens reflex; MSL = Mars Science Laboratory; VNIR = visible to near-infrared; XRD = X-ray diffraction; XRF = X-ray fluorescence.
We used a Canon Rebel XL digital single-lens reflex camera with a macrolens to provide the range of resolutions that might be covered by rover RGB cameras, including both mast-mounted and arm-mounted imagers. The field-portable VNIR spectrometer (Malvern Panalytical) provided rapid collection of hyperspectral data, resulting in whole-rock mineralogy including that of phyllosilicate, Fe-oxides/hydroxide, sulfate, and silica phases. Field spectra were analyzed using the Environment for Visualizing Images (ENVI) software from L3/Harris Geospatial Solutions. Mineral absorptions were manually matched to known library spectra using the USGS splib07 spectral library (Kokaly et al., 2017) and the Compact Reconnaissance Imaging Spectrometer for Mars (CRISM) Analysis Toolkit (CAT) spectral library available on the Planetary Data System Geosciences Node at
Powder X-ray diffraction (XRD; Olympus Terra) provided bulk mineralogy and was also used to calculate oxide abundances, comparable with data obtained by X-ray fluorescence (XRF). The field-portable XRD could identify sulfate, Fe-oxide/hydroxide, and silicate phases. XRD analyses used in this study were able to suggest the presence of phyllosilicate phases, but specific identifications were not made available to the field teams, as this would require additional sample processing that was not available to Mars rovers. Therefore, such identification of phyllosilicate phases was not provided to the field teams. Diffraction pattern matching was completed using XPowder software. Field samples were matched to known library patterns using the “difdata” library from the American Mineralogist Crystal Structure Database (Downs and Hall-Wallace, 2003). After determining the bulk mineralogy, quantitative mineral abundances were converted to elemental oxide percentages to simulate XRF data.
In this field investigation, we tested two distinct approaches to rover-based science operations and data acquisition under a constrained timeline. The first approach was “tactically responsive” and is comparable with that used by the MER and MSL missions. In this scenario, a notional plan is strategically developed a day or two in advance of a given tactical planning cycle and is based on the analysis of both orbital and in situ data. In a tactically responsive scenario, changes to the notional observations and activities are relatively easy to make as the most recent data are downlinked. The team can readily decide to adjust the sol path to remain in the area for analysis of additional targets or to conduct a short drive to a target deemed more suitable to strategic goals.
By comparison, a “strategically constrained” approach is designed to focus on strategic goals and is comparable with that used by the M2020 (Mars 2020) mission. In this scenario, goals for a given region of interest (ROI, or campaign) are determined strategically using primarily orbital data. In this scenario, a strategic campaign science group produces a sol-by-sol path of fixed length that includes a prioritized list of observations, potential targets for those observations, and specific goals for mission deliverables (such as samples to be acquired).
The primary goal of this scenario is to ensure that goals for both daily tactical planning (Wilson et al., 2017) and the overall mission timeline can be met. Such a strategically constrained approach allows the tactical team minimal opportunity to change the sol path, even if prechosen target regions do not meet strategic expectations. Changes to the sol path must be argued several sols in advance. Choosing to use additional sols in a deviation from the primary campaign would require subtracting sols and, thus, other observations from the future sol path.
Data acquisition and personnel
The primary goal of this field study was to compare “tactically responsive” and “strategically constrained” science operation protocols in terms of the ability to extract appropriate contextual data for a sampling mission with a highly constrained timeline, where the mission science goals are focused on identifying and characterizing biosignatures and habitability. The test was designed to track deviations from the plan and the resultant differences in science outcomes and determine the number of sols used by each method.
Both operational teams started with the same notional plan of observations and activities, based on orbital-scale data, and both explored four discrete ROIs in sequence. The “tactically responsive” team could adjust the time spent at each target, trade observations, or replace a strategically planned sample. By contrast, if the “strategically constrained” team were to exceed the preplanned sol allotment, the sols spent over that allotment and the science achieved in those extra sols would be considered a sol cost that would be subtracted from later activities.
Data acquisition teams were structured similarly to previous tests (Yingst et al., 2016, 2020). One individual served as the independent site expert, reconnoitering the site and providing remote data sets for the teams to use in mission planning. Each of the field teams comprised two experts, one self-identified expert in sedimentology and one self-identified expert in rover operation. Science teams approached the field site blind and conducted prefield strategic planning to define hypotheses and plan notional observations and activities through the four ROI sites using only data similar to what would be available for rover mission planning (i.e., orbitally derived visible and spectral data).
The science team was then divided into a two-person Tactical (tactically responsive) team and a two-person Strategic (strategically constrained) team to command the “rovers” along the planned traverse and interpret the returned data. Each science team independently conducted remote investigation of the field site through its specific human rover avatar. At the same time, an independent Tiger team examined the site using standard terrestrial geological field methods. The Tiger team provided a baseline of science results against which the rover-enabled teams could compare their findings.
Field Site
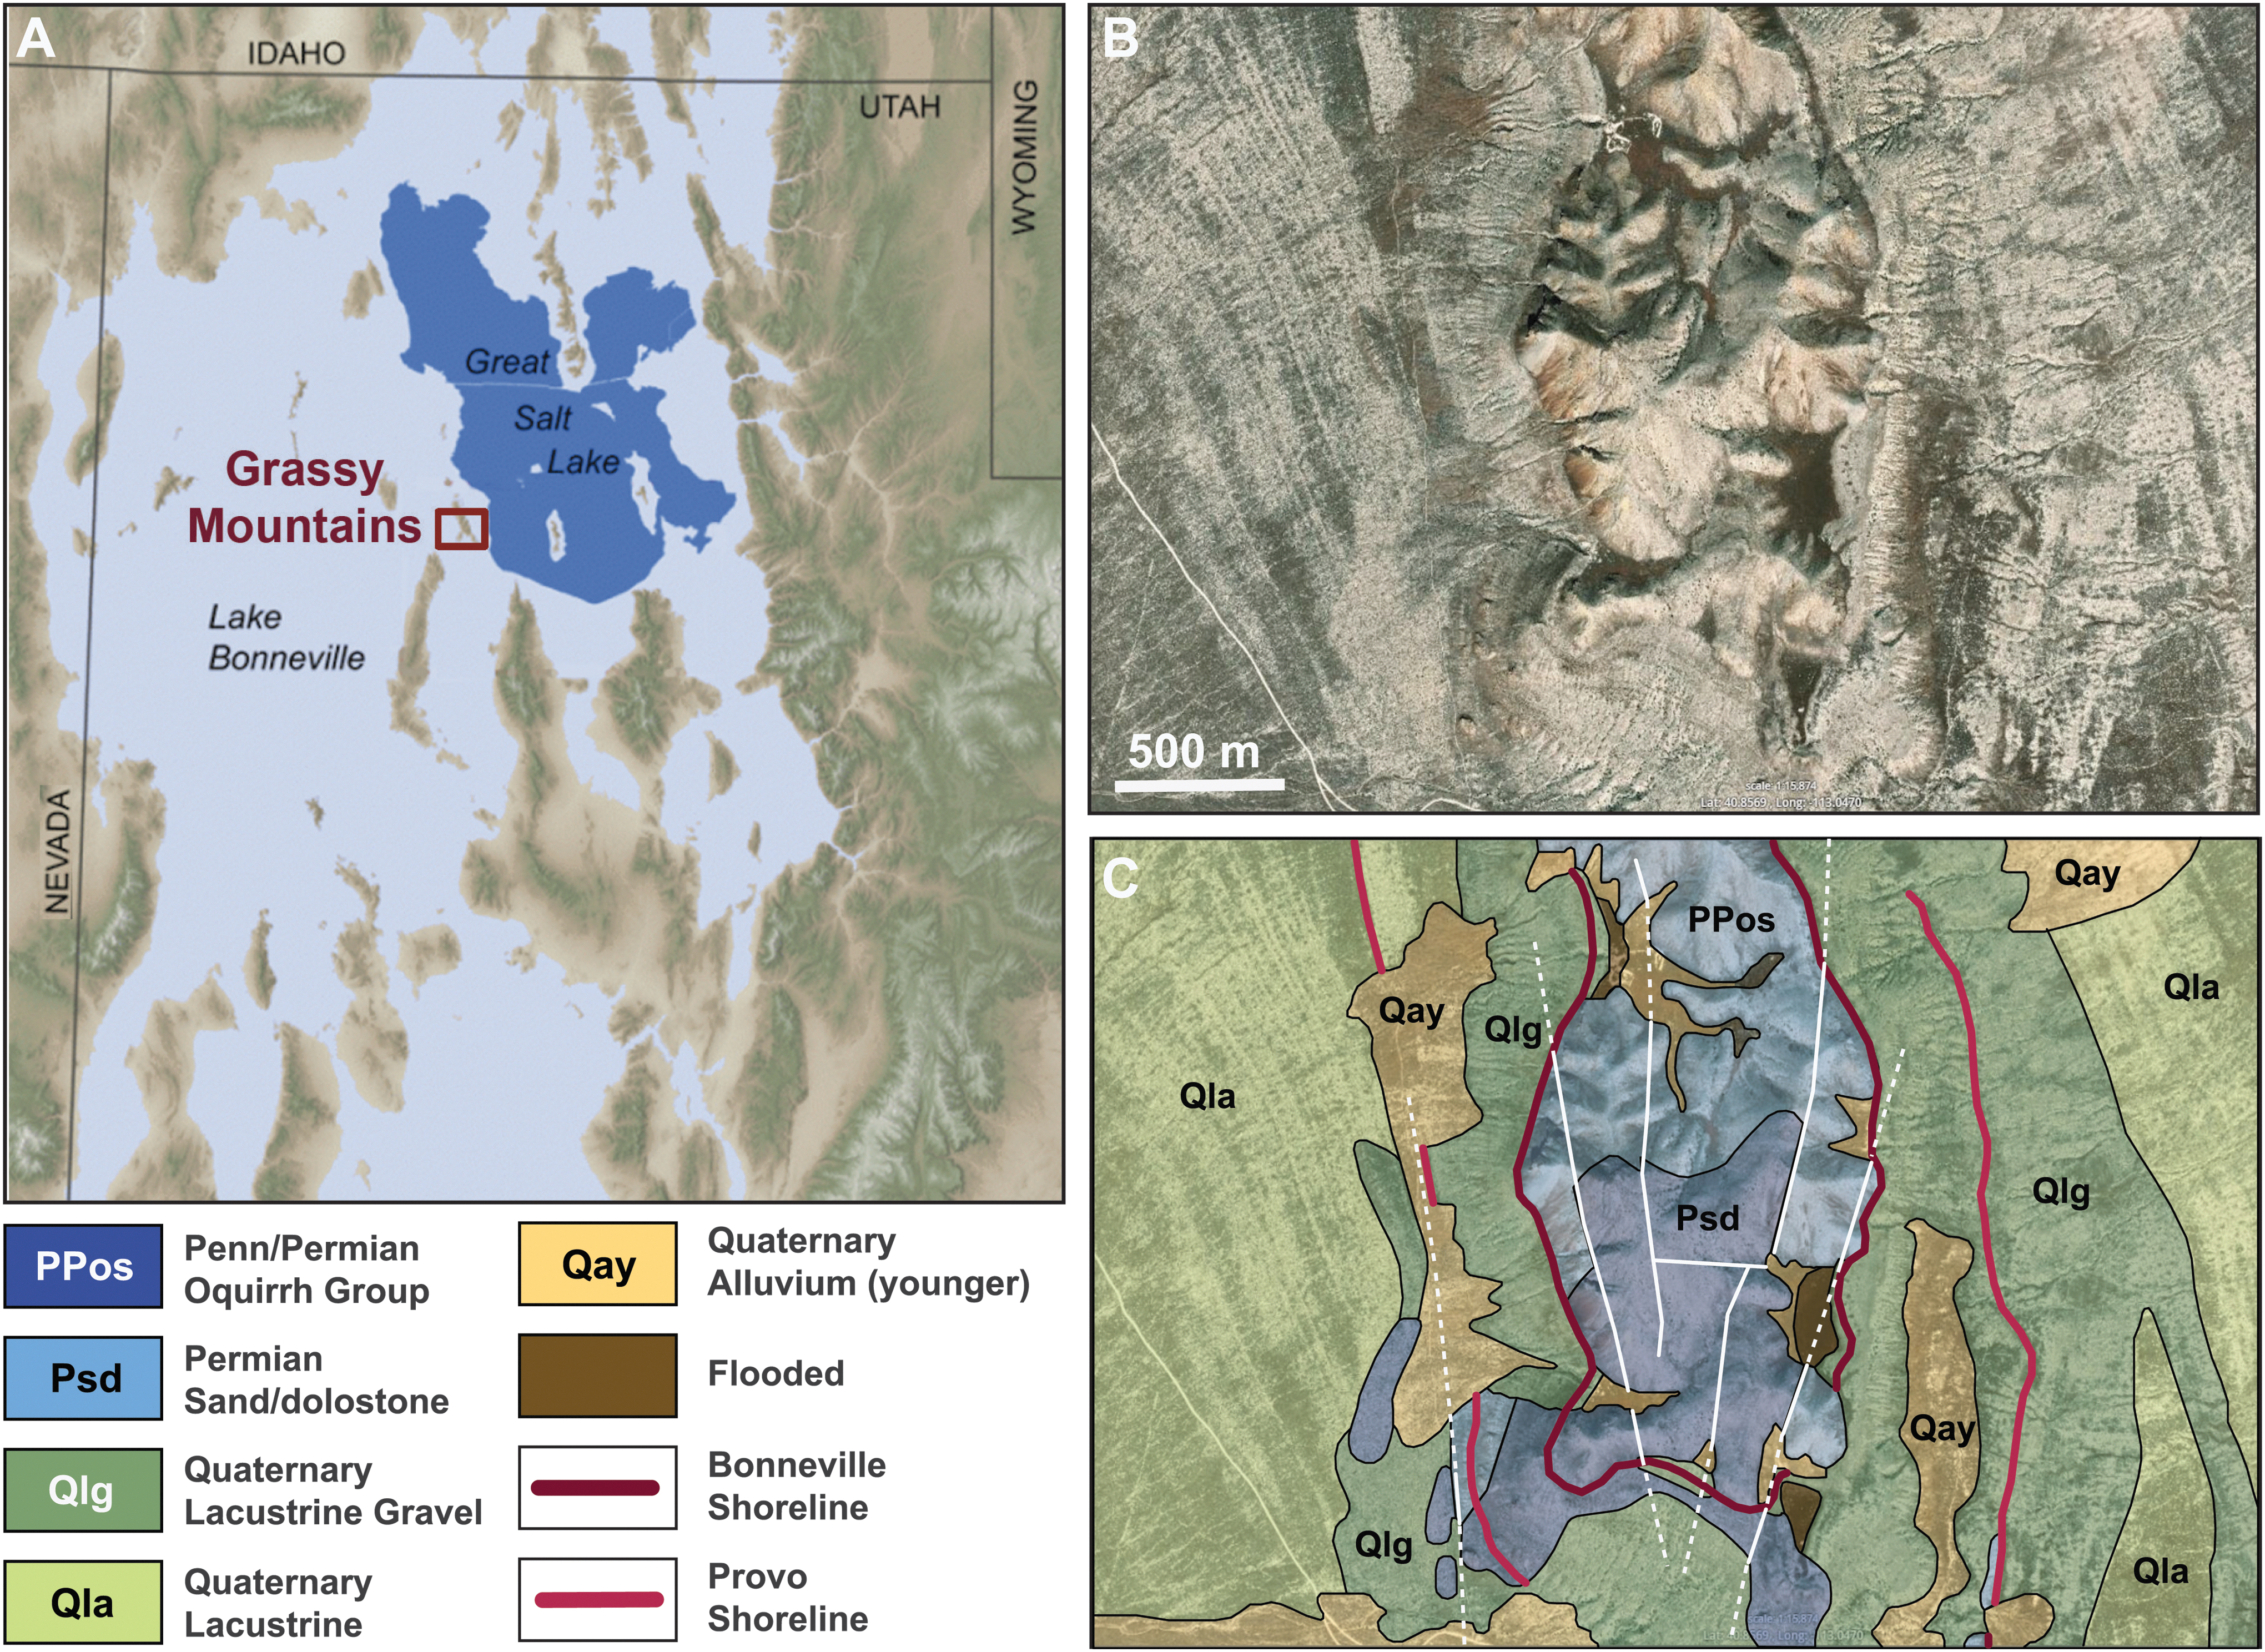
The exercise was conducted in a site considered analogous to both the MSL (Gale crater) and Mars 2020 (Jezero crater) landing sites. The site, which is located near the Interstate 80 corridor west of Salt Lake City, Utah (Fig. 1), contains geologic evidence for a variety of ancient habitable environments, including marine environments (Paleozoic bedrock) and fluvial, lacustrine, and groundwater spring environments (Quaternary deposition). Orbital detection of both clay and carbonate phases is consistent with arguments that suggest these lithologies represent enhanced potential for preservation of biosignatures (e.g., Ehlmann et al., 2008; Milliken et al., 2010; Wray et al., 2016; Horgan et al., 2020). This GHOST test focused on four ROIs on the western flank of the Grassy Mountains (Fig. 1), all of which were identified from orbital images as locations of high interest with respect to preserving evidence of habitability or biosignatures.
Regional geology.
Bedrock at the site consists of Permian marine limestone, dolomite, and sandstone of the Oquirrh Group deposited in an inland sea (Clark and Oviatt, 2018; Hintze and Kowallis, 2021). A combination of Cordilleran orogenesis and basin and range extension resulted in north-to- south trending crustal blocks that represent the primary mountainous regions (Clark et al., 2017). The landscape was then modified within pluvial environments of the Pleistocene Lake Bonneville, which was associated with the deposition of silt, sand, and gravel in the lowlands; the formation of two distinct geomorphic shorelines (i.e., the 18 kya Bonneville shoreline at an elevation of ∼1550 m, and the 15 kya Provo shoreline at ∼1445 m); and deposition of a distinctive tufa proximal to the Provo shoreline ( Reheis et al., 2014; Oviatt and Schroeder, 2016; Clark and Oviatt, 2018).
Lake Bonneville developed during the last glacial maximum, starting ∼30 kya, and covered nearly 50,000 km2, with maximum depths of ∼300 m (Chen and Maloof, 2017) (Fig. 1). For comparison, the putative lake at Jezero crater was ∼1885 km2 and may have been as deep as 270 m (Goudge et al., 2018).
Prefieldwork site assessment
Science teams conducted a prefieldwork assessment of the ∼1 km2 field site using data similar in resolution to the orbital data available for Mars. Panchromatic and visible wavelength orthoimages with a resolution of 1 m/pixel were provided by the Utah Geologic Survey and used to simulate High Resolution Imaging Science Experiment (HiRISE) images. This data set was also coarsened to 5 m/pixel to simulate Context Camera images. Simulated HiRISE stereo pairs were used to create a high-resolution (5 m/pixel) digital elevation model (DEM) and hill-shade map of the study area. An additional 70 m/pixel DEM, analogous to high-resolution stereo camera (HRSC) products, was created by degrading a 30 m/pixel US Geological Survey DEM of the region. CRISM data were simulated with Landsat 7 Thematic Mapper multispectral data. Spectral data were analyzed for relevant common materials (e.g., smectite, silica, iron, carbonate) and compiled into a mineral map of the field site.
The field teams surveyed orbital data before arrival at the field site. Teams worked together to create the initial hypotheses about the field area, so that they began from a common set of observations, summarized in Figs. 2 and 3. Each team then separately planned traverses and stops for each 100 × 100 m ROI (A, B, C, and D) that each believed would provide the best opportunity to characterize the geology of the region, identify possible biosignatures, and collect biologically relevant samples. The Tactical team created a generalized set of observations for each area, which included potential stations for data and sample collection, while the Strategic team created a sol-by-sol plan for each campaign region.
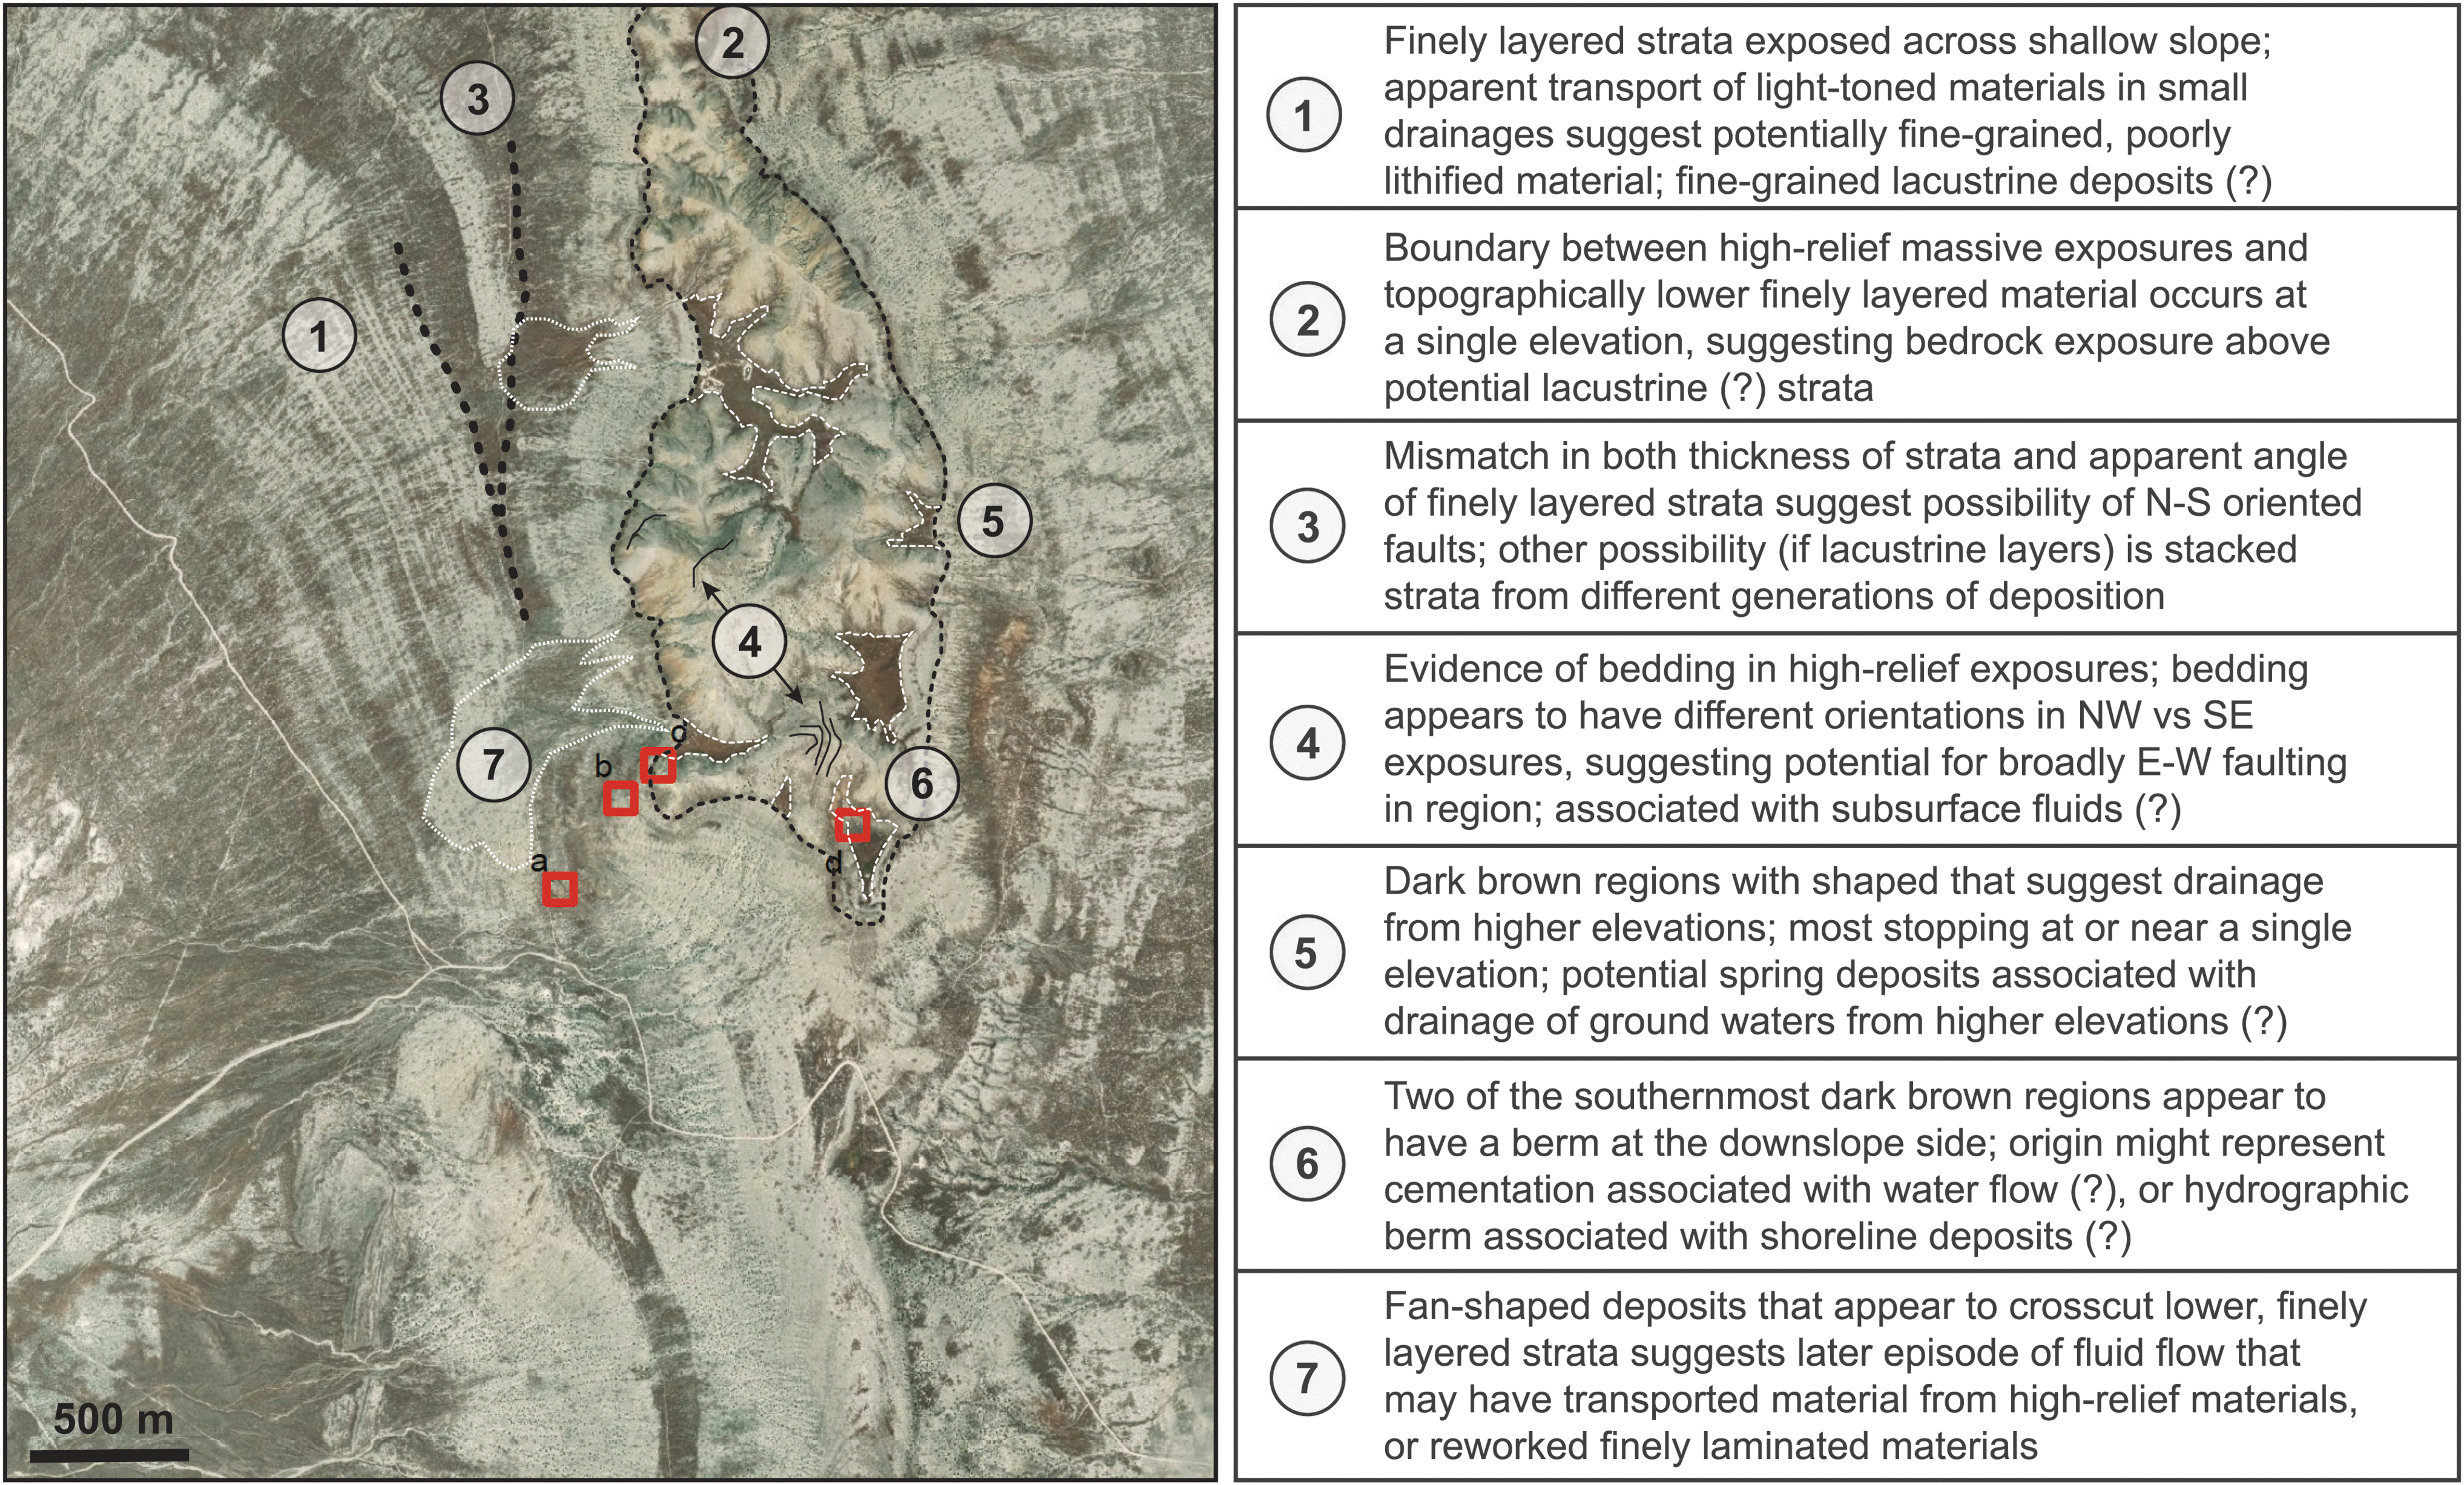
Orbital image of the southern Grassy Mountain field site, with red squares marking predetermined ROIs assigned for remote rover operations. Regions and boundaries highlighted on the image are associated with numbered, key observations agreed upon by team members before the start of remote operations. Lithologies for high-resource science (e.g., drilling or sampling) focused on materials with a high potential for preservation of biosignatures, and included fine-grained, potentially lacustrine sedimentary rock; potential hydrothermal materials associated with fractures; high-relief bedrock lithologies; and regions inferred to have experienced later fluid flow with subsequent ponding, precipitation from springs, or shoreline depositional environments. ROI, region of interest.
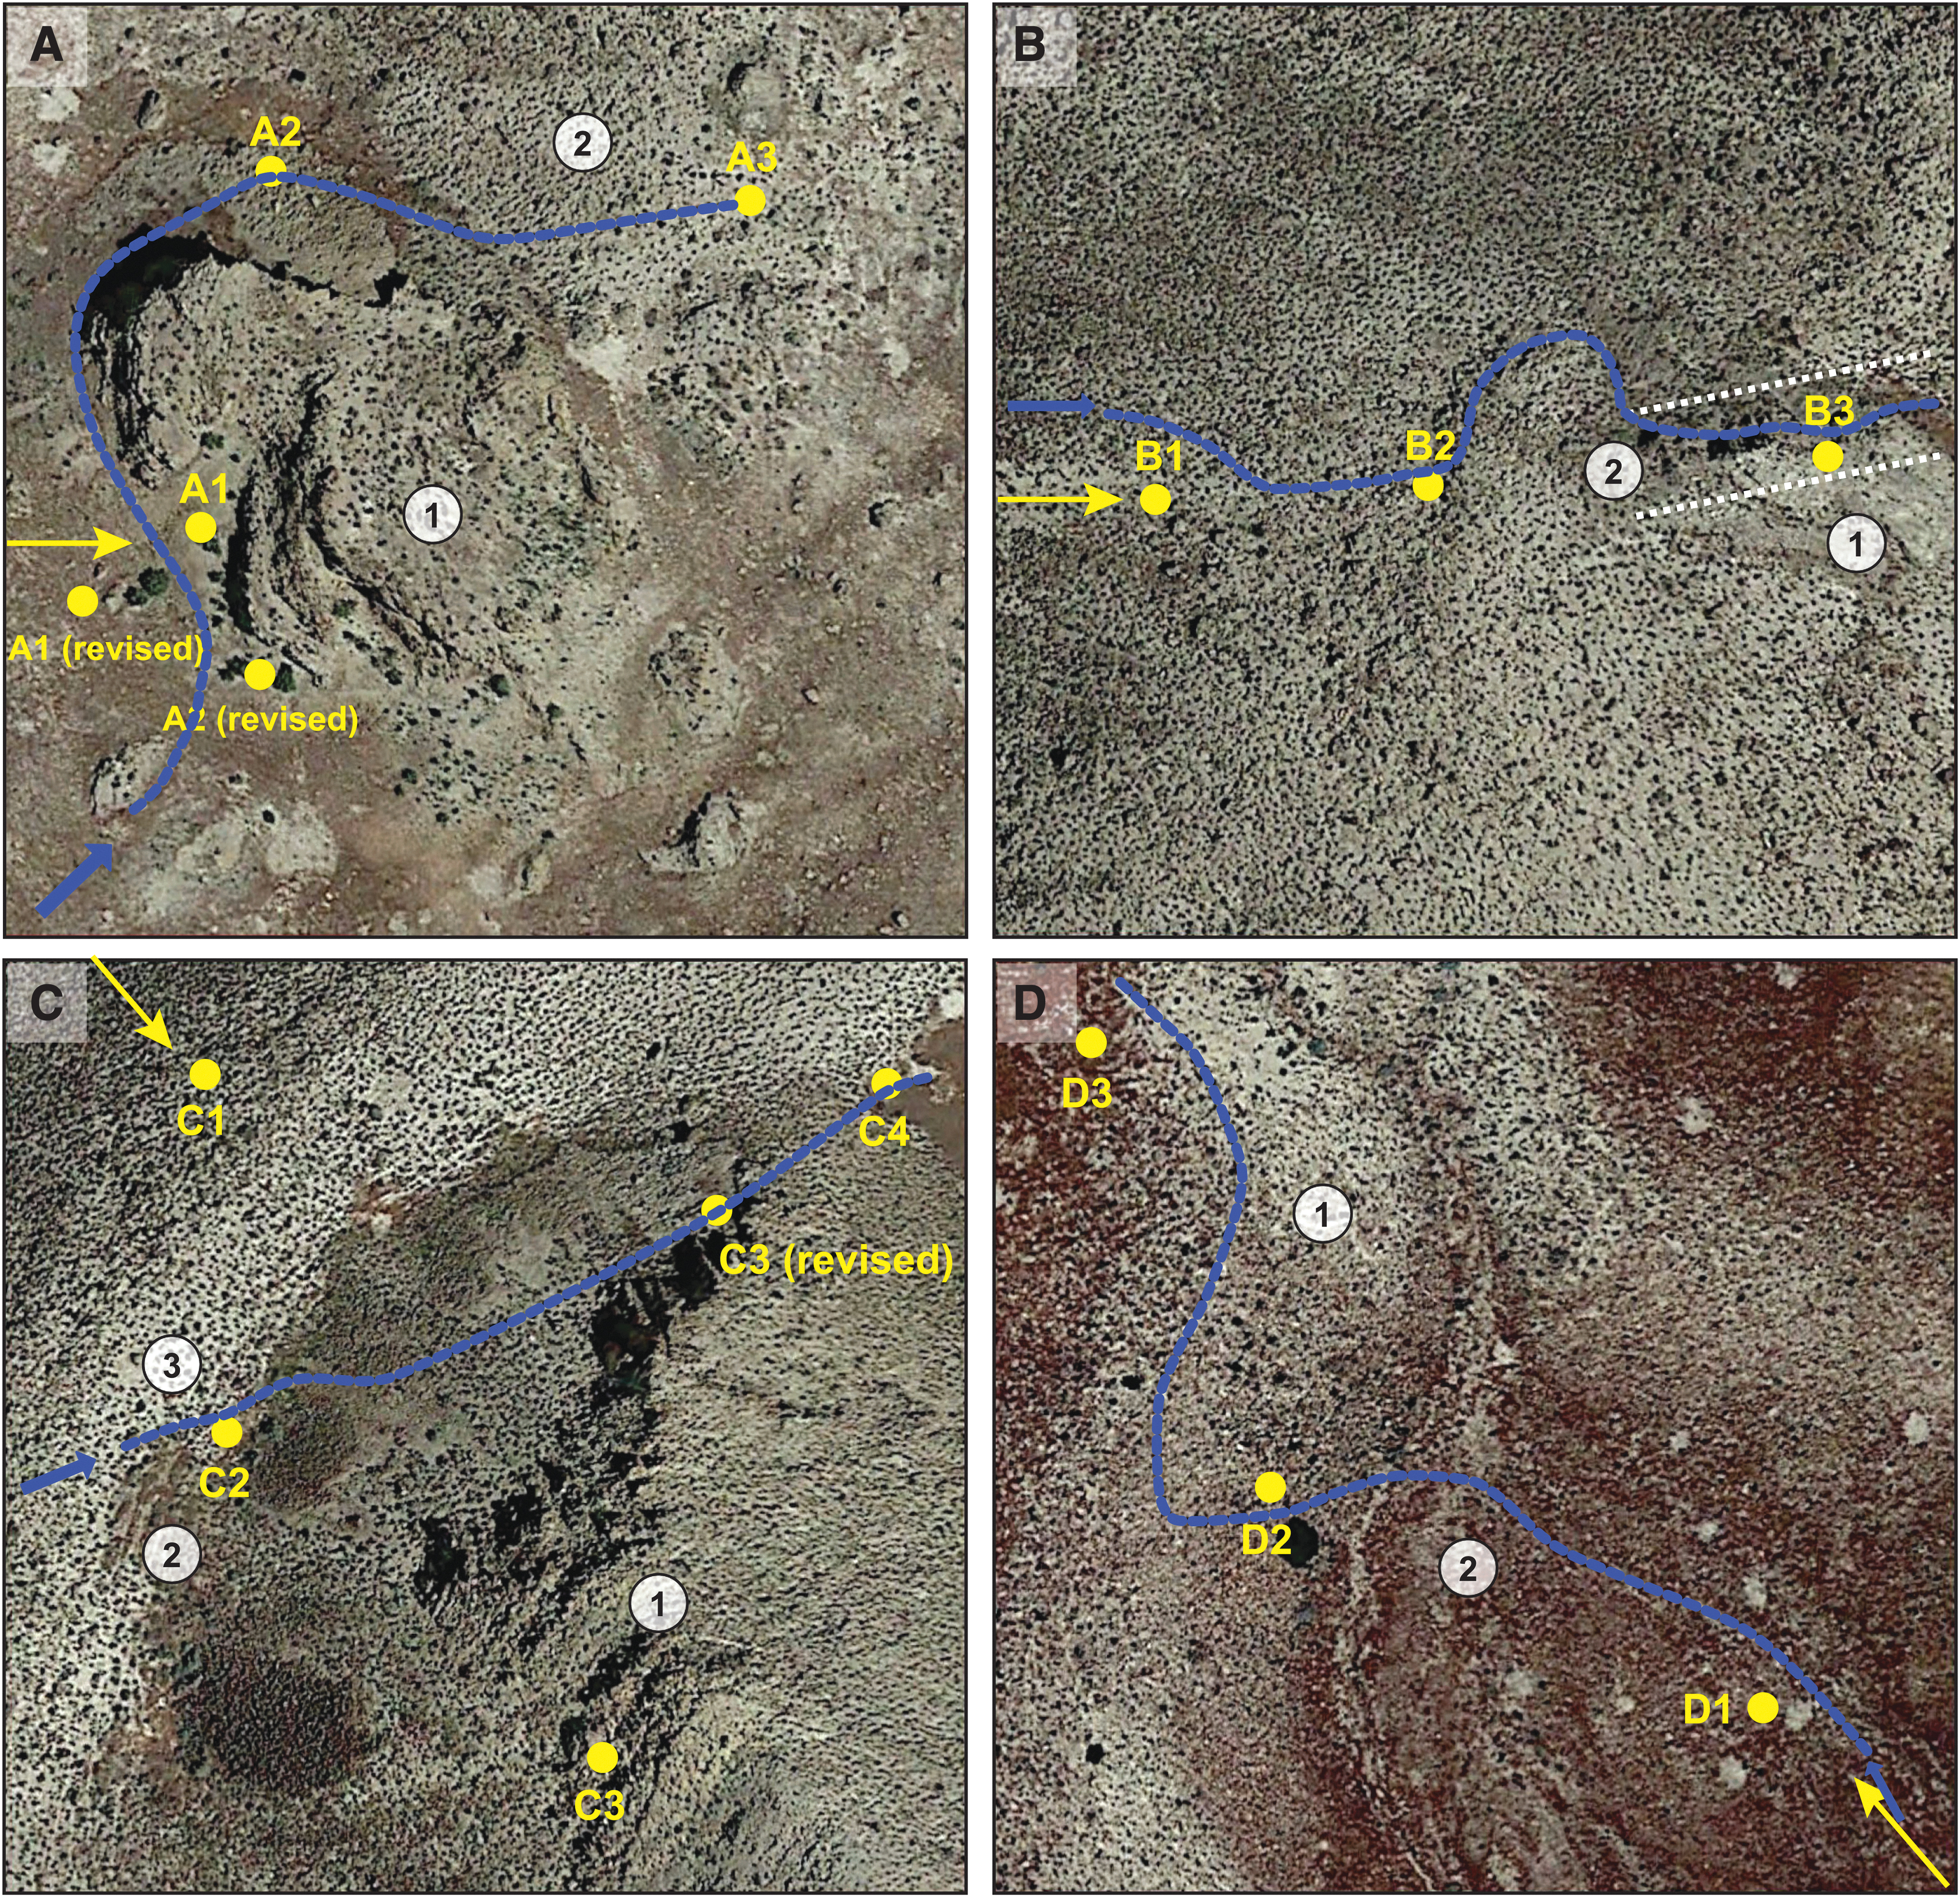
Orbital images of individual ROIs assigned for remote rover operations; images are 400 m across.
Data collection in the field followed the methods described by Yingst et al. (2016, 2018, 2020). In the absence of engineering data, all paths were assumed to be traversable, and human rover avatars made the final judgment on the traversability of a region in situ. This allowance increased the efficiency of science teams and allowed ∼15–20 sols of rover activities to be completed per day in the field.
Both the Tactical and Strategic teams began analysis with an initial panoramic image of the site upon entering a new campaign region. Additional mosaics were collected after the completion of each drive. Rover teams could only drive to points that were visible in their collected images, limiting them to 100 m or less per drive sol. Upon arrival, teams could deploy VNIR and/or XRD-type instruments to collect mineralogical and chemical data. Data could then be used to infer the composition of the rocks in the region. Additional high-resolution visible images (MAHLI/WATSON and Mastcam/Mastcam-Z) could also be collected for analysis and interpretation. Both teams were also free to choose how to traverse each site, including whether to execute a single traverse or to execute a reconnaissance pass (Yingst et al., 2016, 2018, 2020), and then interrogate a subset of areas previously examined in the first pass.
However, the starting point for the “rovers,” and thus the order that the ROIs were visited, was driven entirely by the logistics of transporting equipment and personnel. This retains the integrity of the test, as experience has shown that a traverse starting point that is random with respect to the “best” geology is a real-world case; the approach to any site is usually driven by factors unrelated to science.
Concurrent with GHOST operations, the Tiger team independently investigated the site on foot and was not limited to exploring only areas that were chosen as ROIs. Geological assessment by the Tiger team provided an independent baseline interpretation of the geology, the depositional environments, and the prioritization of potential sampling localities.
Data
Strategic team activities
The Strategic team identified high-priority locations for sampling and then planned science operations to provide the necessary contextual information for acquisition of those samples, while staying within sol counts proposed for this exercise. Using the prefield analysis (cf. Section 4.1, Figs. 2 and 3), the Strategic team determined that the site of ROI D was the highest priority for sampling, which included dark and light units within the distributary channels and the bounding ridges, each of which was determined to likely contain evidence of fluid-derived minerals and potential organic matter associated with overland flow and fluid ponding. An additional sample from exposed bedrock upstream of the channel was also planned to compare the geochemistry of bedrock with stratigraphically superimposed ponded materials.
The strategic interest in the ROI D site, however, placed an operational limit on potential samples from other ROI sites. It was, therefore, determined that the remaining sites would be used primarily to build a regional context. At the other sites (ROI A–C), the team strategically planned to focus sampling on dark-toned, erosionally resistant bedrock and light-toned, fine-grained material associated with what was interpreted as regional lacustrine deposition. The team also planned to investigate exposed bedrock and the potential cross-cutting phases to explore potential chemical alteration of bedrock and potential ground sources of fluid movement.
Although the Strategic team built a plan that was consistent with both the test scenario and the geological interpretations derived during prefield assessment, the addition of ground-based data at ROI A that revealed a likely sedimentary origin and potential biosignature retention (Fig. 4) required immediate and substantial revision of the strategic plan, from remote and contact science only to sample collection. The Strategic team determined a new sampling strategy that focused on (1) acquiring samples that would aid in the reconstruction of the number and chemistry of fluid events that affected the bedrock lithologies, while (2) retaining sample acquisition “slots” for the predetermined highest priority sampling locality late in the mission at ROI D. This new strategy led to the sampling of dolomitic karst breccia identified by remote and contact science in ROI B bedrock (Fig. 5), and carbonate-bearing soil crust and calcite vein material cutting through bedrock in ROI C (Fig. 6).
Strategic team assessment of ROI A.
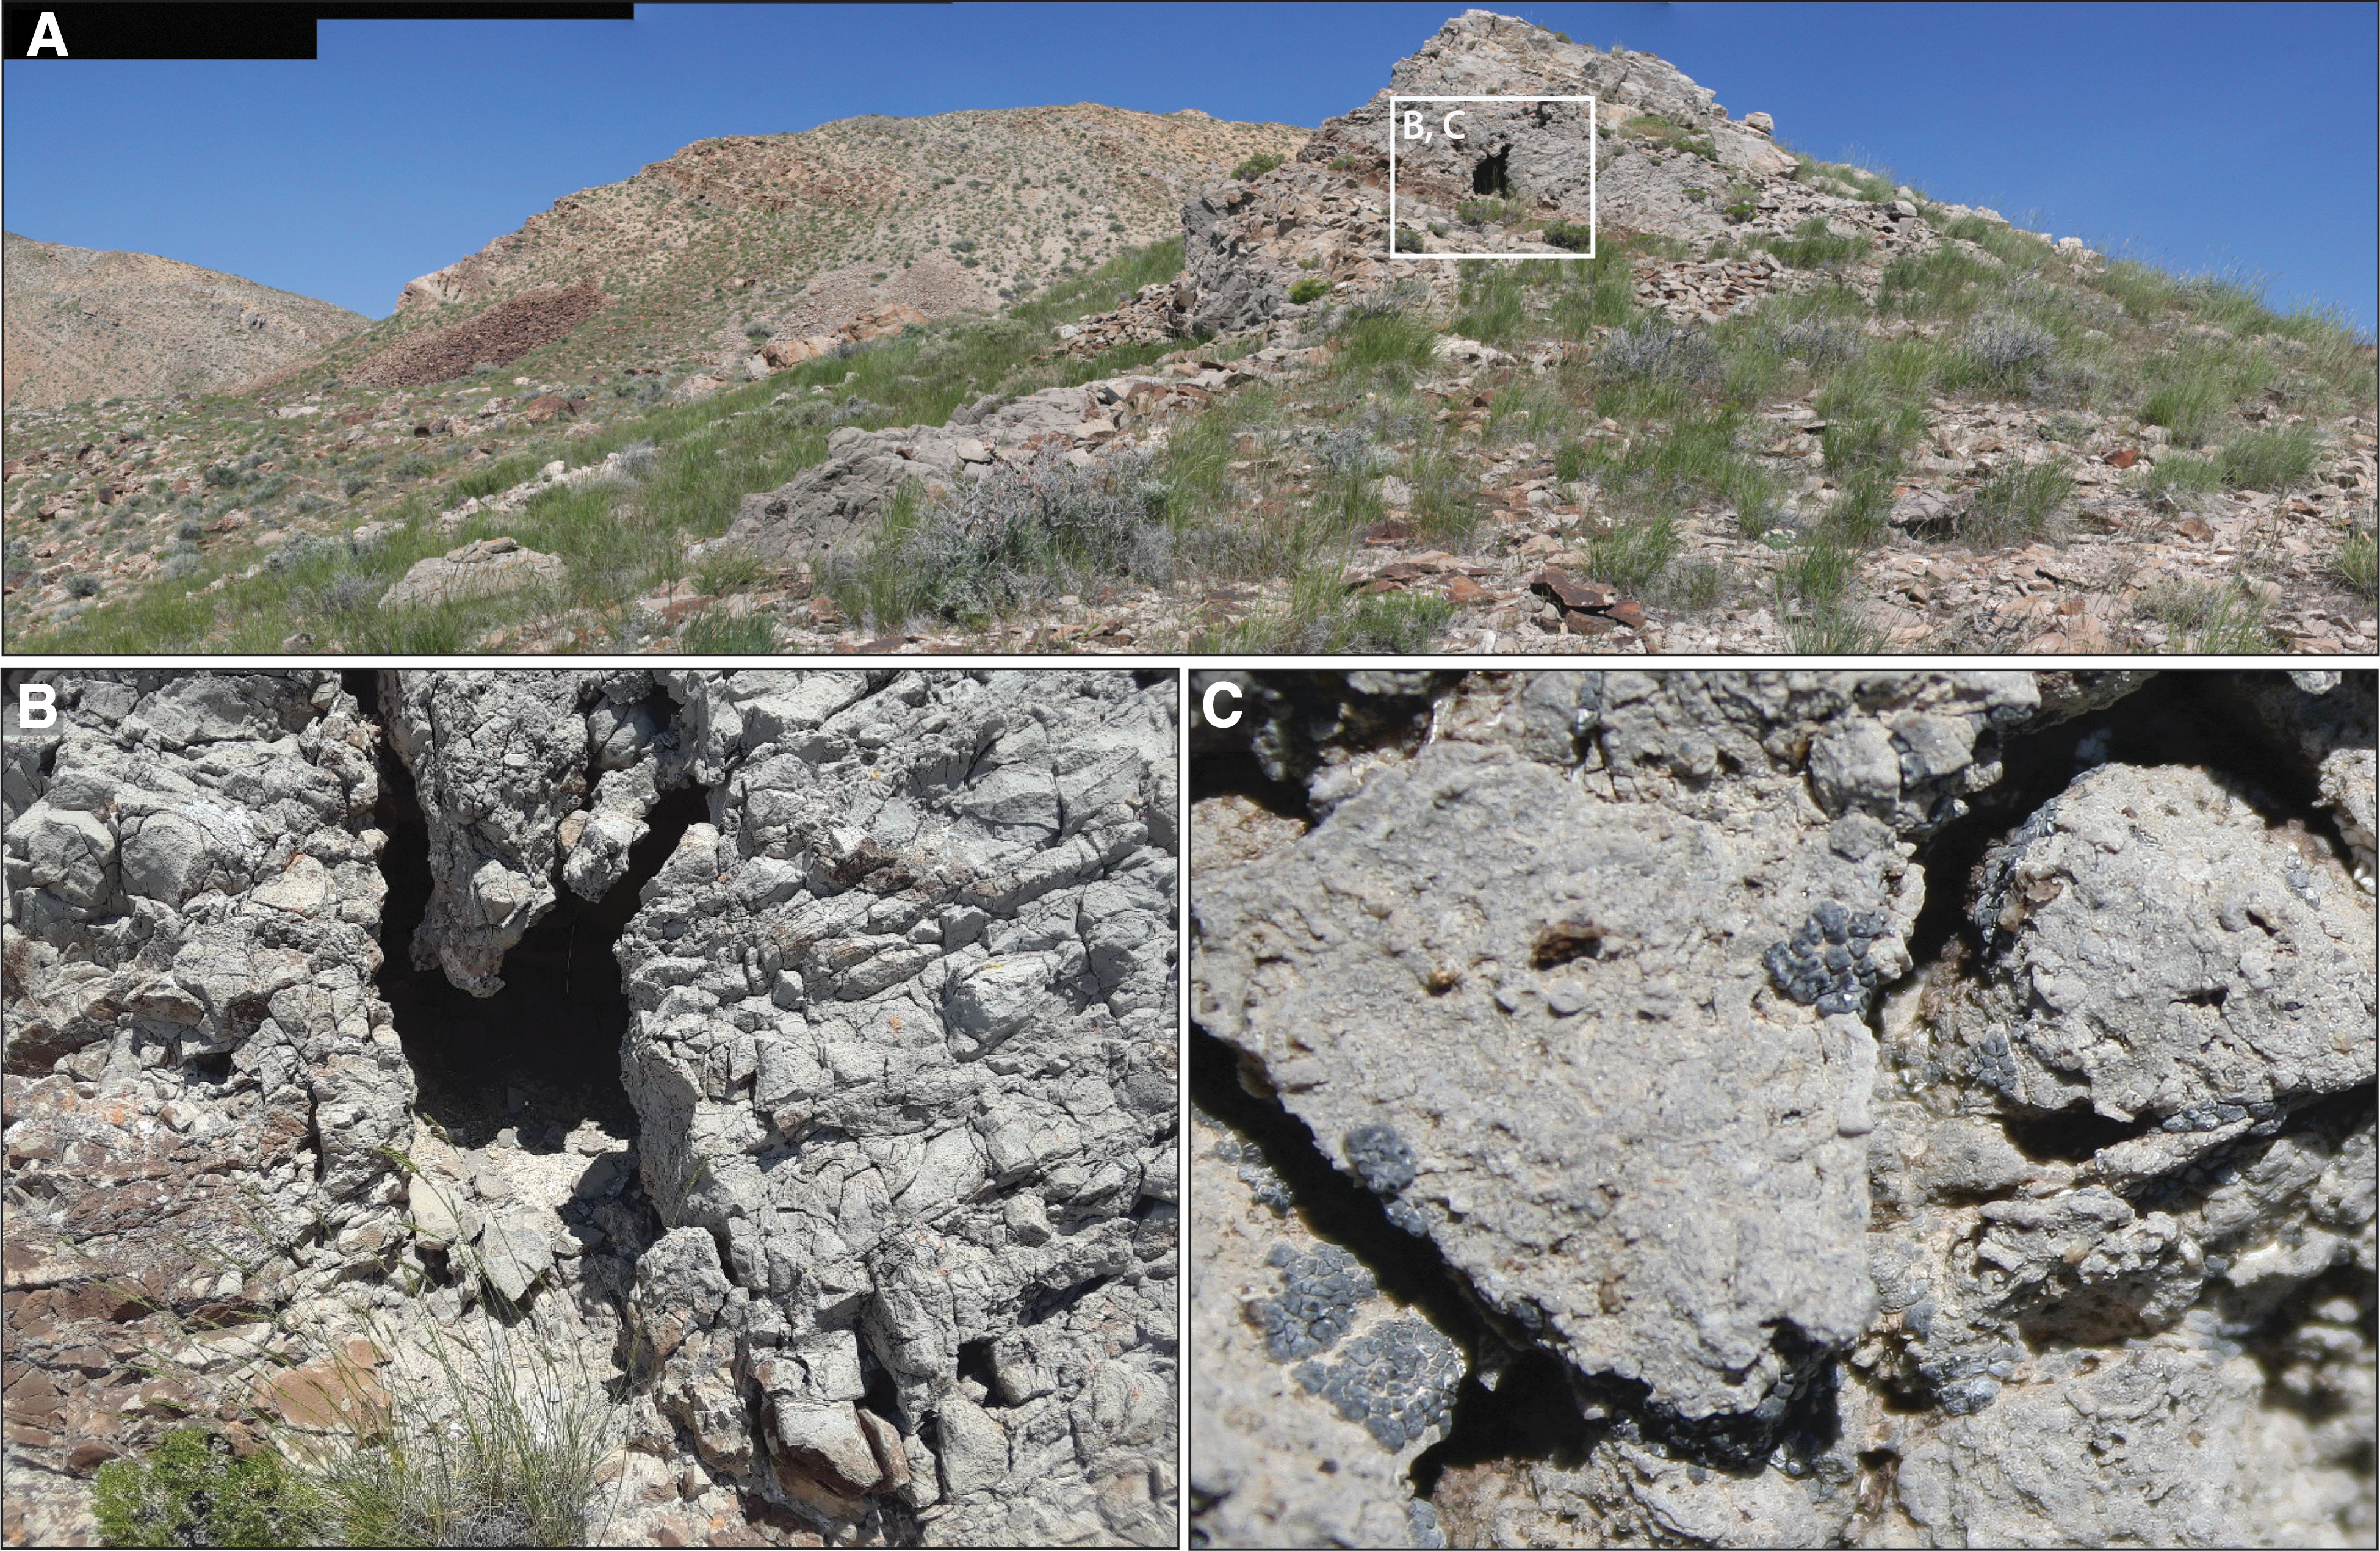
Strategic team assessment of ROI B.
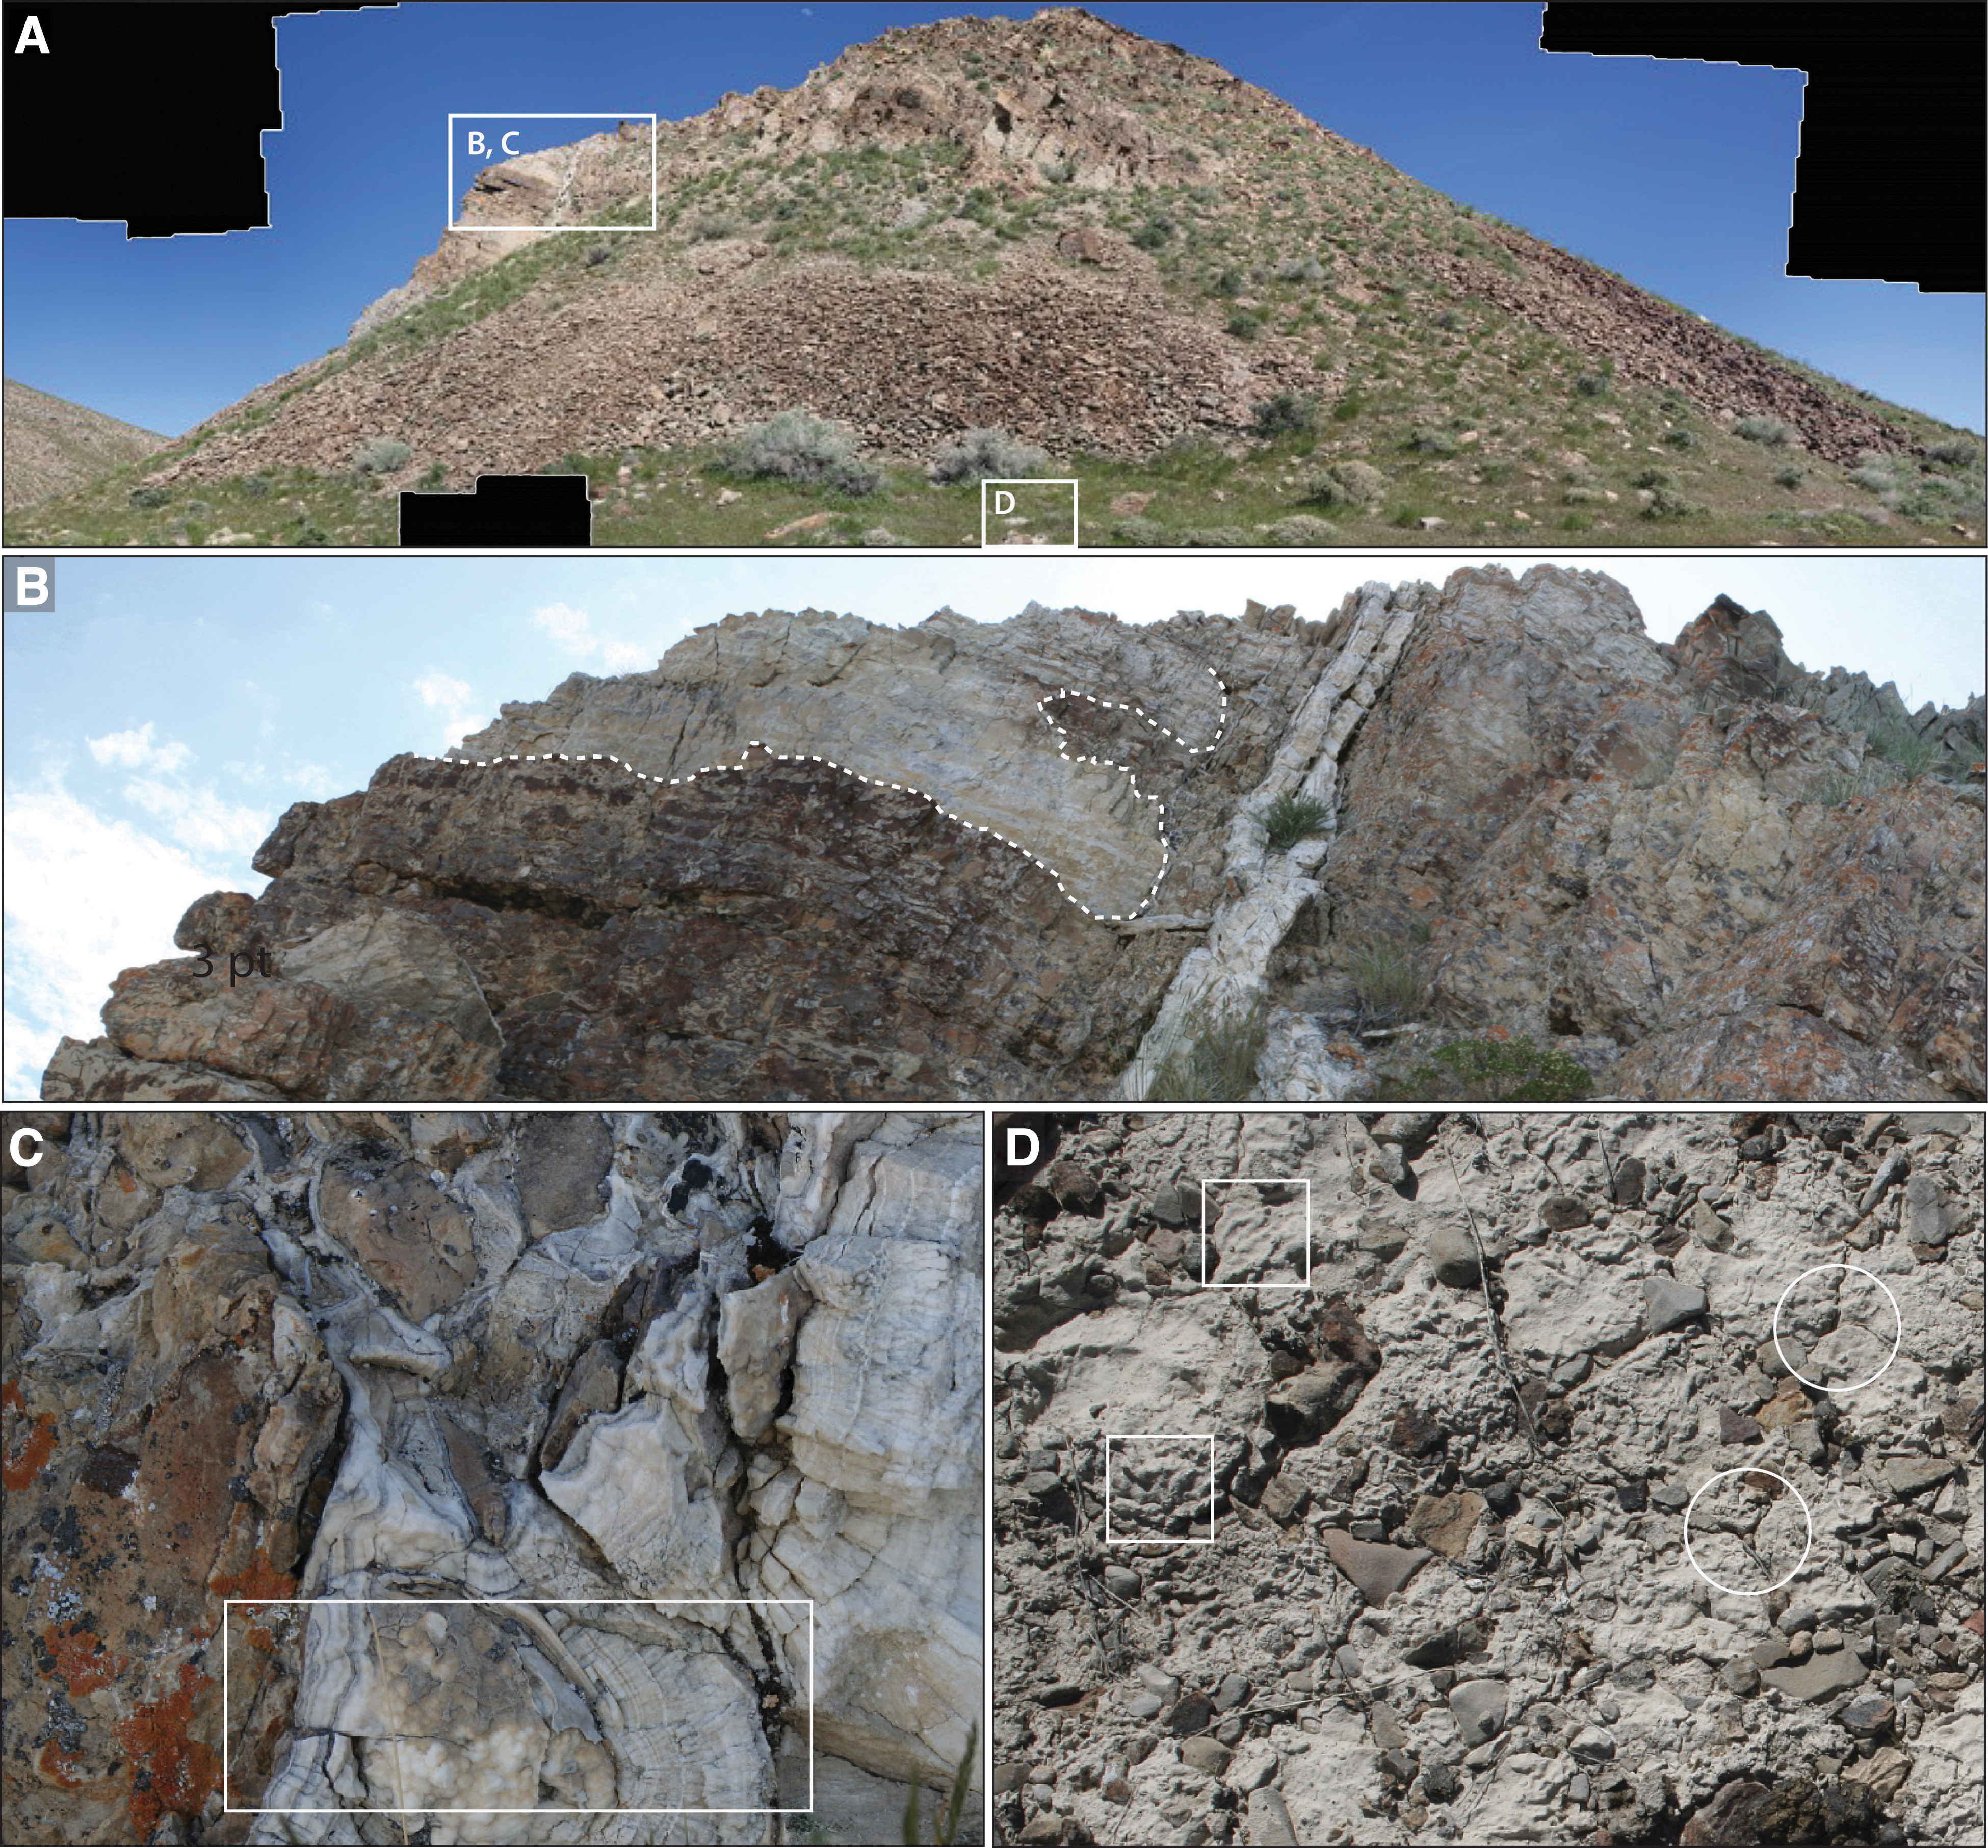
Strategic team assessment of ROI C.
During a prefield assessment, the Strategic team identified in ROI D regional geomorphic evidence of the presence of a long-term lacustrine environment, marked by apparent shorelines that were expressed as uniform topographic ridges along the bedrock hillsides, and the potential for short-term lacustrine environments uphill from potential shoreline ridges. Upon arrival at the locality, it became apparent that the lacustrine materials that may have been associated with topographic shorelines were not preserved as materials that could be sampled in this operational scenario. With the sol limit approaching, the Strategic team had to quickly select the three samples for this campaign region and, therefore, focused on the assessment and sampling of potential fluvial-deltaic deposits to characterize the region's fluvial history.
The Strategic team strategy, data and sample acquisition, and interpretations are summarized in Table 3 and described in detail in the Supplementary Material. The team used an estimated 55 sols for observations, incurring no extra sol cost for adding observations.
Strategic Team Data and Interpretations
ROI = region of interest.
The Strategic team felt substantial pressure from having to reorganize from its strategic planning. Because of the small size of the four ROIs, the team chose not to use an initial reconnaissance pass to reconnoiter the site before choosing where to use more resource-intensive interrogation.
Although the Tactical team also began with identifying potential data collection sites and sample targets, the team did not make a firm sampling plan; instead, it planned to make sampling decisions based on data acquired during the traverse. Using the prefieldwork analysis (Section 4.1; Figs. 2 and 3), the Tactical team identified potential opportunities to sample bedrock and fluvial-lacustrine material throughout the campaign areas. For this team, ROI A, with hypothesized exposures of layered bedrock units, and ROI D, with likely lacustrine deposits, initially appeared most promising for sample acquisition. ROIs A and B were hypothesized to contain bedrock exposures; therefore, the team chose to focus analysis on the dark-toned, erosionally resistant bedrock and, secondarily, to acquire context for the light-toned material that was inferred to represent regional fluvio-lacustrine deposition. ROI C provided likely targets for evaluating the light-toned material [area (3) of Fig. 3C].
The Tactical team, during strategic planning, envisioned acquiring 1–2 samples in ROI A; 0–1 sample in ROI B; 1–2 samples in ROI C; and 2–3 samples in ROI D. The Tactical team also chose not to utilize a reconnaissance pass strategy to acquire data, believing that the ROIs were small enough that the time expenditure would be less efficient than a single pass through the terrain.
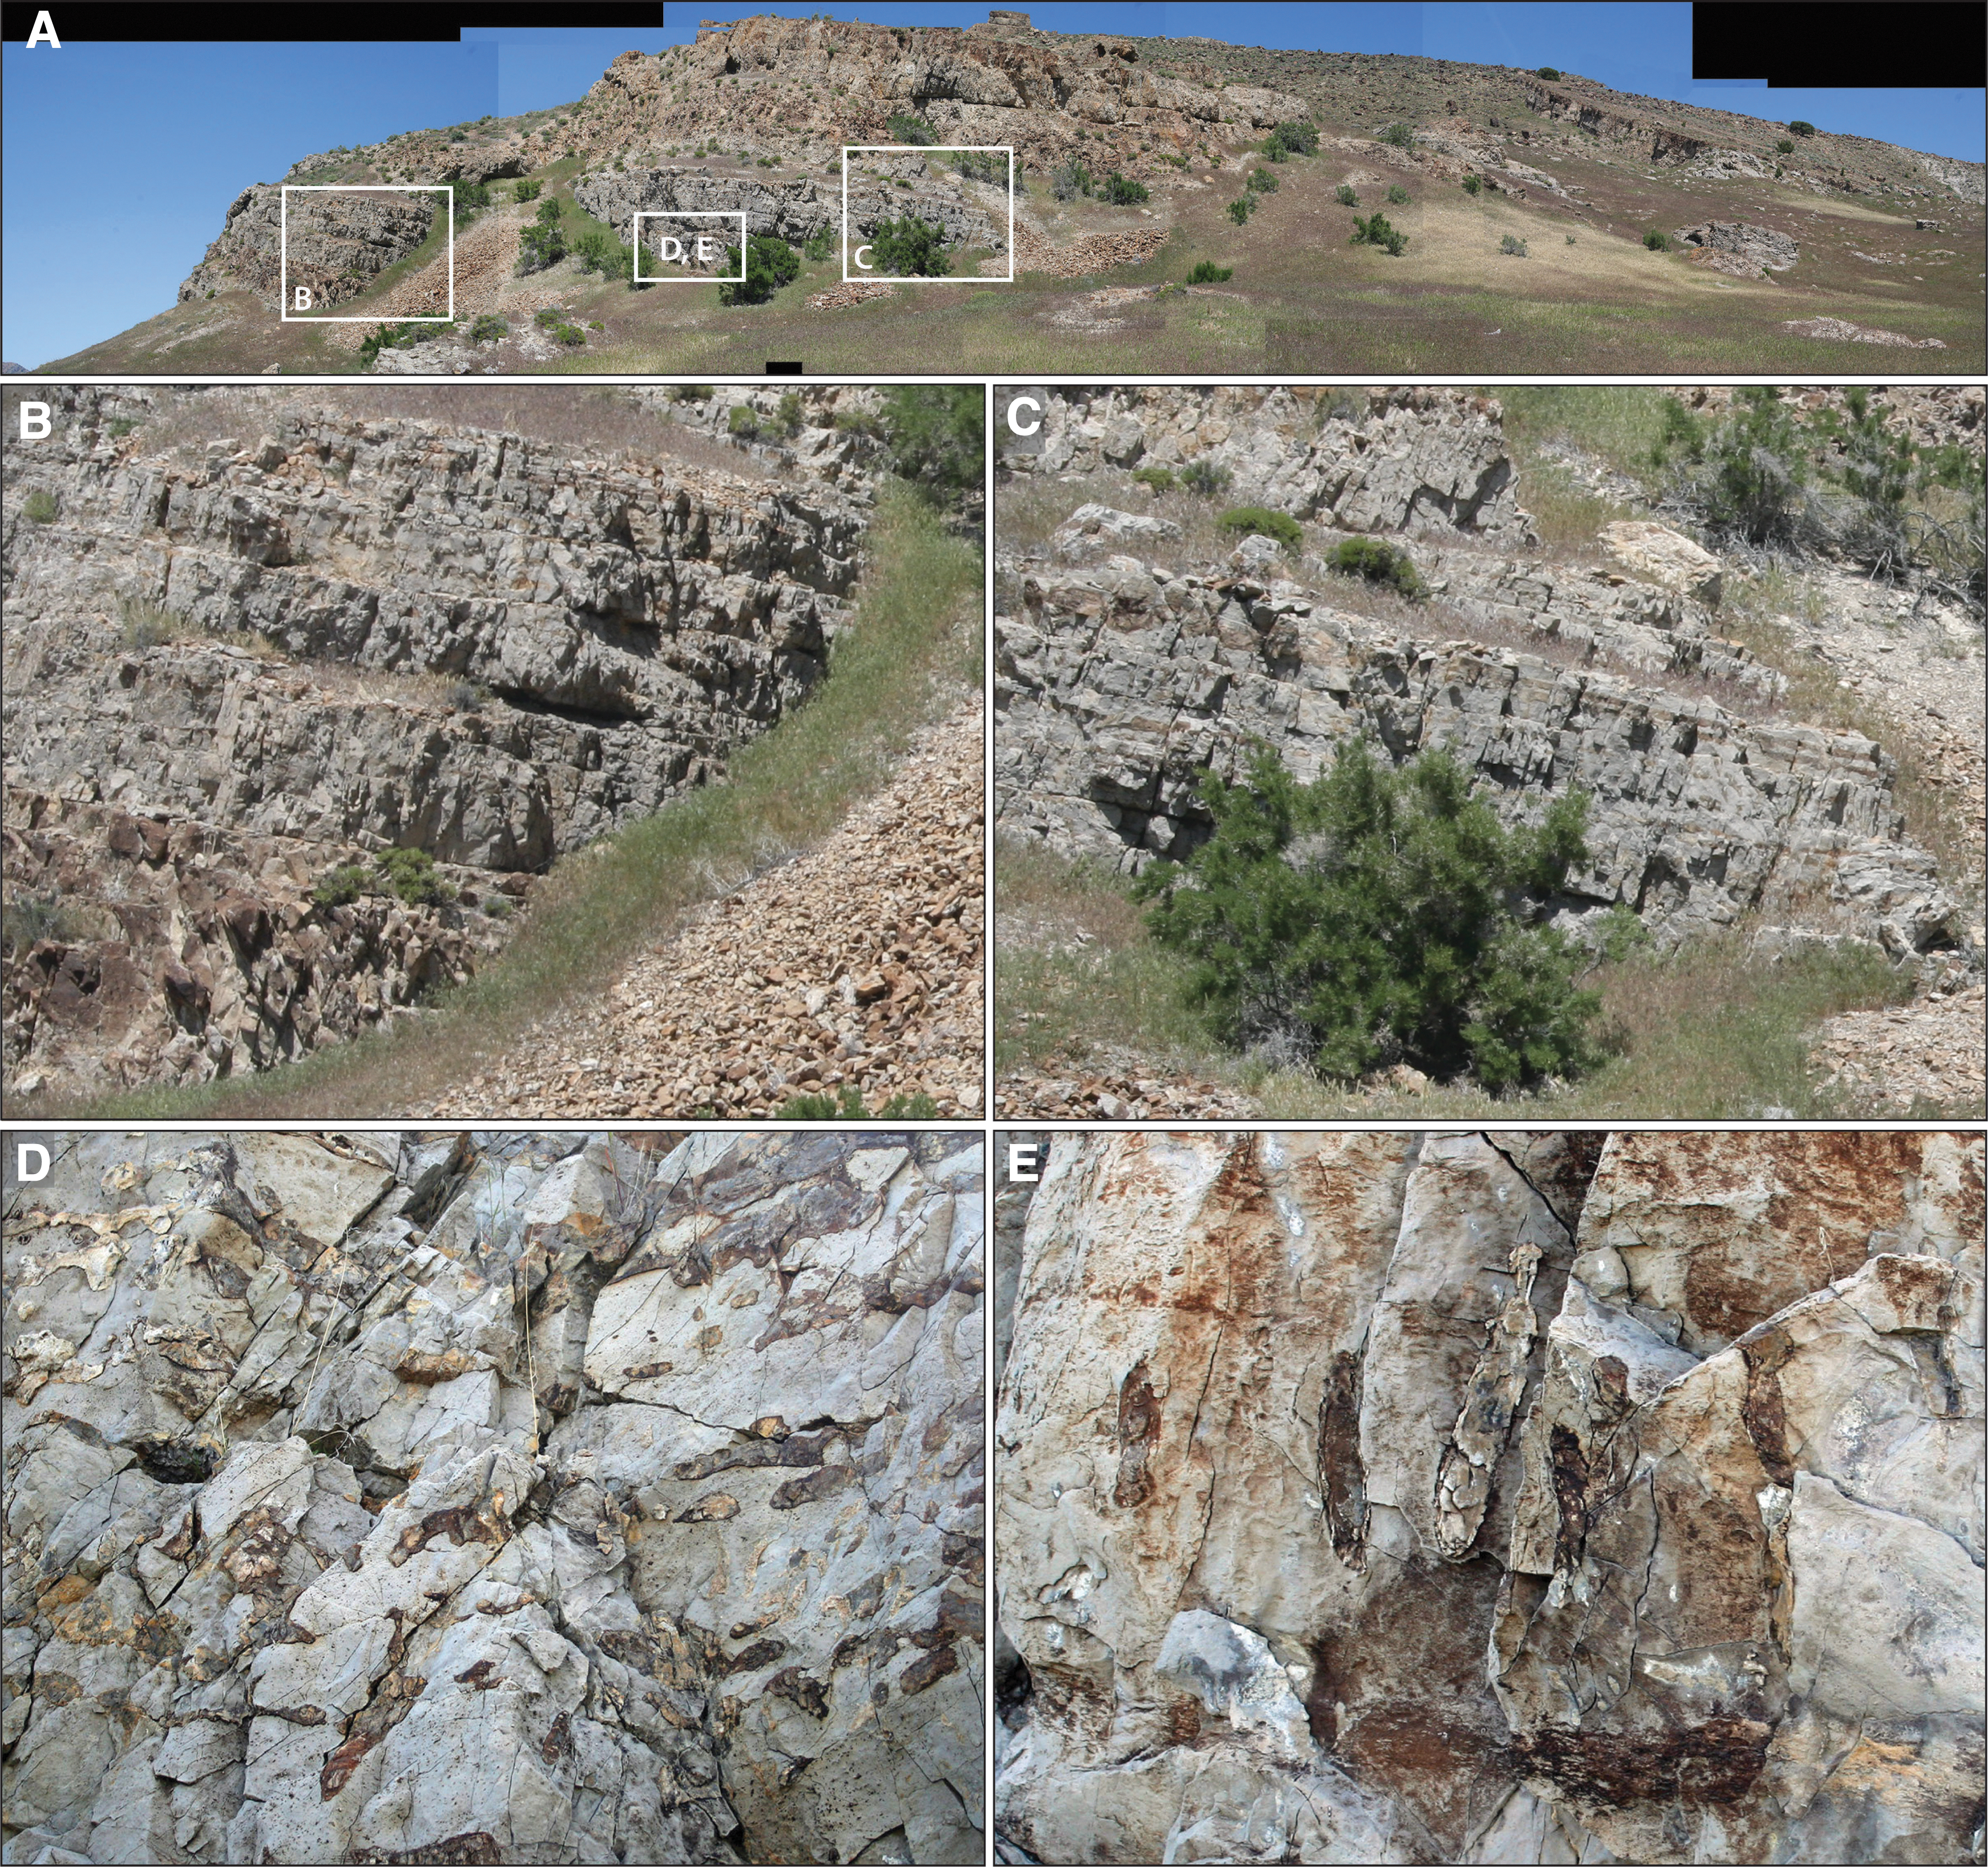
During the prefieldwork assessment, the Tactical team identified geomorphic evidence of layered sedimentary bedrock and evidence for a younger fluvio-lacustrine environment, marked by linear features of bright material that might have been shorelines. Upon arrival at the ROI, the hypothesized shoreline features were difficult to see and lacked clear geologic units that could be sampled. Bedrock lithologies, however, were well-suited to analysis and sampling (Fig. 7).
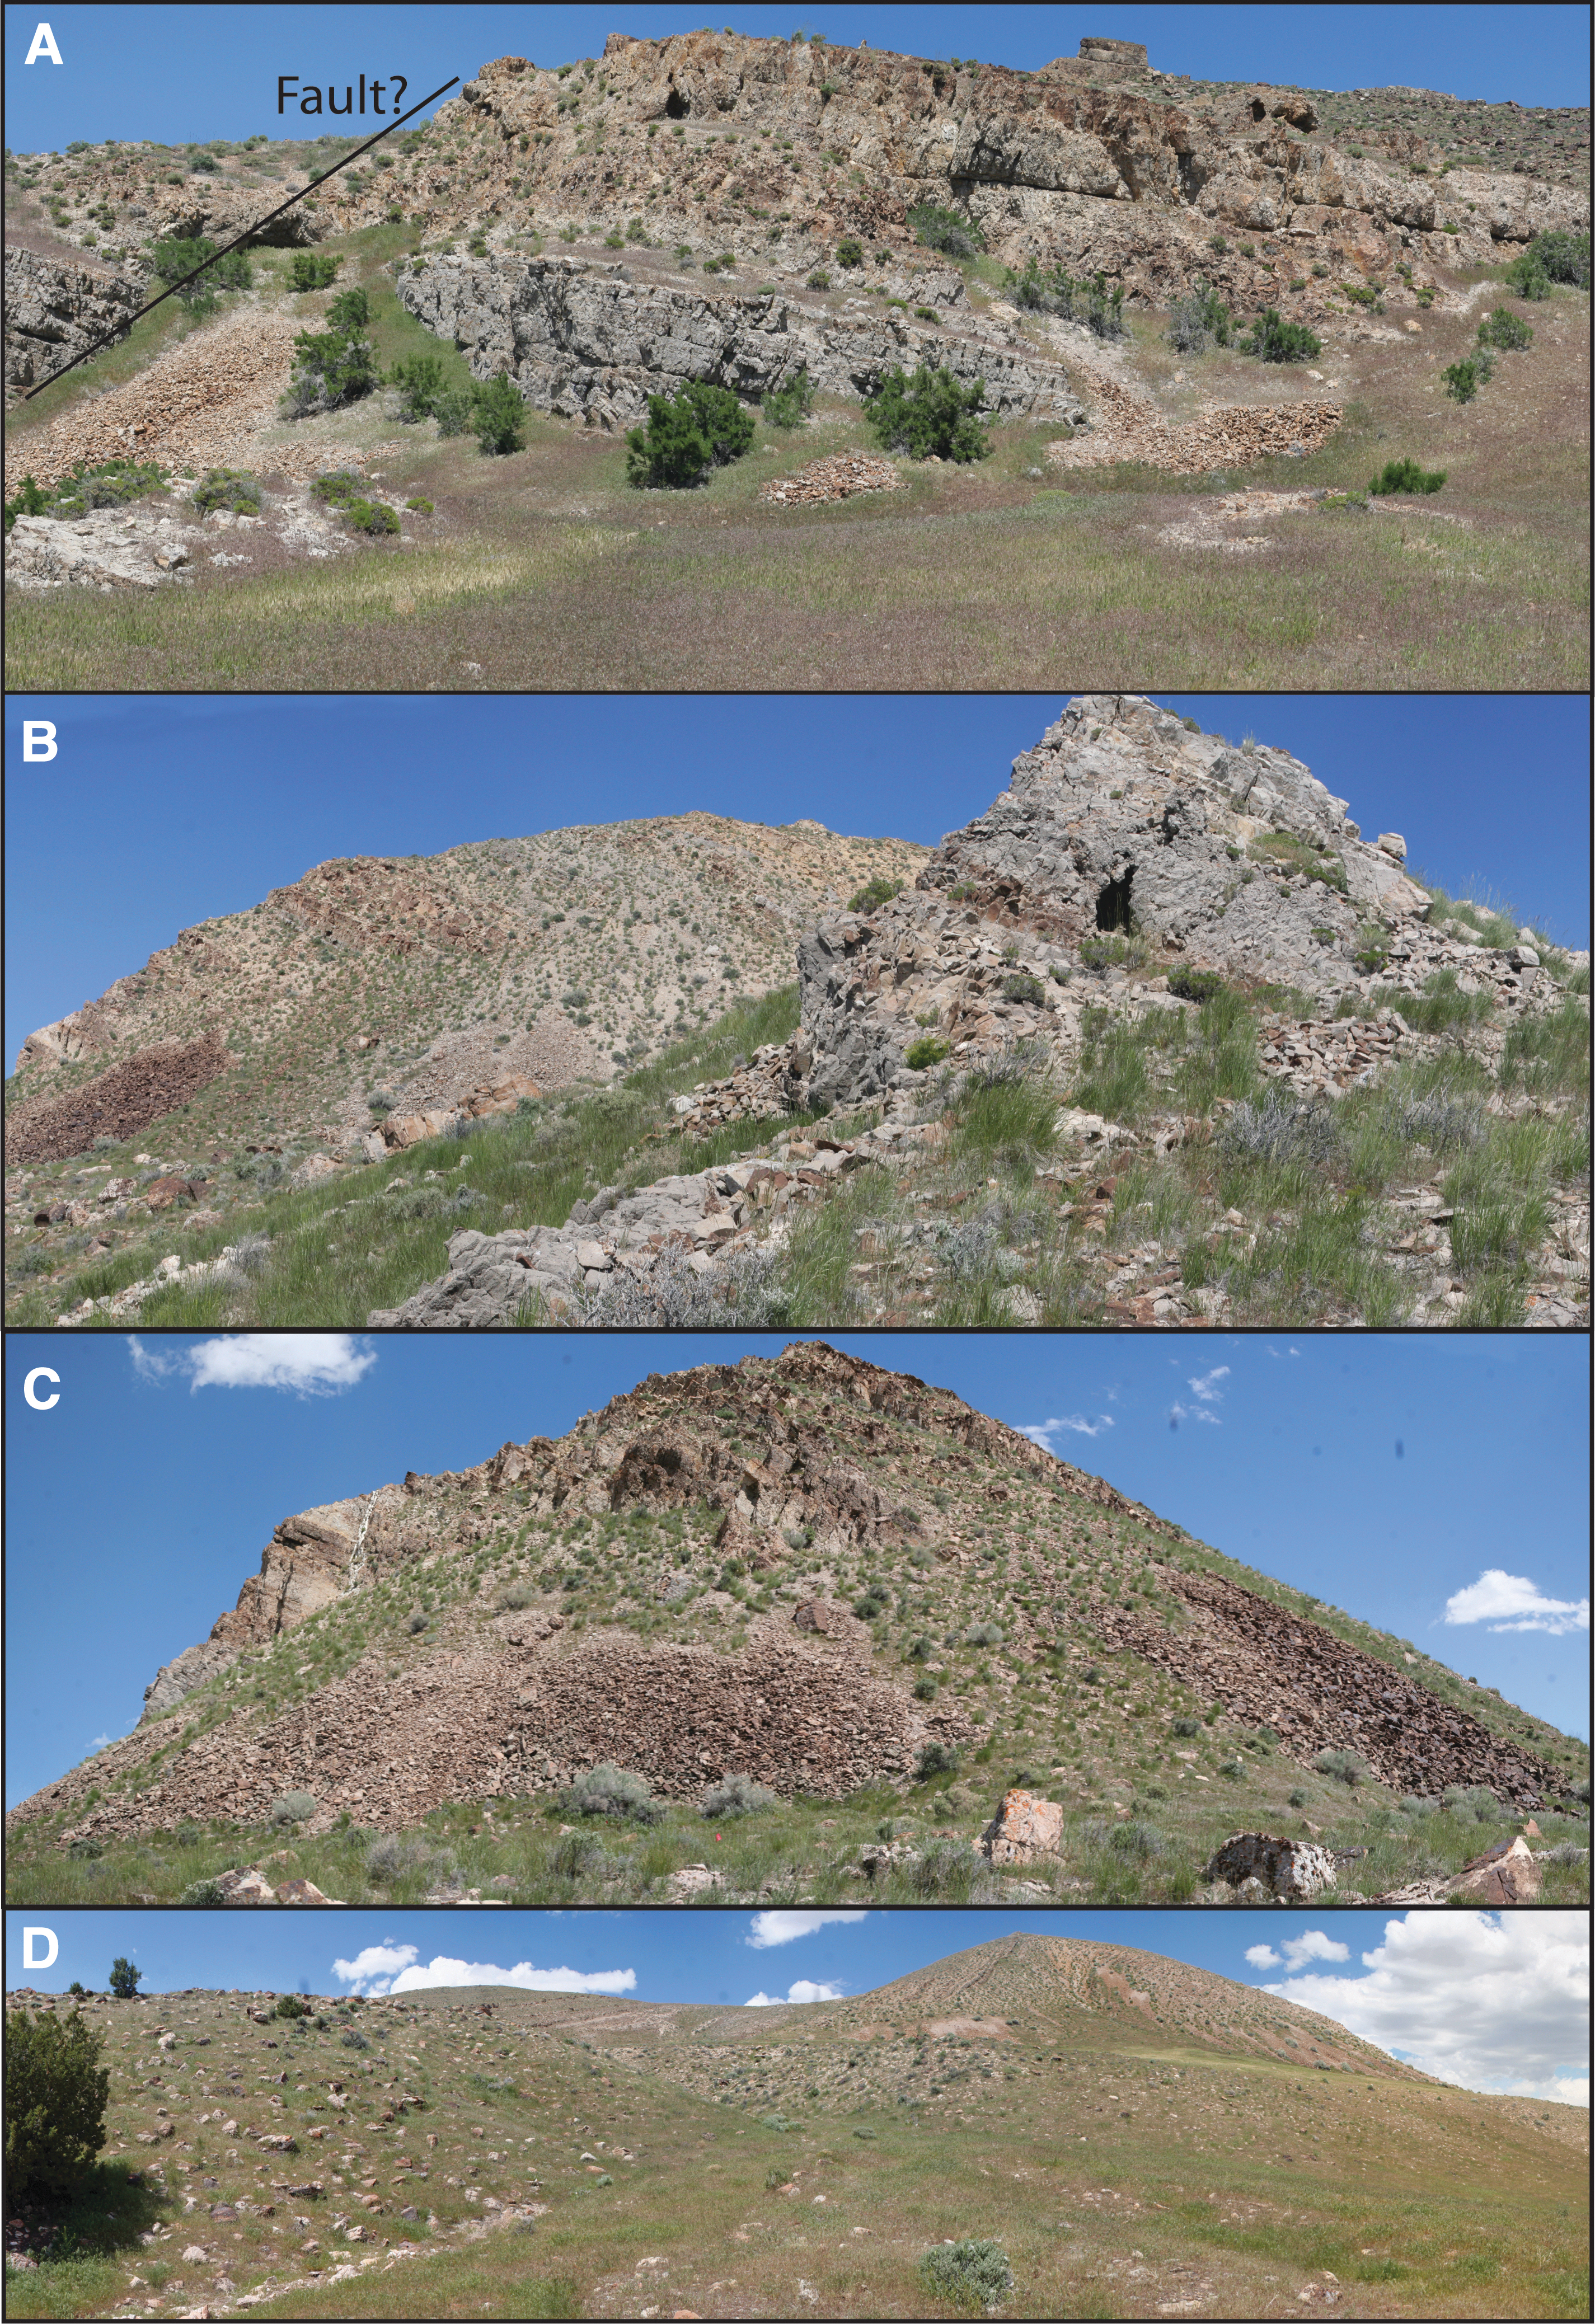
Tactically responsive team panorama mosaics for each campaign area.
Contact science data were particularly important in choosing which areas to sample, as they provided discriminatory clues to biosignature retention potential (e.g., grain size below sand; clay compositions; Fig. 8). The team chose to focus sampling efforts on primary lithologies with a higher biosignature potential and, as a result, acquired a sample set that was representative, although not inclusive, of the full range of diagenetic events from this ROI, that is, the dolomitic mudstone bedrock of ROI A (although not the chert.); jarosite-bearing dolomite in ROI B, as representing a potentially distinct hydrologic regime and thus a second interval of habitability; and for ROI C, carbonate bedrock.
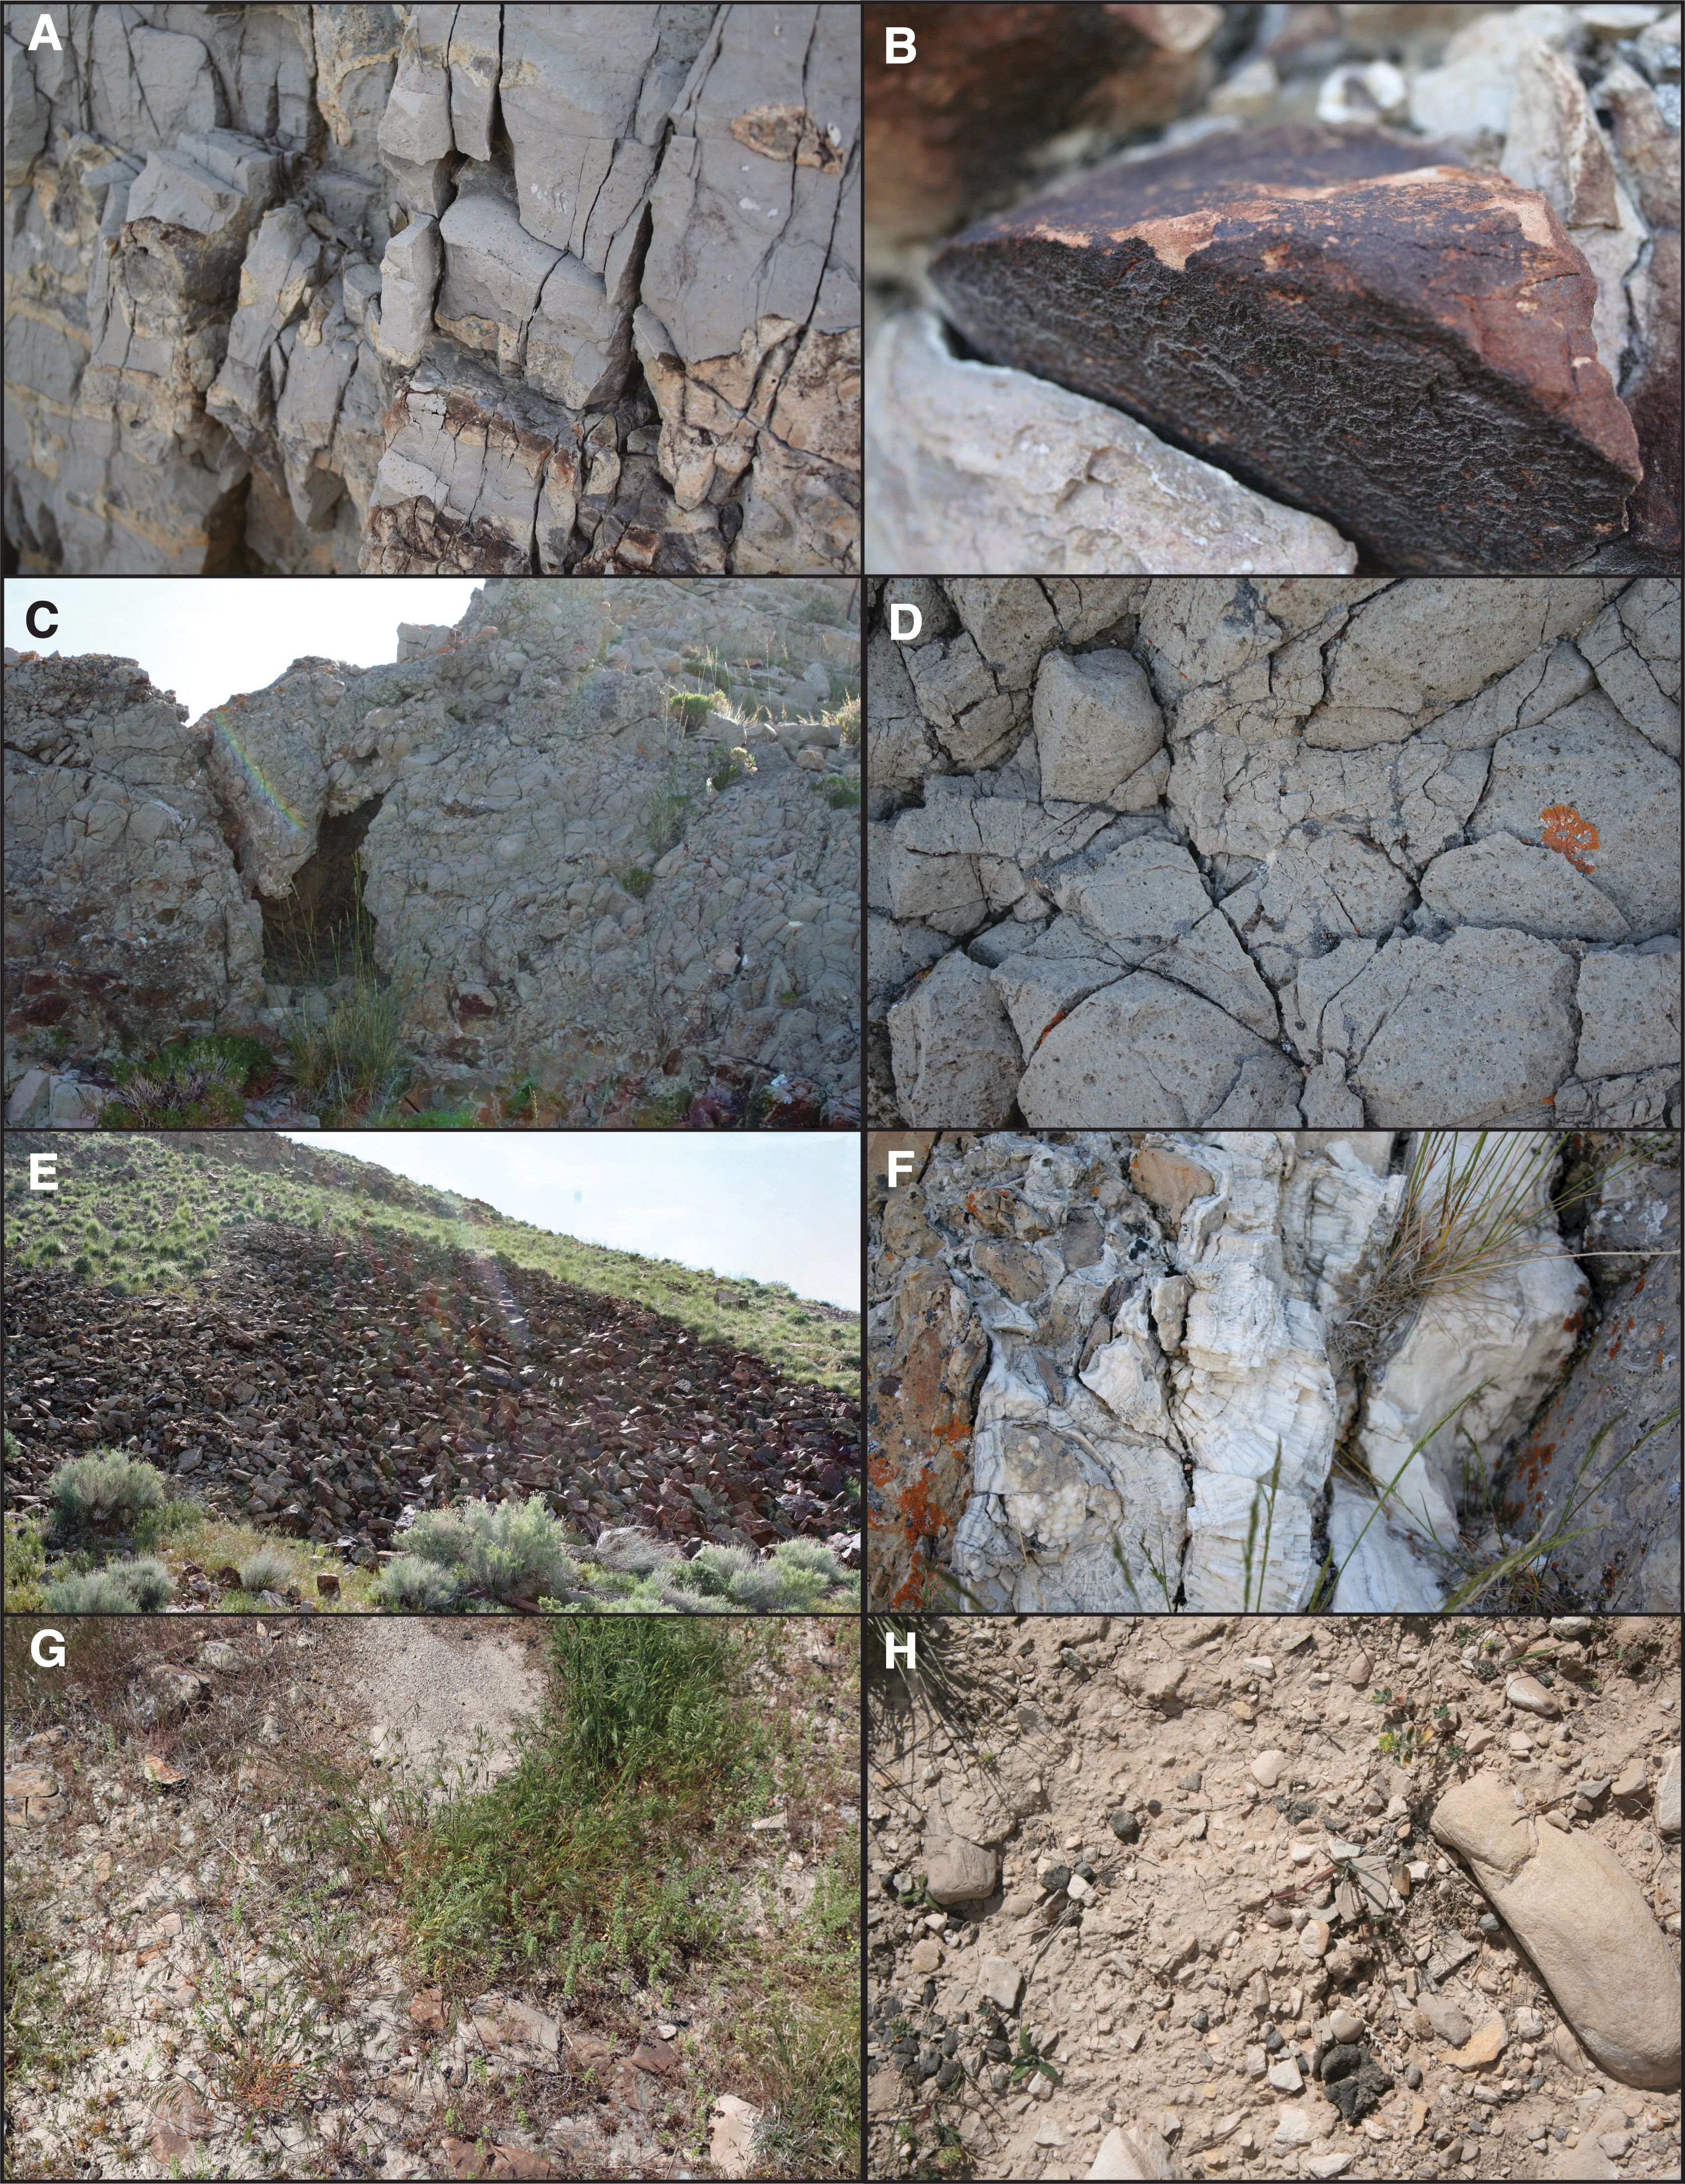
Context and hand-lens scale images acquired by the tactically responsive team.
Similar to the Strategic team, the Tactical team struggled with how to interrogate ROI D. Ultimately, the Tactical team chose to sample a silty potentially clay-bearing layer on the basin floor as having the highest potential for retaining biosignatures and organic matter, and rimming material as a potential shoreline deposit.
The Tactical team interpreted the field area to contain at least three temporally separate intervals of water activity and potential habitability. The first resulted in deposition of the chert-carbonate bedrock, which was interpreted to record aqueous deposition of carbonate rock. One or more episodes of secondary dissolution and mineral formation followed, resulting in the formation of chert nodules, dissolution to form karst features, cementation of karst, and calcite vein formation. Finally, the youngest aqueous environment, best observed in ROI D, included the development of a standing body of water with shoreline deposits and a clear inlet channel. Tactical team strategy, data, sample acquisition, and interpretations are summarized in Table 4 and described in detail in the Supplementary Material. The Tactical team used an estimated 56 sols to complete its observations.
Tactical Team Data and Interpretations
The ultimate goal of this field test was to better understand how a biologically relevant context or samples may be missed when highly constrained time and sampling goals must be met.
Deviating from the preplanned sol-by-sol traverse as little as possible required the Strategic team to weigh the anticipated benefits of an unplanned stop versus the sol cost under far more constrained conditions than those set by previous missions. In this study, we first compare the number of sols each team used to acquire both data and samples. We then qualitatively compare the science results that each team derived from the acquired data by assessing the key geologic features that each team identified and interpreted. The baseline of potential key features and interpretations that could be identified was not set by the current state of knowledge of the area, as those data were not provided to any GHOST team members, but by a combination of the prefield assessment of remote imaging and ground-based observations of the Tiger team during 2 days of field work.
This provides a more direct understanding of what a remote science team might reasonably expect to accomplish when interrogating a site for the first time, as is nearly always the case on Mars.
Sol cost
The sols spent by each team to interrogate the field site are recorded in Table 5, which shows that the Tactical team used 56 sols to complete the four campaigns, while the Strategic team used 55 sols—a difference of <1%. As was instructed at the start of the test, the time line for the mission was tightly constrained, and both teams remained within the estimated 60 sols expected for the test. Although the Strategic team dramatically changed the focus of its observations from its strategic plan, it worked to remain within the tight sol path defined by the test. The Tactical team also stayed within the sol constraints defined by the test, although it voiced a greater level of comfort with the constrained path.
Comparison of Sol Costs
Comparison of Sol Costs
Drive sols between campaign locations are not book kept, as the path between each campaign (and thus the sol cost) was identical for both teams.
The Tactical team felt confident that it could produce robust context and samples appropriate to science goals, even if it did not achieve an equivalent level of science in each of the four ROIs. By contrast, the Strategic team felt constant pressure to keep moving forward to the final ROI, which had been strategically determined to be the highest priority. As a result, the Strategic team ended up choosing a sampling site using only 2 sols' worth of data. Whereas the likelihood of making such a high-resource decision so rapidly is low on Mars, making such a decision with spotty contextual data is a common necessity in rover traverse planning, and the Strategic methodology, in particular, depends upon science teams preplanning sols days to weeks before in situ data are available.
In short, the results in this study suggest that the Strategic planning scenario yields negligible sol savings over an equivalent Tactical planning scenario, while decreasing the confidence in resulting interpretations and sample selection.
Table 6 shows the science results reported by the Strategic and Tactical teams, including feature identification and interpretation, compared with the key features assessed by the Tiger team.
Science Return Assessment Using Tiger Team Analysis as a Baseline for Determining Key Features of Interest
Science Return Assessment Using Tiger Team Analysis as a Baseline for Determining Key Features of Interest
If the operational team identified the feature or correctly interpreted it, that category is marked with a Y; if not, the category is marked N. If the correct identification or interpretation was one hypothesized during prefield assessment, it is marked with PFH; future data mining or discussion could potentially have led to the further interpretation of test data.
Both the Strategic and Tactical teams were able to identify the geologic features key to interpreting the nature of the site as recording a sequence of lake advances and retreats. Interestingly, however, these interpretations, which were determined through the prefield analysis of orbital data, were not translated—by either team—to the ground-based analysis. As a result, both the Strategic and Tactical teams focused their efforts on the local bedrock outcrops. Although this was productive in terms of science output, it was a very different outcome than what was initially planned for the test. The Strategic and Tactical teams found that the data key to decision-making for follow-on sols included cm-scale and μm-scale imaging (e.g., for characterizing layers and grain characteristics), and confirmation (or not) of orbitally derived geochemistry.
This dramatic difference in science focus was not apparent from the Tiger team results. Using traditional field geology methods, unrestricted by rover traversability and the time-limited constraints faced by the other teams, field assessment by the Tiger team resulted in observations of local bedrock that were nearly identical to those of the Strategic and Tactical teams. All groups recognized bedrock outcrops as consisting primarily of chert bearing dolomite with minor sandstone interbeds, as well as the presence of regional fractures which, at times, for instance in ROI C, contain mineralized fill. As was determined by the Strategic and Tactical teams, the Tiger team noted that these features likely record an extended geologic history of aqueous deposition, diagenesis, and secondary alteration.
The Tiger team, however, was also able to resolve a range of geologic materials associated with the geomorphic evidence for late-stage lacustrine deposition. This included most prominently the presence of tufa deposits in ROI B. Note that there is considerable controversy regarding the nomenclature for freshwater/continental/nonmarine carbonates. In this work, we refer to the carbonate coating bedrock as tufa, which is consistent with historic documentation, including the original descriptions of this region by King (1878) and Gilbert (1890) and the use of this term in the literature specifically associated with the Provo shoreline (e.g., Felton et al., 2003).
Most studies propose a biological role of algae or photosynthesizing cyanobacteria in the formation of tufa, while others suggest that degassing associated with wave action may be sufficient to drive carbonate precipitation (Felton et al., 2003; Capezzuoli et al., 2013). Despite the uncertainty in whether tufa formation was driven by biotic or abiotic processes, the association of tufa with biological processes resulted in this facies being classified by the Tiger team as the highest priority for sampling. In comparison, the Strategic team prioritized ROI D, and the Tactical team prioritized ROI D and the layered units in ROI A, without identifying the tufa deposit.
In ROI B, the Tiger team recognized a decameter-wide, gravel-covered topographic platform, inferred to represent a primary, wave-eroded shoreline. Along this platform, the Tiger team recorded evidence of carbonate phases that both cemented and draped eroded and brecciated bedrock exposures. Both the Strategic and Tactical teams recognized brecciation of bedrock in these regions, which they identified as potential karst dissolution, consistent with subaerial exposure at a lacustrine shoreline, but did not recognize draping elements of the tufa, which were exposed primarily along the uphill side of the ROI.
In a postexercise analysis, it was determined that the Strategic team did, in fact, image the tufa deposits (Fig. 9), but the imaging was completed as part of a routine 360° mosaic upon leaving the ROI and was not received until after the team left the ROI (a common occurrence when time is constrained; less critical data will be placed in a lower priority in the downlink packet, and would arrive subsequent to the planning cycle for the next sol). As a result, timely analysis of the mosaic did not occur.
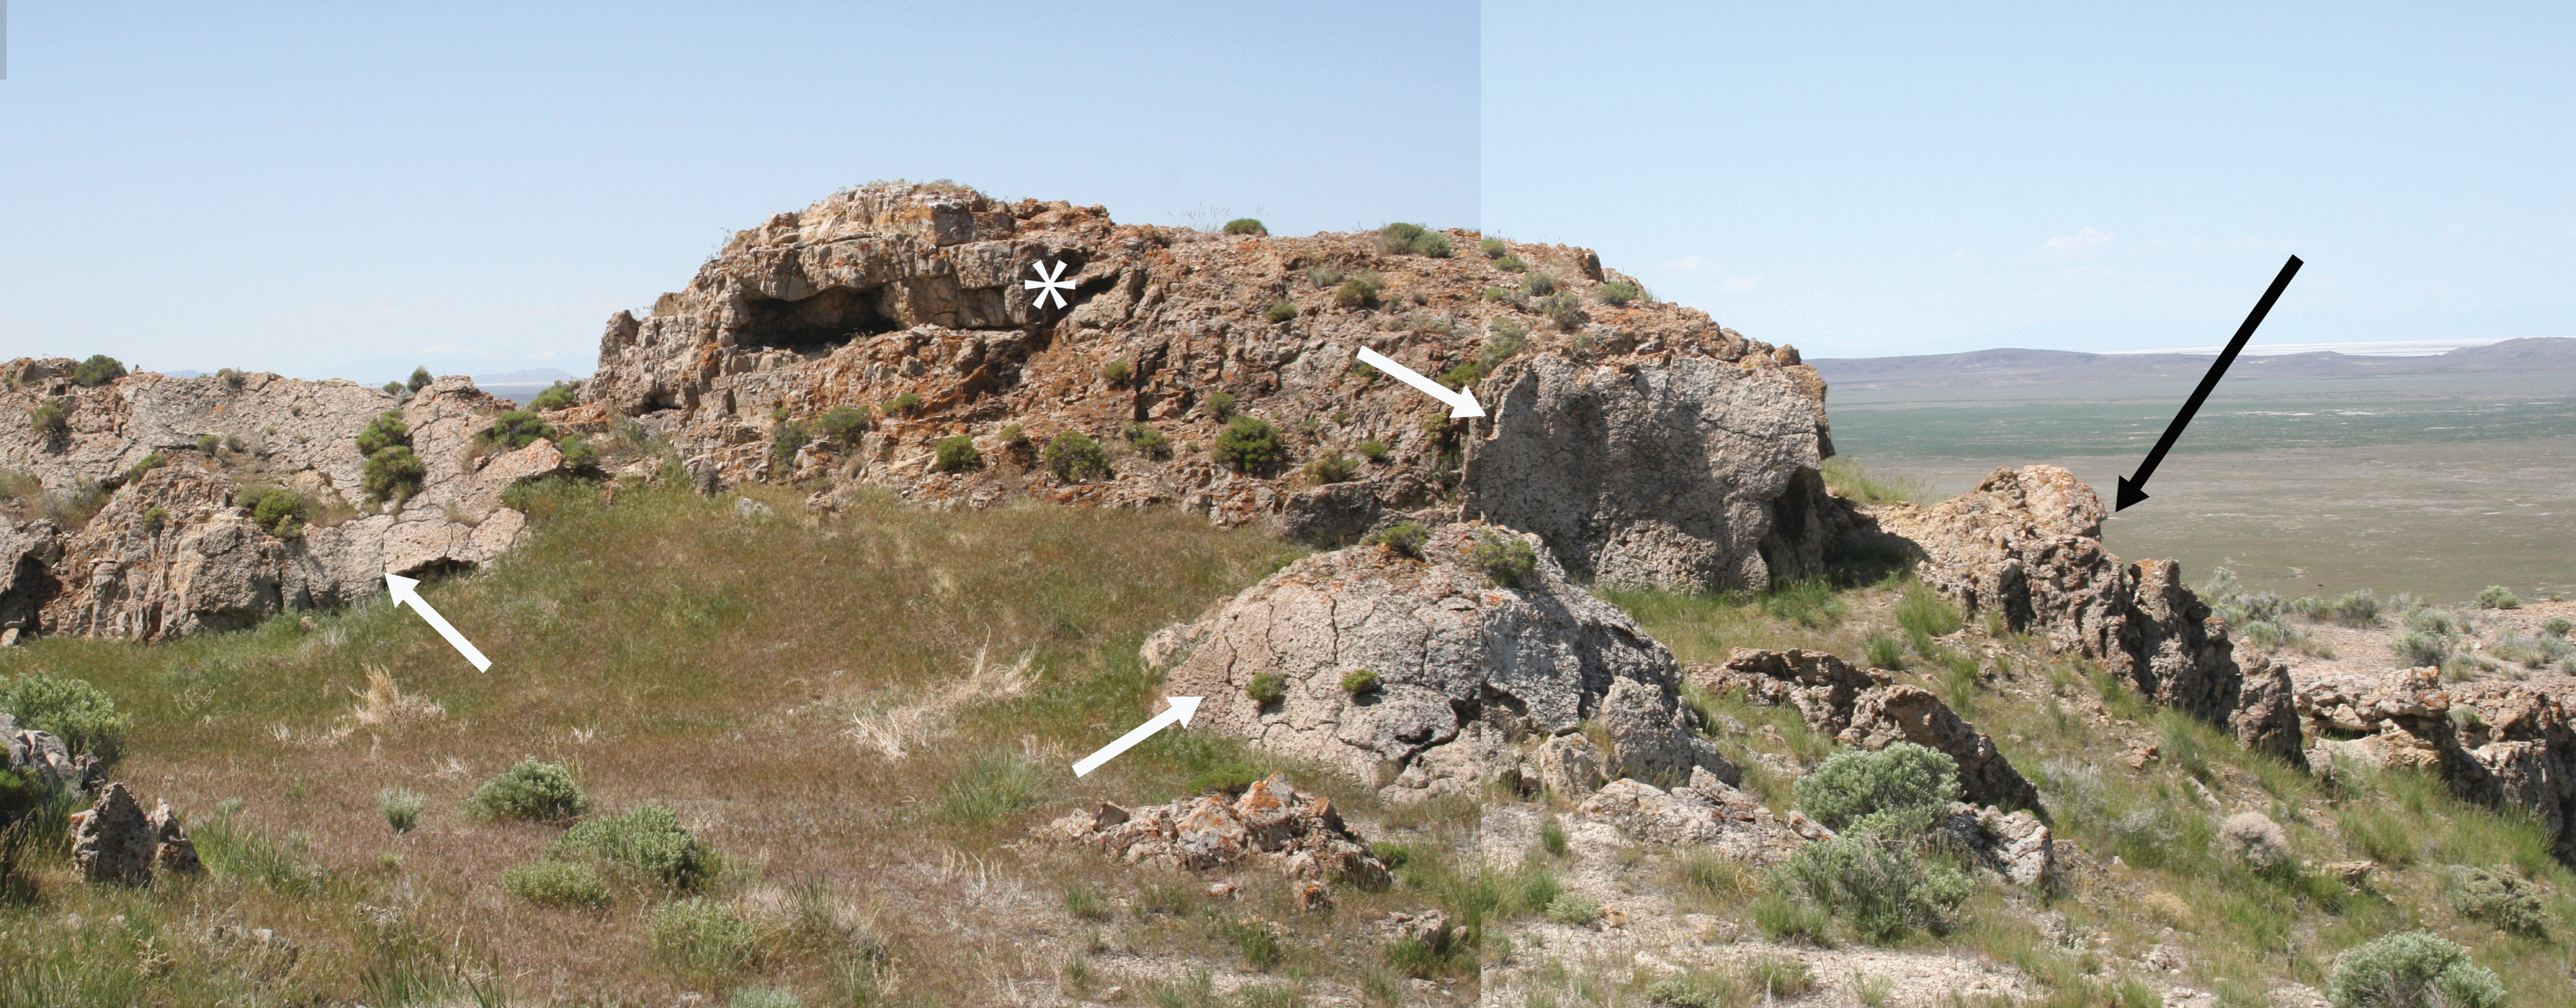
Tufa deposits in ROI B. Both strategically constrained and tactically responsive teams identified potential karst-related features on the downhill side (black arrow) of the main bedrock exposure (asterisk). Notably, neither team recognized outcrop coating associated with precipitation of tufa (white arrows). Abundant fracturing of the tufa suggests primary deposition as a hydrated carbonate phase. Protuberance under the black arrow is ∼2 m above the grassy surface.
Similarly, in ROI D, the Tiger team recognized both the downhill bounding gravel bar deposit associated with a prominent shoreline deposit, and an uphill inlet channel. As with the prefield assessment by the Strategic and Tactical teams, these features were inferred to represent the past presence of an ephemeral to perennial lake. Analysis by the Tiger team suggests that this lake (or potentially lake-side lagoon) may have been 5–8 m deep. Deltaic deposits were identified by gravel-rich layers based on the rounding of pebbles and gravel. Whereas this site was considered high priority for sampling by both teams due to its likely lacustrine history, the Tiger team did not identify any obvious locations where the evidence for life would be easy to sample.
In addition, the high stratigraphic placement of the lake deposit (above the more ancient deposits) indicated that the facies was likely not within the time frame of interest.
Notably, ROI D was considered the highest priority for sampling by both teams, while the feature deemed by the Tiger team to be of highest priority for sampling was not recognized by either operational team. As earlier noted, neither the Strategic nor the Tactical team chose to do a reconnaissance pass before choosing sample sites; in both cases, the teams felt that the small size of each ROI, coupled with the tight time constraints, would make the reconnaissance pass unnecessary. However, in this case, the diagnostic features were only visible if the team moved to a different viewing angle than the initial approach to the ROI; if either team had chosen to do a reconnaissance pass of the site first, the tufa deposit might have been identified.
The Strategic team did, in fact, capture these deposits in images on the way to the next ROI, but these images were not assessed at a point where it was possible to make a decision to revisit this unique lithology without committing to completely break the strategic timeline. Thus, although both teams noted that, in the interests of time, they did not conduct a reconnaissance pass that included regional imaging from different viewpoints, both teams confirmed that they would have actually saved time by using the reconnaissance pass methodology. The teams believed this was due to the nature of rover-driven science, which consists of a series of very narrow views separated by broad swaths of uninterrogated landscape; the reconnaissance pass allows more of these gaps to be filled by data.
The conclusion is that the reconnaissance pass is an essential tool for science operations, especially in cases where the sol path is highly constrained. In such cases, the reconnaissance pass provides contextual data systematically, without the time pressure of having to make rapid decisions based on an incomplete picture of the site.
The other geologic feature that was not identified or interpreted correctly by either team was the series of shorelines of the former Lake Bonneville. The reason for this is likely that the shorelines, although potentially viewable from orbital images, were subtle when seen from the ground and were best inferred by having multiple different wide-field views of the region. The Tiger team, in fact, did not identify a clear shoreline until ROI B, and only after spanning several scales at both the ROI A and B locations. With respect to identifying similar features on Mars, we note that shorelines are subtle macrofeatures and potentially extensive across the landscape, meaning that consistent observations made over time could help build the evidence needed to identify and test the hypotheses regarding possible shorelines.
Finally, the sample acquisition profile for each team is similar for ROIs A to C; both teams acquired a single sample at each of the first two ROIs and multiple samples at ROI C. Sampling, however, reflected different stated goals, in which the Strategic team focused on understanding the nature and timing of fluid events within the overall geologic history of the region, and the Tactical team focused on understanding the range of dolomite/chert deposits and how they were deposited. Both teams, however, focused their efforts on acquiring samples that had a high likelihood of retaining biosignatures, and so, both teams acquired multiple dolomite/chert samples.
Additional samples were chosen to contextualize the geologic story in space and time.
In terms of sol cost, although sol conservation drove every planning period of the Strategic team, there was in the end a <1% difference in sol cost between the two methods or <10 sols over a 1000-sol period. Although the driving rationale each team chose was different, science return from each method, as judged by correct interpretations, was similar. In terms of the appropriateness and science value of sample caches, both caches provided important information about biosignatures, but neither team focused its efforts on the highest priority site identified by the Tiger team. We note, however, that only the Strategic team noted that it had purposely saved sample slots for the last ROI (ROI D), and thus it judged the sample collection to be nonoptimal. Three of the Strategic team's samples were acquired at ROI D, while no samples were acquired by the Tactical team in this location.
The Strategic team chose to collect these samples as a way to acquire information about the site when few sols were left, the rationale being that the samples could be assessed after the fact. This difference is thus a product of sol constraints, rather than an indication of qualitative differences in hypothesis development. The preplanning experience (with orbital data) was straightforward and valuable for team building, but the first day of surface operations revealed surprises that necessitated a restructuring of the plan. This indicates that preplanning is a crucial first step that is nevertheless limited in its long-term usefulness in many real-world cases. For this case, the inescapable conclusion is that the additional effort the Strategic team put into preplanning sol paths did not result in a sol cost savings, improved science return, or optimal biologically relevant sample collection and was thus not an efficient investment.
We confirm the previous conclusions (Yingst et al., 2016, 2018, 2020) that any methodology is more likely to result in missed important science without utilizing the reconnaissance pass. Decisions regarding whether to further interrogate or sample a target are of necessity made regularly without an optimal context in a rover operation scenario. In addition, time pressures often necessitate driving away from a site before all data from that site have been downlinked to Earth, meaning that data will not be down in time to inform the next sol's plan.
It is thus important to acquire observations designed to build up contextual information, while avoiding the situation where downlink of that data is too late to feed into the next plan. This is crucial for reasonable hypotheses to be posed and tested; it allows more localized or discrete features to be identified and provides more opportunities for subtle clues to be captured, strategically if not tactically.
In those situations where a reconnaissance pass is impractical or impossible, systematic observations—a sequence of repeatable, resource-light remote observations—may provide an additional context that increases confidence in identifications and interpretations. That confidence is crucial when approaching a tactical decision point to remain on the planned sol path or change it. This is true not only in support of hypothesis development, but also in virtual returns to sites long passed, to evaluate them with subsequently acquired data and knowledge. Because detailed observations are only made in limited locations with a rover, the acquisition of systematic images provides not only context but also insurance against returning to a location by providing data in-hand to investigate new hypotheses without the need to drive back.
Such observations might include placing reconnaissance stations in areas where orbital data may not reveal obvious targets of interest or acquiring 360° color imaging regularly to determine whether additional data collection is warranted. Such imaging can be planned to minimize data volume resources and can allow scientists to survey the terrain and evaluate any rock texture changes.
Facies variations can be subtle and below the resolution limit of orbital image and spectral data. For example, Stations A3 and C1 both contained geologically interesting targets that were not recognizable in orbital data. Although Station A3 was identified as of interest in the strategic plan, this location was not well evaluated during the test; the Tactical team reviewed the data only after the rover exited the area and the Strategic team descoped the site to save time. The light-toned vein in ROI C was evident in imaging at C1, but not detectable in orbital data. This vein contained the only clues to the secondary fluid event that formed it, but it would have been missed without panoramic ground-based imaging.
Both teams used orbital data extensively to design the hypotheses and plan traverses that would test those hypotheses. In addition, in situ confirmation and detailed expansion of expected geochemistry were an important discriminator in the Strategic team's decision to alter its original strategy. However, once this initial assessment was completed, the team found that the geochemistry was well predicted by the revised hypotheses, and it was not used again to refine or change the planned traverse. The Tactical team results were similar; they determined from initial data in each ROI that the geochemistry was as expected. And while it was used to confirm or refine hypotheses, it was not used to alter the course.
The point-to-point nature of data collected remotely means that often the dots do not connect fully, or there are not enough dots to resolve a diagnostic feature. As noted above, this problem is exacerbated by downlink limitations, such that many images of some locations are downlinked after departure. The ability to rapidly assess from micro- to macro- to mesoscale as needed was an ability the Tiger team used to great effect to understand how regional features connected to the local geology; it was this that allowed the subtle shorelines to be identified and interpreted.
The rover-based teams, on the contrary, were unable to make this jump, and thus, the connection between orbital data originally interpreted as rock layers and the discontinuous expressions of these features on the ground was missed. The rover teams also struggled to determine the nature of the fractures at ROI C as tectonic or evidence of a larger intrusive structure such as a dome; by comparison, the relationship of the large fracture with the surrounding layers made the tectonic origin clear to the Tiger team. The use of three-dimensional immersion tools, such as hololenses used to project data from the Gale crater into a virtual reality environment (Abercrombie et al., 2019), would give remote geologists a way to span scales as terrestrial field geologists can do. This would save time and improve science output.
Several lessons were learned during this field excursion: Strategic science planning must account for terrain. Site characterization is particularly difficult when climbing upslope due to the limited viewshed. In addition, while rover traverses nearly always head uphill, certain features, such as tufa deposits, will often be best viewed by looking back along the traverse route. We note also that the results of this test indicate that the spacing of panoramas is highly dependent on the relief in the region and the frequency of other image data acquisitions (e.g., drive direction mosaics). Where there are topographic obstructions, imaging opportunities should be increased to less than the distance between obstructing topographic features. In flat regions, >50 m spacing may be sufficient to assess the textural variability; note that the MSL adopted an ∼300 m spacing for 360° panoramas for a large portion of the mission (Vasavada et al., 2014). To minimize resources used, data can be prioritized to image outcrops, with care taken to obtain multiple viewing angles (e.g., front and back views). Caution must be exercised in planning traverses around chemical signatures at the expense of systematic site characterization. Spectral data tend to provide insight into chemical components to be expected at the site as a whole. It should be noted, however, that minor abundances of certain minerals can dominate spectra but do not always imply an unusual abundance of the mineral itself (e.g., Rampe et al., 2020); this can lead to deviations from the sol path that may not result in furthering mission goals. In this test, it was not a specific technique that was of concern, but the general problem that arose when a signal of interest did not yield the expected mission-specific result in situ. In addition, in some cases, a strong spectral signature is more indicative of a relatively dust-free location rather than a lithologic difference from the surrounding areas. Spectral data provide important insight to the strategic formulation of the geologic hypotheses to be tested in situ but should not necessarily be the sole reason for selecting a route in cases similar to the one tested here. We recommend that, in a highly constrained timeline, orbital data be considered secondary to in situ data when traverse planning, once on the ground. Mars analog tests over several years (Yingst et al., 2015, 2016, 2018) indicate that, when traversability is not a variable, teams rarely deviate more than a few 10s of meters from the traverse planned using orbital data, meaning that teams are relatively skilled at picking out the scientifically richest places to explore in situ. The time and effort invested in understanding and utilizing orbital data to preplan traverses are crucial; but once that investment is made, the usefulness of the data for traverse planning is minimal. Thus, we suggest not investing significant time in fine-tuning traverse planning from orbital data; in situ data are more valuable.
As a final note, this and previous tests represent complex geology real-world tests, in which it was expected that remote teams would miss important clues to the geologic story. Nevertheless, the GHOST tests consistently reinforce the fact that, although remote geologists will miss some geologic clues, the first-order story tends to be accurately inferred from data gathered through rover-enabled methods, regardless of the method used. It is hoped that the lessons learned here will help future remote science teams continue to refine their methods, and thus miss fewer and fewer of those clues.
Footnotes
Acknowledgments
The authors wish to gratefully acknowledge the careful work of two anonymous reviewers of this article.
Author Disclosure Statement
No competing financial interests exist.
Funding Information
This work was funded by the NASA PSTAR program (grant NNX15AI89G). Additional support was provided by the Utah Geological Survey (UGS).
Supplementary Material
Supplementary Material
Abbreviations Used
References
Supplementary Material
Please find the following supplemental material available below.
For Open Access articles published under a Creative Commons License, all supplemental material carries the same license as the article it is associated with.
For non-Open Access articles published, all supplemental material carries a non-exclusive license, and permission requests for re-use of supplemental material or any part of supplemental material shall be sent directly to the copyright owner as specified in the copyright notice associated with the article.