
Abstract
Capillary electrophoresis (CE) is a promising liquid-based technique for in situ chemical analysis on ocean worlds that allows the detection of a wide range of organic molecules relevant to the search for life. CE coupled with mass spectrometry (MS) is particularly valuable as it also enables the discovery of unknown compounds. Here we demonstrate that CE coupled to MS via electrospray ionization (ESI) can readily analyze samples containing up to half the saturation levels of salts relevant to ocean worlds when using 5 M acetic acid as the separation media. A mixture containing amino acids, peptides, nucleobases, and nucleosides was analyzed in the presence of two salts, NaCl and MgSO4, based on their relevance to Europa and Enceladus. We demonstrate here CE-MS limits of detection for these organics ranging from 0.05 to 1 μM (8 to 89 ppb) in the absence of salts. More importantly, we demonstrate here for the first time that organics in the low micromolar range (1–50 μM) are detected by CE-MS in the presence of 3 M NaCl without desalting, preconcentration, or derivatization. This demonstration highlights how CE-MS is uniquely suited for organic analysis on future missions to ocean worlds.
Introduction
Ocean worlds in our solar system have captivated the attention of scientists due to the presence of liquid water that could make it possible for these worlds to harbor life. Europa and Enceladus, the moons of Jupiter and Saturn, respectively, are two of the targets being considered for future in situ life-detection missions (Tsou et al., 2012; Reh et al., 2016; Hand et al., 2017; Eigenbrode et al., 2018a; Cable et al., 2021).
All life on Earth shares a remarkably invariant biochemistry and is built from a selected set of organic molecules that includes 22 amino acids, 5 nitrogenous bases, a few monosaccharides, and long-chain fatty acids (McKay, 2004). This selection leads to patterns in the distributions of organics that are indicative of biotic processes. A powerful approach in the search for life involves seeking such biochemical signatures of life at the molecular level. Separation science is key to obtain such chemical distributions as it allows the identification and quantification of individual species in complex samples. Although there are many technologies being developed for in situ chemical analysis (Poinot and Geffroy-Rodier, 2015), to date, missions of exploration have all relied on gas-phase techniques for this task (Sternberg et al., 2007). Missions to Mars (Biemann et al., 1976; Mahaffy et al., 2012; Leshin et al., 2013; Eigenbrode et al., 2018b), Titan (Lebreton and Matson, 2002; Niemann, 2002; Lebreton et al., 2005), and the comet 67P/Churyumov-Gerasimenko (Boehnhardt et al., 2017), have relied on gas-phase chromatography as the separation technique for in situ chemical analyses, which has limitations for the detection of specific organic molecules associated with biosignatures (Stalport et al., 2012). The liquid-based separation technique of capillary electrophoresis (CE) overcomes the limitations of gas-phase techniques and holds unique promise in the search for signatures of life on ocean worlds. CE is a high-resolution separation technique for molecules in solution that allows the analysis of a broad range of compounds by using a relatively simple instrumental setup (Mora et al., 2012; Willis et al., 2015; Zamuruyev et al., 2021). CE separations occur within small-diameter glass capillaries (25–100 μm i.d.) filled with a background electrolyte (BGE). One key advantage of CE for in situ analysis is the fact that it only requires small amounts of samples (10–100 μL) and electrolyte solutions (mL). Regardless of the particular mission, a CE instrument only needs to carry a few milliters of reagents (5–10 mL), and most of the reagents used for analysis have already been demonstrated to survive long-term storage and high radiation levels (Creamer et al., 2018, 2019; Ferreira Santos et al., 2022).
Although CE can be coupled to multiple detectors, laser-induced fluorescence has been the main focus for extraterrestrial application as it provides the best sensitivity for analysis of amino acids (including chirality) (Hutt et al., 1999; Skelley et al., 2005; Aubrey et al., 2008; Chiesl et al., 2009; Benhabib et al., 2010; Mora et al., 2011, 2012, 2018, 2020; Willis et al., 2015; Creamer et al., 2017). On the other hand, mass spectrometry (MS) is particularly attractive for planetary exploration because it adds another separation dimension based on mass-to-charge ratios (m/z) (Zhao et al., 2012). The coupling of CE and MS gives rise to an impressive analytical tool that combines the high-resolution power of CE with the high sensitivity and selectivity of MS for detailed characterization of biomolecules (Nesbitt et al., 2008), and more importantly the identification and discovery of unknowns in complex mixtures. We have recently reported on the development of a CE instrument that can be coupled to multiple detection systems, including laser-induced fluorescence and MS (Zamuruyev et al., 2021).
Although there are multiple ionization techniques to couple CE to MS (Hommerson et al., 2011; Stolz et al., 2019), the most common one is electrospray ionization (ESI) (Yamashita and Fenn, 1984; Fenn et al., 1989). With ESI, the compounds that are separated by CE can be efficiently transferred from the liquid phase into the gas phase. ESI takes place at atmospheric pressure and is a relatively soft ionization mode that minimizes fragmentation. Because the performance of ESI significantly improves with a reduction in flow (Wilm and Mann, 1996), by interfacing the naturally nanoflow-rate CE separations (10–50 nL/min) with ESI, a higher MS sensitivity is obtained.
Since the first demonstration of online ESI of a CE effluent in 1987 (Olivares et al., 1987), a variety of interfaces have been designed to enable the coupling of CE and ESI-MS (Maxwell and Chen, 2008; Ramautar et al., 2012). Although both sheath liquid and sheathless interfaces have been proven to enable the coupling of CE with ESI-MS, sheathless interfaces operate with nano-electrospray ionization and have been demonstrated to provide a better ionization efficiency and suffer less from ionization suppression (Haselberg et al., 2010; Faserl et al., 2011; Jarvas et al., 2016).
Mass spectrometry has enabled some of the most significant discoveries related to the chemistry of Enceladus' plume, including the detection of hydrogen, ammonia, and organic molecules (Waite et al., 2006, 2009, 2017; Postberg et al., 2018; Khawaja et al., 2019). Both of the mass spectrometers on board the Cassini spacecraft, the Cosmic Dust Analyzer (Srama et al., 2004) and the Ion and Neutral Mass Spectrometer (Waite et al., 2004) relied on hard ionization techniques (impact ionization and electron ionization, respectively), which lead mostly to the detection of fragments, although molecular species can also be detected in some cases. These instruments do not rely on a separation step prior to detection by MS and can analyze both gases and ice particles but not liquid samples. By combining a liquid-based separation technique with MS it is possible to identify and quantify individual compounds in order to obtain the distributions of organics with higher sensitivity. The combination of CE and MS is particularly attractive in this regard because it does not require the use of high-pressure pumps or packed columns.
Capillary electrophoresis and its miniaturized version (microchip electrophoresis) are widely used techniques for analysis of a variety of samples in terrestrial laboratories (Breadmore, 2012; Stolz et al., 2019; Chen et al., 2021; Kartsova et al., 2021; Patel et al., 2021; Ta et al., 2021; Zhang and Ramautar, 2021) and are also highly tolerant to the presence of salts (Creamer et al., 2017; Ferreira Santos et al., 2018; Jaramillo et al., 2021). As such, this technique is ideally suited for future missions to ocean worlds. Europa and Enceladus are considered prime targets for such missions. Multiple mission concepts for these moons have been proposed, including sampling from the surface or plumes (Tsou et al., 2012; Reh et al., 2016; Hand et al., 2017; Eigenbrode et al., 2018a; Cable et al., 2021). A CE-based instrument could analyze both surface or plume samples following melting of ice and/or addition of a small amount of water. Estimates of ocean salinity at Europa and Enceladus place the total salt concentration within a factor of ∼2–3 greater or less than Earth's ocean (Hand and Chyba, 2007; Glein and Shock, 2010; Postberg et al., 2011). Thus, native samples may contain significant amounts of salt that must be dealt with by any analytical instrument included in the payload of future missions aimed at investigating biosignatures in these environments. Furthermore, inhomogeneity of surface ice samples due to a variety of processing mechanisms could lead to even higher salt content, with the Europa lander mission concept requesting that instruments be prepared to handle samples containing up to 30% salt (Hand et al., 2017). Thus, methods for chemical analysis developed for such missions should be compatible with the presence of both water and salts in the samples.
Similar to Earth's oceans, both Europa's and Enceladus's oceans are expected to contain sodium (Na+) and chloride (Cl-) ions among their major constituents (Postberg et al., 2009; Hand and Carlson, 2015; Johnson et al., 2019). At Europa's surface there is also evidence for potentially significant amounts of both magnesium (Mg2+) and sulfate (SO4 2-). The composition of superficial salts is also poorly constrained as observations and various modelling efforts suggest that MgSO4-hydrates, NaCl, and Na2SO4 may be the dominant (or one of the dominant) species (Carlson et al., 1999; Hand and Carlson, 2015; Johnson et al., 2019). At Enceladus, carbonate (CO3 2-) is also an important constituent but does not drive the overall ionic strength of the ocean (Postberg et al., 2009).
Based on the major constituents potentially expected in the oceans of Enceladus and Europa, and conscious of the nature of ions that can prove challenging to CE methods, we used NaCl and MgSO4 salts to evaluate the effect of Na+, Mg2+, Cl-, and SO4 2- on the detection of a wide range of organics by CE-MS using a sheathless interface. We have selected a mixture of amino acids, peptides, nucleosides, and nucleobases for this study, all of which are building blocks of the main polymers of terrestrial biology and are associated with at least one of the rungs of the Ladder of Life (Neveu et al., 2018).
Experimental Section
2.1. Reagents and solutions
All chemicals were analytical reagent grade and used as received. Sodium hydroxide (NaOH), hydrochloric acid (HCl), methanol, and acetic acid were purchased from Fisher Scientific (Fair Lawn, NJ). All aqueous solutions were prepared using 18 MΩ·cm water. Sodium chloride, magnesium sulfate, amino acids and peptides (L-leucine, L-alanine, β-alanine, L-histidine, glycine, L-valine, L-serine, L-aspartic acid, L-glutamic acid, γ-aminobutyric acid (GABA), 2-aminoisobutyric acid (AIB), Gly-Gly, Gly-Gly-Gly, Leu-Leu-Leu, and Phe-Val) were purchased from Sigma-Aldrich (Saint Louis, MO). Isovaline was purchased from Arkpharm Inc. (Arlington Heights, IL). Cytosine, adenine, guanine, uracil, cytidine, adenosine, guanosine, thymidine, and uridine were obtained from Across Organics (Pittsburgh, PA). Stock solutions of each compound were prepared in water and kept in the refrigerator (4°C) when not in use. A stock solution containing all compounds was prepared (300 μM each) and kept in the refrigerator (4°C) when not in use. This solution was used for all the experiments described here by performing the appropriate dilution.
Calibration curves were obtained with concentrations ranging from 50 nM to 50 μM in the absence of salt and 1–90 μM with NaCl. Experimental limits of detection (LODs) were determined as the minimum concentration with a signal-to-noise ratio (S/N) of 3. LODs in nanomolar or micromolar were converted to micrograms per liter, which is equivalent to parts per billion.
Instrumentation
Separations were performed on a CESI 8000 instrument from SCIEX (Brea, CA) coupled to a 3D quadrupole ion trap mass spectrometer (LCQ Fleet MS, Thermo Electron North America LLC, Madison, WI) via a Nanospray Flex MS source (Thermo Electron North America LLC, Madison, WI). A diagram of the experimental setup and a photograph of the instruments are provided in the Supplementary Material (Fig. S1). The mass spectrometer scan was set to 70–400 m/z. The inlet capillary temperature was set to 175°C, and ESI voltage was 1.2 kV.
The interfacing of CE and ESI-MS is achieved through the use of a separation capillary having the outlet etched with hydrofluoric acid to provide an outer terminus porous to the flow of small ions (Moini, 2007; Busnel et al., 2010). A conductive liquid capillary is used to close the circuit. Advantages from this design include a reduction in the voltage required to drive ESI, the separation of the ESI process from bubble formation due to electrolysis, and reduced clogging due to the uniformity of the capillary inner diameter (Busnel et al., 2010). Bare fused silica capillaries (OptiMS Cartridge, PN B07367) with a porous tip for electrospray were obtained from SCIEX (separation capillary: 91 cm × 30 μm i.d., conductive liquid capillary: 70 cm × 50 μm i.d.). The cartridge and sample storage temperatures were set at 25°C and 10°C, respectively. These settings were used for all the experiments described here.
Brand new capillaries were conditioned according to the specifications of the supplier. The separation capillary was sequentially rinsed with methanol, water, 0.1 M NaOH, 0.1 M HCl, and water for 10 min each, and finally with BGE for 20 min. The conductive liquid capillary was sequentially rinsed with methanol, water, and BGE for 3 min each. Each rinsing step was performed at 100 psi.
At the beginning of each day of experiments, the separation capillary was conditioned by rinsing for 10 min at 100 psi with 0.1 M NaOH water, 0.1 M HCl, and water, followed by a 10 min rinse with BGE. To maintain the surface of the capillary, a rinse protocol of 2.5 min at 100 psi with 0.1 M NaOH, 0.1 M HCl, and 4 min with water, followed by 4 min with BGE was used prior to injection. Pressure injections of 2 psi for 20 s were used unless specifically mentioned. This corresponds to a volume of ∼7 nL. All separations were performed with a separation voltage of 20 kV while applying 2 psi of pressure to the inlet of both capillaries. Although application of pressure is not required for high-quality separations, it was used here because this is expected to provide the most efficient and robust instrument operation during spaceflight. Not only does application of pressure reduce the total time required for a particular separation (a key consideration during mission operations), but this also ensures that flow is maintained even if electroosmotic flow were to cease.
Natural samples
Natural samples were collected at Mono Lake, California, from a representative site in the deepest part of the south basin (37.95739 N, -119.0316 W) (Phillips et al., 2021), in sterile tubes (Sigma-Aldrich) in August 2021. The samples were transported to the laboratory and stored at 4°C until analyzed. Subcritical water extraction was used to release the cellular components for analysis. Samples were extracted in a Microwave Synthesis Extractor from Anton Paar (Monowave EDU, Ashland, VA) at a max power of 850 W and a frequency of 2455 MHz. Extraction was performed by heating the sample (2 mL) to 200°C for 30 min.
Results
3.1. Separation of target compounds
The standard mixture selected for this study (Table 1) is comprised of four classes of organic compounds relevant to the search for life on other worlds: amino acids, short peptides, nucleosides, and nucleobases. Although this selection does not cover all possible targets of a potential life-detection mission, it does cast a wide net over a range of species that could be used to infer the biotic origin of a sample (Neveu et al., 2018). Table 1 includes the abbreviation used to identify each compound throughout this manuscript as well as the corresponding mass-to-charge ratio (m/z) for detection by positive ionization mode MS. A m/z range of 70–400 amu was selected to cover the range of analytes in this standard mixture. Because ESI is a soft ionization technique not prone to induce fragmentation, all data analysis was focused on the protonated parent mass peaks associated with each compound ([M+H]+). CE-MS is a two-dimensional separation technique where analytes are separated in time as they migrate down the capillary in the applied electric field, and then by their mass-to-charge ratio during detection in the mass spectrometer. An example of a CE-MS separation of this mixture is shown in Fig. 1, where each line represents ion counts in the mass spectrometer versus time for one extracted-ion mass value (m/z).
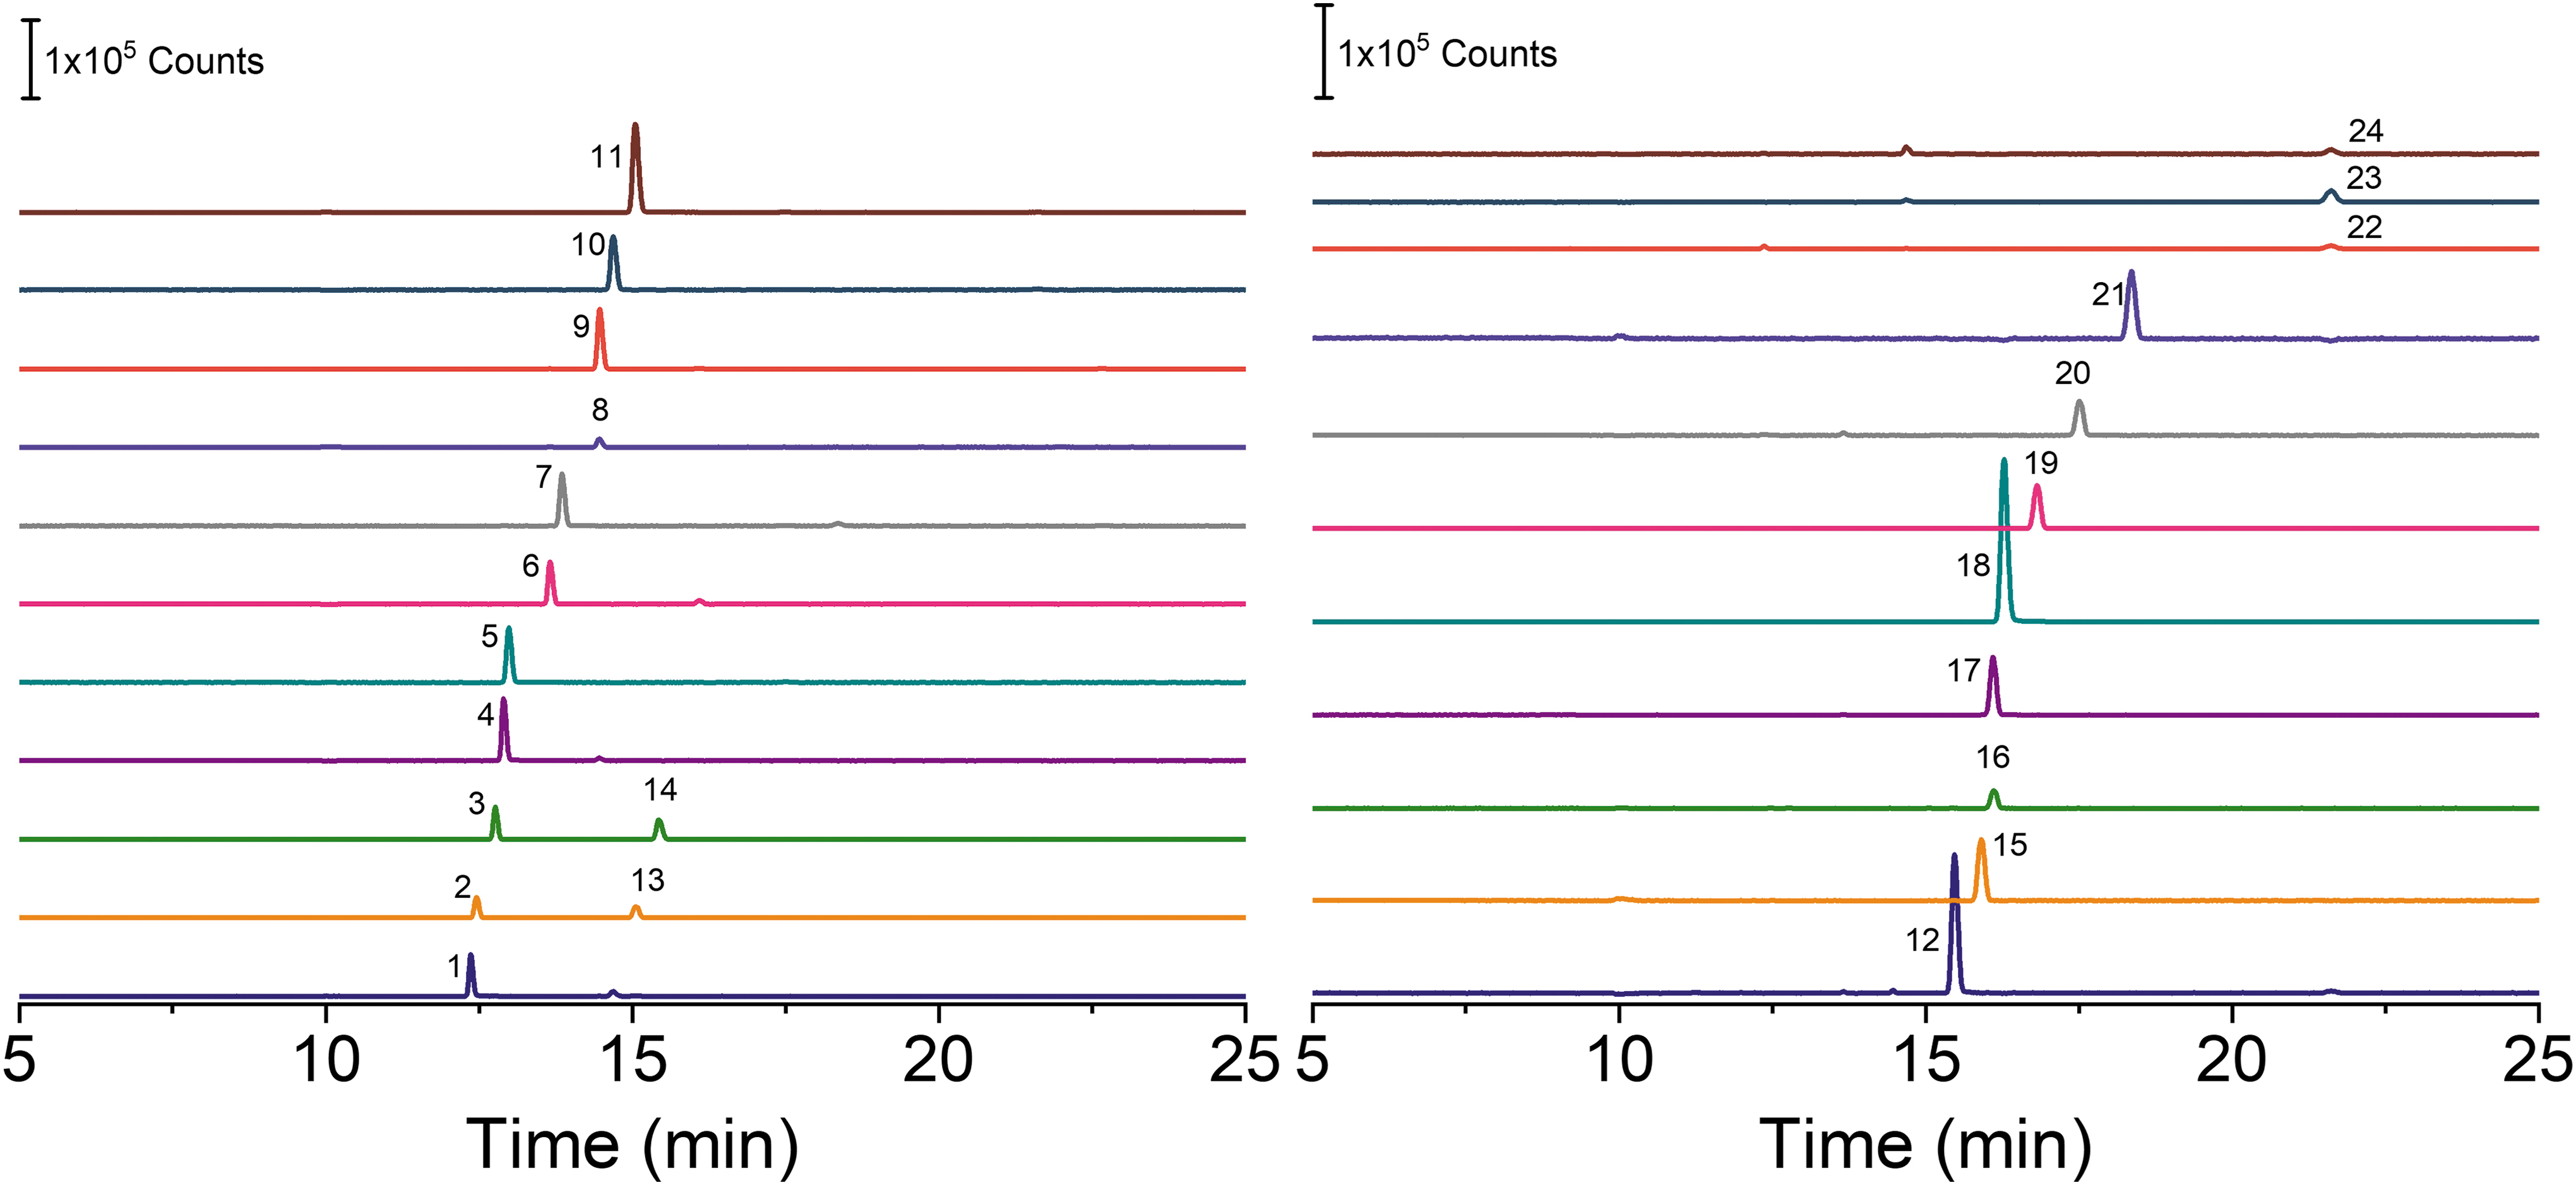
Extracted-ion traces for the separation of the standard mixture by CE-MS, with each compound at 50 μM. BGE: 2 M acetic acid. Only the peak for the protonated parent mass ([M+H]+) of each compound is labeled. (1) Cyt, (2) β-Ala, (3) GABA, (4) Ade, (5) His, (6) G-G, (7) Gua, (8) Gly, (9) G-G-G, (10) Cyd, (11) Ado, (12) F-V, (13) Ala, (14) AIB, (15) Val/Ival, (16) Ser, (17) Leu, (18) L-L-L, (19) Glu, (20) Asp, (21) Guo, (22) Ura, (23) Thd, (24) Urd. The abbreviations are defined in Table 1. Other conditions: injection volume, 7 nL; separation voltage, 20 kV; head pressure, 2 psi.
Organic Compounds Relevant to Astrobiology Selected for This Study and Their Abbreviations
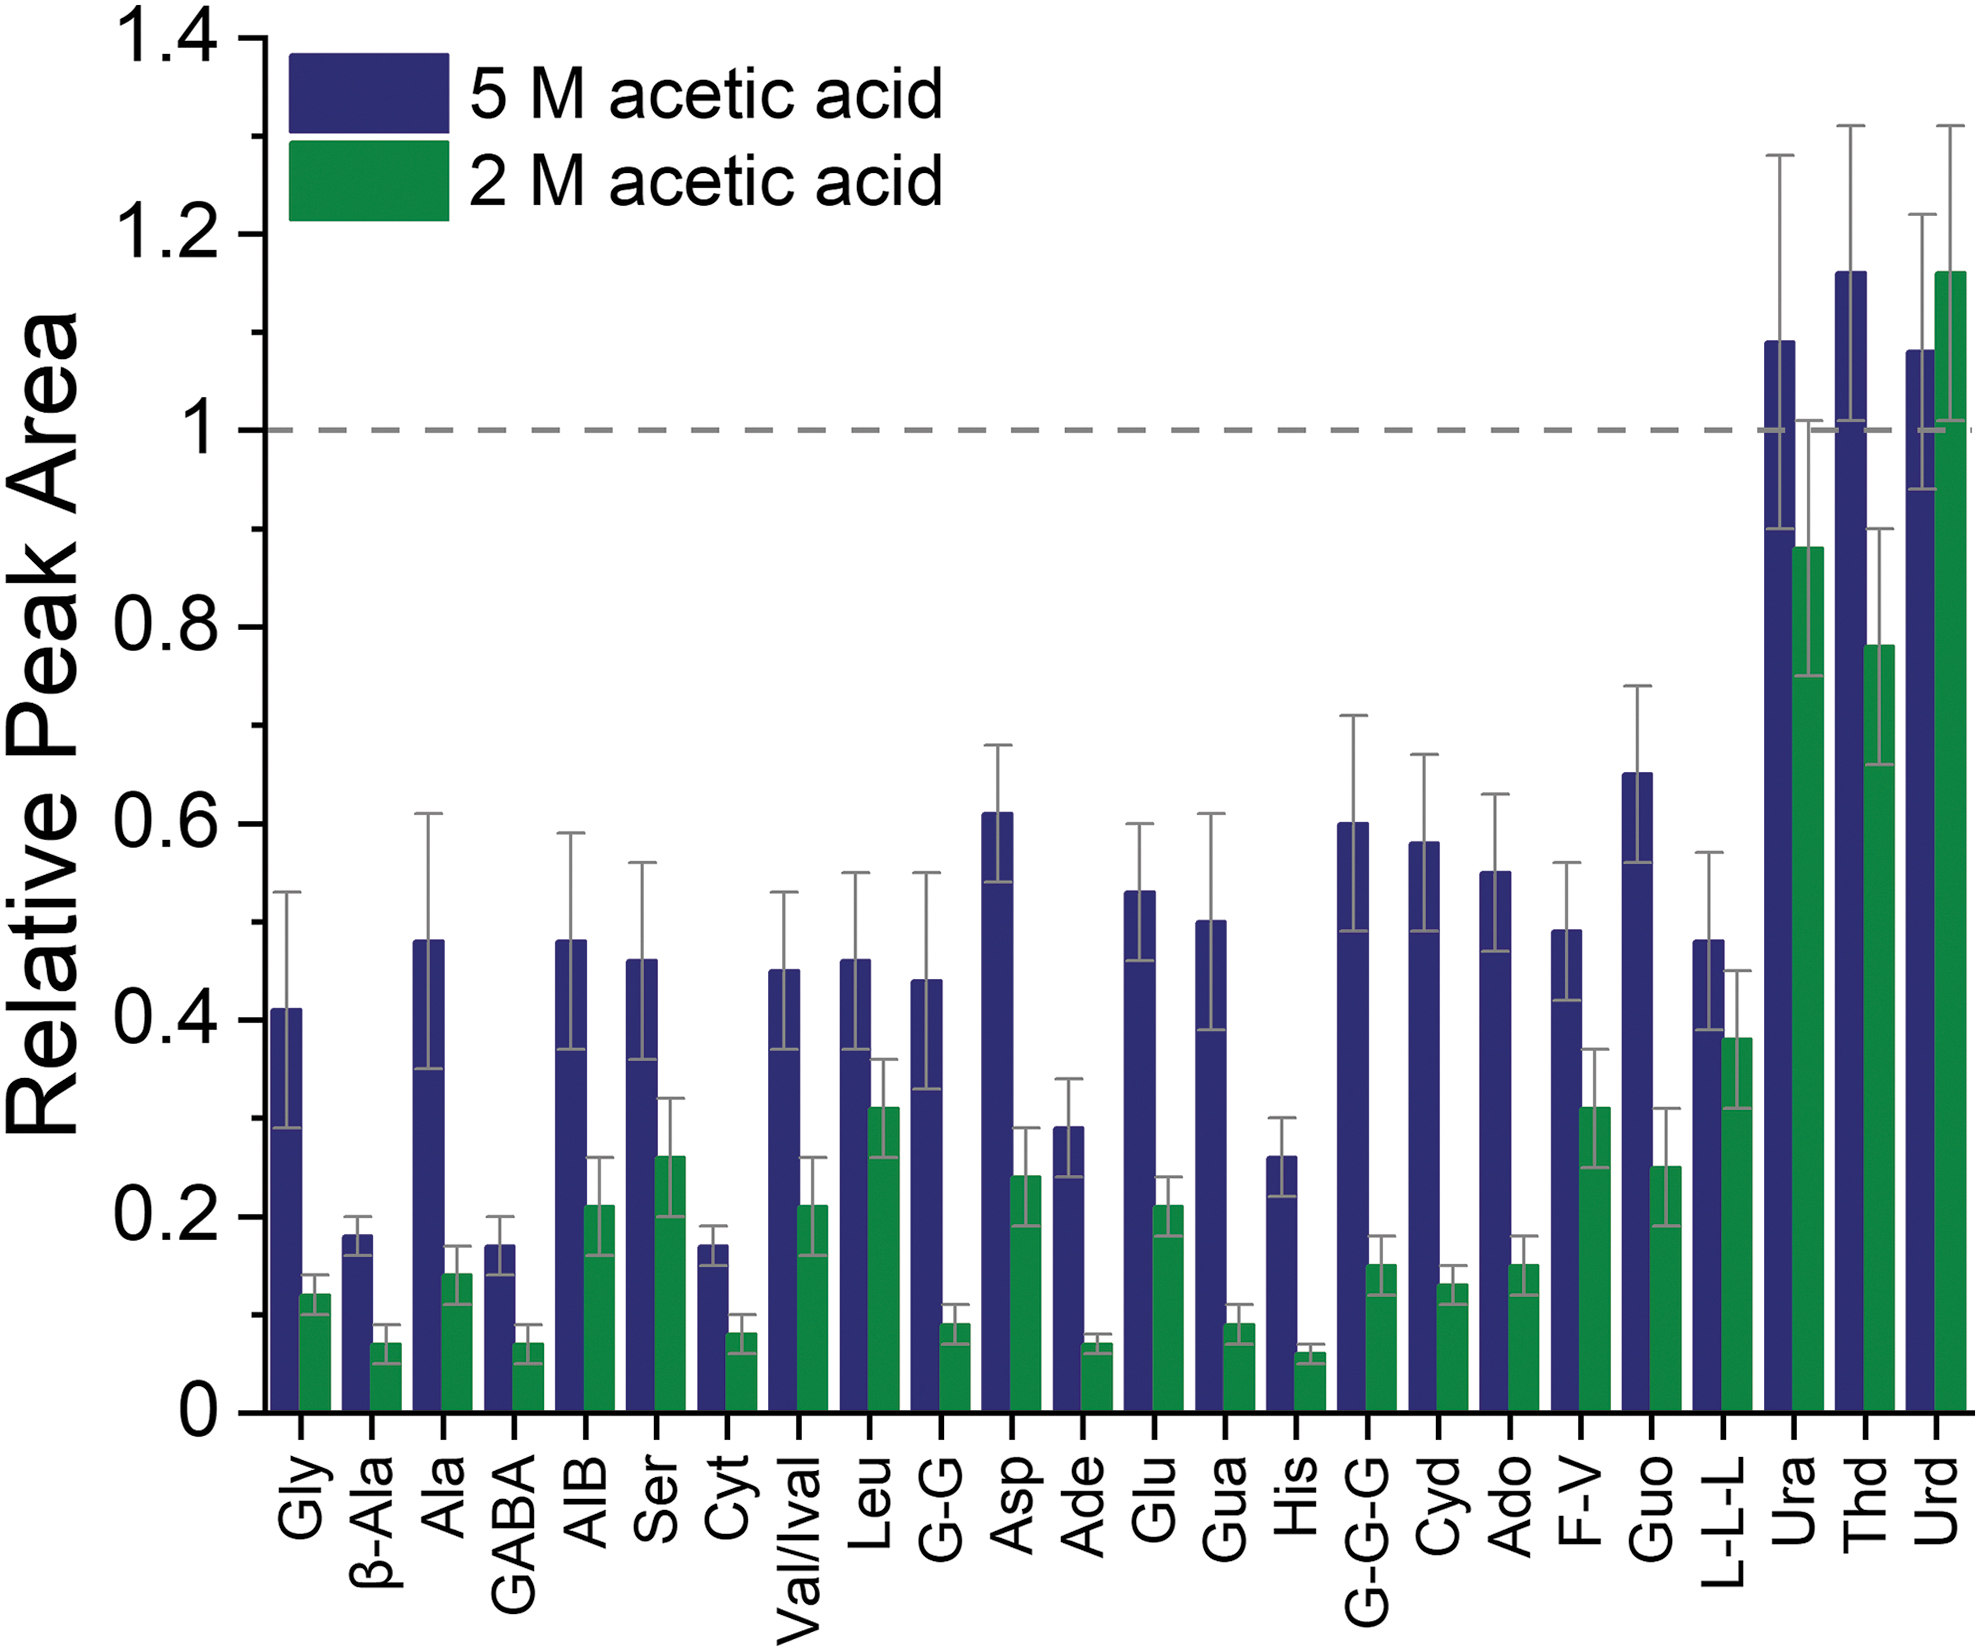
The standard mixture was analyzed with CE-MS using a BGE containing acetic acid. The acetic acid concentration was varied between 1 and 5 M in order to determine the effect on both separation efficiency and analyte signals. The extracted-ion electropherograms for each target compound and for the different acetic acid concentrations are shown in Fig. 2.
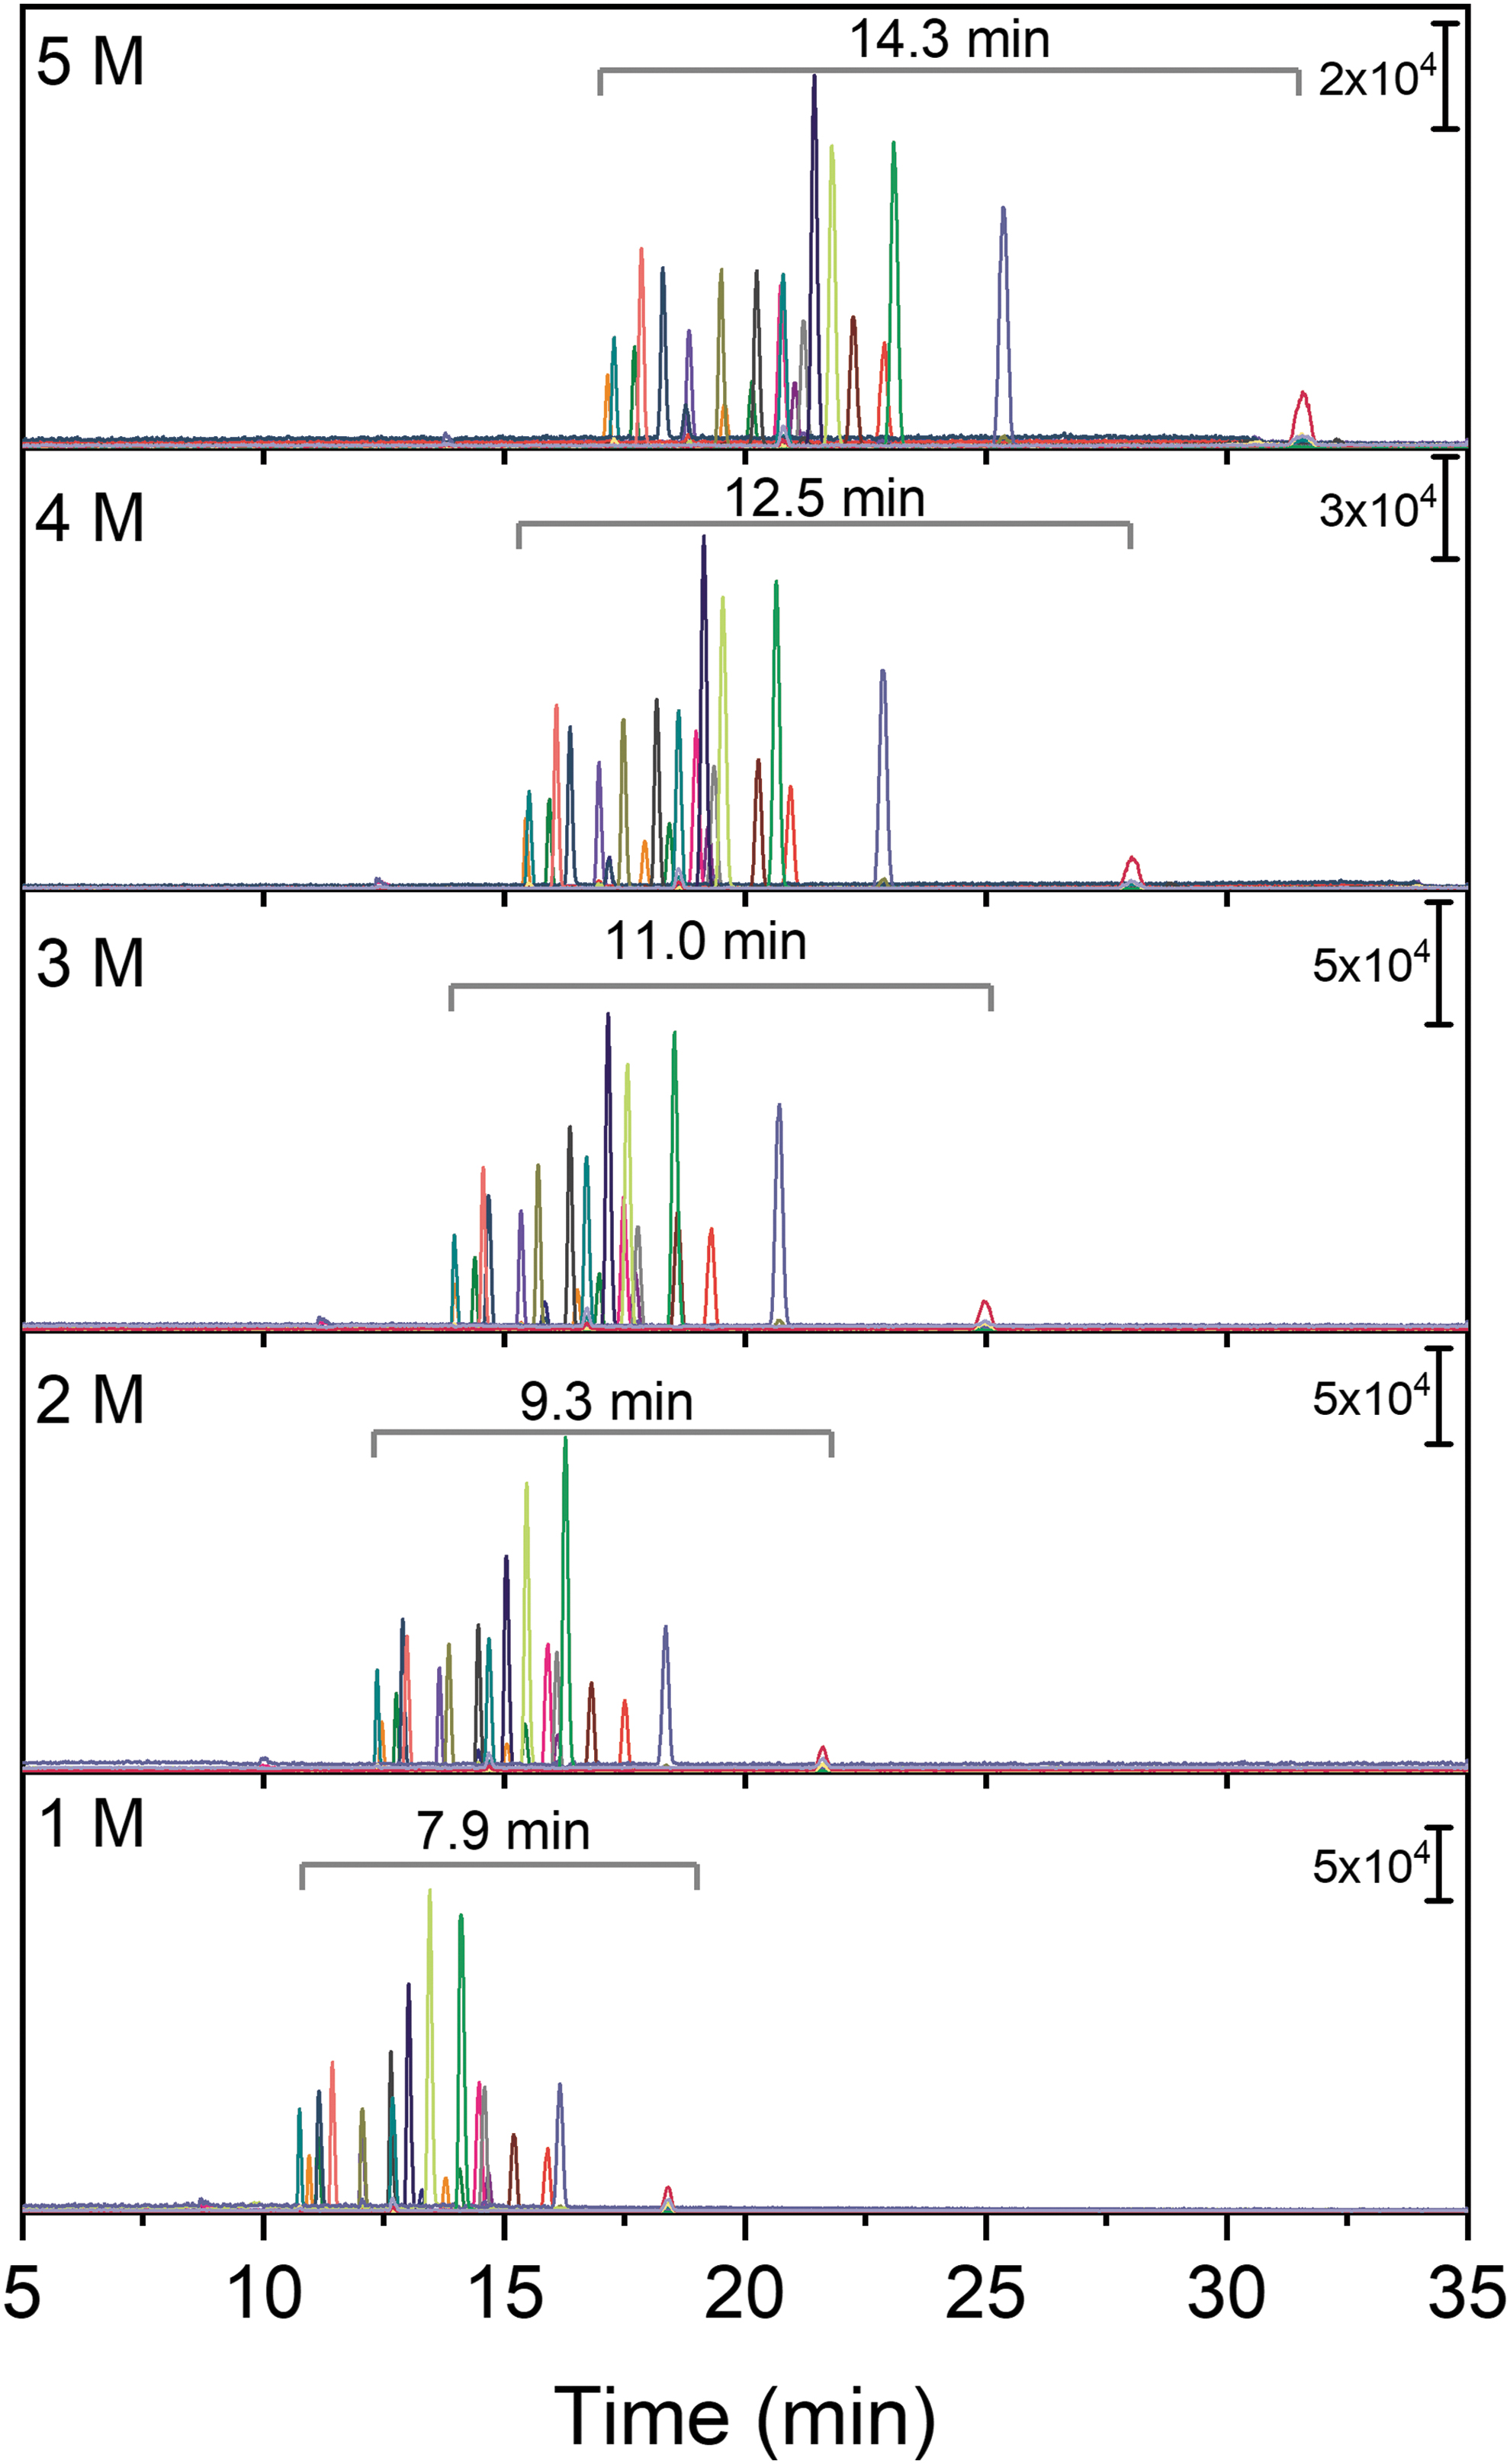
Separation of target compounds (50 μM) using CE-MS with different concentrations of acetic acid as BGE (1–5 M). Other conditions: injection volume, 7 nL; separation voltage, 20 kV; head pressure, 2 psi. The separation window is shown in each plot.
Increasing the concentration of acetic acid results in longer analysis times, but it also provides larger separation windows (i.e., the time between the first and last migrating compound). For instance, the separation window for 1 M acetic acid was only 7.9 min, whereas a separation window of 14.3 min was observed for 5 M acetic acid. The larger window can provide more separation for not only the targeted compounds in the standard mixture but also for other organic compounds present in samples relevant to astrobiology.
The isomers Ala and β-Ala as well as GABA and AIB were separated with all tested acetic acid concentrations. Unfortunately, no separation could be obtained for the isomers Val and Ival. The compounds Thd, Ura, and Urd are neutral at the low pH used here and could therefore also not be separated in CE. However, these compounds could still be distinguished by the mass spectrometer based on their different m/z values.
The acetic acid concentration also influences the migration order and the signal intensity of the analytes. The smaller amino acids (e.g., Gly, AIB, Ala, and Ser) migrate relatively faster at higher acetic acid concentrations, whereas the larger peptides, nucleobases, and nucleosides migrate relatively slower. In general, signal intensities (peak area and peak height) decreased with increasing acetic acid concentrations, likely due to a combination of ion suppression and peak broadening due to longer migration times, and the observed differences between analytes did not correlate with migration time. The migration times for each compound under varying conditions are included in the Supplementary Material (Table S1) along with examples of electropherograms (Fig. S2). Figure 3 shows the peak area obtained for each analyte as a function of acetic acid concentration.
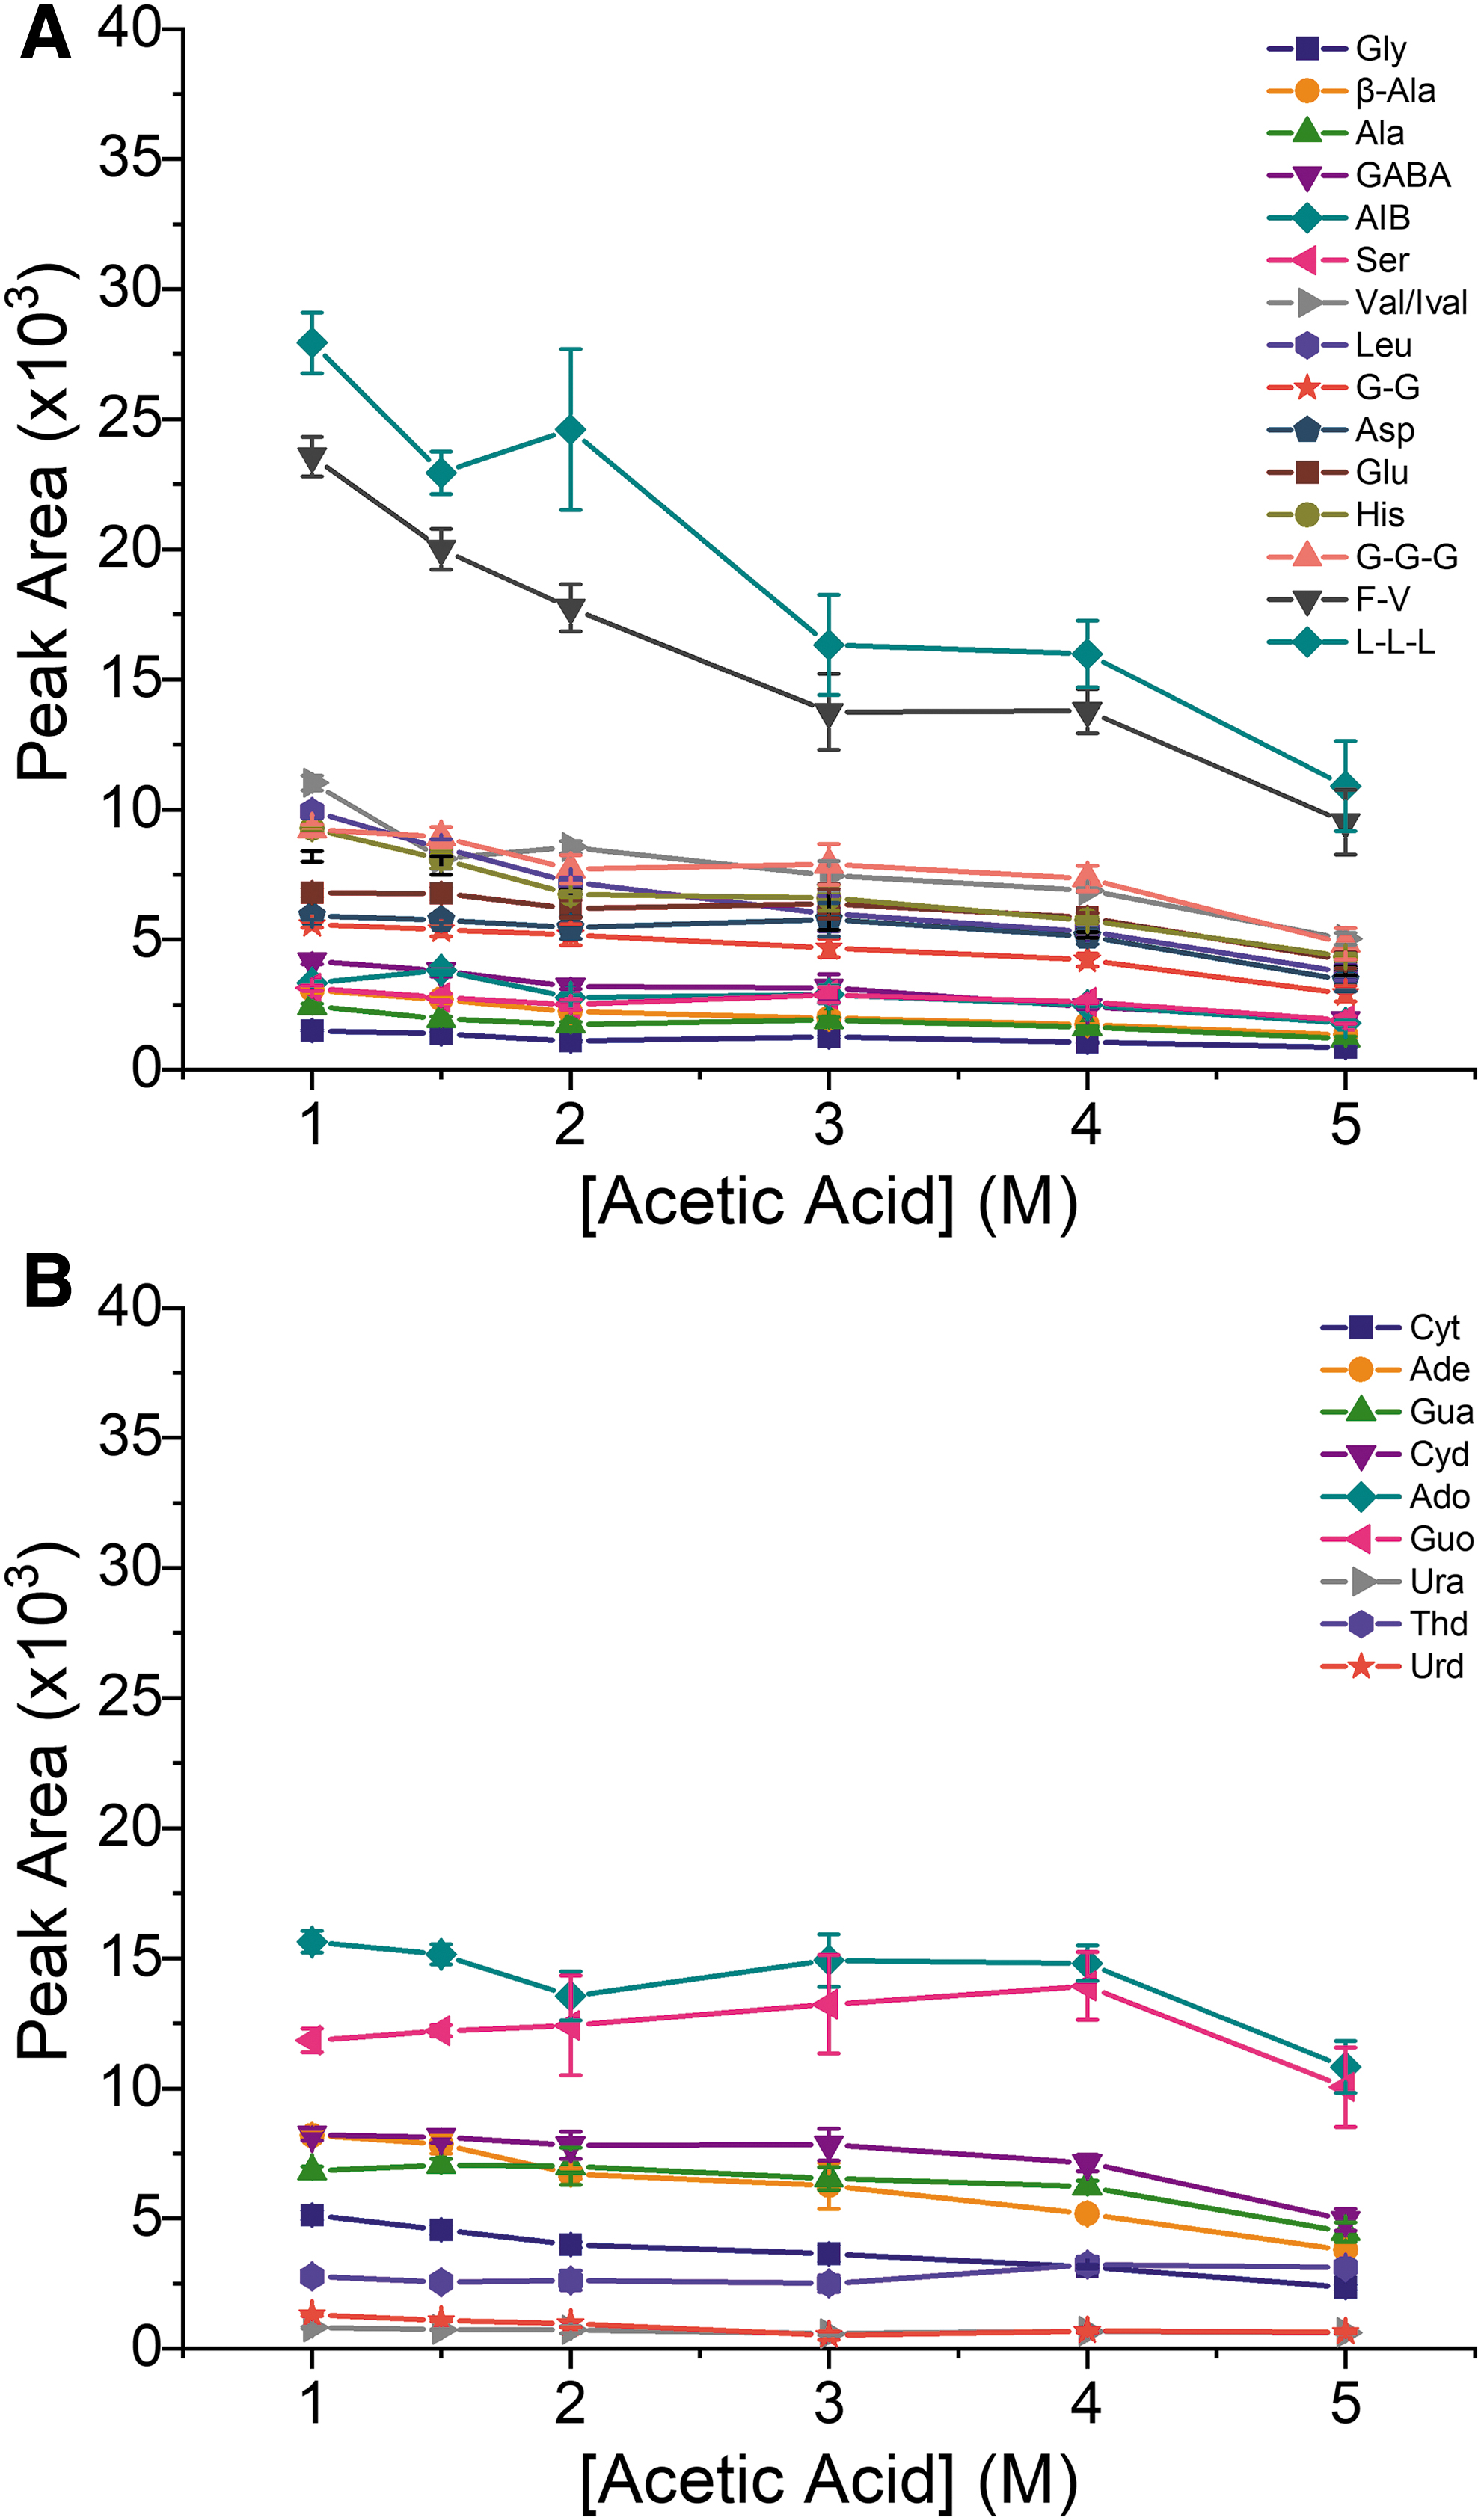
Peak areas obtained for the separation of a 50 μM standard mixture as a function of the concentration of acetic acid in the BGE. The results are divided by compound class for clarity: (
For clarity, the results are grouped by compound class, with amino acids and peptides shown in Fig. 3A and nucleobases and nucleosides in Fig. 3B. The largest decrease in signal was observed for amino acids and peptides, in particular for the two compounds with the highest signals (L-L-L and F-V). The signals for amino acids and peptides were on average 50% lower when increasing the acetic acid concentration from 1 to 5 M. A comparison of the peak areas obtained with 2 and 5 M acetic acid shows an average signal decrease of 38% for amino acids and peptides. As can be seen in Fig. 3B, the acetic acid concentration has a lower impact on the signal intensities of nucleobases and nucleosides. The average decrease was 32% when comparing the peak areas obtained with 1 and 5 M acetic acid, and a decrease of 25% was observed between 2 and 5 M acetic acid.
Based on these results, two concentrations of acetic acid (2 and 5 M) were chosen as the BGE to evaluate the effects of various concentrations of NaCl and MgSO4 in the sample. The 2 M BGE was selected because it is commonly used for CE-MS separations, providing good signal intensities. The 5 M BGE was selected because it provides the largest separation window and because of our previous work demonstrating that this BGE is tolerant to high salt concentrations using other detection systems (Ferreira Santos et al., 2018).
To evaluate the effect of the selected salts on the signal for the target analytes, a standard mixture made up of 50 μM of each analyte and containing varying amounts of salts (0.15–1 M) was analyzed using the 2 M acetic acid BGE. Because the ionization efficiency varies by analyte, relative areas (calculated as the peak area in the presence of salt/peak area without salt), were used for data analysis. Figure 4 shows the relative peak areas as a function of salt concentration. A relative area of 1 (marked as a dashed line on each plot) would indicate that the salts have no effect on the response of a particular analyte. As observed in the figure, addition of either MgSO4 or NaCl results in a reduction of signal, which is in general greater for increasing levels of salts. Furthermore, this trend, where the signal decreases down to ∼10% of the initial signal for a 1 M concentration of salt, is consistent regardless of the identity of the salt. This reduction of signal intensity is likely caused by ion suppression from the added salts, a well-known but not completely understood effect in electrospray (Wilm and Mann, 1996; Kebarle, 2000; Cech and Enke, 2001; Konermann et al., 2013; Liigand et al., 2017; Rosell-Llompart et al., 2018). Additionally, it should be noted that although salt adducts were observed in the mass spectrometer, here we focus on the signal from the protonated species.
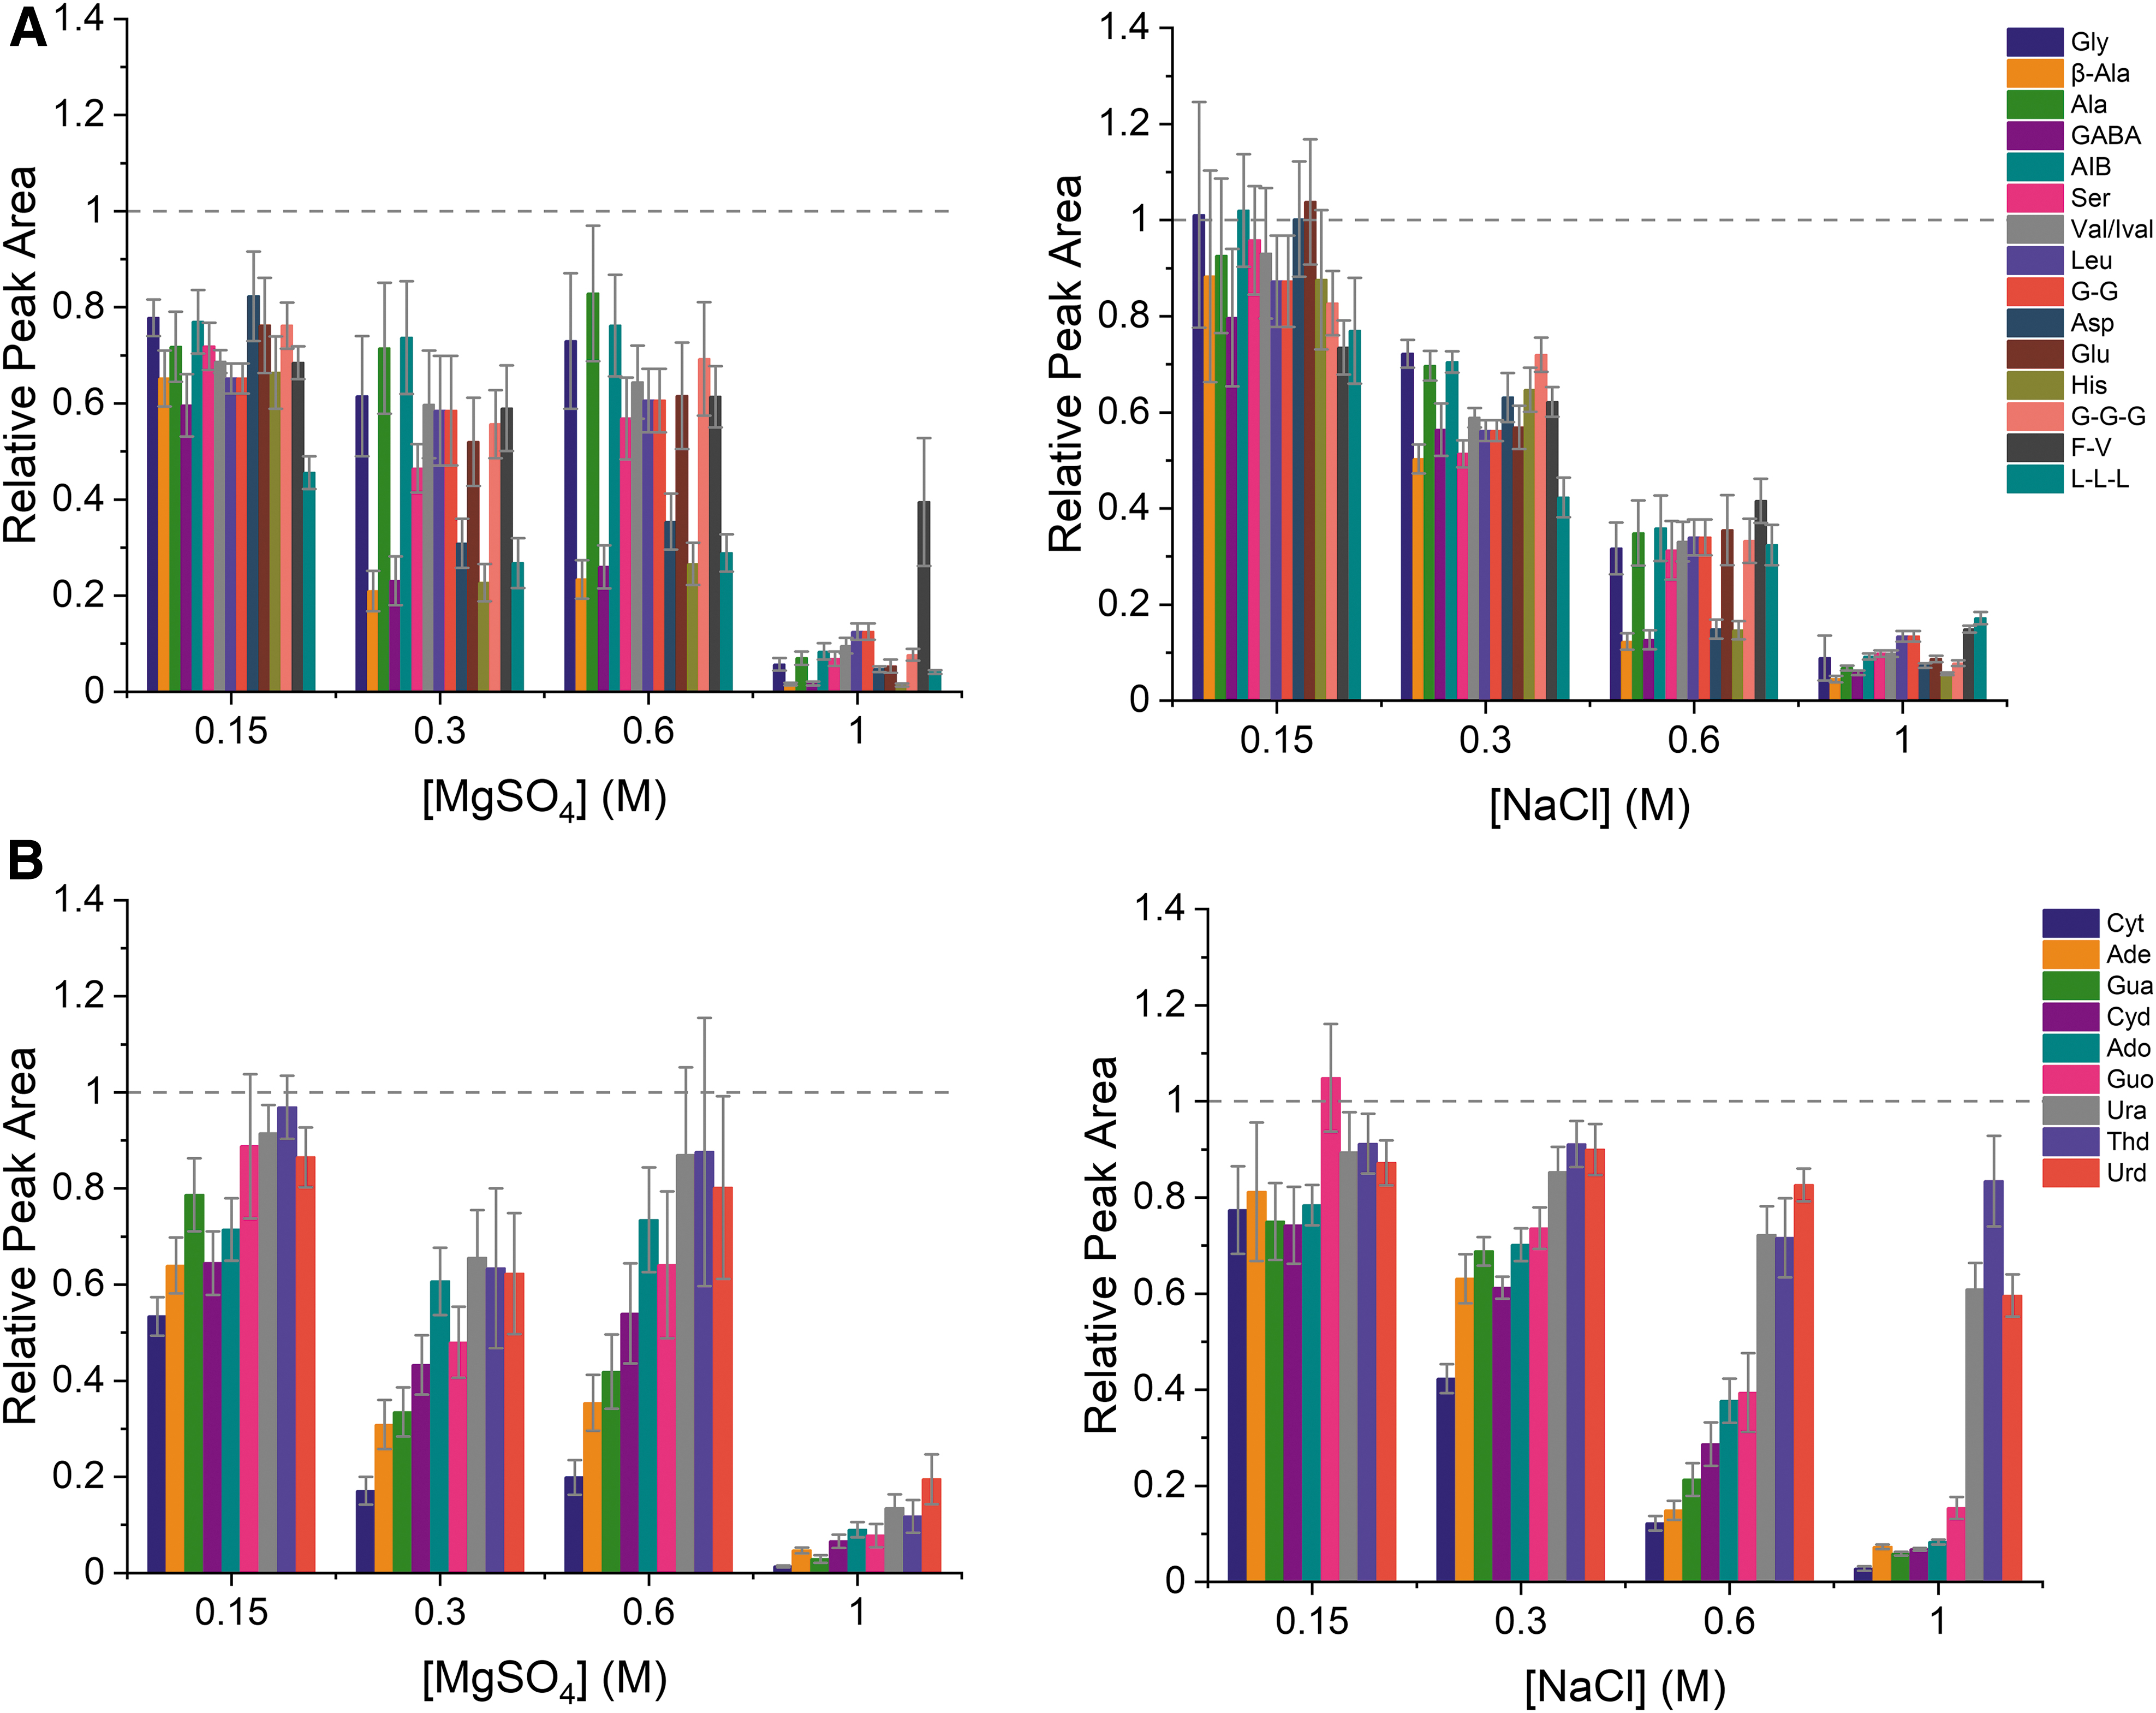
Relative peak areas (peak area with salt/peak area without salt) for (
Next, the performance of the method was evaluated at extreme salt concentrations of half saturation. Saturated solutions of NaCl and MgSO4 at room temperature result in approximately 6 and 3 M concentrations, respectively, so the conditions evaluated were 3 M for NaCl and 1.5 M for MgSO4. For these experiments the 5 M acetic acid BGE was used given its expected ability to handle high ionic strength samples most easily. Figure 5 shows the relative peak area and migration time obtained with samples at half saturation of salts. Again, the results for both salts show similar trends, with NaCl showing a slightly higher reduction in signal for some of the analytes. In general, migration times are higher with MgSO4, but in both cases the separation time is approximately 30 min.
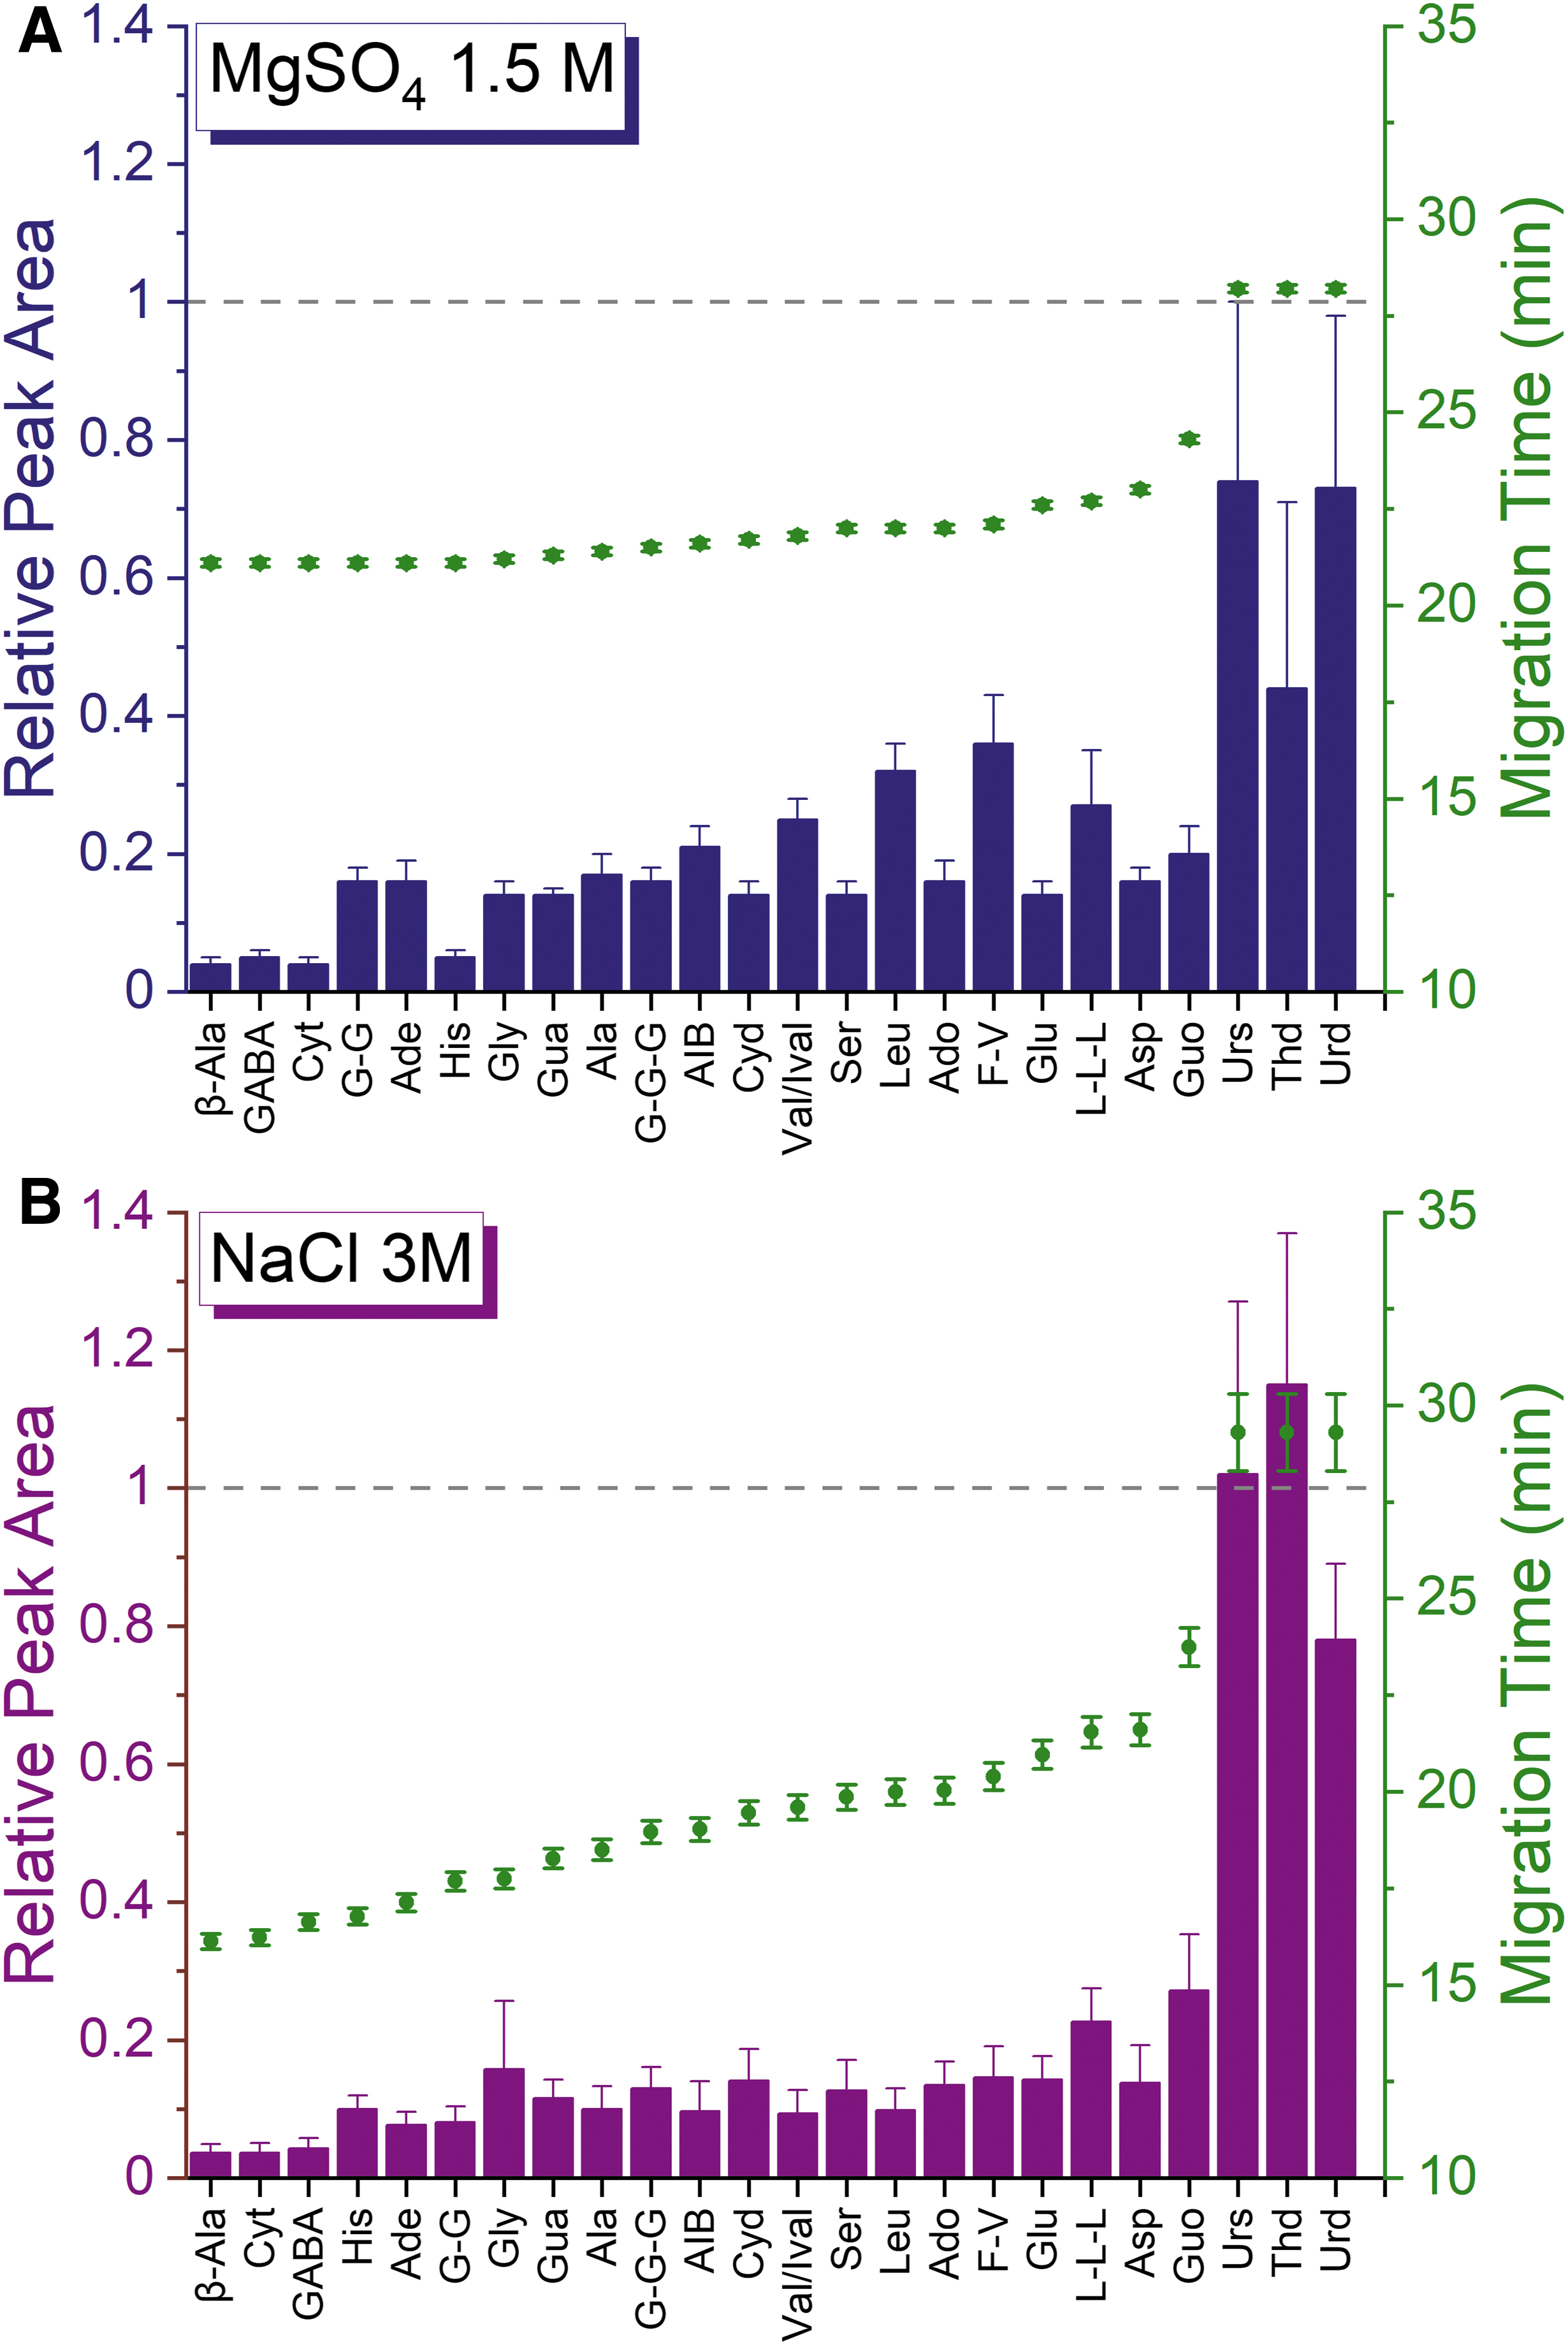
Relative peak areas and migration times for a 50 μM standard mixture containing (
Because no significant differences were observed between the two salts at 95% confidence level (p = 0.9589), NaCl was used as a model salt for further experiments. The next step was to evaluate the performance of the two concentrations of acetic acid in the presence of 1 M NaCl. Figure 6 shows the relative peak areas obtained with 1 M NaCl for the two concentrations of acetic acid selected for this study (2 and 5 M). As expected, the 5 M acetic acid BGE is more tolerant to high concentrations of salt, showing an average decrease in signal of 40% versus 80% obtained for the 2 M acetic acid. The three peaks migrating last are affected less for both BGEs.
Relative peak areas for samples containing 1 M NaCl with the two concentrations of acetic acid. Other conditions: injection volume, 7 nL; separation voltage, 20 kV; head pressure, 2 psi. The abbreviations are defined in Table 1.
Based on these results, acetic acid 5 M was the BGE used for determining the LOD at various salt concentrations, using NaCl as the representative salt. First, the effect of the volume of sample injected into the capillary on the signal and migration time was evaluated, and 21 and 7 nL were selected as optimal for no-salt and high-salt conditions, respectively. Table 2 shows the lowest concentration detected (with S/N > 3) for each compound in the absence of salt and at 1 and 3 M levels of NaCl. In the absence of salt, LODs range from 0.05 to 1 μM (8 to 89 ppb), while most compounds can be detected at 1 and 2 μM levels with 1 M NaCl in the sample. Even though the sensitivity is reduced by the presence of 3 M NaCl, by factors ranging from 4 to 50, all the compounds can still be detected at low micromolar levels (1–50 μM). It is important to mention that although the current increases with salt concentration, the overall currents are still lower than 5 μA (Supplementary Fig. S4), so no issues related to Joule heating were observed.
Lowest Detected Concentrations (μM) for the Organic Compounds of the Test Mixture Using CE-MS
The background electrolyte was 5 M acetic acid, and the sample of the standard mixture contained no salt, 1 M NaCl, or 3 M NaCl. The injection volume is 21 nL in the absence of salt and 7 nL when samples contain salt.
Finally, in order to demonstrate applicability of this method for analysis of natural samples, a sample from Mono Lake, California, which has been previously reported as a chemistry analog for ocean worlds (Preston and Dartnell, 2014), was analyzed with the 5 M acetic acid BGE. The sample was extracted in order to release organics from cells and macromolecules as described previously (Ferreira Santos et al., 2018; Jaramillo et al., 2021), and it was analyzed without filtration or dilution. Figure 7 shows the extracted-ion electropherogram for amino acids detected in the Mono Lake sample. Adenosine and all of the most abundant amino acids were detected along with additional currently unidentified peaks as well.
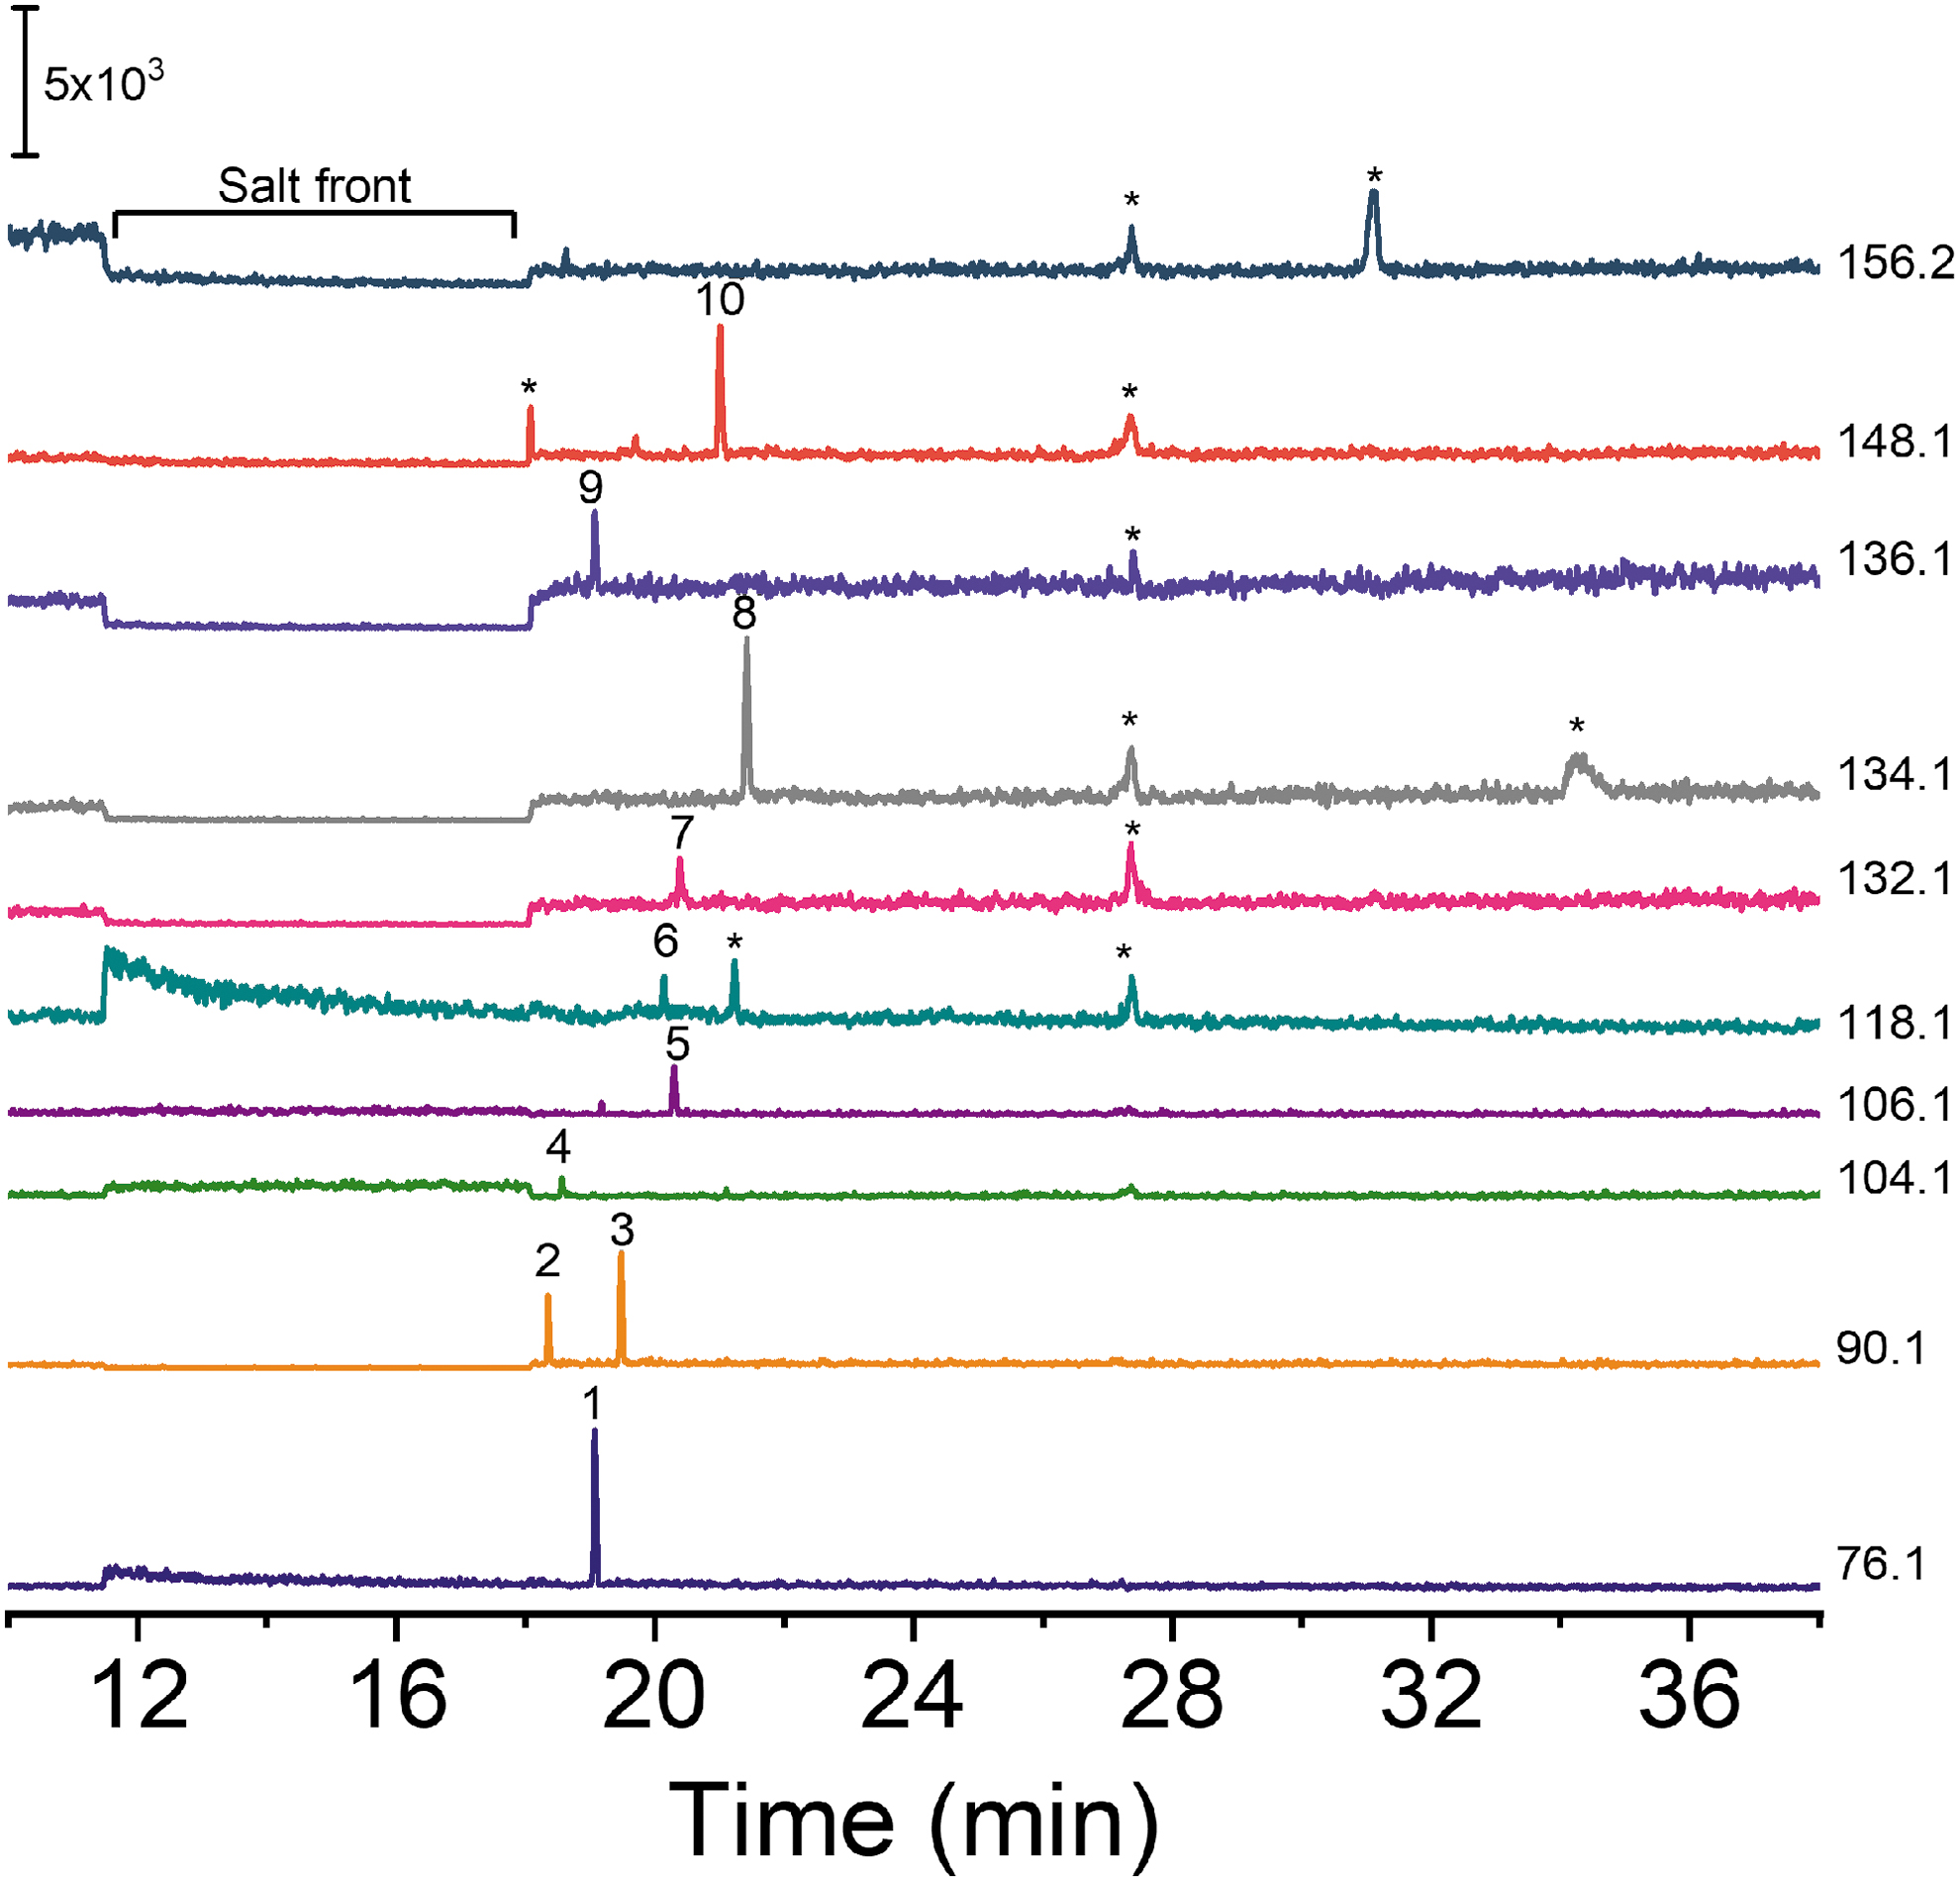
Extracted-ion traces for amino acids in a sample from Mono Lake, California. Identified peaks correspond to (1) Gly, (2) β-Ala, (3) Ala, (4) GABA, (5) Ser, (6) Val, (7) Leu, (8) Asp, (9) Ade, (10) Glu. The abbreviations are defined in Table 1. Unidentified peaks are marked with an asterisk. Other conditions: 5 M acetic acid BGE; injection volume, 7 nL; separation voltage, 20 kV; head pressure, 2 psi.
Although there are a wide range of BGEs for CE, the most commonly used for CE-MS due to their volatilities are formic acid, acetic acid, or the ammonium salts of these acids. (Bonvin et al., 2012). We have recently reported an acetic acid–based BGE for the analysis of inorganic ions and amino acids with CE coupled to capacitively coupled contactless conductivity detection (C4D) that is tolerant to high concentration of salts (Ferreira Santos et al., 2018). For these reasons, acetic acid was selected as the BGE for all the experiments described here. Using a BGE composed of 2 M acetic acid, all the compounds in our standard mixture can be separated in less than 25 min, and samples can be analyzed directly, without the need for derivatization. This is a significant advantage over gas-phase techniques that have been used in previous space missions (Stalport et al., 2012; Williams et al., 2019). Other concentrations of acetic acid can also be used for the analysis, each of which provides varying separation windows. The lower the concentration of acetic acid, the faster the analysis and the shorter the separation window. Although in many applications a faster analysis time is more desirable than a wide separation window, for in situ missions we posit that the opposite is true, as long as permitted by mission operations. Because this method could potentially detect multiple unknown compounds with similar m/z values, a wider separation window means a higher chance the peaks are better separated from each other, ultimately leading to enhanced capability in measuring molecular distributions that could be interpreted as biosignatures. Using 5 M acetic acid as the BGE allows for this wider separation window. Although there are a number of possible BGE additives that could be added to pursue further enlargement of the separation window or improvements in electrospray efficiency, given the quality of the separation already achieved, we opted for the simplicity of a single component BGE.
Of the two concentrations of acetic acid evaluated here as BGE, 2 M provides higher signal in the absence of salts (Fig. 3), but 5 M can tolerate higher salt content in the sample (Figs. 6 and 5). There are two aspects to consider in order to explain these results: the electrophoretic process and the electrospray process. In relation to the electrophoretic effect, when the BGE has lower ionic strength than the sample, charged analytes migrate more slowly in the sample plug than in the BGE due to the relatively low electric field across the sample zone. When the analytes reach the BGE zone with a higher electric field, they move faster. This results in wider peaks and consequently reduced sensitivity (Park and Lunte, 1998). The ionic strength of 5 M acetic acid is almost twice that of the 2 M solution (∼10 and 6 mM, respectively), which explains why the more concentrated BGE is more tolerant to the presence of salt. This also explains why there are not notable differences in performance based on the identity of the salt. The ionic strength of the salty samples is at least 100 times higher than the 5 M acetic acid BGE (3 M NaCl and 1.5 M MgSO4 have ionic strengths of 3 and 6 M, respectively, versus 10 mM for 5 M acetic acid). Regardless of the identity of the ion, the main effect of high salinity is due to the differences in ionic strength between the sample and the BGE that can cause peak broadening and dispersion effects. These are minimized when using a BGE with higher ionic strength (i.e., 5 M acetic acid instead of 2 M acetic acid). Moreover, because the inorganic ions migrate first under the electric field (high mobility), the analytes with the lowest mobilities (longer migration times) are less affected by the presence of salts (Fig. 5). Although two salts were studied here, NaCl and MgSO4, this method should also be applicable to samples containing other salts, as the performance was not dependent on the identity of the salt (singly charged versus doubly charged ions).
The second process to consider in order to understand the reduction in signal is ion suppression. Even though the combination of nanoflow with ESI is known to reduce ion suppression, at the concentration of salts used here this effect becomes significant. This was confirmed by performing separations under the same conditions but with a different detector (capacitively coupled contactless conductivity detection, C4D). As expected, a decrease in signal was also observed, but the magnitude of the change was smaller than with ESI-MS, indicating a reduced ionization efficiency due to the presence of salts is likely responsible for the further reduction in signal with CE-MS. These results are included in the Supplementary Material (Figs. S5 and S6). The formation of sodium adducts also contributes in some cases to the reduction of signal of the protonated species. The supplementary material includes peak areas for protonated ([M+H]+) and sodiated ([M+Na]+) species obtained with a sample containing 3 M NaCl (Supplementary Table S2). As expected, the signal for the sodium adduct is high for the first peak ([M+Na]+/[M+H]+ ∼ 2.5 ), which migrates close to the salt front, and less significant for the rest of the analytes. However, it is worth noting that there is no clear trend related to migration time. A more detailed study of salt adduct formation is outside the scope of this work and will be reported separately.
In the context of an in situ mission to ocean worlds, either a lander or a flyby mission, the simplest version of a CE instrument would not include any desalting or preconcentration apparatus, and the only option for optimizing the analysis of high-salinity samples in this scenario would be by performing sample dilution. Because the concentrations of organics that could be encountered on the surface of ocean worlds are expected to be low, the dilution of the sample should be minimized to not compromise the detection of biosignatures. Given the unknown nature of samples at the surfaces of ocean worlds, a minimum dilution of a 1:1 mixture with pure water brought along by the instrument is likely to ensure that sufficient fluid is present for dissolution of potential solids. Using the maximum solubility of both the salts tested here, saturated solutions of NaCl and MgSO4 would correspond to approximately 6 and 3 M, respectively. Thus, at a minimum dilution level of 1:1, sample solutions with a maximum concentration of 3 and 1.5 M of NaCl and MgSO4, respectively, could be expected. We have demonstrated here that 5 M acetic acid can handle these levels of salts while providing LODs in the low micromolar range (Table 2). This method provides significantly higher sensitivities than other approaches proposed to detect amino acids in salty samples involving impact ionization MS without a prior separation step. Recently, Klenner et al. (2020) reported LODs ranging from 3 to 270 μM for the detection of amino acids in salty ice grains containing 0.1 M NaCl. Based on our results, we expect the LODs in the presence of 0.1 M NaCl to be similar to the ones shown on Table 2 for samples without salts. Even assuming a 20% decrease in signal due to the presence of 0.1 M NaCl, our LODs would range from 60 nM to 1.2 μM, indicating an improvement of at least 100-fold when doing CE separation before ESI-MS. Even with solutions containing 10 times the amount of NaCl, our LODs (1–2 μM) are still ∼5–100 times lower than the ones obtained by impact ionization MS. These results highlight the value of sample handling ahead of liquid analysis, and CE-MS in particular for implementation in future missions to ocean worlds. Furthermore, the trends established here demonstrate that, if unforeseen conditions lead to higher-than-expected salt concentrations, perhaps because of uncertainty in the mass or volume of the sample delivered, these analyses would not simply fail, but rather they would degrade in a predictable way.
Additionally, based on the LODs shown in Table 2, it is also possible to start identifying optimal dilution approaches if knowledge of the sample matrix can be gained in situ ahead of CE analysis. Therefore, if sample pre-analysis measures concentrations of salts close to half saturation, a 1:3 dilution could be performed, as it would improve the sensitivity for many analytes (10 out of 25). For example, the LODs for serine are 2 and 50 μM for 1 and 3 M, respectively. Furthermore, a 1:10 dilution to bring the sample closer to a no-salt condition will improve the sensitivity for 17 of the 25 analytes by factors ranging from 2 to 10, while four analytes will remain unchanged (valine, glutamic, guanosine, and thymidine) and four will show a decrease in sensitivity (leucine, aspartic, uracil, and uridine). Depending on the sophistication of analyte targeting, other information available (previous CE results, inorganic matrix measurements, complimentary instrument organic measurements, etc.) could be used case-by-case for targeted LOD optimization.
It is also important to discuss the lifetime of the capillaries when analyzing samples containing high levels of salts. All the experiments described here were performed by alternating samples containing salts with samples without salt (5 analyses of each) in order to verify the performance was maintained even after analysis of challenging samples. In this context, each capillary was used for ∼150–200 analyses, as expected according to the manufacturer's specifications. Thus, the lifetime of the capillaries was not affected by analysis of high-salinity samples. More importantly, this performance exceeds the requirements of most missions of exploration in which only a limited number of analyses can be performed. For example, the Europa Lander Report stated a plan to analyze five samples from the surface of Europa, so our method would exceed the lifetime required for the mission even if the samples have high salt content.
The applicability of CE-MS for analysis of challenging natural samples was demonstrated by analysis of samples from Mono Lake, California. Mono Lake is a hypersaline (∼3 × seawater salinity), alkaline (pH 9.8), closed-basin lake located in the eastern Sierra Nevada Mountains of California, USA (Phillips et al., 2021). This lake has been proposed as an analog of europan and enceladan brine oceans (Preston and Dartnell, 2014). Multiple amino acids and adenosine were detected in the sample despite the presence of a salt front (Fig. 7). The salt front produces an increased background/noise that is more evident for some of the traces than others. Although the reason for this is not clear, as expected, the presence of high concentration of salt did not preclude the detection of the organics, and desalting or dilution was not needed. As such, these results clearly demonstrate the potential of CE-MS for in situ organic analysis of potentially high-salinity samples. Subcritical water extraction was performed in order to release amino acids and other organics from cellular material in the samples. The presence of unidentified peaks in the electropherograms also highlights the utility of CE-MS to discover possible unknowns. Identification of these peaks is ongoing and will be reported separately.
Overall, these results highlight the unparalleled performance of CE-MS for direct analysis of organic biosignatures on high-salinity samples without the need for desalting, making it an ideal candidate for future missions to ocean worlds.
Conclusions
This paper demonstrates for the first time direct laboratory analysis of organic biosignatures by CE-MS on samples containing up to half saturation of salts expected to be found in samples collected during missions to ocean worlds, either from the surface or the plumes. Limits of detection in the low micromolar range are obtained even in the presence of 3 M NaCl, without the need for any desalting, preconcentration, or chemical derivatization. The fact that this technique can handle samples containing high levels of salts while allowing direct analysis with part-per-billion sensitivity to a wide range of organics suggests that CE-MS is uniquely suited for future missions to ocean worlds.
Footnotes
Acknowledgments
The research described in this paper was carried out at the Jet Propulsion Laboratory, California Institute of Technology, under a contract with the National Aeronautics and Space Administration. Financial support for this project was provided by internally funded JPL R&TD programs.
Supplementary Material
Supplementary Figure S1
Supplementary Figure S2
Supplementary Figure S3
Supplementary Figure S4
Supplementary Figure S5
Supplementary Figure S6
Supplementary Table S1
Supplementary Table S2
Abbreviations Used
Associate Editor: Victor Parro
References
Supplementary Material
Please find the following supplemental material available below.
For Open Access articles published under a Creative Commons License, all supplemental material carries the same license as the article it is associated with.
For non-Open Access articles published, all supplemental material carries a non-exclusive license, and permission requests for re-use of supplemental material or any part of supplemental material shall be sent directly to the copyright owner as specified in the copyright notice associated with the article.