
Abstract
Detecting evidence of life on other planetary bodies requires a certain understanding of known biomarkers and their chemical nature, preservation potential, or biological specificity. In a planetary search for life, carbonates are of special interest due to their known association with life as we know it. On Earth, carbonates serve as an invaluable paleogeochemical archive of fossils of up to billions of years old. Here, we investigated biomarker profiles on three Chilean Triassic–Jurassic sedimentary records regarding our search for signs of past and present life over ∼200 Ma. A multianalytical platform that combines lipid-derived biomarkers, metaproteomics, and a life detector chip (LDChip) is considered in the detection of biomolecules with different perdurability and source-diagnosis potential. The combined identification of proteins with positive LDChip inmunodetections provides metabolic information and taxonomic affiliation of modern/subrecent biosignatures. Molecular and isotopic analysis of more perdurable hydrocarbon cores allows for the identification of general biosources and dominant autotrophic pathways over time, as well as recreation of prevailing redox conditions over ∼200 Ma. We demonstrate how extraterrestrial life detection can benefit from the use of different biomarkers to overcome diagnosis limitations due to a lack of specificity and/or alteration over time. Our findings have implications for future astrobiological missions to Mars.
1. Introduction
The search for life in the Universe greatly depends on our understanding of modern and ancient life-forms on Earth as well as the extent to which we comprehend past and present factors that affect the distribution of life and its interaction with the planetary environment (e.g., Westall, 2005). Life detection beyond Earth has centered on microorganisms, in particular prokaryotes (Committee on Planetary and Lunar Exploration, 2002), as the most likely forms of life to exist or have existed elsewhere. Thus, understanding early life on Earth (i.e., prokaryotes) is essential to future successes in identifying connections between simple forms of past and perhaps present life elsewhere.
Different branches within the geosciences, such as forensic geochemistry, have the capacity to identify hints of life in ancient rocks by tracing biological signals back through time in the geological record. In the many cases where direct evidence of life has been geologically recycled and destroyed, the identification of chemical fossils (i.e., certain molecules or carbon isotopic composition) has resulted in forensic tools to search for “footprints” of life in ancient rocks (Hefter et al., 1993; Smrzka et al., 2017; Heindel et al., 2018).
The use of molecular biomarkers in ancient rocks has furthered our understanding of (1) ancient microbial history on Earth (origin and sources) and (2) pertinent depositional environments and geochemical conditions. Combining the use of several different molecular biomarkers offers a powerful option with which to detect evidence of life in the geological record on a time-integrative basis, where different biomarkers provide complementary capacities (e.g., biological specificity or chemical resistance) and diagnosis potential (Sánchez-García et al., 2020). For instance, lipids, that is, fatty acids and other biosynthesized hydrocarbons, are structural components of cell membranes that have a high resistance to degradation over geological timescales but low taxonomic resolution due to its often-unspecific distribution in all organisms.
In contrast, more labile DNA provides much more taxonomically specific information but at the expense of a more limited perdurability over time. Slightly more resistant than DNA, proteins or peptides offer a snapshot of the taxonomy and metabolic activity of a microbial community under defined environmental conditions. Finally, immunologically recognizable areas of macromolecules (i.e., epitopes) offer great specificity despite certain liabilites. Merging the use of different biopolymers allows a way around individual limitations and fosters a kind of synergy in facilitating environmental, biosources, and metabolic reconstructions.
The documented history of life in the rock record extends to at least ∼3500–3000 Ma (Knoll and Barghoorn, 1977; Moorbath, 2005; Djokic et al., 2017). The abundance of carbonate structures that contain fossilized remnants of life over 3 billion years old (Grotzinger and Knoll, 1999) indicates their importance in understanding the evolution of life and ecosystems (Foster and Green, 2011). The Triassic–Jurassic transition (∼200 Ma) is considered an interesting geological interface for the study of ancient life, as it records one of the “Big Five” mass extinctions of the Phanerozoic eon—the third after the end Permian (Tanner et al., 2004 and references therein), and one of the warmest periods in Earth history (Miller and Baranyi, 2021).
In northern Chile, Triassic geological sequences of Domeyko and Central basins (at the eastern limit of the Atacama Desert) represent good examples of the marine transgression that occurred in that period, as they contain carbonate deposits from shallow seas framed within the postrift stage of the so-called Andean Cycle that endured until the Early Cretaceous (Chong, 1977; Chong and Hillebrandt, 1985; Suárez and Bell, 1992; Charrier et al., 2007), when a compressive tectonic stage was followed by an extensive stage (Espinoza et al., 2019). Paleontological interest in this environmentally (marine-continental transition) and biologically (encoding one of the greatest mass extinctions in history) interesting area has been limited to the identification of macrofossils from the Triassic or Jurassic periods (Cortés, 2000; Basso, 2004; Fernández-López and Chong-Díaz, 2014), while no efforts have been devoted, to date, to investigate the biomolecular profile of this 200 Ma geological record with implications for the astrobiological arena.
Here, we implemented a study of Triassic–Jurassic carbonate rocks from the Chilean, that is, the former Domeyko and Central basins, based on a multibiomarkers approach to detect signs of recent and fossilized life on a time-integrative basis. We applied a multianalytical approach that involved three types of molecular biomarkers (hydrocarbon cores of cell membrane lipids, proteins/peptides, and immunological targets) and compound-specific isotopic analysis (CSIA) that allowed reconstructing biosources, prevailing metabolisms, and dominant geochemical conditions throughout (maximum) ∼200 Ma.
The analysis of hydrocarbon variants of cell membrane constituents (hereafter named as lipid biomarkers), at both the molecular and isotopic levels, accounted for the oldest preserved remnants of life and allowed distinguishing general groups of organismic sources, dominant autotrophic metabolisms, and prevailing environmental conditions. In the absence of preserved DNA, sturdier proteins were primarily measured to identify phylogenetic groups and metabolic traits in recent and relatively modern (subrecent) biomass (i.e., greatest age of ∼3.5 Ma for recovered proteins so far) (Rybczynski et al., 2013; Demarchi et al., 2016). Finally, the sensitive immunological detection of biomolecules (mostly proteins, exopolysaccharides, and lipopolysaccharides) by a life detector chip (LDChip) (Rivas et al., 2008) contributed to the identification of metabolic traits and taxonomic affiliations of relatively recent, though still older biosources, than those deduced from the metaproteomic analysis.
The multibiomarker approach provided a comprehensive detection of signs of past and recent life in a ∼200 Ma-integrative footprint record for reconstructing past life and constraining methodologies and protocols for astrobiological life detection.
2. Materials and Methods
2.1. Geological context, study area, and sampling
In this study, three Triassic–Jurassic carbonate rocks that belong to the present Domeyko Range (MIC-2) and Central Depression (MIC-3 and MIC-4) were studied along a ∼300 km long north-to-south axis in the Atacama Desert (Fig. 1). These sedimentary rocks were deposited in former basins, which were initiated as rifts during the last tectonic cycle (the Andean Cycle) that affected northern Chile. These sedimentary structures extend from the late Triassic–earliest Jurassic in conjunction with activation of the subduction process during the Andean Cycle and to the present (Chong and Hillebrandt, 1985; Marinovic et al., 1995; Charrier et al., 2007; Venegas et al., 2013).
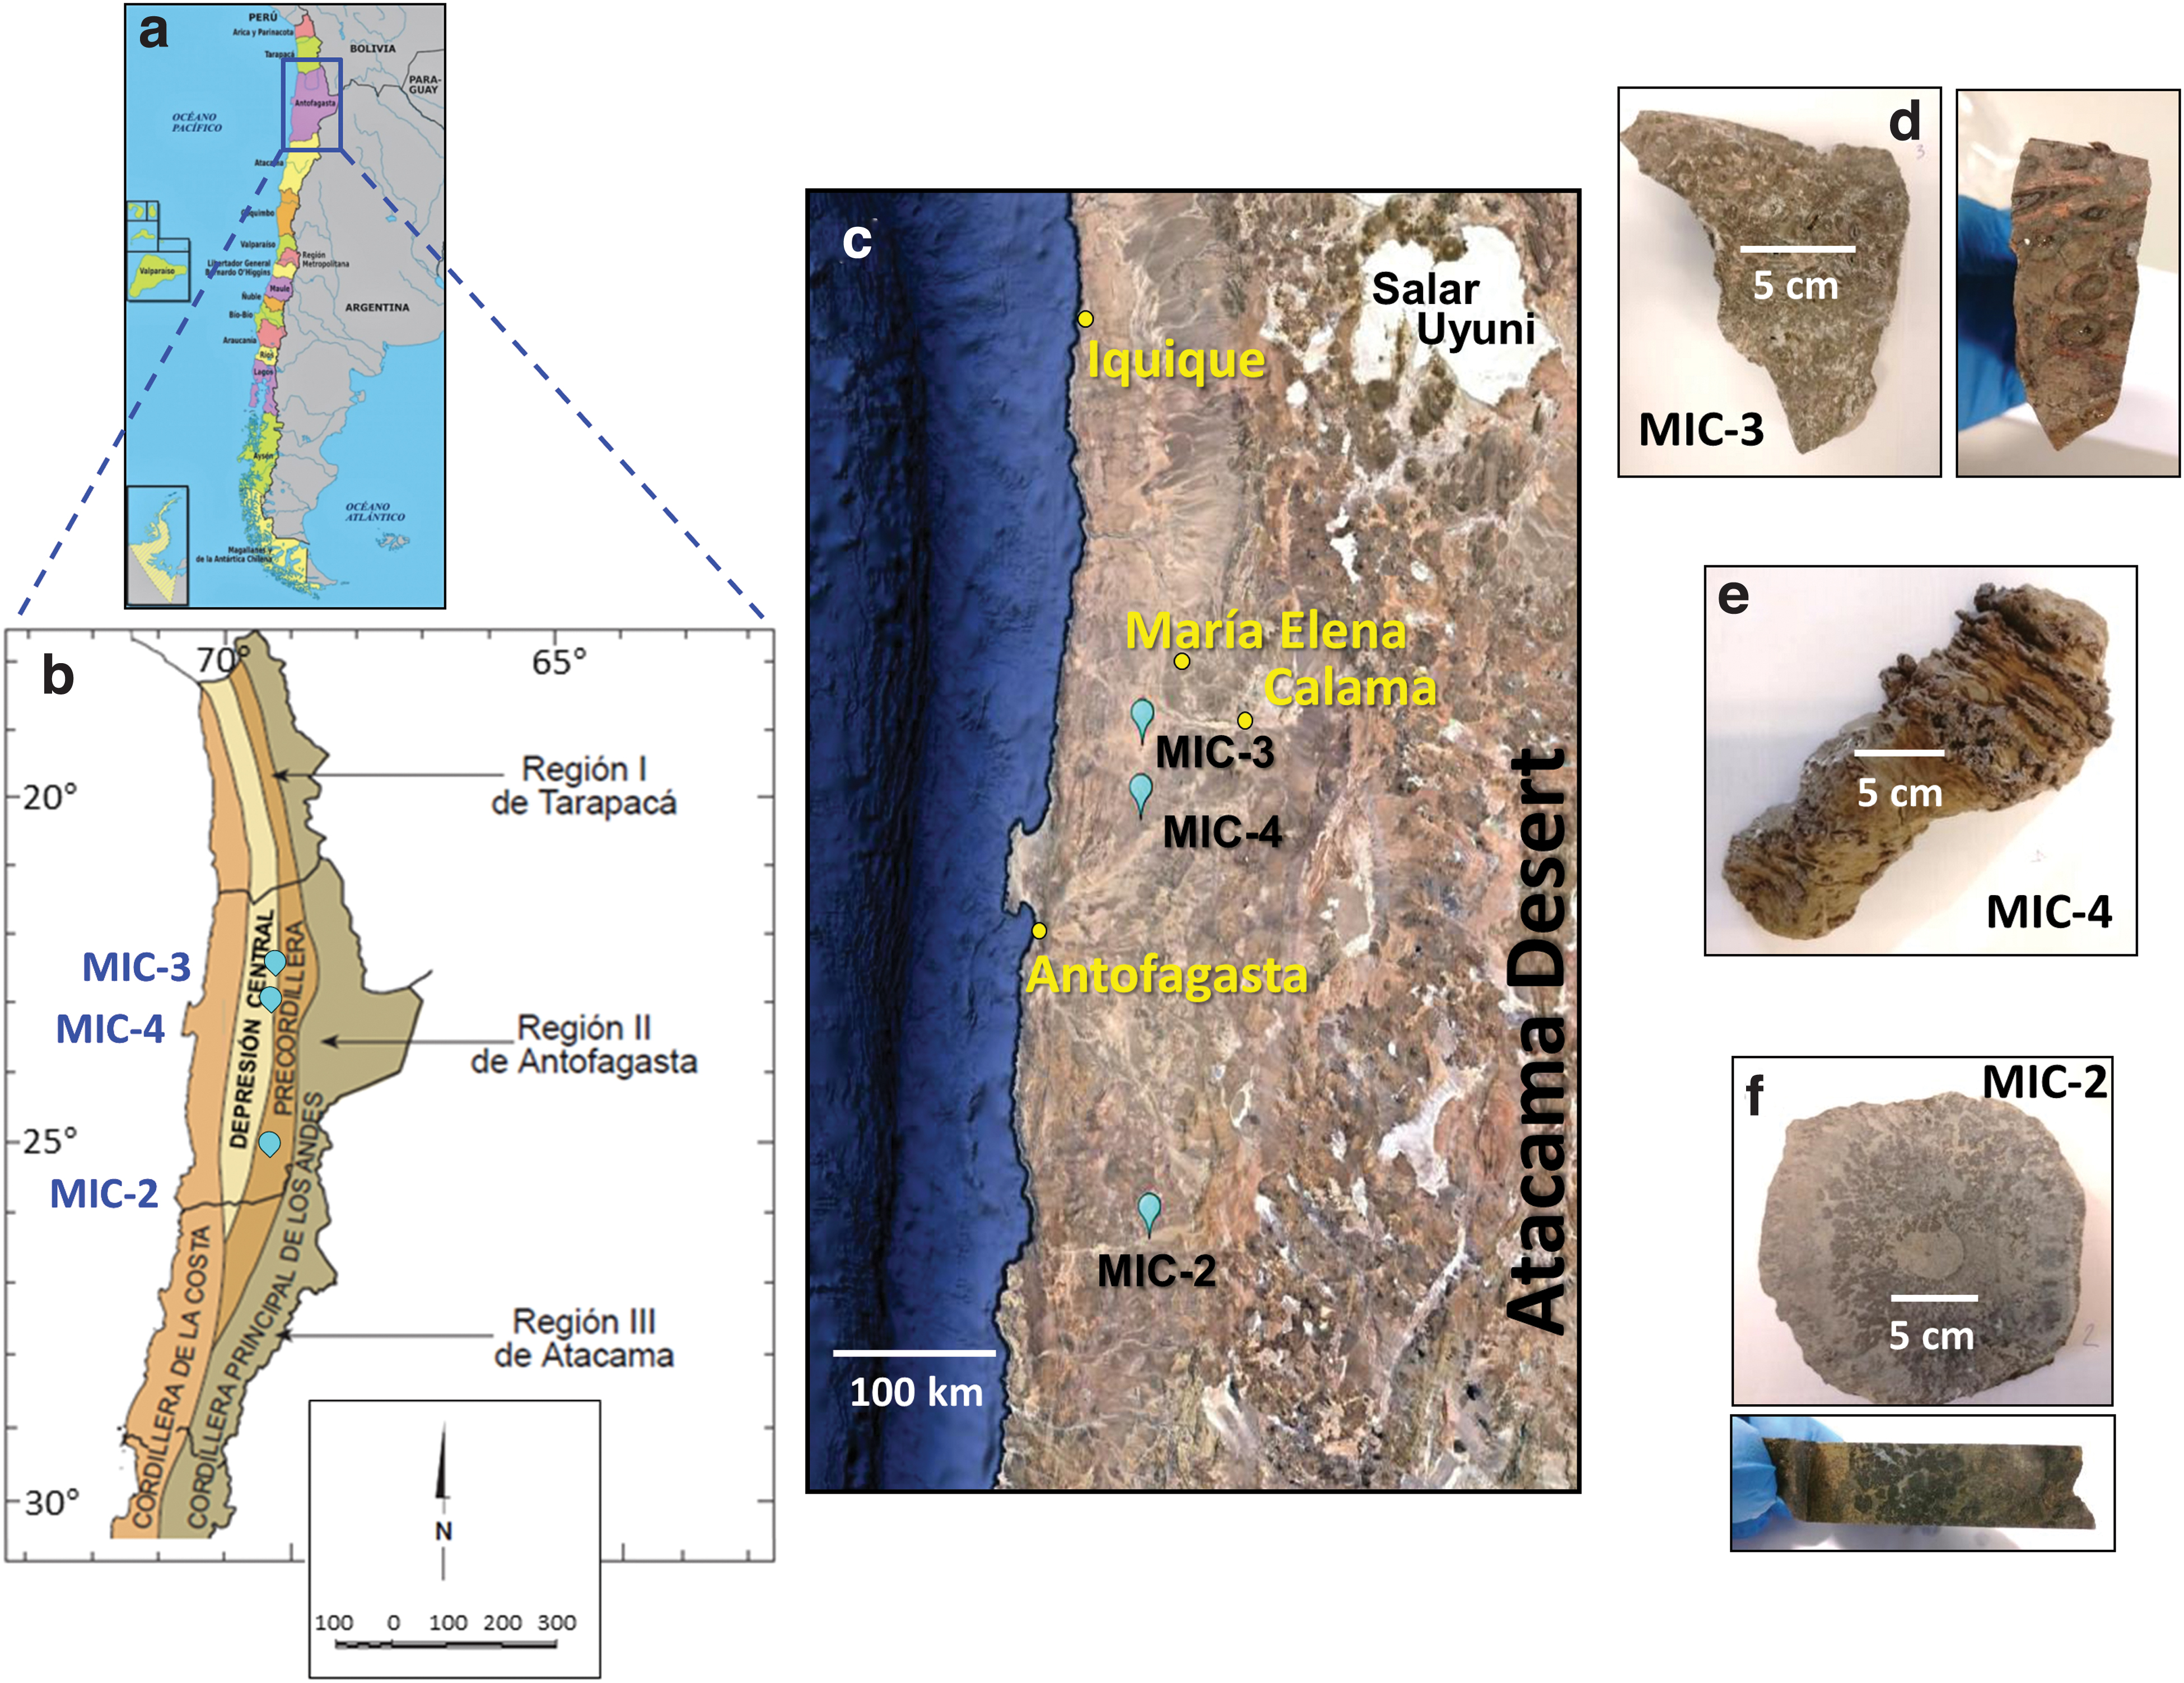
Map showing the location of the three Triassic–Jurassic sample settings in
Sample MIC-2 was collected in Quebrada Vaquillas Altas, in the Cordillera de Domeyko (Table 1), ∼200 km in a straight-line SE of Antofagasta city (Fig. 1a). At the MIC-2 site, a thick sequence of fossiliferous marine rocks of Hettangiense age comprise coral reefs, sandstones, calcareous quartziferous sandstones, and shales outcrops, and is assigned to the Profeta Formation (Chong, 1973; Venegas et al., 2013). During MIC-2 recollection, very poorly preserved remains of ammonoid assigned to Crioceras sp. and corals assigned to the late Triassic (Rhaetian ca. 201–209 Ma) were found.
Samples Location, Geological Description, and Bulk Geochemistry of the Three Triassic–Jurassic Carbonate Rocks in Atacama
Those ratios not calculated because of the absence of denominator.
Guide fossils well identified in this study. Other fossils reported elsewhere are described in the text (see Section 2.1).
Lacking reliable guide of macrofossils in this outcrop, dating here was based on the correlation of this formation with that of MIC-4, by geographic distribution and lithological and environmental arguments.
n.d., not detected; TN, total nitrogen; TOC, total organic carbon.
About 260 km to the north, samples MIC-3 and MIC-4 were collected in the Central Depression area at locations relatively close to each other (∼45 km; Fig. 1a, b). In both cases, these samples were obtained from isolated outcrops of Jurassic calcareous rocks in areas largely covered by quaternary sediments. MIC-4 was collected in an area of low relief formed mainly by limestone outcrops that protrude a few meters above an alluvial sedimentary cover over an area of 1–2 km2 (Table 1). A close reference location is Cerro Birrete, which is located some kilometers to the east (23°01′S and 69°40′W). MIC-3 was collected in limestones from an isolated 1 m2 outcrop (Table 1) in the Lynch District of the former Pedro de Valdivia Mine (22°36′S and 69°40′W).
The Jurassic outcrops of both localities at Cerro Birrete and Pedro de Valdivia are assigned to the Estratos de Rencoret unit as defined in the work of Tobar (1966) as a sequence of fossiliferous calcareous rocks from the Hettangiense-Bajociense ages, which Basso (2004) described as levels of bioclastic and biomicrites limestones with fragments of brachiopods and bivalves. During MIC-4 collection, the presence of Psiloceras aff. Psiloceras semicostatum was recognized in the outcrop, which confirmed a Hettangiense age (∼199–201 Ma). In contrast, no macrofossils were found at the MIC-3 outcrop, thus making a correlation based on geographical distribution and lithological and environmental arguments.
2.2. Sample collection
In the three carbonate settings, rock pieces of 200–250 g were collected for biogeochemical analysis (Fig. 1d–f). The three carbonates mineralogy obtained by X-ray diffraction is shown in Supplementary Fig. S1. Hammer and spatula were used to obtain samples from the consolidated carbonate formations. All geological tools were stainless steel and cleaned with organic solvents (acetone, dichloromethane [DCM], and methanol [MeOH]) before their use. The samples were collected while wearing nitrile gloves and stored in polyethylene zip-log bags.
The samples were then stored cold (∼4°C) until pretreatment in the laboratory, at which time they were externally cleaned to remove any possible contamination from the exposed surface. The external cleaning was conducted in two steps with the intent to (1) sterilize the sample surface with a combination of KOH (5%), HNO3 (10%), ethanol (98%), and Milli-Q water (IQ 7000; Millipore), and (2) remove all possible remains of lipid hydrocarbons on the sample exterior with a mixture of dichloromethane/methanol (DCM:MeOH, 3:1). By implementing these procedures, we were assured that the obtained signal of biomarkers was exclusively of the sample interior, from both primary (predepositional) and secondary (postdepositional) communities. Finally, the cleaned rock samples were ground to powder in a stainless-steel puck mill that was cleaned by grinding baked-out quartz-rich sand, and then subsequently washed with MeOH and DCM.
For the holistic treatment of the carbonate deposits (i.e., integrating the biomarkers record throughout the past ∼200 Ma), the three rocks were handled as a whole being, and completely ground and split in comparable subsamples for the different biogeochemical analyses. The powdered samples were then stored dry, cold (4°C), and in the dark until analysis. All organic solvents (solvent grade 99.9%) and chemicals were supplied by Sigma-Aldrich (Madrid, Spain).
2.3. Bulk geochemistry
The stable isotopic composition of the bulk organic carbon (δ13C) and total nitrogen (TN; δ15N) was measured for the three carbonate samples with isotope-ratio mass spectrometry (IRMS), following U.S. (United States) Geological Survey (USGS) methods (Révész et al., 2012). In brief, ca. two grams of ground, decarbonated (i.e., HCl 1N, overnight), and dried (50°C, 72 h) samples were analyzed by IRMS (MAT 253, Thermo Fisher Scientific). The δ13C and δ15N ratios were reported in the standard per mil notation using three certified standards (USGS41, IAEA-600, and USGS40) with an analytical precision of 0.1‰. The analytical error of the isotopic measurements was 0.15 ‰, and the minimal content needed for detecting the stable isotopes was 5 μg of C and 10 μg of N. The content of total organic carbon (TOC % of dry weight [dw]) and TN (% dw) was measured with an elemental analyzer (HT Flash; Thermo Fisher Scientific) during the stable isotope measurements.
2.4. Biomarker analyses
2.4.1. Lipid biomarkers: extraction and analysis
Free lipids (the operationally defined fraction of organic compounds soluble in nonpolar solvents) were measured on the three carbonate rocks with a method described in detail by Sánchez-García et al. (2019). In brief, between 130 and 162 g of grounded samples were extracted in a Soxhlet apparatus with a mixture of DCM:MeOH (3:1, v/v) during 24 h, after addition of three internal standards (tetracosane-D50, myristic acid-D27, 2-hexadecanol). While the extraction of internal standards is likely more efficient than that of endogenous molecules preserved in ancient environmental samples, it is a bias that must be assumed and affects all samples similarly.
After extraction, the total lipid extract (TLE) was concentrated to ∼2 mL in a rotary evaporator and treated with activated copper to remove elemental sulfur. The TLE was then separated into three fractions of different polarity containing hydrocarbons (nonpolar), alcohols (polar), and fatty acids (acidic) (see Sánchez-García et al. [2019] for details on the solvent mixtures and chromatography columns). All lipid fractions were analyzed by gas chromatography–mass spectrometry (GC-MS), either directly (nonpolar fraction) or after derivatization (acidic and polar fractions). The acidic fraction was transesterified with BF3 in MeOH to produce fatty acid methyl esters (FAMEs), and the polar fraction was trimethylsilylated (N,O-bis [trimethylsilyl] trifluoroacetamide [BSTFA]) to analyze the resulting trimethyl silyl alkanols.
Compound identification was based on comparing retention time and mass spectra between detected compounds and reference materials, on mass-to-charge ratios of 57 (n-alkanes and isoprenoids), m/z = 74 (n-fatty acids as FAMEs), and ls and sterols). The quantification of compounds was conducted by using external calibration curves of normal alkanes (n-C10 to n-C40), FAME (n-C8 to n-C24), and alkanols (n-C10, n-C14, n-C18, and n-C20), as well as branched isoprenoids (pristane, phytane, squalane, and squalene), all from Sigma-Aldrich. Recovery of the internal standards was measured to average 72% ± 19%, with no significant difference of extraction between the three standard families despite their different polarity.
The three lipid fractions were analyzed by GC-MS with a 6850 GC system coupled to a 5975 VL MSD with a triple axis detector (Agilent Technologies). Operational details on the GC-MS analysis of each lipid fraction (oven programs, injection details, or reference materials) are provided elsewhere (e.g., Sánchez-García 2018, 2020). In total, compounds from three family series (normal and branched alkanes, including isoprenoids; normal, branched and unsaturated fatty acids; normal alkanols and sterols) were identified (Supplementary Tables S1–S3).
Two-dimensional gas chromatography coupled to a flame ionization detector (GCxGC-FID) was applied to screen pentacyclic terpanes (hopanoids) and steranes according to a previously described method (Aeppli et al., 2014). In brief, 2 μL of TLE was injected into a GCxGC system equipped with liquid nitrogen-operated thermal modulator (Leco Corporation, St. Joseph, MI). Peak detection and integration were performed with the ChromaTOF software (Leco). Quantification of hopanoids was performed with pure 17α(H), 21β(H)-hopane (Chiron, Norway). Identification of hopanoids and tentative identification of steranes were performed by comparison of retention times with previously characterized crude oil samples (Aeppli et al., 2014). In total, 11 hopanoid compounds and two sterane epimers (Supplementary Table S4) were identified and quantified.
Compound-specific carbon isotopic composition was measured on compounds from the alkane and fatty acid families. The CSIA was performed by coupling the gas chromatograph (Trace GC 1310 ultra) with the isotope-ratio mass spectrometry system (MAT 253 IRMS; Thermo Fisher Scientific). Details on the gas chromatography IRMS (GC-IRMS) conditions, sample injection and analysis, as well as isotopic composition calculations are provided elsewhere (e.g., Carrizo et al., 2019). All δ13C values are reported relative to the Pee Dee Belemnite (PDB) standard, and those for the fatty acids are calculated from the FAME values, by correcting them for the one carbon atom added in the methanolysis (Abrajano et al., 1994).
2.4.2. Protein biomarkers: extraction, analysis, and identification
Metaproteomic analyses were performed to detect relatively recent biosignals on the three carbonate samples. Proteins were extracted with sodium dodecyl sulfate (SDS) and precipitated with trichloroacetic acid (TCA), following the work of Chourey et al. (2010) and Hultman et al. (2015) with several modifications.
In brief, 10 g of each sample was split into 5 g and suspended in 5 mL of SDS lysis buffer (4% SDS, 100 mM Tris-HCl, pH 8.0). Subsamples were immersed in boiling water for 10 min, mixed by vortexing, and pulse sonicated (10 s on and 10 s off) for 4 min at 20% amplitude for cell disruption. Samples were immersed again in boiling water for 10 min and centrifuged at 21,000 g for 10 min at 4°C. Supernatant with cell lysate was precipitated with 20% TCA overnight at −20°C and centrifuged at 21,000 g for 40 min at 4°C. Pellets were washed thrice with 1 mL of ice-cold acetone, and in the last wash, subsamples were combined, centrifuged, and the pellets air-dried. The pellets were dissolved in Milli-Q water for total protein determination with Qubit Protein Assay kit (Invitrogen, Thermo Fisher Scientific) and sent for sequencing to Proteomics Unit in Complutense University of Madrid.
Total protein biomass of each sample was trypsin digested. In brief, proteins were reduced with 10 mM DTT at 56°C for 1 h, incubated with 55 mM iodoacetamide in the dark for 30 min at room temperature, and digested with 0.25–0.5 μg of trypsin (Roche Molecular Biochemicals) in 25 mM of ammonium bicarbonate overnight at 37°C. Peptides were extracted from gel with acetonitrile, dried by centrifugation (SpeedVac, Savant), and reconstituted in 2% acetonitrile and 0.1% formic acid for analysis. Final peptide determination measured with Qubit was below the detection limit (0.1 μg·μL−1), and then equal sample volumes were used for Liquid Chromatography tandem Mass-Spectrometry (LC-MS/MS) analysis.
The desalted protein digest was analyzed in a nano Easy-nLC 1000 system (Thermo Scientific) coupled to a high-resolution mass spectrometer Q-Exactive HF (Thermo Scientific). The same volume of each sample was loaded onto a Acclaim PepMap 100 precolumn (20 mm × 75 μm ID, C18, 3 μm and 100 Å; Thermo Scientific) and separated with C18 Picofrit column (150 mm × 75 μm ID, 3 μm and 100 Å; Nikkyo technos Co.) with a flow rate of 250 nL·min−1. The mobile phase consisted of 0.1% formic acid and 2% acetonitrile in water (A) and 0.1% formic acid in acetonitrile (B). Gradient profile started from 5% to 35% B for 145 min, increased to 45% B for 10 min, and changed to >95% B for 10 min. Peptides were detected in full-scan mode for a mass range of 350–2000 Da.
Mass spectra were analyzed with the search engine MASCOT v.2.6.1 using Proteome Discoverer v.2.2 software (Thermo Scientific) with SwissProt database (
Protein identification was performed by using Percolator algorithm with a false discovery rate <1% and, at least, one peptide identified with a confidence level >95%. Relative abundances of the identified proteins were calculated by using the normalized spectral abundance factor (NSAF) for cross-sample comparison following the work of Zybailov et al. (2006). The spectral count number (SC) identified in a protein was divided by the protein length (L) and then by the sum of SC/L for all proteins in the sample. Proteins assigned to prokaryotes and eukaryotes (for a more conservative approach, kingdom Animalia was excluded to ensure removal of potential human contamination during protein extraction and analysis) were selected for this study, and biological functions were inferred with Bast2GO 5 Software (Götz et al., 2008) based on Gene Ontology annotation.
2.4.3. Immunodetected biomarkers: the LDChip
Powdered carbonate samples were analyzed with the LDChip immunosensor (i.e., LDChip), a fluorescent sandwich microarray immunoassay (FSMI) produced for the simultaneous detection of potential microbial biomarkers in environmental samples (e.g., Rivas et al., 2008; Sánchez-García et al., 2019). The LDChip is the core of the Signs of Life Detector (SOLID) instrument concept (Parro et al., 2008, 2011) designed for detecting possible traces of life in the field for planetary exploration (Blanco et al., 2017; Moreno-Paz et al., 2018).
The LDChip used in this work was composed of ∼200 polyclonal antibodies (see details in Supplementary Table S5 and Sánchez-García et al., 2018; 2019) produced against a wide range of immunogens (small organic molecules; peptides and proteins; exopolysaccharides and lipopolysaccharides; and spores or whole cells of bacteria and archaea) from extant or well-preserved remains of extinct life (Rivas et al., 2008; Sánchez-García et al., 2018). In addition, bovine serum albumin, protein printing buffer (Arrayit Corporation, CA), and preimmune sera were used as negative controls. To build the microarray, the immunoglobulin fraction of each antibody was purified with protein-A by using the PURE1A kit (Sigma-Aldrich Quimica S.L.) and printed onto microscope slides in a triplicate spot pattern. Antibodies were titrated, fluorescently labeled with Alexa 647, and used to perform the FSMI as previously reported (Rivas et al., 2008).
In this study, 0.5 g of the carbonate samples was suspended in 2 mL of TBSTRR buffer (0.4 M Tris-HCl pH 8, 0.3 M NaCl, 0.1% Tween 20), homogenized with a handheld ultrasonicator to extract the organic matter, and then filtered through 5 μm filter. A volume of 50 μL of each filtrate was used for the FSMI on the LDChip printed on epoxy-activated glass slides (CEL Associates, Inc., Pearland, TX) in nine replicates fitting with a Multi-Array Analysis Module (MAAM) to simultaneous analysis of up to eight samples. After washing with the TBSTRR buffer, 50 μL of the mixture of 200 Alexa-647 labeled antibodies was incubated in each chamber, and then scanned in a GenePix 4100A scanner (Rivas et al., 2008). The resulting images were analyzed and quantified by the GenePix Pro 7.0 Software (Molecular Devices, Sunnyvale, CA).
The fluorescence intensity (F) of positive antigen–antibody reactions was calculated as previously reported (Blanco et al., 2017). To avoid false positives in the FSMI, fluorescent signal intensities for each antibody were considered positives when they had intensity ∼2.5 times the background level. Results were normalized per taxonomic group based on total microarray fluorescent values and finally represented as a color-patterned heatmap for better visualization. Proteins were classified according to a presence/absence matrix and assigning their molecular function based on Gene Ontology terms.
3. Results
3.1. Bulk geochemistry of the three Triassic–Jurassic carbonate rocks in the Atacama region
The ancient carbonates contained little organic matter, as represented by TOC (% dw) from 0.08% to 0.29% (Table 1). MIC-2 was the TOC richest sample (0.29%) and the only one containing any nitrogen TN (0.02%). The stable carbon isotopic composition of TOC (i.e., bulk δ13C) was measured at −23.7‰ (MIC-2), −14.1‰ (MIC-3), and −18.7‰ (MIC-4). δ15N could only be measured in MIC-2 (3‰; Table 1).
3.2. Distribution of lipids, the relatively most perdurable biomarkers, in the three rocks
The total organic-soluble biomass in the three carbonates was measured to represent from 981 to 1816 μg·g−1 of TOC (Table 2), corresponding to 1.5–2.8 μg·g−1 of dw. In general, hydrocarbons were the most abundant lipids in the carbonate samples (559–963 μg·g−1 TOC or 0.67–2.3 μg·g−1 dw). Saturated straight-chain compounds (i.e., n-alkanes) represented 79–93% of the apolar fraction (Table 2), with chains ranging from C10 to C34 and maximum peaks at C16 (MIC-2), C25 (MIC-3), and C15 (MIC-4) (Supplementary Fig. S2a–c). Other minority hydrocarbons were monomethylated alkanes (∼5% of apolar fraction) and isoprenoids (≤11%) such as pristane (Pr), phytane (Ph), or norpristane (Supplementary Table S1).
Concentration (μg
Alkyl lipids in the apolar, polar, and acidic fraction were measured by regular gas chromatography–mass spectrometry, whereas aromatic compounds (hopanes and steranes) were measured by GCxGC-FID.
Sum of n-alkanes from 10 to 34 carbons. For individual concentrations see Supplementary Table S1.
Sum of monomethyl alkanes from 16 to 29 carbons. For further details and individual concentrations see Supplementary Table S1.
2,6,10,14-Tetramethyl-pentadecane.
2,6,10,14-Tetramethyl-hexadecane.
2,6,10-Trimethyl-pentadecane.
For the detailed list of compounds and concentrations from the apolar fraction see Supplementary Table S1.
Sum of n-fatty acids from 8 to 30 carbons. For individual concentrations see Supplementary Table S2.
Sum of the C16:1 and C18:1 fatty acids.
Sum of the C6 and C22 dicarboxylic acids.
Sum of branched fatty acids C15 and C17 with methyl groups in iso- and/or anteiso-positions.
Sum of branched fatty acids with methyl groups in other positions than iso or anteiso.
For the detailed list and concentrations of compounds from the acid fraction see Supplementary Table S2.
Sum of 1-alkanols from 10 to 30 carbons. For individual concentrations see Supplementary Table S3.
Sum of n-alkanols with the OH group in another position than 1. For further details and individual concentrations see Supplementary Table S3.
Sum of branched alkanols. For details and individual concentrations see Supplementary Table S3.
Cholest-5-en-3b-ol.
24-Ethyl-5a-cholest-22-en-3b-ol.
4-Ethylcholest-5-en-3b-ol.
For the detailed list and concentrations of compounds from the polar fraction see Supplementary Table S3.
Sum of hopanoids from 27 to 34 carbons. For further details and individual concentration see Supplementary Table S4.
Combination of the two C29 sterane epimers 24-ethyl-5α(H),14β(H),17β(H)-20S/R-cholestane.
ACL of C10–C34 n-alkanes. ACLi-n = Σ(i·Xi +…+ n·Xn)/Σ (Xi +…+ Xn), where X is concentration (van Dongen et al., 2008).
CPIi-n = ½Σ (Xi + Xi+2 +…+ Xn)/Σ (Xi-1 + Xi+1 +…+ Xn-1) + ½ Σ (Xi + Xi+2 +…+ Xn)/Σ (Xi+1 + Xi+3 +…+ Xn+1), where X is concentration (van Dongen et al., 2008). Proxy indicative of biomass maturity (Hedges and Prahl, 1993).
Ratio of pristane over phytane. Proxy of the redox conditions in the bottom waters of a sedimentary environment (Peters et al., 2005).
Low- over high-molecular weight n-alkanes; LMW/HMW = (C16 + C18)/(C27 + C29 + C31). Proxy indicative of the relative proportion of prokaryotes over eukaryotes (Grimalt et al., 1986; Vonk et al., 2012).
TAR = (n-C27 + n-C29 + n-C31)/(n-C15 + n-C17 + n-C19) (Bourbonniere and Meyer, 1996).
Ratio of emergent and submerged over floating macrophytes (Ficken et al., 2000); Paq = (n-C23 + n-C25)/(n-C23 + n-C25 + n-C29 + n-C31).
Ratio of isoprenoids (sum of pristane and phytane) over normal alkanes C17 and C18. Proxy of the relative contribution of autotrophs over heterotrophs (Canfield and Des Marais, 1993).
Sum of branched heptadecane over normal heptadecane. Proxy of the relative abundance of heterotrophs (Chen et al., 2011).
ACL, average chain length; CPI, Carbon Preference Index; TAR, terrestrial-over-aquatic ratio.
Fatty acids (measured as FAMEs) were detected from 94 to 928 μg·g−1 TOC (0.27–1.1 μg·g−1 dw), with MIC-4 showing the largest concentration (Table 2). n-Fatty acids ranging from C8 to C30 with a consistent maximum peak at C16 (Supplementary Fig. S2d–f) represented the most abundant acidic moieties (74–95%), while iso/anteiso acids of C15 and C17, monounsaturated acids (C16:1 and C18:1), or alkanodioic acids (C6 and C22) represented only 1–15% (Table 2 and Supplementary Table S2).
The polar fraction representing 10–249 μg·g−1 of TOC (0.03–0.20 μg·g−1 dw) was primarily composed (79–81%) of n-alkanols with the hydroxyl group in position 1 (i.e., n-alkanols) (Table 2). Other moieties in this fraction were alkanols with the OH-group in another position than 1 (≤10%), branched alkanols (e.g., ethyl-, butyl-, or hexyl- derivatives; ≤1%), or sterols (≤11%), including cholesterol, stigmasterol, and β-sitosterol (Supplementary Table S3).
Hopanoids were measured at concentrations from 52 to 90 μg·g−1 TOC (0.06–0.25 μg·g−1 dw), representing between 3% and 9% of their TLE. In total, nine hopanoids from C27 to C33 were detected (Supplementary Table S4), with C30-hopane (H) being the most abundant hopanoid. Homohopanes with 31 to 34 carbons were also detected. For the C31 and C34 homohopanes (HH and 4HH, respectively), the S epimer was more abundant than the R epimer, whereas the opposite was the case for the C32 and C33 homohopanes (2HH and 3HH, respectively). Preferential depletion of R epimer of long-chain homohopanes such as 4HH has been linked to biodegradation (Aeppli et al., 2014).
We tentatively also identified various compounds in the elution range of C27 to C29 diasteranes and steranes. Due to chromatographic interference with other unknown compounds, their quantification was challenging. However, we tentatively identified and quantified two C29 sterane epimers (i.e., 24-ethyl-5α(H),14β(H),17β(H)-20S/R-cholestane), both overlapping chromatographically. Their combined abundance was lower than that of H for MIC-2 and MIC-3 (ratio of the combined two C29 sterane epimer to H of 0.4 and 0.05 for MIC-2 and MIC-3, respectively), and slightly higher than H for MIC-4 (ratio of 1.1).
A number of compounds from the apolar (hydrocarbons) and acidic (fatty acids) fractions showed concentrations sufficiently high to be analyzed for their compound-specific 13C isotopic composition (Fig. 2). All compounds showed δ13C values significantly depleted (Fig. 2) relative to the bulk δ13C in the three carbonate samples (Table 1), especially in MIC-3 and MIC-4. Among the hydrocarbons, the detected n-alkanes and isoprenoids showed δ13C values from −25.6‰ to −31.7‰ (Fig. 2a), with MIC-4 displaying the widest interval and MIC-2 the narrowest largely due to the smaller number of compounds detected in the latter by GC-IRMS. Among the acidic moieties, only the n-C14, n-C16, and n-C18 were detected for δ13C in MIC-2 and MIC-3, whereas in MIC-4 the whole n-fatty acids series and some monounsaturated (C16:1[ω7] and C18:1[ω9]) and anteiso-C15 and C17 fatty acids were measured. δ13C values in all fatty acids ranged from −26.8‰ to −31.5‰ (Fig. 2b).
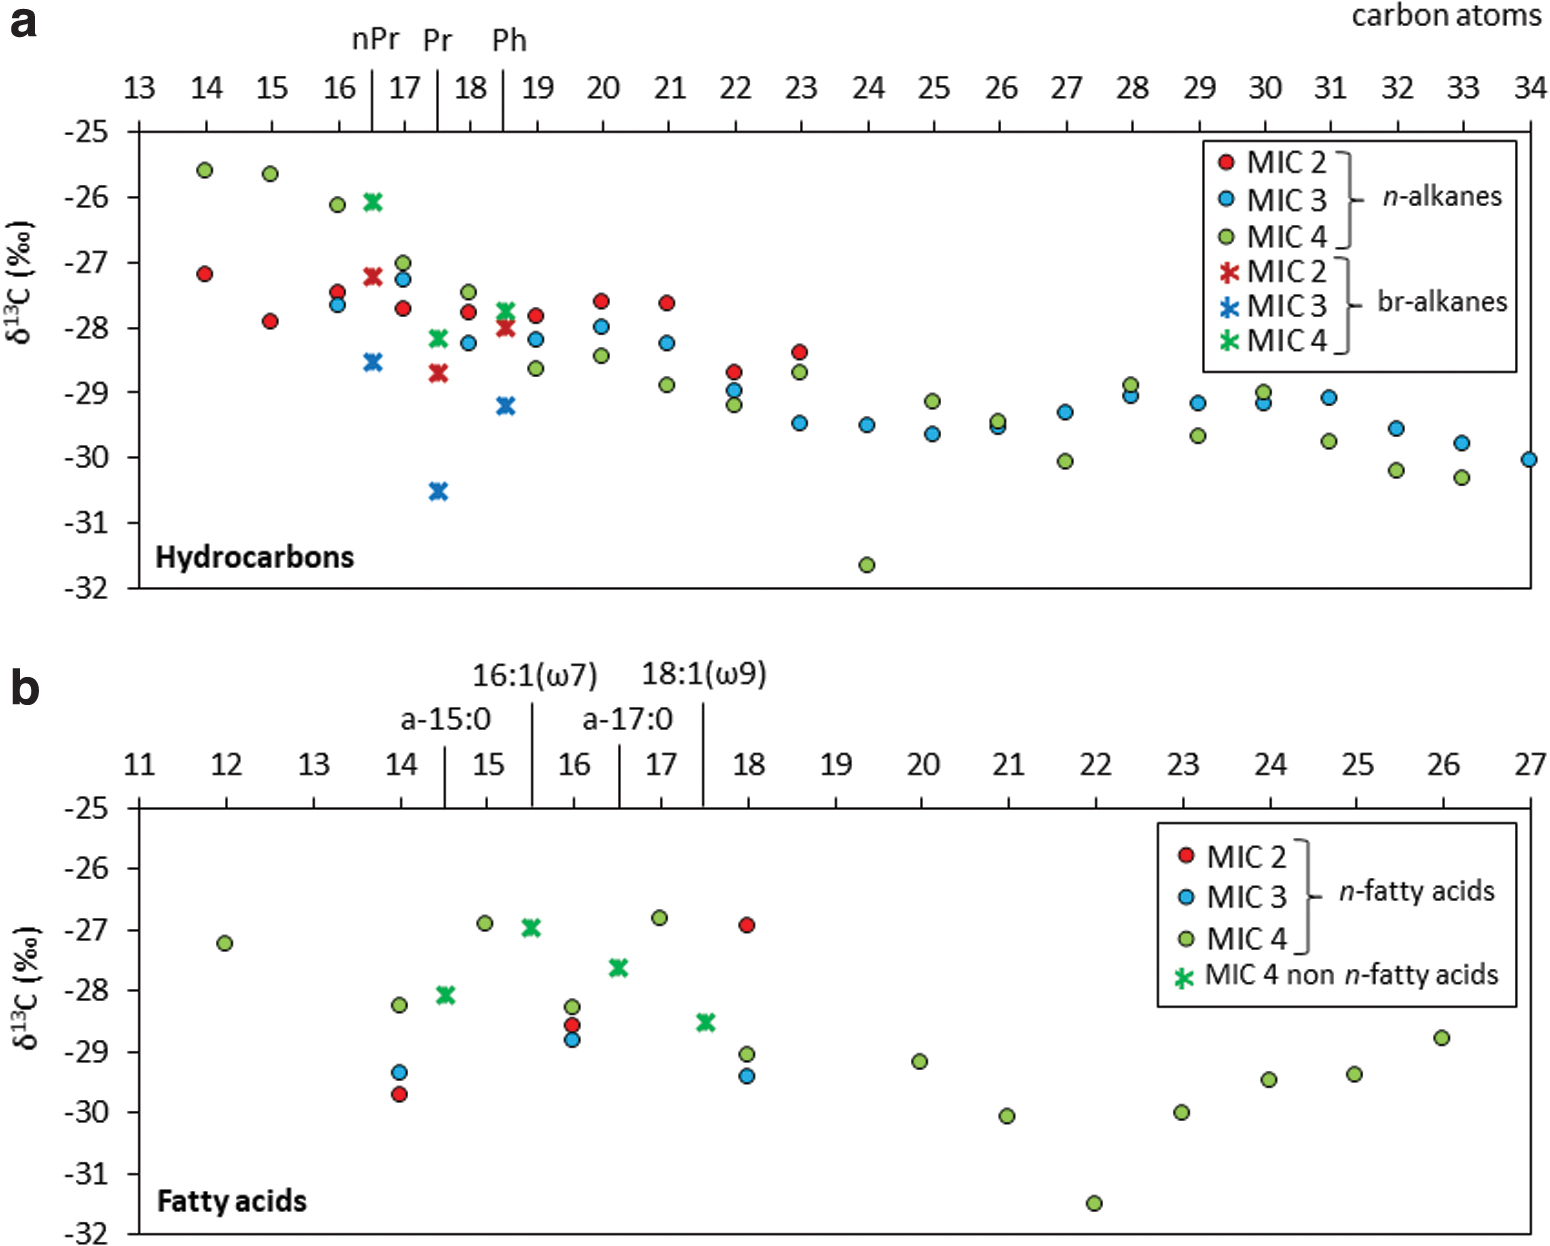
Stable carbon isotopic composition (δ13C) of lipid biomarkers in the apolar
3.3. Modern/subrecent biosignatures and metabolic traits inferred from the proteins
Total protein extracts from the collected samples (4.31 μg for MIC-2, 2.36 μg for MIC-3, and 3.27 μg for MIC-4) were subjected to metaproteomic analysis. We identified preserved peptide sequences from bacteria, archaea, and eukaryotes in the three carbonate rocks (Supplementary Table S6), which can be attributed to modern (including extant) and recent/subrecent (i.e., not older than ∼3.5 Ma) (Demarchi et al., 2016) biomass. In total, 20 different proteins were identified (11 annotated to prokaryotes, 10 to bacteria, and only one to archaea), and showed differences in number and composition between the samples (Fig. 3).
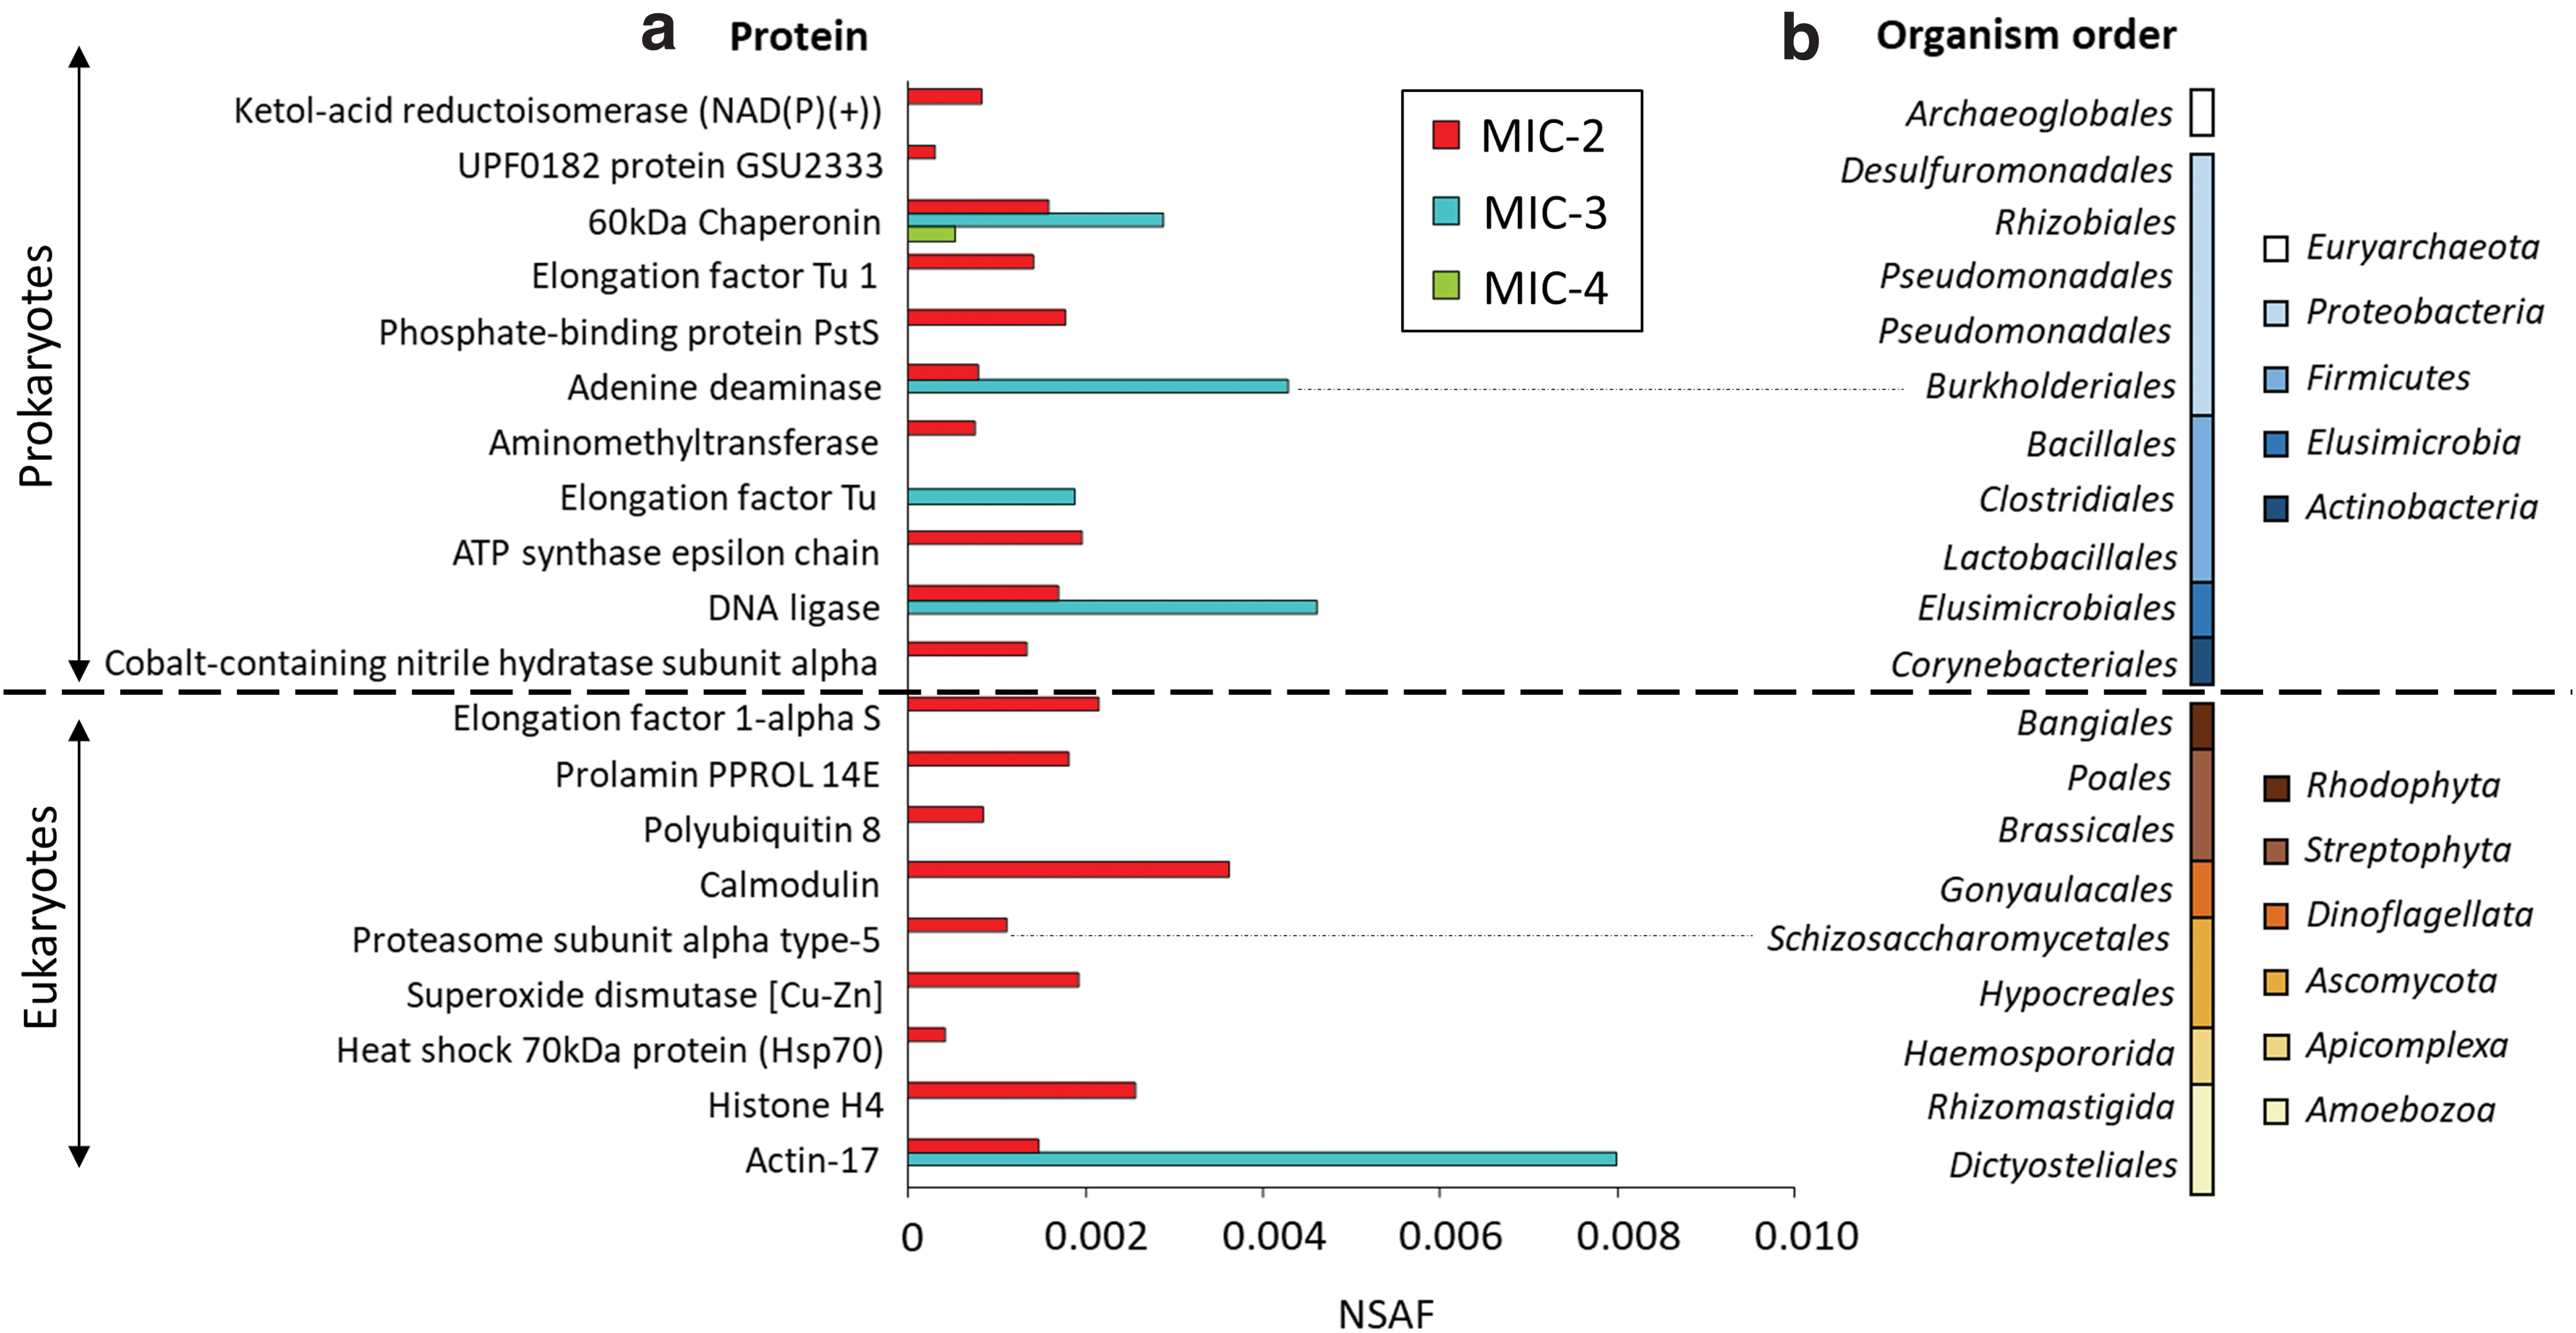
NSAF of
MIC-2 contained preserved sequences of 10 prokaryotic proteins at generally similar relative abundance (i.e., NSAF). MIC-3 showed the highest relative abundance (i.e., largest NSAF) of the only four prokaryotic proteins as follows: DNA ligases, adenine deaminases, elongation factor Tu, and a chaperonin, the only protein detected in MIC-4 (Fig. 3a). In addition, nine proteins associated with eukaryotes (kingdom Animalia excluded) were detected in MIC-2 and only 1 in MIC-3. The most abundant eukaryotic proteins were related to actins, calmodulins, histones, elongation factors, superoxide dismutases, and prolamins (Fig. 3a).
Most metabolic processes inferred from both prokaryotic and eukaryotic proteins were related to protein biosynthesis, stabilization, and energy metabolism (Supplementary Fig. S3). Biosynthesis, primary, and cellular metabolism represents 37% of the total biological processes, and organic, nitrogen, and small molecule metabolism represents 35%. Apart, proteins related to response to stress and stimulus (4%), localization (4%), interspecies interaction (2%), among others, indicate the relationship of bacteria and archaea with the surrounding environment.
Metabolic processes inferred from eukaryotic proteins were more related to biological regulation—positive/negative modulation of a process, such as immune system response or cell growth—(22%), cellular and multicellular organization (14%), general metabolism (7%), and signaling (5%). Processes that revealed an interaction with the environment were response to stimulus (8%), immune system (4%), and locomotion (2%).
Taxonomic annotation of the protein sequences reflected distinct microbial community compositions in the three ancient samples (Fig. 3b). MIC-2 was related to a wider number of bacterial (Proteobacteria, Firmicutes, Elusimicrobia, and Actinobacteria), archaeal (Euryarchaeota), and eukaryotic (Rhodophyta, Streptophyta, Dinoflagellata, Ascomycota, and Apicomplexa) phyla, compared with those in MIC-3 (Proteobacteria, Elusimicrobia, and Amoebozoa) and, mostly, MIC-4 (only Proteobacteria).
3.4. Modern/subrecent biosignatures and metabolic traits from the LDChip immunodetections
The LDChip showed positive immunodetections with antibodies against a number of proteins and microbial groups (Fig. 4), revealing the presence of complex microbial molecular material related to modern/subrecent biomass. Most proteins were detected in MIC-3 (n = 8), whereas MIC-2 and MIC-4 showed positive signals only for three or two proteins, respectively (Fig. 4a).
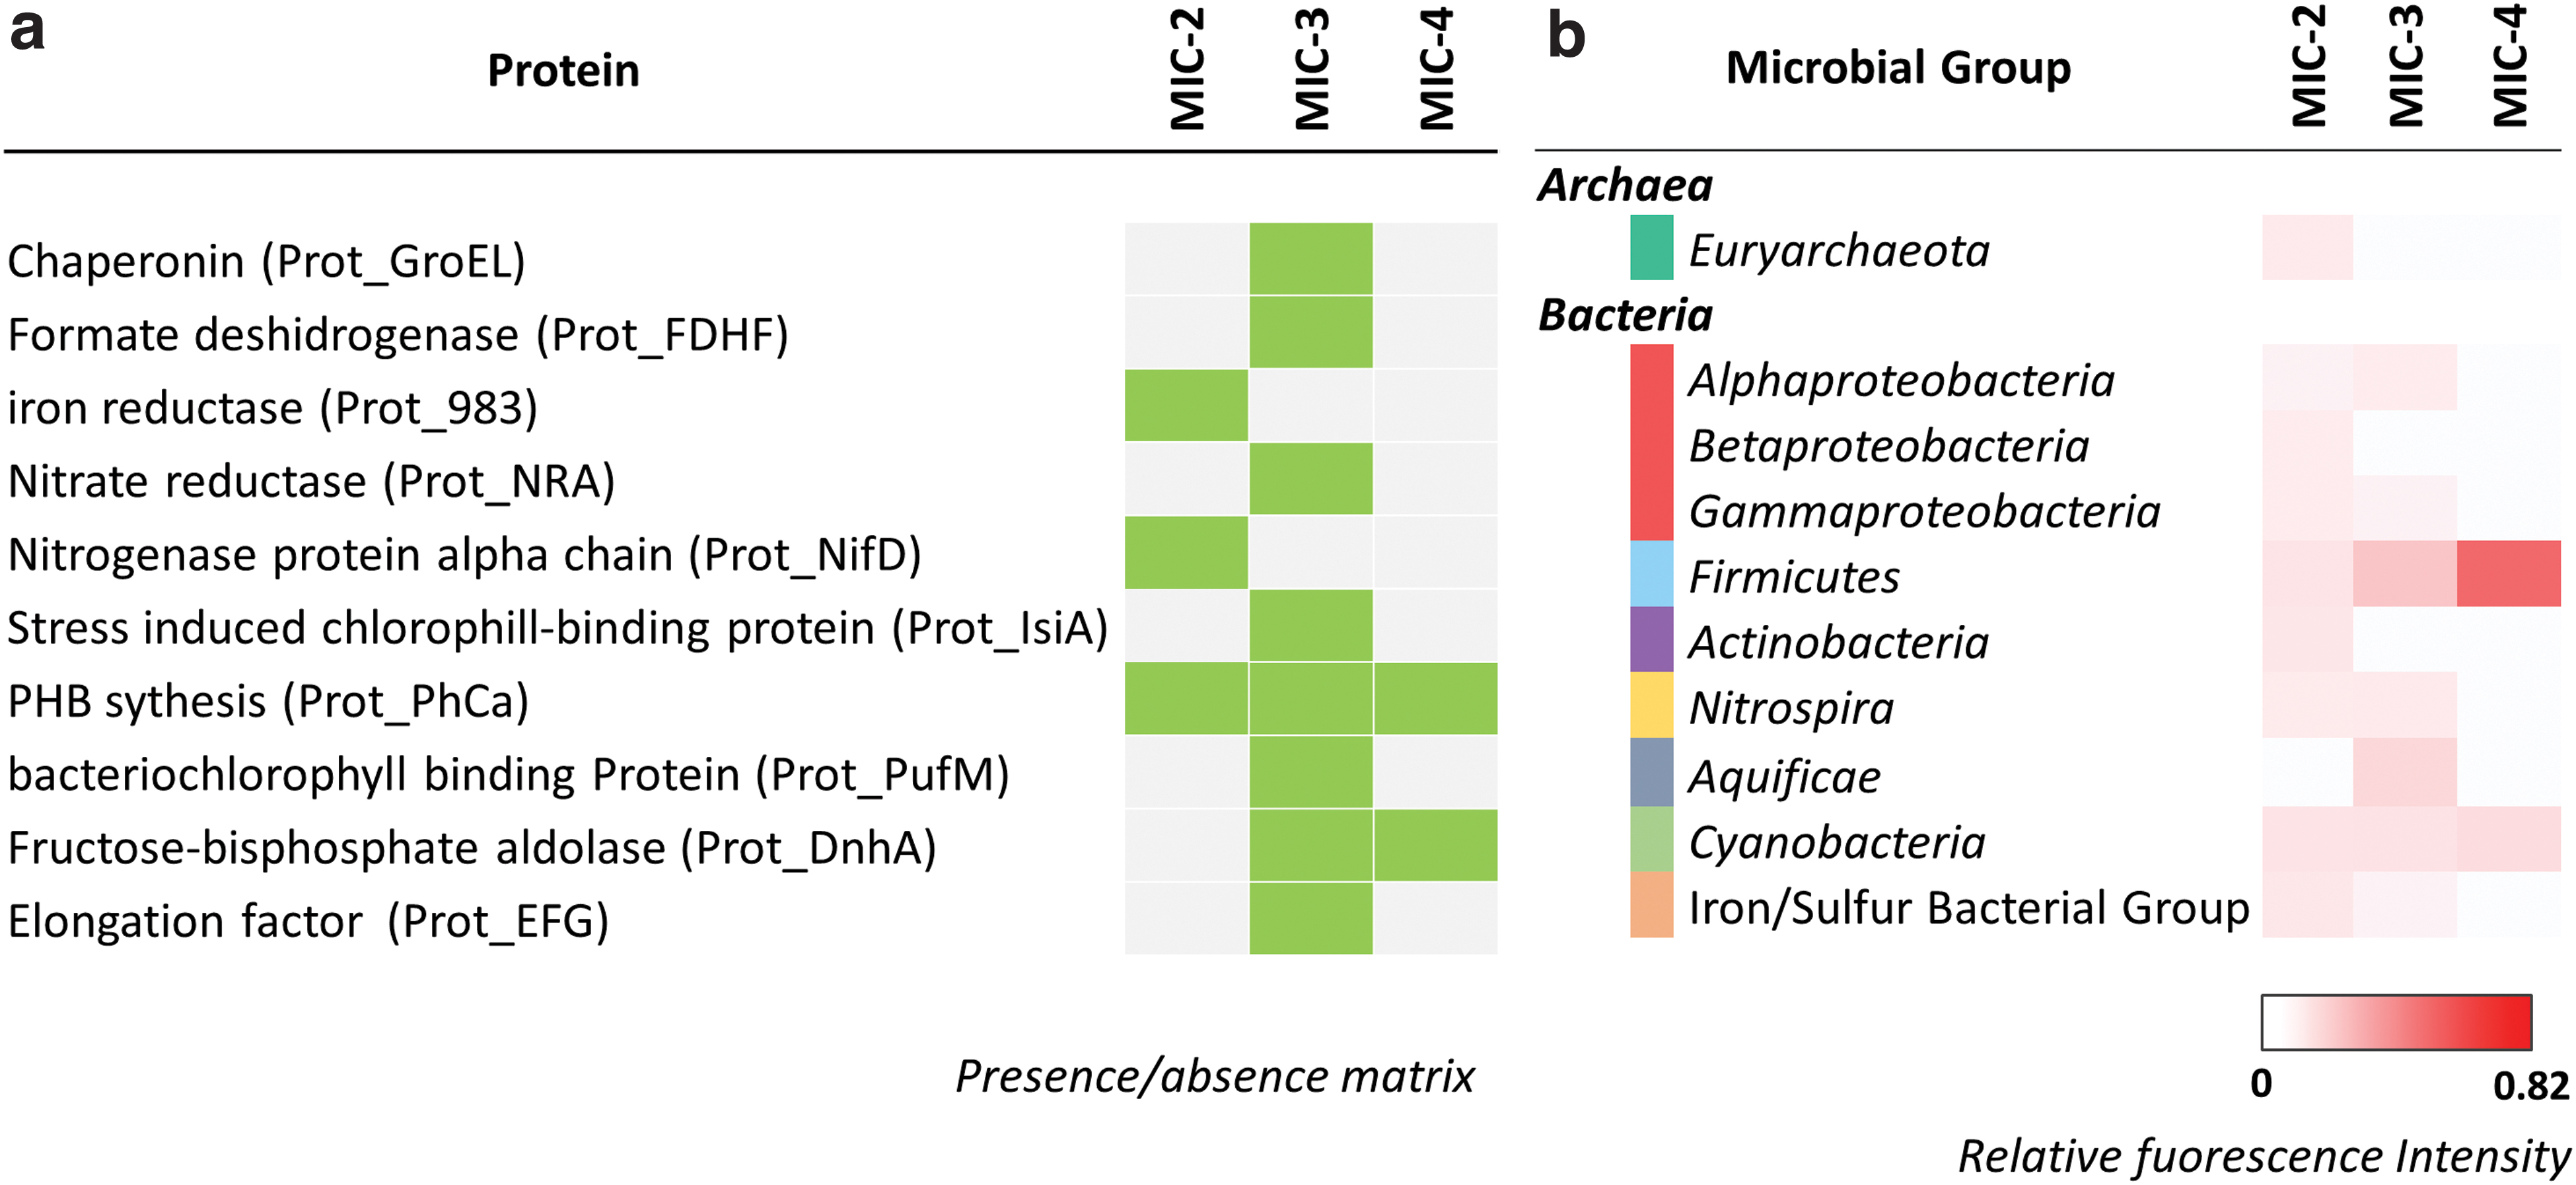
Heatmap representing relative fluorescence signals obtained in the three Triassic–Jurassic carbonate deposits in Atacama with fluorescent sandwich microarray immunoassay in the LDChip Microarray immunosensor. Antibodies are grouped into different categories corresponding to
Positive immunosignals against proteins (n = 10) could be grouped into three categories of biomarkers according to their biological process: oxidative stress, energy generation, and metabolic processes. The majority of the proteins detected (60% of total immunopositive signals) are known to be involved in oxidative stress and could be indicative of changing environmental conditions. Polyhydroxyalkanoate synthase (Prot_PhaC), which is responsible for the synthesis of polyhydroxyalkanoates (PHAs), was present in all samples (Fig. 4a). The enzyme is widely distributed in bacteria, and the major physiological role of its product is to store carbon and energy to favor cell survival under starvation conditions.
Among other immunosignals detected in stress conditions, three proteins were related to energy generation; two of them—IsiA, a chlorophyll-binding protein, and PufM, a reaction center protein M chain—which are known to be involved in electron transport during photosynthesis, were only detected in MIC-3; the third protein (the fructose biphosphate aldolase, Prot_DnhA) is involved in glycolysis, and was detected in MIC-3 and MIC-4. Two proteins directly involved in nitrogen metabolism were detected, one related to nitrogen fixation (Prot_NifD) in MIC-2 (Fig. 4a) and a nitrate reductase (Prot_NRA) only present in MIC3.
In addition, MIC-3 showed positive signals for essential proteins involved in other cellular functions, such as a chaperonin-like protein (Prot_GroEL) mainly associated with protein folding or the elongation factor (Prot_EFG) required in protein biosynthesis (Fig. 4a). In contrast, MIC-2 showed a positive signal for a dissimilatory iron reductase-like protein (Prot_983) associated with the generation of proton motive force across the cytoplasmic membrane to synthesize ATP. These results agreed with the presence in this sample of positive signals of iron/sulfur bacterial group (Fig. 4b). Finally, MIC4 presented positive signals only for proteins related to oxidative stress (Prot_PhaC and Prot_DnhA).
Positive immunodetections with several antibodies were assigned to 10 microbial taxa (Fig. 4b), 9 in MIC-2, 7 in MIC-3, and 2 in MIC-4. Only Firmicutes and Cyanobacteria were ubiquitously found in the three samples, mostly in MIC-3 and MIC-4, whereas the rest of taxa were only detected in MIC-2 and/or MIC-3. MIC-2 showed the most varied microbial community, including some members of Euryarchaeota, β-Proteobacteria, and Actinobacteria, not detected in MIC-3 and MIC-4. Aquificae was only identified in MIC-3, and a bacterial group related to iron/sulfur metabolism was detected in MIC-2 and MIC-3 (Fig. 4b). MIC-4 showed the least varied community and the strongest signal against Firmicutes.
4. Discussion
4.1. Complementary detection of molecular biomarkers in three 200 Ma-integrative carbonate records in the Atacama region
The multianalytical approach (i.e., free lipids, metaproteomics, immunodetection, and CSIA) revealed the presence of a variety of molecular biomarkers with different natures, diagnosis potentials, and preservation extent in the three Atacama carbonates, which allowed us to make a time-integrative reconstruction of biological sources and metabolisms from recent or even extant organisms up to ∼200 Ma back.
Proteins are chains of labile small molecules (i.e., amino acids) that tend to degrade rapidly, usually not lasting more than ∼3.5 Ma (Rybczynski et al., 2013; Demarchi et al., 2016). In the three Atacama carbonates, identified sequences of proteins related to bacteria, archaea, and eukaryotes were 20 in total, and showed different relative abundances and variety in the three samples (Fig. 3a). Complementarily, the LDChip also detected a low number of different proteins (i.e., 10; Fig. 4a), with certain discrepancies potentially attributable to different factors (see Supplementary Text S1 and Sánchez-García et al. [2020]).
The scarce number of proteins detected in the Atacama rocks could be partially explained by limitations derived from using a database (SwissProt) scarcely supplied by proteins from soil microorganisms, since only those protein sequences represented in the target database can be identified in our samples (Keiblinger et al., 2016). Regardless, it is not surprising to recover low amounts of identified proteins in such an arid environment. Still, ground samples of similarly low organic content (TOC of 0.1% vs. 0.08–0.29% here) from similarly dry environments such as the Namib Desert (Namibia) have been described to contain up to ∼10 times more nonredundant proteins from archaea and bacteria (Gunnigle et al., 2014) than those reported in this study.
The considerably lower number of proteins detected in the Triassic–Jurassic rocks suggests lower biological activity in the hyperarid Atacama Desert (i.e., ≤2 mm of annual precipitation) (McKay et al., 2003) compared with the arid Namib Desert (∼20 mm) (Birkhofen et al., 2012). In addition, although the interference of the different substrate matrix on protein extraction efficiency cannot be ruled out (Keiblinger et al., 2012), we hypothesize that the accumulated action of dryness, radiation, and heat over millions of years in Atacama (Dunai et al., 2005) could also have contributed to protein degradation through chemical reactions and molecular breakdown (Demarchi et al., 2016), thus the low number of recovered sequences (Fig. 3).
Elongation factors and chaperonins were the most common proteins consistently detected by both the LDChip and metaproteomics. The detection of other proteins by one or the other methods (Figs. 3 and 4) was attributed to methodological differences largely discussed elsewhere (Sánchez-García et al., 2020), particularly related here to extraction and data curation protocols (Supplementary Text S1). Independent of punctual discrepancies between the two approaches, the relevant aspect is that both detected protein biomarkers in the three organic-poor scenarios and, in both cases, most metabolic processes inferred from the prokaryotic and eukaryotic proteins were related to protein biosynthesis and stabilization (chaperons), primary and cellular metabolism (Fig. 4a and Supplementary Fig. S3).
The detection of proteins involved in general metabolic processes and some even indicative of stress (i.e., chaperonins/heat-shock proteins) (Saibil, 2013) suggests that most proteins in the samples are remains of a minimum level of biological activity conditioned by intense environmental stressing in a harsh hyperarid system. The high representation of proteins related to stress conditions detected by the LDChip also reflects the effects of stressful conditions (desiccation, UV radiation) on the cells stability that resort to protective strategies (Lebre et al., 2017 and references therein).
The detection of prokaryotes by LDChip and metaproteomics was reasonably comparable, agreeing in the identification of Euryarchaeota, Proteobacteria, Firmicutes, and Actinobacteria. Certain protein sequences associated with aquatic eukaryotes (i.e., Rhodophyta, Dinoflagellata, and Amoebozoa) revealed a clear aqueous influence, mostly in MIC-2, whereas that of other eukaryotes (i.e., Streptophyta) or prokaryotes (i.e., Firmicutes) rather denoted contribution from terrestrial sources. Cyanobacterium was another phylum with aquatic taxa (e.g., marine Phormidium, in MIC-2, or Chrococcidiopsis in MIC-3 and MIC-4) that was detected only by the LDChip (Fig. 4b).
The phylum Firmicutes was ubiquitously detected in the three samples, with the greatest signal observed in MIC-4. The ubiquity and greatest abundance of Firmicutes in the three rocks are not unreasonable given their ability to form endospores (e.g., Clostridiales and Bacillales) with resistance to unfavorable conditions (i.e., high temperature and UV radiation), such as those encountered in the Atacama region since at least the last ∼25 Ma (Dunai et al., 2005).
The detection of Elusimicrobia was less expected given the close association of this phylum with the gut of termites and other animals (Ohkuma and Kudo, 1996; Mikaelyan et al., 2017). However, recent studies have also described free-living representatives of Elusimicrobia in soil and groundwater samples (Méheust et al., 2020), as well as in high-altitude volcanic sediments from the Atacama region (Aszalós et al., 2020). Thus, our detection in the carbonate rocks suggests a broader presence of Elusimicrobia throughout the vast Atacama region, where a metabolism of sugar fermentation (Méheust et al., 2020) could have contributed to produce by-products such as the acetate (from 0.21 to 0.54 μg·g−1) measured (data not shown).
Prokaryote orders such as Desulfuromonadales and Archaeoglobales—taxa known to reduce sulfate in anaerobic conditions by using acetate (Wellsbury and Parkes, 1995), propionate, or other small organics (Finke et al., 2007) as electron donors—were only detected in MIC-2 (Fig. 3b), which suggests the importance of sulfate reduction in this system. In contrast, microbial taxa known to fixate atmospheric nitrogen (i.e., Rhizobiales and certain Burkholderiales) were identified in the three systems.
The higher perdurability over time of hydrocarbon cores of membrane lipids relative to other biomolecules such as proteins, DNA, or polysaccharides allowed interpretation of biosignatures in a broader temporal scale. Lipid molecules are cell membrane remnants that are highly resistant over time and encased in lithified materials and can persist as recognizable molecular skeletons for up to billions of years (Brocks and Summons, 2003; Brocks and Banfield, 2009). The lipid biomarkers detected in ancient rocks such as the three Triassic–Jurassic carbonates could be associated with biological sources of not only the most recent thousands or millions of years, but further back in time as well (i.e., up to ∼200 Ma). While certain patterns suggest detection of recent/subrecent activity (e.g., n-fatty acids and n-alkanols with even-over-odd preference, or enantiomeric preservation of hopanoids), other features such as the low proportion of functional groups (e.g., carboxylic) relative to hydrocarbon skeletons (i.e., n-fatty acids/n-alkanes ratios <0.6 in MIC-2 and MIC-3) may be linked to relatively old metabolisms.
In detriment, the biological information provided by lipid biomarkers is less source specific than that derived from the LDChip or metaproteomic analyses. Although much taxonomic information is lost in the transition from the lipid biomolecule to a defunctionalized geomolecule during diagenesis, the generated hydrocarbon skeletons can often still be linked to precursors that are diagnostic for more or less specific groups of organisms (Brocks and Banfield, 2009), such as prokaryotes/eukaryotes and autotrophs/heterotrophs (Fig. 5); cyanobacteria; sulfate-reducing bacteria; and algae or plants (Supplementary Fig. S4; see Supplementary Text S3 for limitation details). However, as a counterpart the more perdurable lipid biomarkers can provide insights into the prevailing geochemical conditions in the three carbonate scenarios up to ∼200 Ma back.
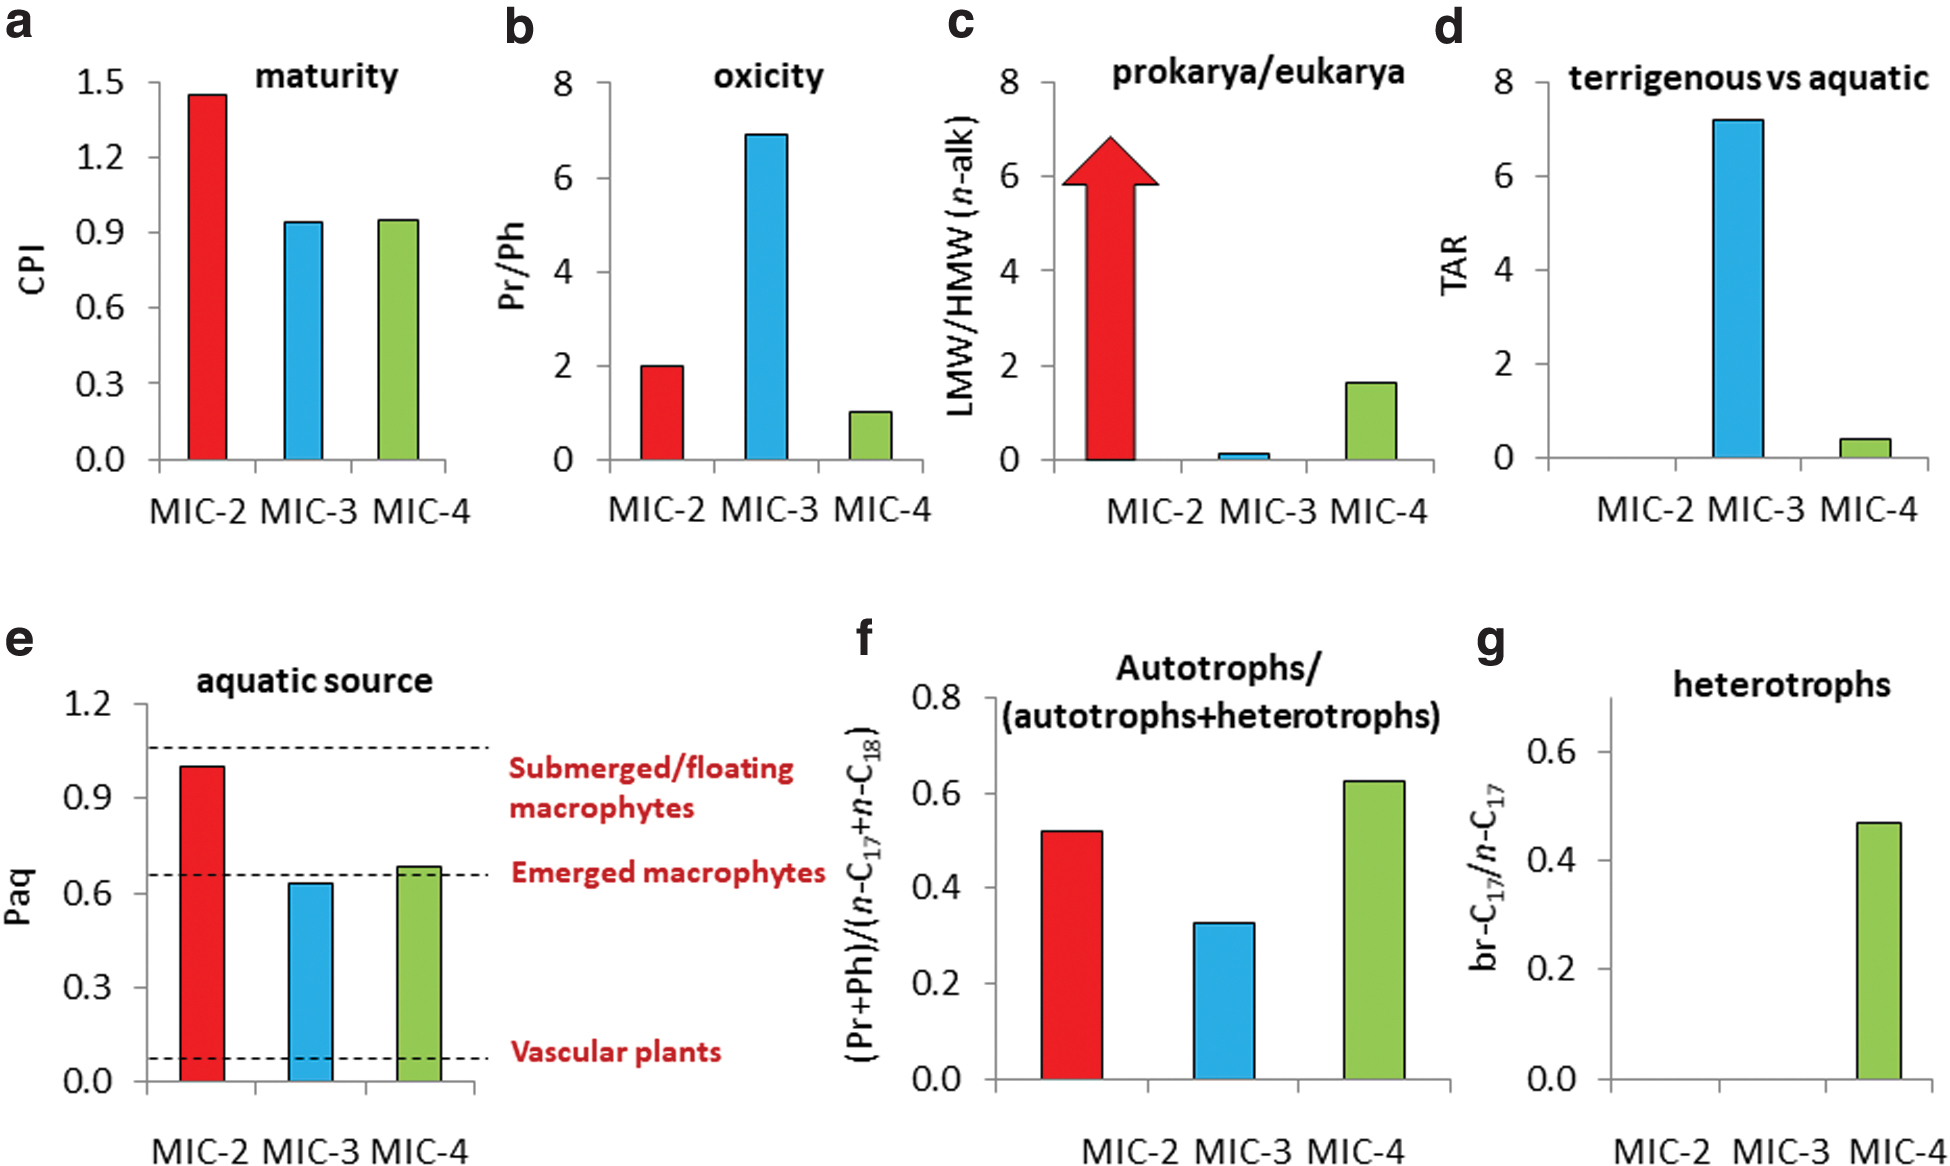
Environment- and source-diagnostic lipid-derived ratios in the three carbonate deposits (MIC-2, MIC-3, and MIC-4);
4.2. Recreation of the prevailing environmental conditions over the last 200 Ma in the three carbonate scenarios
As biomarkers, remnants of dead organisms can provide important information about how natural ecosystems work or worked, and they can be used to measure geochemical parameters, as some biopolymers and their structural variants are produced in response to changing environmental conditions (Brocks and Banfield, 2009). Lipid-related molecular biomarkers are powerful forensic tools for recreating past environments because of their relative resistance to diagenesis over other biomolecules. Still, despite their low taxonomic specificity and limitations (Supplementary Text S3), they offer diagnosis potential for interpreting past environmental conditions, preservation degree, and general biosources by using different ratios and geochemical proxies (Supplementary Text S2).
In the Atacama Desert, the low carbon preference index (CPI; Table 2) values observed for the n-alkanes in the three samples (Fig. 5a) denoted thermal maturity (Hedges and Prahl, 1993) in the Triassic–Jurassic rocks. At temperatures likely >100°C, most labile biomolecules such as DNA and proteins, but also alkyl compounds with functional groups (e.g., alkanols and fatty acids), are typically lost. In MIC-4, a relatively smooth and flattened molecular distribution of n-alkanes suggests a relatively strong effect of diagenesis in this compared with the other two samples (Supplementary Fig. S2g). Thus, all those compounds detected in the three Atacama carbonates are associated with secondary sources rather than primary (i.e., predepositional) biological inputs.
Redox conditions in the three sedimentary environments appear to have been dominantly oxic according to pristane over phytane ratios (Pr/Ph) higher than one (Blumenberg et al., 2012), particularly in MIC-3 (Fig. 5b). Generally, oxic conditions are consistent with well-oxygenated shallow seas in scenarios of marine transgression such as those in northern Chile during the Triassic–Jurassic, when a compressive tectonic stage was followed by an extensive stage that caused the deposition of marine sediments over the continent strata (Chong and Hillebrandt, 1985). Later, redox conditions could have changed differently at local scales, with environments maintaining redox conditions globally oxic (MIC-2 and MIC-3), or fluctuating from oxic and anoxic over time (MIC-4), as deduced from 200 Ma-integrative Pr/Ph ratio close to one (Fig. 5b).
The proportion of prokaryotes versus eukaryotes was greater in MIC-4 and (mostly) MIC-2 than in MIC-3 (Fig. 5c), according to the ratio of low- over high-molecular weight n-alkanes (LMW/HMW n-alk; Supplementary Table S2). Still, despite the “infinite” LMW/HMW n-alk ratio in MIC-2, the eukaryotic presence in this sample was deduced from the presence of cholesterol (Supplementary Table S3) and steranes (Supplementary Table S4). In MIC-3, the terrestrial-over-aquatic ratio (TAR) was highest, denoting a relatively high proportion of terrigenous versus aqueous vegetal biomass (Bourbonniere and Meyer, 1996) in this compared with the other samples. This was consistent with the greatest detection of terrestrial phytosterols such as stigmasterol or β-sitosterol in MIC-3 (Table 2) and the identification of 2- and 3-methyl HMW alkanes (e.g., Huang et al., 2014) only in this sample (Supplementary Table S1). In contrast, a TAR value of zero in MIC-2 revealed a virtual absence of plant remnants in this rock, which is consistent with its lack of phytosterols (Supplementary Table S3).
The lowest Paq value (Table 2) in MIC-3 (Fig. 5e) suggests a contribution from emergent macrophytes or vascular plants in addition to submerged and/or floating macrophytes (Ficken et al., 2000), which would explain the terrestrial inputs. Finally, compositional differences between samples were also observed in terms of metabolism, with relatively high imprint over time (i.e., within the 200 Ma period) of autotrophic over heterotrophic pathways in MIC-2 and MIC-3 (Fig. 5f), and that of heterotroph in MIC-4 (Fig. 5g). See Table 2 and Supplementary Text S2 for details on the ratios.
The autotrophic signal provided by the lipid proxies was further deciphered with the aid of stable carbon isotopic analysis. The range of δ13C values measured for both the biomass (i.e., bulk δ13C from −14.1‰ to −23.7‰) and specific lipid-derived compounds (from −25.6‰ to −31.7‰) confirmed a biological origin of the carbonaceous matter in the three rocks consistent with autotrophic fractionation pathways (−25‰ ± −10‰; cf. Hayes et al., 1992). The particularly depleted compound-specific δ13C values (Fig. 2) revealed a dominance of carbon fixation pathways by using the Calvin–Benson–Bassham cycle (δ13C from −19‰ to −34 ‰; Hayes, 2001). However, the depletion by 1–6‰ of the HMW relative to the LMW n-alkanes observed mostly in MIC-4 (Fig. 2a) was interpreted in relation to the likely presence of two separate sources (e.g., Pagès et al., 2015), that is, vegetal and microbial.
Despite both being users of the Calvin cycle, terrestrial C3 plants are known to typically produce odd HWW n-alkanes (C27, C29, and C31) and δ13C values ranging from −30‰ to −39‰, while coastal macrophytes and phytoplankton rather produce n-alkanes with δ13Cvalues between −19‰ and −34‰ (Canuel et al., 1997). Furthermore, the relatively 13C-enriched bulk biomass, mostly in MIC-3 and MIC-4 (Table 2), suggests some participation of microbial sources of alternative pathways (i.e., reductive tricarboxylic acid [rTCA]; or 3-hydroxypropionate [3HP] bicycle) expressing lesser 13C discrimination relative to atmospheric CO2 (Hayes, 2001). While preserved biomarkers of green nonsulfur bacteria (i.e., Chloroflexi), which typically use the 3HP pathway (Van der Meer et al., 2000), were not detected in any of the three carbonates of Atacama, those of Nitrospira and Aquificae, which are known to fix carbon through the rTCA pathway (Hügler and Sievert, 2011), were indeed detected by the LDChip (Fig. 4).
Altogether, the molecular and isotopic analysis of lipid biomarkers in the three Triassic–Jurassic rocks allowed for identification of prevailing redox conditions (oxic vs. anoxic conditions), general biosources (terrestrial vs. aquatic, prokaryotic vs. eukaryotic), or autotrophic metabolism (general dominance of the Calvin–Benson–Bassham cycle) in the three ancient deposits despite their thermal maturity.
4.3. Relevance for understanding ancient life and astrobiological implications
The multianalytical platform applied here provided multiple lines of evidence of life in three Atacama rocks of up to ∼200 Ma. Results from this study provide insights on how to reconstruct past and present life in sedimentary rock records where no morphological/textural evidence of life is preserved (i.e., macro- or microfossils). This is particularly relevant for the search for life on other planetary bodies (e.g., Mars). In fact, Mars exploration has been initially centered on the goal of determining whether life was ever present on that planet, with primary emphasis on the search for organic geochemical biosignatures. A hypothetical life that could have existed (most likely) in the Hesperian Mars (i.e., ∼3800–3000 Ma ago) would probably have been simple and (most likely) prokaryotic. Little probabilities exist in finding direct remnants (i.e., structural) of those simple forms because of their size and poor preservation under martian conditions. The intense radiation and abundance of highly oxidative chemical species make the preservation of organics unlikely on the martian surface, and thus the subsurface is a more adequate target for evidence of life. Sedimentary facies are alternative good targets given their high potential for containing fossilized forms of life (Grotzinger and Knoll, 1999), where the recently discovered carbonates on weathering horizons on Noachian surfaces on Mars may be a reference (Bultel et al., 2019).
This study is an important contribution to unraveling ancient life in sedimentary rock records on Earth and constraining the target sites to pursue in the search for life beyond our planet. The detection of lipid biomarkers by GC-MS is particularly relevant for the search of organics on Mars, where experiments with the Sample Analysis at Mars (SAM) instrument in the Cumberland mudstones at Gale Crater have yielded the detection of short-chain hydrocarbons (C10-C12) potentially originated from carboxylic acids (Freissinet et al., 2019; Williams et al., 2020). Furthermore, the forthcoming ExoMars 2022 mission plans to move forward on the detection of biomolecules in the martian subsurface at Oxia Planum with the aid of the GC-MS Mars Organic Molecule Analyzer (MOMA). Although the analytical procedure conducted by both instruments is not as elaborated as that of this study (i.e., based on heating or laser desorption and thermal volatilization, without previous solvent extraction, separation of fractions by polarity), the GC-MS performance will be replicated and is expected to produce signals comparable with those described here.
Despite the different timescales (i.e., million vs. billion years), contrasting the hydrocarbons detection in the ∼200 My old Atacama carbonates with that in the ∼3.6–3.8 Gy old Cucumber mudstones may be pertinent since the lack of plate tectonics on Mars (Breuer and Spohn, 2003) may have resulted in a relatively low alteration of putative biosignatures over time in subsurface strata protected from the intense irradiation and weathering on the martian surface. This study's results provide a baseline for interpreting martian GC-MS signals in the short term (i.e., in situ SAM and MOMA measurements) and in the near future, when martian samples that contain carbonates (i.e., the so-called bathtub rings at Jezero Crater) will hopefully be brought back to Earth as part of the Mars Sample Return mission.
Finally, the interpretation of GC-MS signals was combined here with complementary immunological detections that have been proposed as a useful alternative tool for detecting signs of life in planetary exploration (SOLID-LDChip) (Parro et al., 2011; McKay et al., 2013). In summary, this study is a good example of how useful the combination of diverse molecular biomarkers (i.e., chemical fossils or organic geochemical biosignatures) can be for comprehensively detecting signs of life in ancient and/or organic-poor systems, thus overcoming individual limitations derived from chemical lability, low biological specificity, diagenesis effects, or little analytical sensitivity.
5. Conclusions
This study posed a multianalytical search for life remnants in three carbonate rocks from the Triassic–Jurassic in the Atacama Desert based on the combined analysis of lipid biomarkers, metaproteomics, and immunoassays. Complementarily, different types of molecular and isotopic biomarkers of different informative value and diagnosis potential facilitated the reconstruction of biological sources, dominant metabolisms, and prevailing environmental conditions at different timescales (i.e., from the present up to the Triassic–Jurassic boundary) over a global geological period of ∼200 Ma. The multibiomarker strategy increases the possibility of detecting life of any form as it includes a variety of molecule targets with diverse chemical compositions, preservation degrees, and biological specificity. This allows for complementing biological- or temporal-limited information provided by each individual biomarker and attaining a more integrative picture of the environmental scenario to recreate.
This is particularly interesting in ancient organic-depleted environments where time and diagenesis certainly have played a relevant role against the preservation of structural biomarkers. These findings provide new insights into the analytical nature of the search for life and contribute to a definition of scopes and limits as well as synergies of up to four types of biomarkers (hydrocarbon molecules, stable carbon isotope, proteins, and antigens), thus highlighting the potential of combining different and complementary approaches. This is particularly relevant for the search of life on Mars, where some of the detection techniques used here (i.e., GC-MS and LDChip) are currently available or foreseen in future rover missions to Mars. This study contributes to expand the applicability of protocols of searching for signs of life to a wider range of environments and time periods by combining different and complementary biomarker tools.
Footnotes
Author Contribution Statement
L.S.-G. performed the article building, coordinating data interpretation, discussion, and writing. She and D.C. extracted, fractionated, and analyzed the lipid biomarkers. In addition, D.C. conducted the isotopic analysis and discussed the resulting data. Within the lipid biomarkers, C.A. was in charge of the analysis and discussion of hopanes and steranes. M.A.L. extracted, analyzed, and identified proteins, interpreting, and discussing these results. M.G.-V. performed the LDChip analysis, M.M.-P. interpreted and discussed the derived results, together with V.P. G.C. and C.D. collected the carbonate samples. G.C. described the sampling site and local geology, together with O.P.-B., who also participated in interpreting the biomarkers results in a geological context.
Author Disclosure Statement
The authors L.S.-G., D.C., M.A.L., M.M.-P., M.G.-V., O.P.-B., and V.P. have research support from the Centro de Astrobiología, in Madrid; C.A. from the Bigelow Laboratory for Ocean Sciences, in Maine; and G.C. and C.D. from the Universidad Católica del Norte, in Antofagasta. The terms of this arrangement have been reviewed and approved by the Centro de Astrobiología, the Bigelow Laboratory for Ocean Sciences, and the Universidad Católica del Norte, in accordance with their policy on objectivity in research.
Funding Information
This work has been funded by the Spanish Ministry of Science and Innovation and Fondo Europeo de Desarrollo Regional (MICINN/FEDER) through the projects Nr. RYC2018-023943-I (L.S.-G.), RYC-2014-19446 (D.C.), RTI2018-094368-B-I00 (V.P.), and ESP2017-89053-C2-1-P (O.P.-B.). The Project Nr. MDM-2017-0737 Unidad de Excelencia “María de Maeztu”- Centro de Astrobiología (CSIC-INTA) was funded by the Spanish State Research Agency (AEI). M.A.L. was supported by a Juan de la Cierva postdoctoral fellowship (FJC2018-037246-I).
Supplementary Material
Supplementary Text S1
Supplementary Text S2
Supplementary Text S3
Supplementary Figure S1
Supplementary Figure S2
Supplementary Figure S3
Supplementary Figure S4
Supplementary Table S1
Supplementary Table S2
Supplementary Table S3
Supplementary Table S4
Supplementary Table S5
Supplementary Table S6
Abbreviations Used
Associate Editor: Jorge Vago
References
Supplementary Material
Please find the following supplemental material available below.
For Open Access articles published under a Creative Commons License, all supplemental material carries the same license as the article it is associated with.
For non-Open Access articles published, all supplemental material carries a non-exclusive license, and permission requests for re-use of supplemental material or any part of supplemental material shall be sent directly to the copyright owner as specified in the copyright notice associated with the article.