
Abstract
Life is pervasive on planet Earth, but whether life is ubiquitous in the Galaxy and sustainable over timescales comparable to stellar evolution is unknown. Evidence suggests that life first appeared on Earth more than 3.77 Gyr ago, during a period of heavy meteoric bombardment. Amino acids, the building blocks of proteins, have been demonstrated to exist in interstellar ice. As such, the contribution of space-generated amino acids to those existing on Earth should be considered. However, detection of space amino acids is challenging. In this study, we used analytical data from several meteorites and in situ measurements of the comet 67P/Churyumov-Gerasimenko collected by the Rosetta probe to evaluate the detectability of alanine by ultraviolet spectropolarimetry. Alanine is the second-most abundant amino acid after glycine and is optically active. This chirality produces a unique signature that enables reliable identification of this amino acid using the imprint of optical rotatory dispersion (ORD) and circular dichroism (CD) in the ultraviolet spectrum (130–230 nm). Here, we show that the ORD signature could be detected in comets by using ultraviolet spectropolarimetric observations conducted at middle size space observatories. These observations can also provide crucial information for the study of sources of enantiomeric imbalance on Earth.
1. Introduction
Amino acids are the building blocks of life. However, the source of amino acids is unclear, particularly with regard to whether they formed on Earth (Miller, 1953; Parker et al., 2011) or were brought by comets (Bernstein et al., 2002; Muñoz Caro et al., 2002; Chen et al., 2008). Both routes have obvious differences and important implications for how amino acids might be dispersed across the Universe (Wickramasinghe, 1974; Martins et al., 2008).
Experiments to reproduce the formation of amino acids on Earth date back to those performed by Miller in 1953. A reducing atmosphere similar to that present soon after the formation of Earth was reproduced in a laboratory setting and used to generate a mixture of amino acids after exposure to electrical discharges (Miller, 1953; Miller and Urey, 1959; Oró, 1967; Cleaves et al., 2008; Parker et al., 2011).
In the early 2000s a new branch of laboratory exploration was initiated by ultraviolet (UV) irradiation of dirty ice to simulate conditions present in comets. In these experiments, photoionization by UV radiation is used to accelerate chemical reactions that form glycine, alanine, and other amino acids (Muñoz Caro et al., 2002). Several experimental approaches have been used to synthesize proteinogenic amino acids (Table 1), although none of these techniques could produce the full set of amino acids present in proteins. An intriguing question is whether the current amino acid fingerprint on Earth can provide clues about the dominant process by which amino acids originally formed.
Proteinogenic Amino Acids Produced in “Origins of Life” Experiments to Simulate Early Earth Conditions or Space Ice and Comets
A fundamental problem in astrobiology is whether a universal set of amino acids is being formed or if there are significant spatial and temporal deviations across the Universe (Loeb et al., 2016). Such differences could be related to compatibility, at a molecular level, between life-forms. For instance, UV radiation that photoprocesses ices in space is not homogeneous, either now or soon after the Universe was formed. Ice in comets orbiting solar-like stars is exposed to strong radiation at several specific wavelengths (e.g., 121, 155, and 280 nm) (see, e.g., Ayres et al. [1995] for main-sequence cool stars or Gómez de Castro and Marcos-Arenal [2012] for pre-main-sequence cool stars), whereas ice in the interstellar medium is subject to the smooth spectral energy distribution of the UV background (see, e.g., Draine, 1978).
Investigations concerning generation of life at a cosmic level have been severely hampered by difficulties with the collection of experimental data and remote detection of even simple compounds like amino acids. To date, only glycine has been conclusively detected by using in situ measurements carried out by the Rosetta probe (Altwegg et al., 2016). However, remote detection could be possible if the chirality imbalance observed in many biological molecules on Earth were widespread in the Universe. According to laboratory experiments, in space ice α-alanine (hereafter, alanine) is the second-most abundant amino acid after glycine, with an abundance 40% that of glycine (Muñoz Caro et al., 2002). Unlike glycine, alanine is an optically active molecule. Left and right isomers of alanine are produced naturally, and any imbalance in isomer distribution will produce a clear signature in radiation polarization. Other abundant, optically active amino acids are serine, valine, and proline; however, their abundance relative to that of glycine is significantly smaller (7.2%, 1.2%, and 0.06%, respectively) (see Sandford et al., 2020 and references therein). Thus, they are more difficult to detect even though some of them, such as valine or leucine, display a level of optical activity of similar magnitude.
The detection of amino acids through their optical activity is also the only means to measure by remote sensing the enantiomeric excess in Solar System bodies. Current determinations, based mainly on the analysis of meteorites (Martins and Sephton, 2009), reveal a slight preponderance of
The source of the enantiomeric excess detected in space bodies is unclear. There are two main accepted models to explain this asymmetry: parity violation by the weak nuclear force or the presence of chiral fields such as circularly polarized light (see Giri et al., 2013). Parity violation can affect molecules by altering the energy levels, introducing energy differences between enantiomers. However, the calculated differences are in the range of 10−5 to 10−8 erg per mole; as a result, they are very difficult to measure, and it seems highly unlikely that these differences are behind the chirality imbalance in biomolecules (Tranter and McDermott, 1989). On the other hand, laboratory experiments have successfully shown that the enantiomeric balance in racemic mixtures can be broken by irradiation with circularly polarized radiation (CPR). Of special interest are the experiments that use alanine ice under space conditions. The enantiomeric enrichment reached by this procedure is of a few percent and similar to that measured in many meteorites (Meinert et al., 2014).
In this study, we evaluate the detectability of alanine by determining the expected spectropolarimetric signature of comets in our solar system. Our calculations are based on laboratory measurements of the optical activity of alanine and the known properties of comets, in particular, data obtained by the Rosetta probe analysis of the comet 67P/Churyumov-Gerasimenko.
2. Materials and Methods
The structural asymmetry of alanine results in different interactions with left-handed (L) and right-handed (R) circularly polarized radiation (CPR). The most prominent difference can be observed at 180 nm and is usually ascribed to the π0→π* transition of the COO- group (Kaneko et al., 2009). This optical activity is manifested through two related phenomena: optical rotatory dispersion (ORD) and circular dichroism (CD).
The complex refractive index of alanine, n
C, differs for L- and R-CPR, which can be expressed as
Optical rotatory dispersion is produced by the real component (γ 1 term) and results in a phase lag in the propagation of L-CPR with respect to R-CPR. If the impinging radiation is linearly polarized, ORD produces a rotation, [α], of the plane of polarization such that [α] = 2πγ 1(λ)/λ rad cm−1 at wavelength λ (with λ in cm).
Circular dichroism is produced by the imaginary component (γ
2 term) and results in different absorbance of L-CPR and R-CPR, which can be denoted as A
L and A
R, respectively. The Beer-Lambert law relates these absorbances to the absorption of radiation:
where I
0 and I are the intensities of the incident and transmitted light beams, respectively. The rotation angle can be expressed in terms of the electric field vector as
with a
0 = ln 10/2 = 1.1513 and ΔA = A
L - A
R. Given the small values involved, A
L,R << 1 and
A
L,R can be expressed in terms of the absolute optical absorption coefficient, μ
L,R, as A
L,R = μ
L,R
In a 50%-50% mixture of both isomers, the rotation induced by any one isomer is counterbalanced, resulting in θ = 0. However, mixtures typically are not balanced, either on Earth or in space. Therefore, we can denote l-ala and d-ala as the levo and dextro isomers of alanine and Δμ
l and Δμ
d as the respective absorption coefficients.
Δμ
l,d can be expressed in terms of the absorption cross section (σ) and the density in terms of molecules per unit volume (n) as
where n
l and n
d are the densities of the levo and dextro isomers, respectively. Hence, the total density of alanine is n = n
l + n
d, and the fractional abundance of each isomer is χ
l,d = n
l,d/n. The enantiomeric excess is defined as ee = (n
l - n
d)/(n
l + n
d) = χ
l - χ
d. Thus, Eq. 5 (σ
L,R
l = -σ
L,R
d) can be expressed in terms of the enantiomeric excess as
or, in degrees:
The apparent CD coefficient, Δμ
l, was measured by Kaneko et al. (2009) on a film having the density ρ = 1.42 g cm−3 and is included in Eq. 9:
which includes the molar mass of alanine (89.09) and N
A, Avogadro's constant. Thus,
The strength of the circular polarization signal is given by the Stokes V parameter defined as
This calculation has been carried taking into account the different absorbance to L-CPR and R-CPR by the two enantiomers, and as such it assumes that the radiation impinging the sample is circularly polarized. However, it is not required that the comet outgassing is irradiated by CPR to detect the CD signature of a non-racemic mixture, since such a mixture acts as a polarizer by itself. The induced fractional circular polarization of unpolarized incident light, or induced polarizance, is comparable in magnitude to the differential absorbance computed in Eq. 10a. This technique has been successfully used in the lab to detect photosynthetic microbes (Sparks et al., 2009a) and to study in vivo structural variations of plant and algae chloroplast (Patty et al., 2017), and it is also the reason to consider the detection of CPR as a possible biomarker (Sparks et al., 2009b).
2.1. Expected signals in cometary spectra
The 140–250 nm spectrum of comets is characterized by a weak continuum produced by scattering of solar radiation and several prominent emission lines. Among these, CI (156.1, 161, 165.7 nm) and SI (142.5, 147.3, 180.7 nm) predominate, and CS (0,0) and CO+ bands are also present (Fig. 1). The location of the CO Cameron bands that are prominent in comets is also indicated for reference.
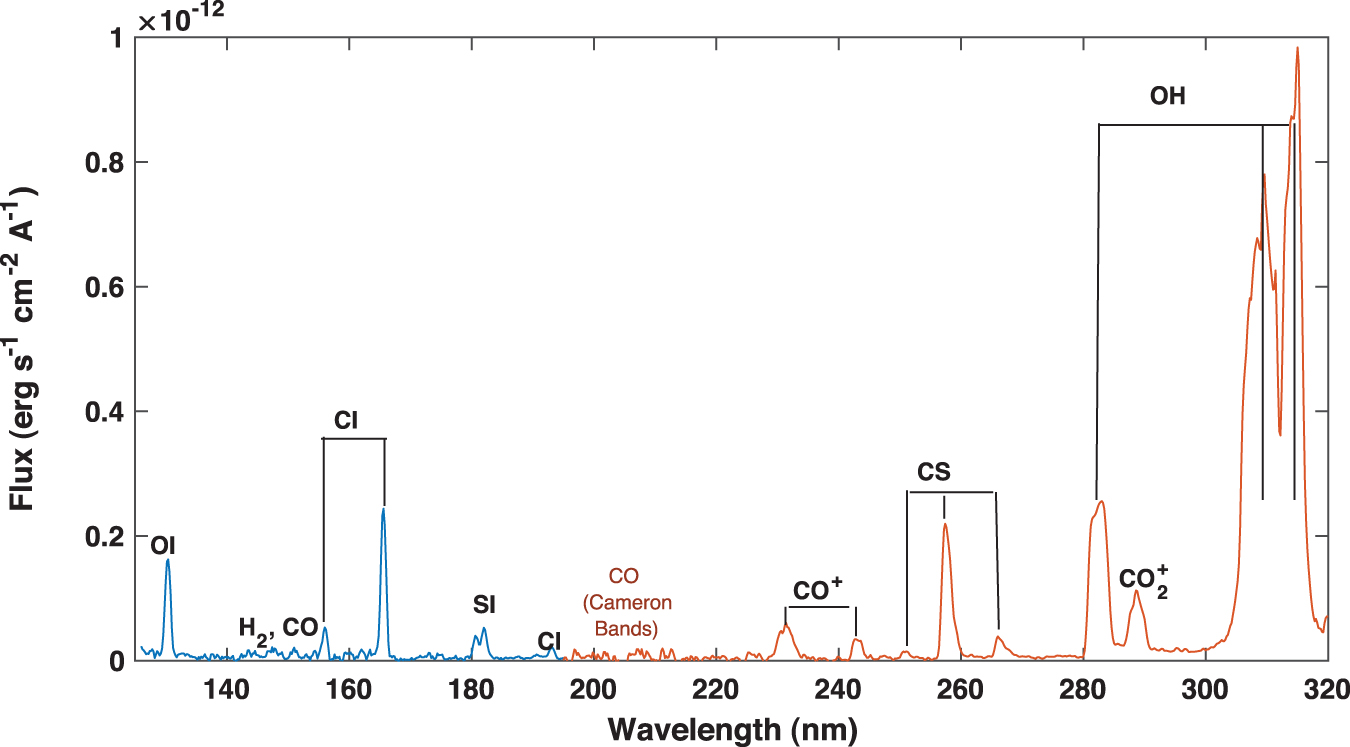
UV spectrum of comet Bradley as observed by the International Ultraviolet Explorer (IUE) in 1980 (Weaver et al., 1981). The main spectral features are marked, including the location of the Cameron CO bands that are not observed in IUE data. The OH feature is saturated in the image. The continuum produced by comet-induced solar radiation scattering is very weak. The comet was at heliocentric distance 0.71 and 0.61 AU from the IUE (Feldman et al., 1980). Color images are available online.
Radiation from comets is polarized both linearly and circularly (Hines and Levasseur-Regourd, 2016; Rosenbush et al., 2007). The linear polarization at optical wavelengths may be as high as 25%, especially at large phase angles, and decreases approaching the UV range (Hines and Levasseur-Regourd, 2016). Extrapolating from optical data results in expected values of about 7% at 180 nm for phase angles of 40° to 60° (Kiselev et al., 2008). Circular polarization in the optical ranges is around ∼1% and can be produced by several mechanisms, including multiple scattering in asymmetric particle distributions and scattering by intrinsically asymmetric particles that may (Nagdimunov et al., 2013) or may not (Guirado et al., 2007) be organic. However, the CD signature of a given amino acid is observed in a narrow spectral band and provides conclusive identification of the molecule that can be further confirmed by ORD detection and the Cotton effect (see, e.g., the UV spectral signature of CD for various amino acids in Meierhenrich et al. [2010], Fig. 1). Both CD and ORD can be related through the Kramers-Kronig relation:
Note that the ORD is significantly stronger than the CD and approaches 0 at the central wavelength of the CD band; this is the so-called Cotton effect.
To evaluate the CD signal expected from comets, the number of molecules along the optical path must be determined. Although no measurement of the abundance of alanine in comets is yet available, this value can be inferred from the expected abundance of alanine relative to glycine, n ala/n gly ∼ 0.4 based on laboratory experiments (Muñoz Caro et al., 2002).
Glycine has been detected in the coma of comet 67P/Churyumov-Gerasimenko by the ROSINA mass spectrometer in the Rosetta probe (Altwegg et al., 2016). ROSINA detected glycine in the gas phase released from sublimation of the icy mantles of dust grains in the coma, and an abundance of 170 ppb was derived (Hadraoui et al., 2019). The density and thickness of the glycine cloud can be expressed as n
gly = 2.1 × 107 cm−3 and L
gly = 2 × 106 cm. We introduced these values into Eqs. 12a and 12b:
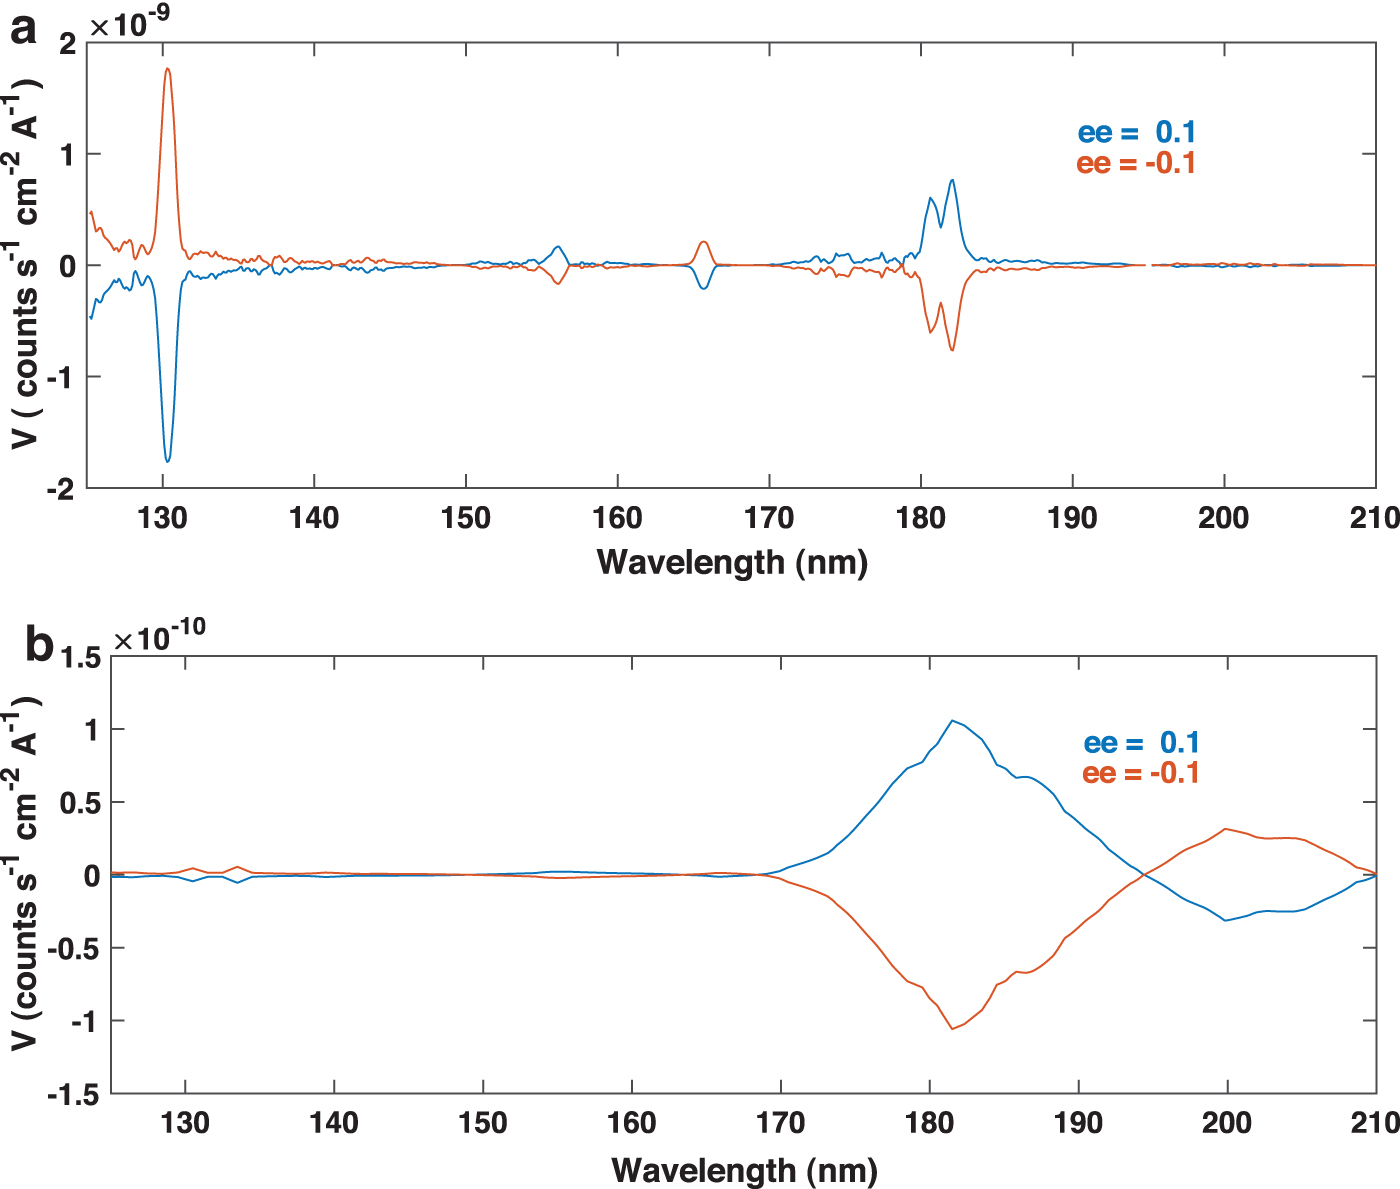
Enantiomeric excesses in meteorites range between 1% and 10% (Pizzarello and Cronin, 2000), reaching as high as ∼60% in the isoleucine series in Antarctic meteorites (Pizzarello et al., 2012). In Fig. 2, V is represented for ee = 10% and two plausible I 0 spectral distributions: the International Ultraviolet Explorer (IUE) spectrum for the Bradley comet (as per Fig. 1) and the scattered solar spectrum in a body with UV albedo 0.05 that was observed under the same conditions. The solar spectrum was retrieved from the Hubble telescope database 1 of spectrophotometric standards, multiplied by the albedo and rescaled based on assumed radiation from a surface having a 50 km radius, at a heliocentric distance of 0.71 AU observed from a satellite 0.61 AU from the body, that is, under the same observing conditions as used for comet Bradley. This spectrum is denoted as SunS in the text. V is represented for ee = +0.1 (a 10% of l-ala excess) and ee = -0.1 (a 10% of d-ala excess) to highlight wavelengths at which the CD changes sign. Comparison between the comet and SunS spectra shows higher likelihood of detectability in comets, particularly those having very strong OI (130 nm) and SI (180 nm) features.
(
The icy mantles of the grains also contribute to the CD signal. The dust-to-gas mass ratio in the 67P/Churyumov-Gerasimenko coma is ∼3 (Rotundi et al., 2015), and the H2O ice mass fraction of the dust particles is ∼1 (Hadraoui et al., 2019). Hence, Eqs. 12a and 12b provide a lower limit for the expected signal, and observed values could increase by a factor of 4 due to the contribution of alanine present in the icy grains. The contribution from back-scattered (i.e., reflected) radiation to the CD signal is negligible in this context (Einhorn et al., 1973; Silverman and Badoz, 1990).
To evaluate the strength of the alanine ORD signal, Eq. 11 was integrated numerically, and Δμ
l in the 180 nm band was subjected to Gaussian fitting to facilitate the integration. When
the total rotatory effect will depend on the enantiomeric excess such that
and the expected rotation of the plane of polarization induced by alanine is
In terms of the Stokes parameters U and Q,
and, as α
obs << 1,
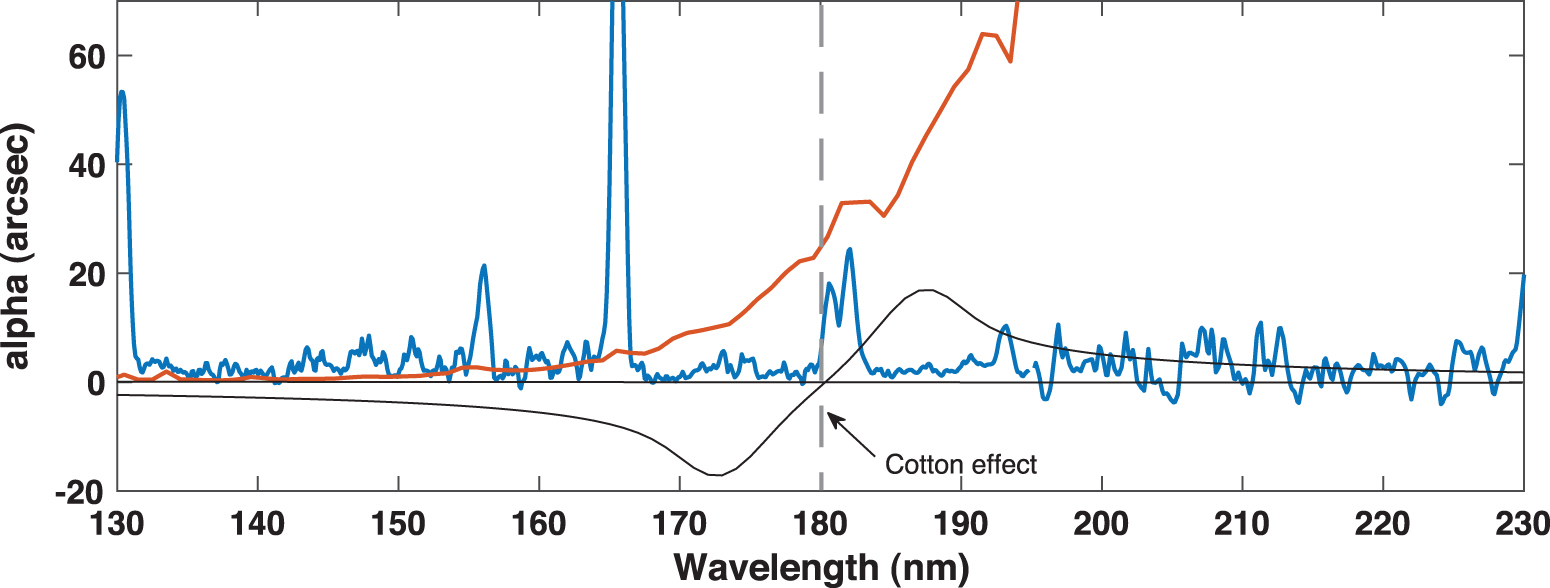
α obs for ee = 0.1 (black). Comet Bradley (blue) and SunS (red) energy distribution in the relevant wavelength range is shown in arbitrary units. Color images are available online.
The rotation angle depends linearly on the number of alanine molecules along the line of sight (on Z and n), thus, the higher the concentration of the molecule the better the chance of detection. Carrying out spectropolarimetric observations has the advantage of recording simultaneously the polarization at the alanine feature and at unaffected nearby wavelengths; as a result, variation of the polarization strength and orientation which are characteristics of cometary environments can be properly corrected.
3. Discussion: Requirements for Remote Detection of Alanine in Comets
Section 2 showed that the expected signal from alanine in the UV spectrum is very low. In terms of Stokes parameters and for ee = 0.1:
Measurement of Stokes parameters thus requires design of an instrument that is outside the scope of this study (see Azzam, 2016, for a review of the current status of instruments to measure the four Stokes parameters). However, an order-of-magnitude estimate is feasible based on simple, widely available designs. A common setup consists of a rotating waveplate that acts as polarizer and a Wollaston prism that splits the beam into two orthogonal linear polarization states (Pertenais et al., 2017). In this modulation-detection scheme, the beam passes through a waveplate with retardance δ while rotating at an angular frequency, Ω, and is split by the Wollaston prism into ordinary and extraordinary beams. The two beams are then projected on the detector, and the difference between the signals is measured at discrete intervals of the phase Ωt, that is, the waveplate orientation. Assuming that both channels are perfectly balanced, the difference in the intensity between the simultaneous output of the channels can be expressed as
where Q, U, and V are periodic signals of known period. Thus, signal pollution by other effects such as telescope jittering can be corrected. Indeed, strategies for optimal modulation are well studied in the context of solar spectropolarimetric measurements, which are also challenging to acquire (Lites, 1987; del Toro Iniesta and Collados, 2000). For the low signals associated with alanine detection, many Ω cycles will need to be combined to reach the limit of detection. The number of cycles, that is, the total exposure time, is determined by the collecting capacity of the telescope, the efficiency of the instrumentation, and the distance to the comet.
If the major source of noise is photon noise (∝N
ν
1/2 = (I
0/hν)1/2), a simple estimate of the signal to noise ratio (SNR) required to detect V at 3σ level is SNR = V/N
ν
1/2 = 3, and from Eq. 12b,
where N ν depends on the temporal sampling in Eq. 19, the number of combined cycles, the collecting capability of the telescope, and the instrument configuration. A standard configuration for space observatories involves a Ritchey-Chretien mounting telescope that feeds the spectropolarimeter. A simple spectropolarimeter can comprise a polarizer, reflection grating with a spectral dispersion of 600 in the 130–250 nm spectral range, and an MCP-type photon counting detector 2 . In the spectral range of interest, the transmittance of this optical system with standard UV coatings and components is about 15%, and the QE of a Cs2Te detector is 35% (Carruthers, 2000). This configuration is similar to that of the Ultraviolet Researcher for the Investigation of the Emergence of Life mission (URIEL) submitted to the ESA call for F-missions (Gómez de Castro et al., 2020).
N ν also depends on the characteristics of the comet and the distance between the comet and the Sun. To adequately sample the expected UV flux from comets, all available observations from the archives of the IUE and the Hubble Space Telescope (HST) with the instruments Space Telescope Imaging Spectrograph (STIS) and Cosmic Origins Spectrograph (COS) have been analyzed. The IUE obtained good quality spectra from the Bradfield (1980), Halley (1986), Levy (1990), Swift-Tuttle (1992), and Hyakutake (1996) comets. HST/STIS spectra are available for Hartley 2, Hale-Bopp, Lee, Linear, 2000WM1, Borelly, Ikea-Zhang, Neat 2001-Q4, C2009-P1 Garradd-New, and Lovejoy comets. Good HST/STIS observations were obtained with grating G230L that covers the spectral range 157–318 nm, but unfortunately the signal is low and noisy in the 150–200 nm region where alanine features are observed. HST/COS observations are also very poor in this region. Hence, only IUE data were used for this study (Table 2).
IUE Spectra
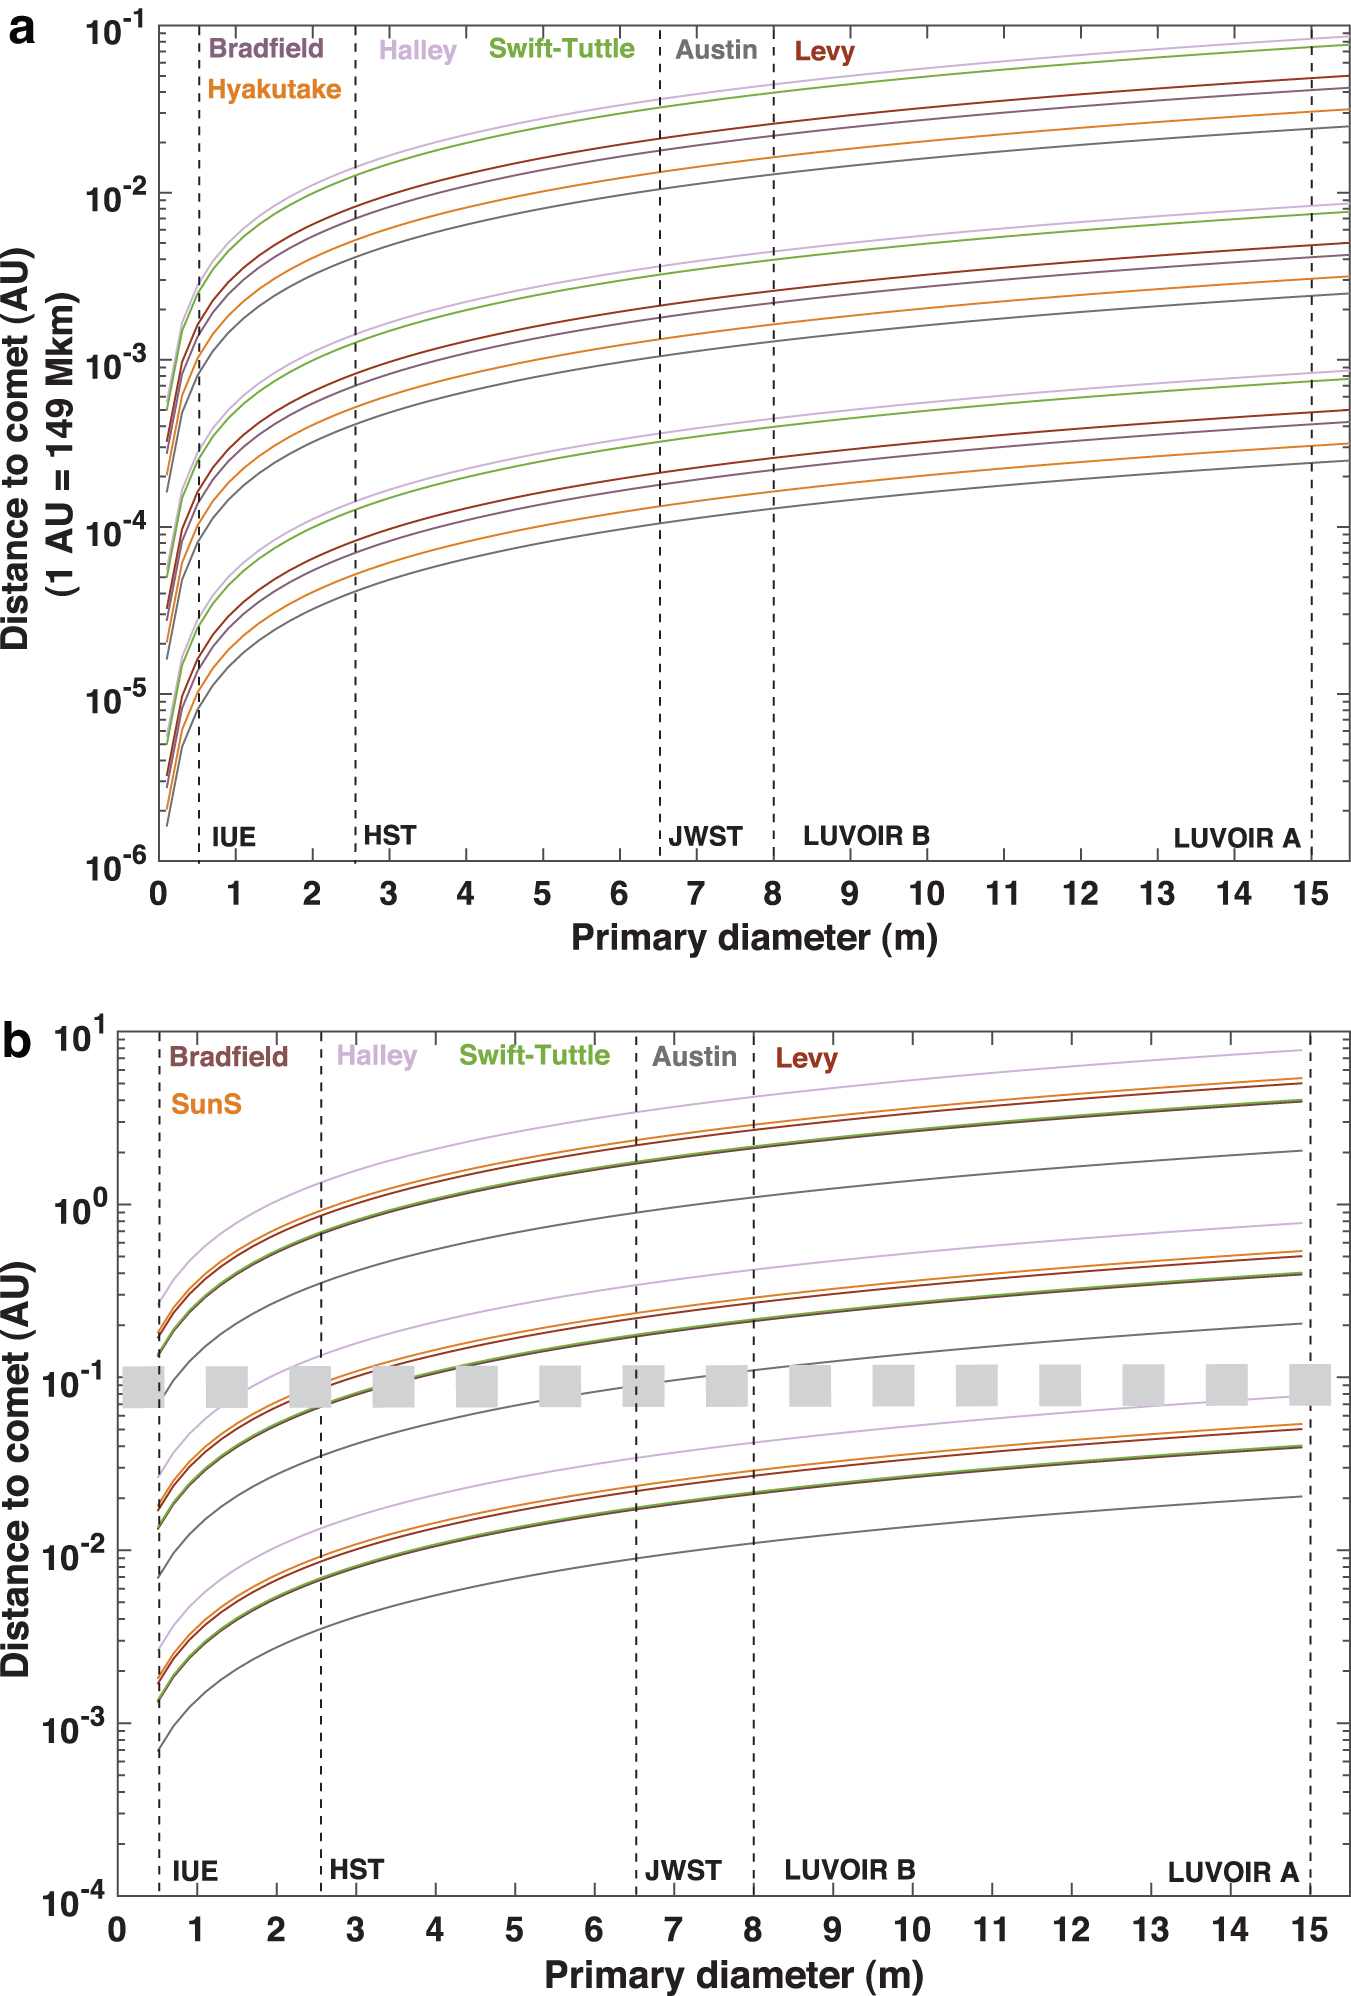
Using these parameters, we calculated the distance comet–space telescope, d, required to reach SNR = 3 in a total observing time, T
obs, of 10 days in which continuous observation was conducted with telescopes having a primary mirror with diameter ranging from 50 cm (explorer size) to the 1500 cm of LUVOIR-A.
Circular dichroism is measured by integrating the signal received in the 174.5–189.6 nm spectral range. In Fig. 4a, the observing distance is represented as a function of the diameter of the telescope primary mirror for ee = 0.01, 0.1, and 1. Clearly, even under the ideal conditions of this calculation, the signal detected by an astronomical observatory using current technology is very low: about 2 counts in V for a Hubble-type telescope and the observation conditions described above. Increasing this value by a factor of 10 seems feasible with the ongoing technical advancements for the future UV missions (see Gómez de Castro et al. [2021] for a recent review). Moreover, small instruments would be able to detect the CD signature if flown near comets or asteroids. A small mission navigating the asteroid belt could thus provide significant insight into alanine abundance.
(
The ORD signal is significantly stronger and is measured based on the ratio of two Stokes parameters, U and Q. For an expected percentage linear polarization p = (Q
2
+ U
2)1/2/I = 0.07 for the 180 nm feature (see above), a total beam intensity of I
0 and noise N
ν
1/2, the error in measurement at position angle, θ, is given by
For ORD to be detected conclusively, α
obs ≥ 3
Hence,
In Fig. 4b, the distance of the comet to the space probe is plotted against the size of the telescope's primary mirror under the same assumptions as for CD. The main conclusions based on this plot are as follows: Measuring the ORD is achievable for ee = 1 even for observatories with telescopes having small (e.g., 50 cm) primary mirrors, and the low density of the 67P/Churyumov-Gerasimenko coma. Reaching ee = 0.1 is achievable for the brightest comets using medium-sized space telescopes, but large telescopes are needed to observe the weakest objects. Detection of very low ee (≤0.01) is not feasible by remote observation, although small spectropolarimeters in exploration missions (e.g., Rosetta) can be used for remote detection of alanine in a comet without sample procurement. The signal from the SunS spectrum is detectable. This is the expected backscattered spectrum from small icy bodies and opens the possibility of studying numerous minor bodies especially, after collisions when alanine will be released from the ice into the gas phase.
4. Conclusions and Implications
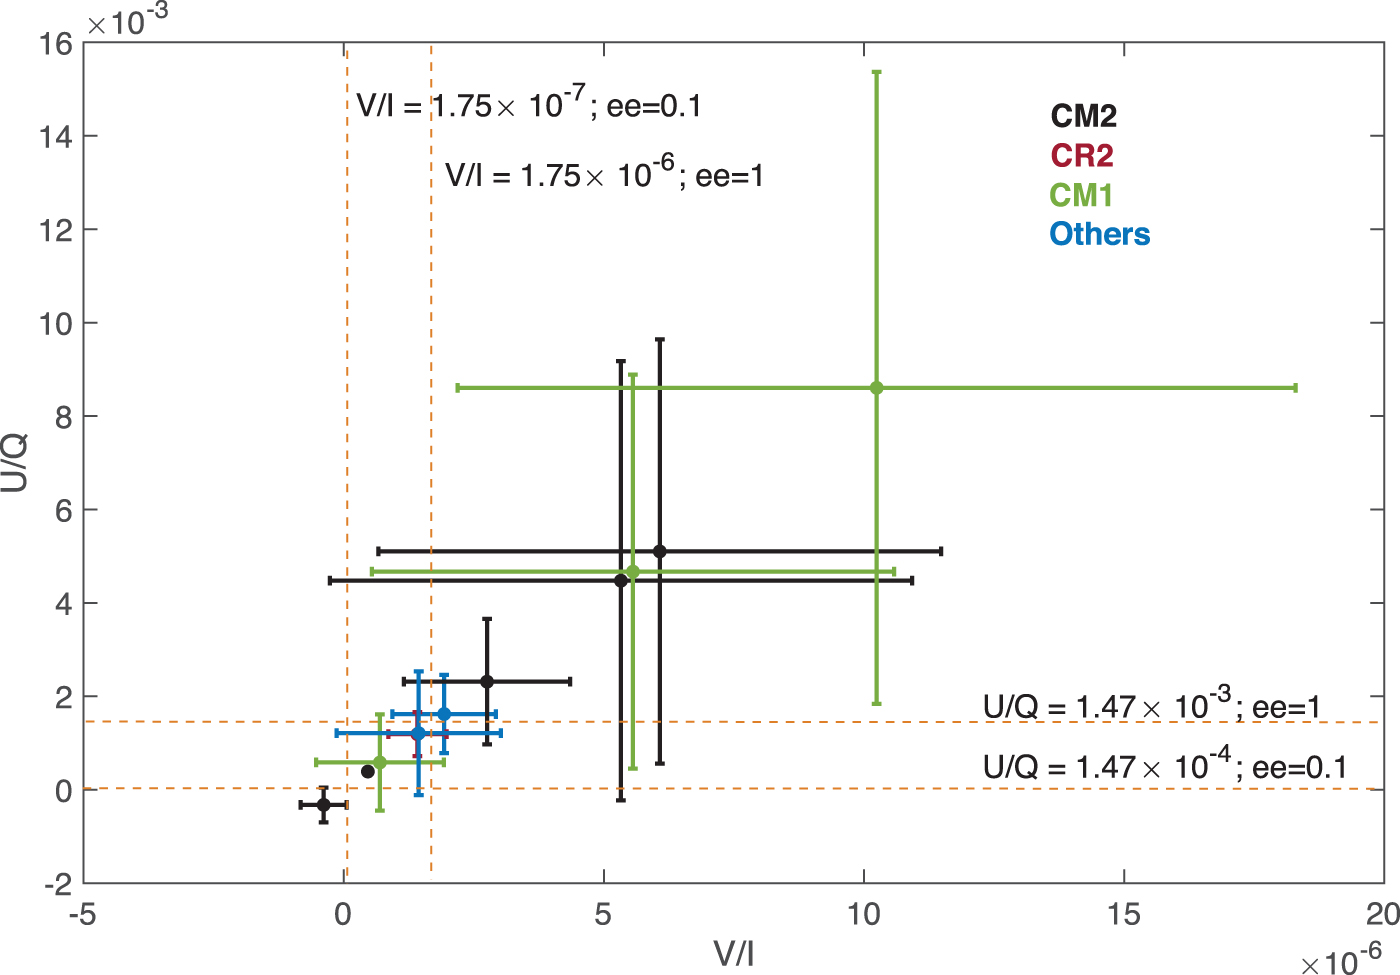
In this study, we have calculated the expected strength of the optical activity signatures (CD and ORD) of alanine in Solar System comets. The calculations are based on the only available measurement of the abundance of glycine in a comet. These estimates are conservative; while glycine abundance is 170 ppb in comet 67P/Churyumov-Gerasimenko, it is well known that it may rise to few thousands in chondrites with aqueous alteration (Martins and Sephton, 2009). In fact, ROSINA measurements indicate that C67/Churyumov-Gerasimenko is built of rather pristine material that has not been significantly altered either by heat or liquid water. However, this is not going to be the most generic case. In Fig. 5, we have plotted the n ala/n gly and the alanine enantiomeric excess (ee) of well-studied carbonaceous chondrites (Martins and Sephton, 2009); it is clear from the figure that both alanine abundance varies by several orders of magnitude from one sample to another and that measurements from comet 67P/Churyumov-Gerasimenko are in the low-abundance end. In Fig. 6, we display the expected values of the ratios V/I and U/Q between the Stokes parameters for the set of abundances and ee's in Fig. 5. The vast majority of the data are well above the fiducial values used for the calculations in Fig. 4a, 4b with ee = 0.1, and as expected the very hydrated chondrites (CM1, CM2) are more than 1 order of magnitude above. In spite of this, the CPR signal (V/I) is very small and cannot be measured by remote observation with current technology, as extensively discussed in Section 3. However, remote detection of alanine by ORD is clearly feasible.
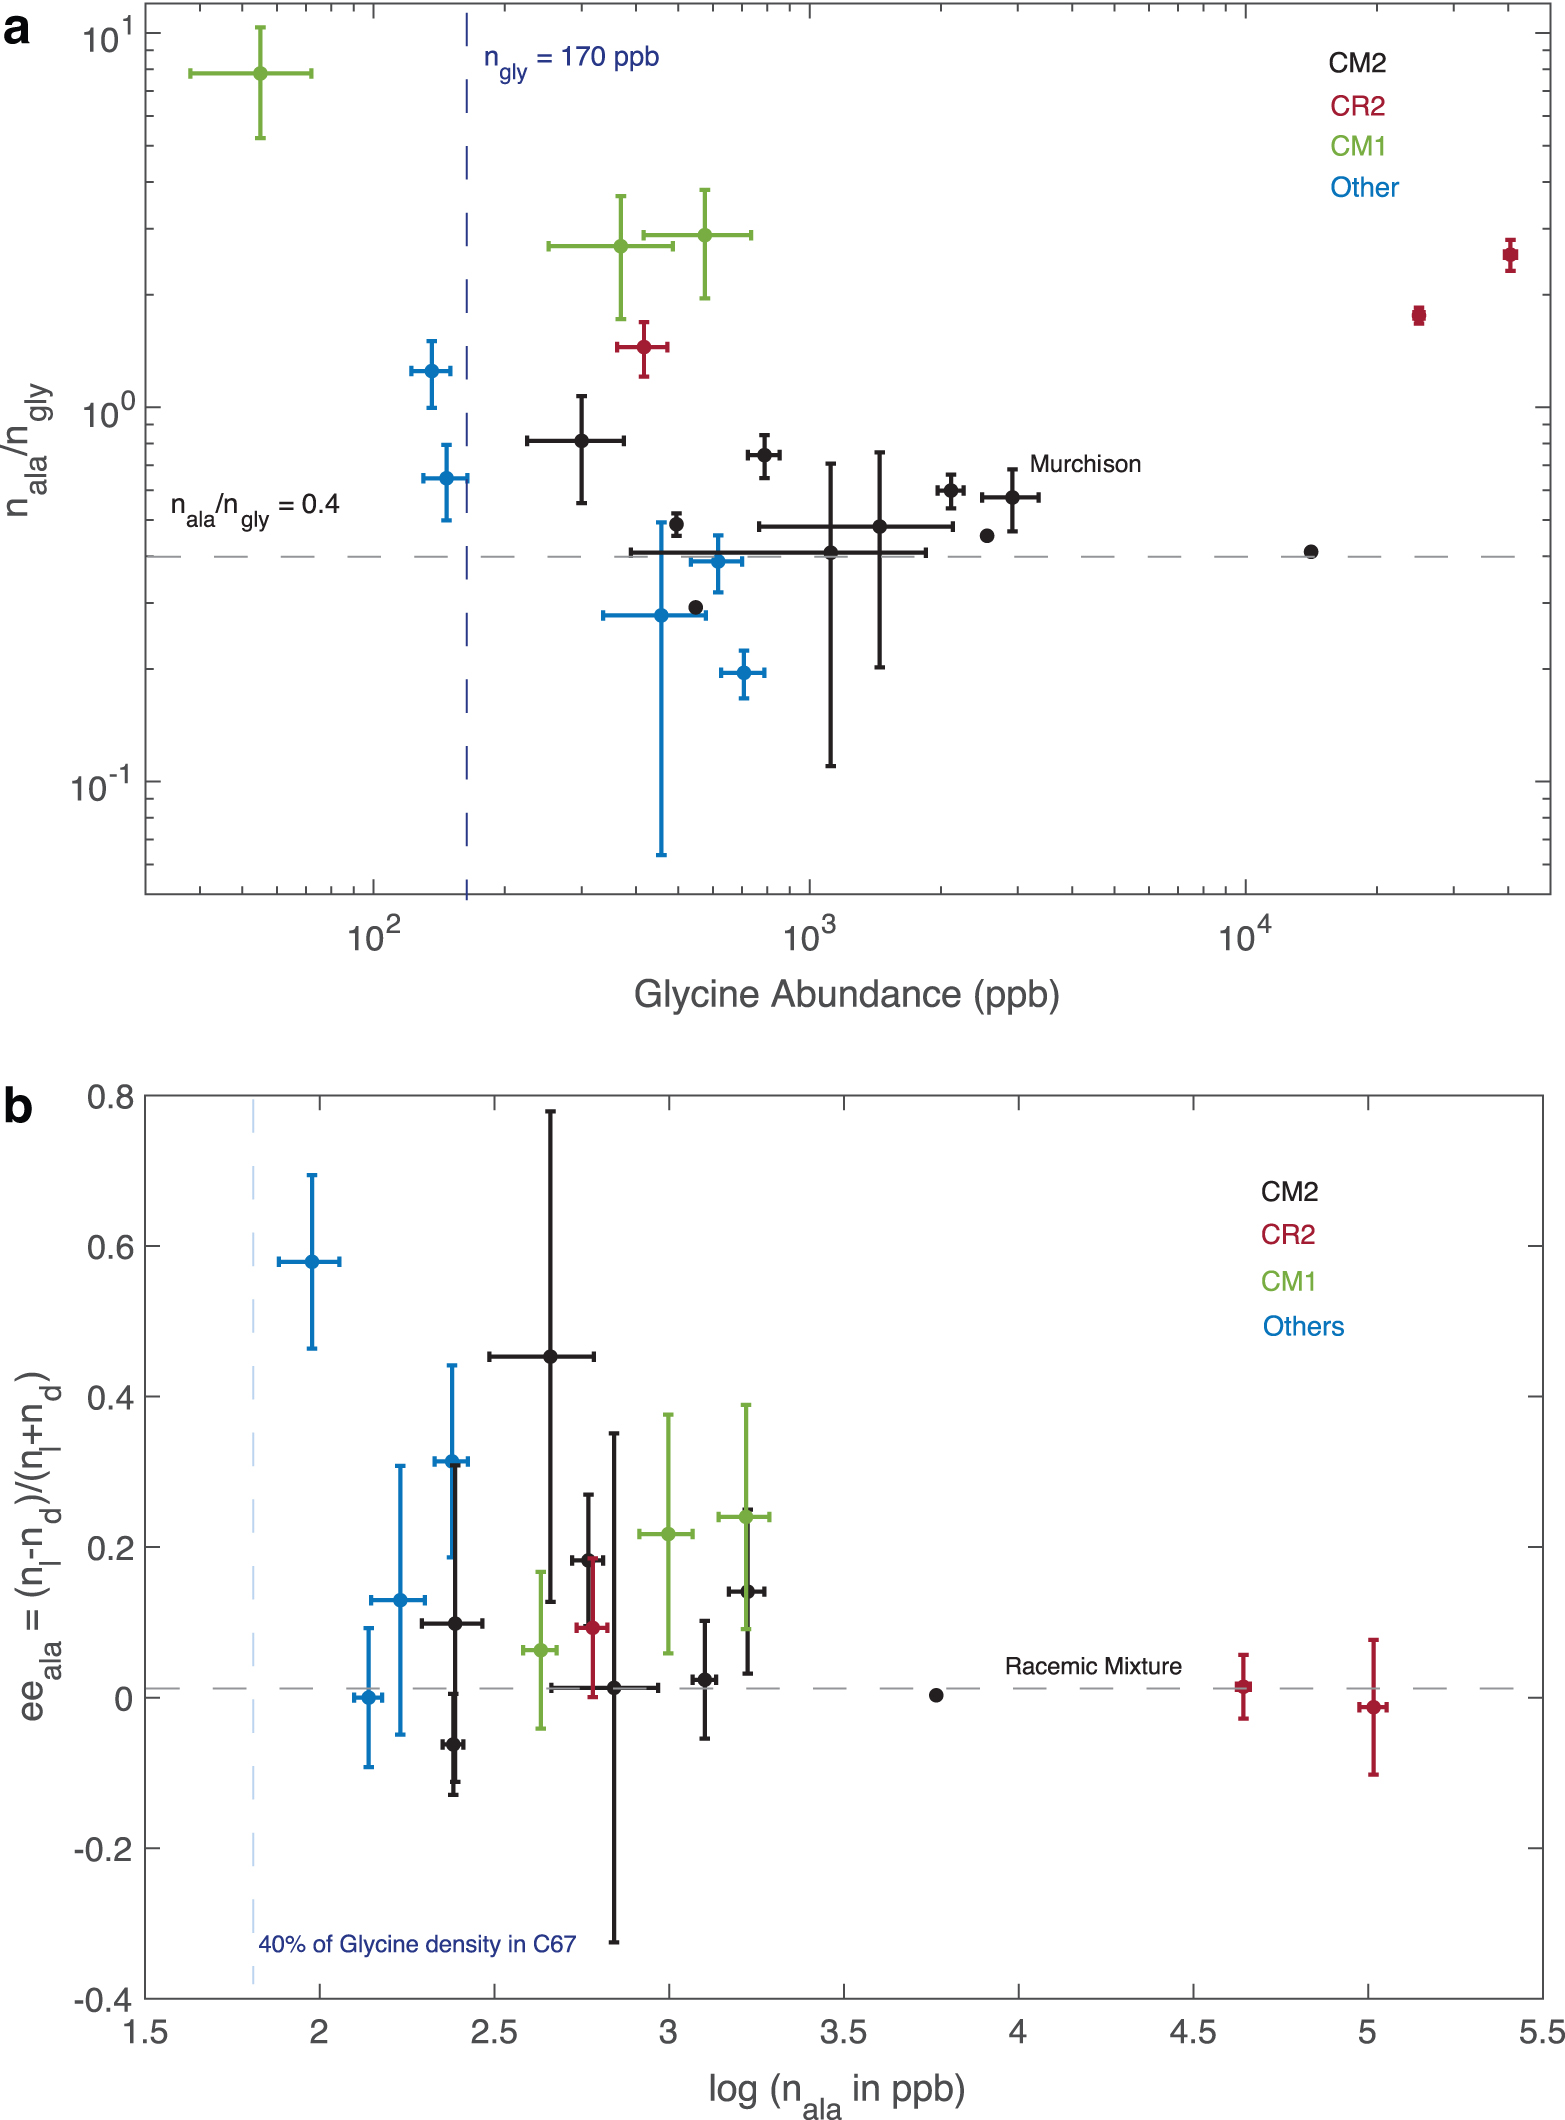
Top: Characteristics of the alanine content in carbonaceous chondrites. Alanine to glycine abundance against the glycine abundance. Bottom: Enantiomeric excess against alanine abundance. Color images are available online.
Alanine is not the only chiral amino acid expected to be formed in cometary environments; other amino acids are synthesized in laboratory experiments carried out with space ices, among them serine, valine, or proline (Muñoz Caro et al., 2002). All of them display features at wavelengths between 140 and 270 nm with very different spectral signatures in terms of the center and width of the band, the precise shape and strength (see, e.g., Fig. 1 in Meierhenrich et al., 2010); however, their detection will require even most sensitive instrumentation. The main challenge for the detection of amino acids is the weakness of the signal detected from Earth that requires an optimization of the optical system as well as making use of optimal observation conditions: observation of the brightest parts of the comets such as the head instead of the coma and observation at the smallest heliocentric and geocentric distances possible.
Alanine detection will depend on the imbalance in abundance between the two enantiomers. Measuring whether
The advantage of remote sensing over direct measurements is clear in terms of both cost and opportunity. The heliocentric distance of the comets observed by the IUE mission, as well as their distance to the satellite, is known (Table 2; Festou, 1990). Remote sensing of comets will provide sufficient statistical power to draw conclusions about whether enantiomeric imbalances are common in the Solar System to ee >0.1. Meanwhile, small instruments aboard planetary probes can provide fundamental information to map the origin and distribution routes of amino acids in the Solar System.
Footnotes
Acknowledgments
This research is funded in part by the Ministry of Science and Innovation of Spain under grant ESP2017-87813-R. A.I. Gómez de Castro thanks Federico Morán, Juli Pereto, Uwe Meierhenrich, and very especially Søren Vrønning Hoffmann for enlightening discussions.
Abbreviations Used
Associate Editor: Christopher McKay