
Abstract
Microbe-mineral interactions can produce unique composite materials, which can preserve biosignatures. Geological evidence suggests that iron sulfide (Fe-S) minerals are abundant in the subsurface of Mars. On Earth, the formation of Fe-S minerals is driven by sulfate-reducing microorganisms (SRM) that produce reactive sulfide. Moreover, SRM metabolites, as well as intact cells, can influence the morphology, particle size, aggregation, and composition of biogenic Fe-S minerals. In this work, we evaluated how simple and complex organic molecules—hexoses and amino acid/peptide mixtures, respectively—influence the formation of Fe-S minerals (simulated prebiotic conditions), and whether the observed patterns mimic the biological influence of SRM. To this end, organo-mineral aggregates were characterized with X-ray diffraction, scanning electron microscopy, and scanning transmission X-ray microscopy coupled to near-edge X-ray absorption fine structure spectroscopy. Overall, Fe-S minerals were found to have a strong affinity for proteinaceous organic matter. Fe-S minerals precipitated at simulated prebiotic conditions yielded organic carbon distributions that were more homogeneous than treatments with whole SRM cells. In prebiotic experiments, spectroscopy detected potential organic transformations during Fe-S mineral formation, including conversion of hexoses to sugar acids and polymerization of amino acids/peptides into larger peptides/proteins. In addition, prebiotic mineral-carbon assemblages produced nanometer-scaled filamentous aggregated morphologies. On the contrary, in biotic treatments with cells, organic carbon in minerals displayed a more heterogeneous distribution. Notably, “hot spots” of organic carbon and oxygen-containing functional groups, with the size, shape, and composition of microbial cells, were preserved in mineral aggregates. We propose a list of characteristics that could be used to help distinguish biogenic from prebiotic/abiotic Fe-S minerals and help refine the search of extant or extinct microbial life in the martian subsurface.
1. Introduction
It is now established that liquid water has been present at the surface of early Mars for periods of time that are long enough for microbial life to have emerged and proliferated (McKay et al., 1992; Squyres et al., 2004; Cockell, 2014; Grotzinger et al., 2014). Based on the hypothesis that martian life would be carbon-based as is life on Earth, the next step in the search of life on the red planet is the investigation of organic signatures (Westall et al., 2015; Hays et al., 2017; Brack, 2018). The presence of strong oxidants at the surface of Mars precludes the accumulation of organic molecules (Freissinet et al., 2015; Lasne et al., 2016; Eigenbrode et al., 2018) and casts doubt about the results of early in situ biological experiments at the surface of Mars by the Viking landers (Klein et al., 1976; Levin and Straat, 1977, 2016; Mazur et al., 1978; Margulis et al., 1979). However, organic molecules could potentially be well preserved in the subsurface of Mars, where they would be shielded from ultraviolet and ionizing radiation and be in a more reducing environment than at the surface (Cockell, 2014; Westall et al., 2015). On Earth, the most important mechanism that preserves organic carbon over geological timescales is the protection by minerals (Keil et al., 1994; Keil and Mayer, 2014; Hemingway et al., 2019). Therefore, organo-mineral aggregates precipitated in reducing subsurface environments represent a promising target to look for traces of microbial life on Mars (Hays et al., 2017).
Iron sulfide (Fe-S) minerals have been proposed to be abundant in the subsurface of Mars (Burns and Fisher, 1990a), and therefore represent a promising system for the search of life on Mars. Fe-S minerals on Earth provide the justification for this supposition, and an opportunity to further explore the relationship between Fe-S minerals and biosignatures. On Earth, Fe-S minerals precipitate in anoxic sedimentary environments from the reaction between ferrous iron and sulfide, with the latter being produced by sulfate-reducing microorganisms (SRM). The process of microbial sulfate reduction has been driving the sulfur cycle on Earth for potentially as long as the past 3.4 Gy (Shen and Buick, 2004; Shen et al., 2009; Jørgensen et al., 2019). The SRM not only provide nearly all sulfide for the formation of iron sulfide minerals, but they can also influence the physical properties and the composition of Fe-S minerals (Picard et al., 2018, 2019; Mansor et al., 2019). In addition, SRM can impart large sulfur isotopic fractionation between sulfate and sulfide that can be preserved in S-bearing solid phases, including Fe-S minerals, on geological timescales (Canfield, 2001; Fike et al., 2015). Finally, Fe-S minerals are associated with biomass-derived organic molecules when precipitated in the presence of SRM and can potentially preserve organic signatures for long periods (Picard et al., 2019).
If life emerged on Mars, it has likely happened in its early history, when environmental conditions were more similar to those on Earth (Nisbet and Sleep, 2001; Zahnle et al., 2007). Life on Mars would likely have been anaerobic and chemotrophic (Cockell, 2014; Westall et al., 2015), and microbial sulfate reduction is a plausible metabolic pathway for martian microorganisms based on available reactants (Banfield et al., 2001; McMahon et al., 2018). Sulfur is abundant and ubiquitous on Mars. On the surface of modern Mars, it is mostly found in the oxidized state (S6+) in a variety of sulfate minerals, whereas reduced sulfur species (S2−, S1−) have been proposed to be abundant in the martian subsurface (Franz et al., 2018). With such a range of oxidation states, there is potential for a biologically mediated sulfur cycle on Mars (King and McLennan, 2010). Early anaerobic life could have thrived in the reducing subsurface, and/or could have retreated to the subsurface when the surface dried out and became oxidizing (Cockell, 2014). Abundant sulfate salts could have been used by SRM if liquid water was available. Abiotic hydrocarbons or H2 have been proposed as potential energy sources, and carbon dioxide or magmatic carbon as a potential carbon source for building biomass (Michalski et al., 2013; Cockell, 2014). As Fe is also abundant on Mars, iron sulfide minerals have been proposed to be abundant in the subsurface. This is supported by meteorite data and orbital and in situ measurements (Burns and Fisher, 1990a, 1990b; Lorand et al., 2005; Zolotov and Shock, 2005; Vaniman et al., 2014; Franz et al., 2018). Massive sulfide ores mainly composed of pyrrhotite and pentlandite could have formed on Mars as a result of magmatic activity (Burns and Fisher, 1990a), whereas pyrite deposition could have occurred through hydrothermal activity induced by impacts (Zolotov and Shock, 2005). If microbial sulfate reduction evolved on Mars, iron sulfide minerals formed from microbially reduced sulfur may also be present (Zolotov and Shock, 2005; Parnell et al., 2010; Frank et al., 2015).
Although microbial biomass can associate with Fe-S minerals and influence their properties, it is unknown whether individual organic molecules or organic mixtures could influence the formation of iron sulfide minerals in a way that could mimic a biological signature. In other words, differentiating the processes of iron sulfide mineral formation requires that biotic and abiotic processes produce discernably distinct minerals. Iron sulfide minerals can record a biological imprint in their morphology, element and isotopic composition, but they can also preserve organic signatures. On Mars, organic molecules received in significant amounts from space or produced abiotically by past hydrothermalism (Steele et al., 2012, 2016, 2018; Franz et al., 2020) could have influenced the properties of iron sulfide minerals in the subsurface of Mars without the presence of life.
In this work, we aimed at identifying the differences between iron sulfide minerals precipitated in the presence of simple molecules (glucose or mannose) and complex organic mixtures (tryptone or yeast extract) at simulated prebiotic conditions, and iron sulfide minerals precipitated at biotic conditions (i.e., fully grown cultures of Desulfovibrio hydrothermalis that contained biotic sulfide and microbial cells). In the latter case, minerals were precipitated away from cells, as Fe(II) was added after sulfide had been produced, leaving no opportunity for Fe(II) to bind to the cells (Picard et al., 2018). We compare our results with minerals precipitated with microbial cells grown in the presence of Fe(II), in which case minerals precipitate at the surface of cells and strongly associate with organic molecules (Picard et al., 2018, 2019). We used X-ray diffraction (XRD), scanning electron microscopy (SEM), and scanning transmission X-ray microscopy (STXM) coupled to near-edge X-ray absorption fine structure (NEXAFS) spectroscopy to characterize the mineralogy, morphology, and chemistry of iron sulfide minerals and to determine whether we can distinguish prebiotic from biotic signatures.
2. Materials and Methods
2.1. Glassware, medium and solutions
Glassware used in this study was combusted at 550°C, washed with 1 N HCl, rinsed with ultrapure water, and autoclaved. Rubber stoppers were boiled three times in ultrapure water and autoclaved. The medium used for iron sulfide mineral precipitation experiments was an anoxic marine mineral medium (DSMZ 195c medium, omitting the addition of sulfide and resazurin) that is typically used for the cultivation of sulfate-reducing bacteria. The complete medium consisted of five sterile solutions that were mixed together in the anaerobic chamber: anoxic marine mineral solution (870 mL), anoxic sodium bicarbonate buffer (100 mL), anoxic sodium
2.2. Iron sulfide mineralization experiments
All experiments were prepared in an anaerobic chamber (Coy Laboratory Products, Inc.). The sulfate-reducing bacterium D. hydrothermalis AM13T was purchased from the German culture collection DSMZ (DSM 14728). Strain AM13 grows optimally at 35°C and is an incomplete lactate oxidizer (Alazard et al., 2003). The strain was inoculated in the complete medium at a concentration of ∼106 cells/mL and incubated for at least 5 days at 35°C until the cells reached stationary phase (∼108 cells/mL). Two hundred microliters of the 1 M FeCl2 solution was added to the fully grown culture (50 mL) to precipitate iron sulfide minerals with biotic H2S in the presence of cells. The final concentration of Fe(II) was about 4 mM, and the Fe(II):sulfide ratio was ∼1:2. Cultures immediately turned black and opaque upon the addition of sodium sulfide, indicating precipitation of iron sulfide minerals. At these conditions, iron sulfide minerals precipitate away from cells, as cells do not serve as templates for the nucleation or growth of minerals, in contrast to when cells are grown in the medium containing Fe(II) (Picard et al., 2018). After addition of Fe(II), cultures were placed back in the incubator at 35°C and incubated for several months until analysis (Table 1). Carbon concentrations and initial C/Fe molar ratios were calculated by using the cell concentration reached at stationary phase in these experiments (∼108 cells/mL) and a reported biomass yield of 10.3 g/mol sulfate for Desulfovibrio grown with lactate (Voordouw, 2002) (Table 1).
Summary of Iron Sulfide Mineralization Experiments Discussed in This Article
The organic carbon concentration in experiments is calculated from the amount of organic molecules added to prebiotic experiments or estimated from the cell concentrations in biotic experiments. The Fe(II) concentration is ∼4 mM in all experiments. XRD, SEM, STXM, and NEXAFS spectroscopy were used to characterize mineral aggregates.
Picard et al. (2018).
Picard et al. (2019).
Data analysis made for this study.
NEXAFS, near-edge X-ray absorption fine structure; SEM, scanning electron microscopy; STXM, scanning transmission X-ray microscopy; XRD, X-ray diffraction.
Iron sulfide minerals were also precipitated in the complete medium in the presence of organic molecules to simulate prebiotic conditions. First, 1 mL of a concentrated solution (glucose, mannose, tryptone, yeast extract) was added to 50 mL of complete medium (see Table 1 for C concentrations and initial C/Fe molar ratios). Then, 200 μL of the 1 M FeCl2 solution was added to the medium to reach a final concentration of Fe(II) of about 4 mM. Finally, sodium sulfide was added to the bottles to reach an Fe(II):sulfide ratio of ∼1:2, as in the biotic experiments. The precipitation of iron sulfide minerals occurred on addition of sodium sulfide. Experiments were incubated at 35°C for several months.
Solid phases were recovered by centrifugation, washed with sterile anoxic water, left to dry on sample holders in the anaerobic vinyl chamber (Coy Laboratory Products, Inc.), and transported to analytical instruments in air-tight containers to prevent contact with atmospheric oxygen. A summary of experiments and analytical measurements is given in Table 1.
2.3. X-ray diffraction
Solid phases were analyzed by powder XRD to determine their mineralogy. Solid phases were recovered from whole experiments (50 mL) by centrifugation at ≈3000 g in 50-mL centrifuge tubes, rinsed with anoxic water, and dried in small tubes that were left open in the anaerobic chamber for about 48 h. The samples were transported in an air-tight jar to the instrument at the X-ray laboratory of the Department of Chemistry and Chemical Biology at Harvard University. Immediately before measurements, samples were homogenized with 200-proof ethanol in an agate mortar and mounted on a zero-diffraction silicon plate (MTI Corporation). Powder XRD data were acquired by using Cu-Kα radiation (30 mV, 10 mA) from a Bruker™ D2 Phaser. X-ray diffractograms were acquired at 2θ angles from 10° to 60° with increment steps of 0.05° and a scan speed of 2 s. A background subtraction was performed on the XRD data by using the DIFFRAC algorithm. Mineral phase identification was performed by comparing peak positions and relative intensities against powder diffraction databases with the DIFFRAC.EVA module of the DIFFRAC.SUITE by Bruker. The reference pattern for mackinawite displayed in this study is PDF 86-0389 (Lennie et al., 1995). Diffraction peaks in XRD patterns were fitted with Lorentzian functions to determine their position and their full width at half maximum (FWHM). The average size of crystalline domains was estimated by using the Scherrer equation as described in the work of Wolthers et al. (2003):
where L is the average size of the crystalline domain, K is the Scherrer constant (0.9), λ is the wavelength of the applied X-rays (0.15418 nm for Cu Kα), β is the FWHM of the peak, and θ is the Theta-angle of the position of the peak. The Scherrer equation was applied to the (001) and (200) reflections of mackinawite to determine the length of the crystalline domain along the c-axis and along the a/b-axes, respectively.
2.4. Scanning electron microscopy
SEM was used to image the texture of organo-mineral aggregates. Solid phases were recovered from 1 mL of suspension by centrifugation in small centrifuge tubes (14,000 rpm, 15 min), rinsed, and resuspended in anoxic water. A drop of suspension was then deposited and dried on a small chip broken off an Si wafer in the anaerobic chamber. The Si chip was fixed onto an aluminum stub with double-sided carbon tape. Samples were imaged with a Supra 55VP field emission SEM (Zeiss) operating at the Harvard Center for Nanoscale Systems (CNS). Secondary electron images were obtained at a voltage of 10 kV and a working distance of 3–4 mm with an Everhart-Thornley secondary electron detector or an InLens detector.
2.5. STXM and NEXAFS spectroscopy
STXM and NEXAFS spectroscopy were carried out at the 10ID-1 beamline of the Canadian Light Source (Saskatoon, Canada) and at the 11.0.2 beamline of the Advanced Light Source (Berkeley, CA). Technical details about the beamlines can be found elsewhere (Bluhm et al., 2006; Kaznatcheev et al., 2007). Mineral preparation for STXM was done in the anaerobic chamber. Minerals were recovered by centrifugation (1-mL samples, ≈11,000 g, 20 min), washed, and resuspended in anoxic sterile water. For each sample, a small drop of mineral suspension was deposited on a Cu 200-mesh formvar-coated transmission electron microscopy grid (Electron Microscopy Sciences) that had been previously attached with double-sided tape to a sample holder adapted to the beamlines' microscopes. Samples were left to dry in the anaerobic chamber. Sample holders were transported to the beamlines in air-tight jars, limiting the contact of minerals with air to less than 30 s during the transfer to the microscope chamber. The air in the microscope chamber was evacuated and replaced by an He atmosphere for measurements. This experimental procedure has been previously established to prevent oxidation of iron sulfide minerals (Picard et al., 2019). Image sequences (stacks) were acquired on mineral aggregates across the Fe L3,2-edges (700–740 eV) and the S L-edge (155–185 eV) to characterize the Fe and S chemistry and distribution, respectively; across the C K-edge (280–320 eV) and the O K-edge (525–560 eV) to characterize organic molecules and functional groups present in the organic carbon associated with iron sulfide minerals. Measurements at the O K-edge also served to verify that anoxic conditions were maintained during the preparation and the transport of samples to the synchrotrons, as spectral features of iron oxides at the O K-edge are very specific (Chan et al., 2011; Picard et al., 2016b). A spectral resolution of 0.1 eV was used for regions of interest in the absorption spectra. The C K-edge NEXAFS spectra of standard organic compounds (saturated lipid, albumin, alginate, and glucose) presented in Fig. 3 are from other studies (Lawrence et al., 2003; Dynes et al., 2006; Hitchcock et al., 2009).
2.6. STXM and NEXAFS data processing
Data were processed with the aXis2000 software package and standard procedures (Hitchcock, 2019). Images were converted from transmission scale to optical density (OD) scale by using established procedures (Jacobsen et al., 2000). The OD maps of elements (Fe, C, and O) were generated by subtracting pre-edge images from images that showed the highest absorption (708.7, 288.2–288.6, and 538 eV), respectively. Maximum OD values and average OD values (after removing 0 values) were obtained from the OD images with aXis2000. Average NEXAFS spectra were extracted from whole sequence images or from selected structures (hot spots or extracellular material). Spectra were normalized to unity with the software Athena (Ravel and Newville, 2005). Thicknesses of Fe in FeS and C in organic material were estimated in mineral aggregates by using average OD values extracted from Fe(II) and organics maps and the following scaling factors (SF): 45.6 nm/OD unit for FeS, 324.3 nm/OD unit for glucose and mannose, 327.5 nm/OD unit for tryptone, 453.5 nm/OD unit for yeast extract, and 368.5 nm/OD unit for microbial biomass. The SF were calculated as follows based on published recommendations (Wan et al., 2007):
where RE is the resonance enhancement factor (unitless), μ is the difference between the mass absorption coefficient above and below the absorption edge of the element considered (cm2/g), f is the mass fraction of the element in the solid phase, and ρ is the density of the material (g/cm3). The RE factors are 5 and 1 for Fe and C, respectively. The mass absorption coefficients (μ) are 15,800 and 51,400 cm2/g for Fe and C, respectively, at their respective absorption edge energy. The mass fractions (f) of the elements within the solid phases were the following: 0.635 (in g of Fe per g of FeS) and 0.4 for glucose/mannose, 0.44 for tryptone, 0.39 for yeast extract, 0.48 for biomass (in g of C per g of organic molecules/biomass). The densities (ρ) used for FeS, glucose/mannose, and bacterial biomass were 4.37, 1.5, and 1.1 g/cm3, respectively. As tryptone is an enzymatic digest of proteins, the density used for our calculations is based on the average density of proteins of 1.35 g/cm3 (Fischer et al., 2004). For yeast extract, which is a water-soluble extract of autolyzed yeast cells, we use the density of bacterial biomass of 1.1 g/cm3 . The C/Fe thickness ratios were calculated from the estimated thicknesses.
2.7. Image analysis
The correlation between Fe and C, and between C and O, in mineral aggregates was investigated by using the ScatterJ plugin (Zeitvogel et al., 2016), available in the free software ImageJ (Rueden et al., 2017) (
3. Results
3.1. Characterization of the mineral phase of iron sulfide mineral aggregates precipitated in prebiotic and biotic conditions
The XRD patterns of minerals precipitated in prebiotic conditions, that is, abiotic conditions in the presence of simple organic molecules (glucose and mannose) and complex organic mixtures (tryptone and yeast extract), displayed intense and broad Bragg peaks at angles of 17.6°, 30.1°, 39.0°, 49.6°, and 50.5°, and smaller Bragg peaks at angles of 34.5° and 53.0° (Fig. 1A). These peaks were assigned to mackinawite, which was the only crystalline iron sulfide mineral detected over the course of these experiments. Traces of siderite were detected in some experimental conditions, as indicated by the small Bragg peak appearing at an angle of 32.0° (Fig. 1A). The XRD patterns collected in this study were comparable to those of minerals precipitated in abiotic conditions in the mineral medium without organic molecules and minerals precipitated with biotic sulfide away from cells (redrawn in Fig. 1A for comparison) (Picard et al., 2018).
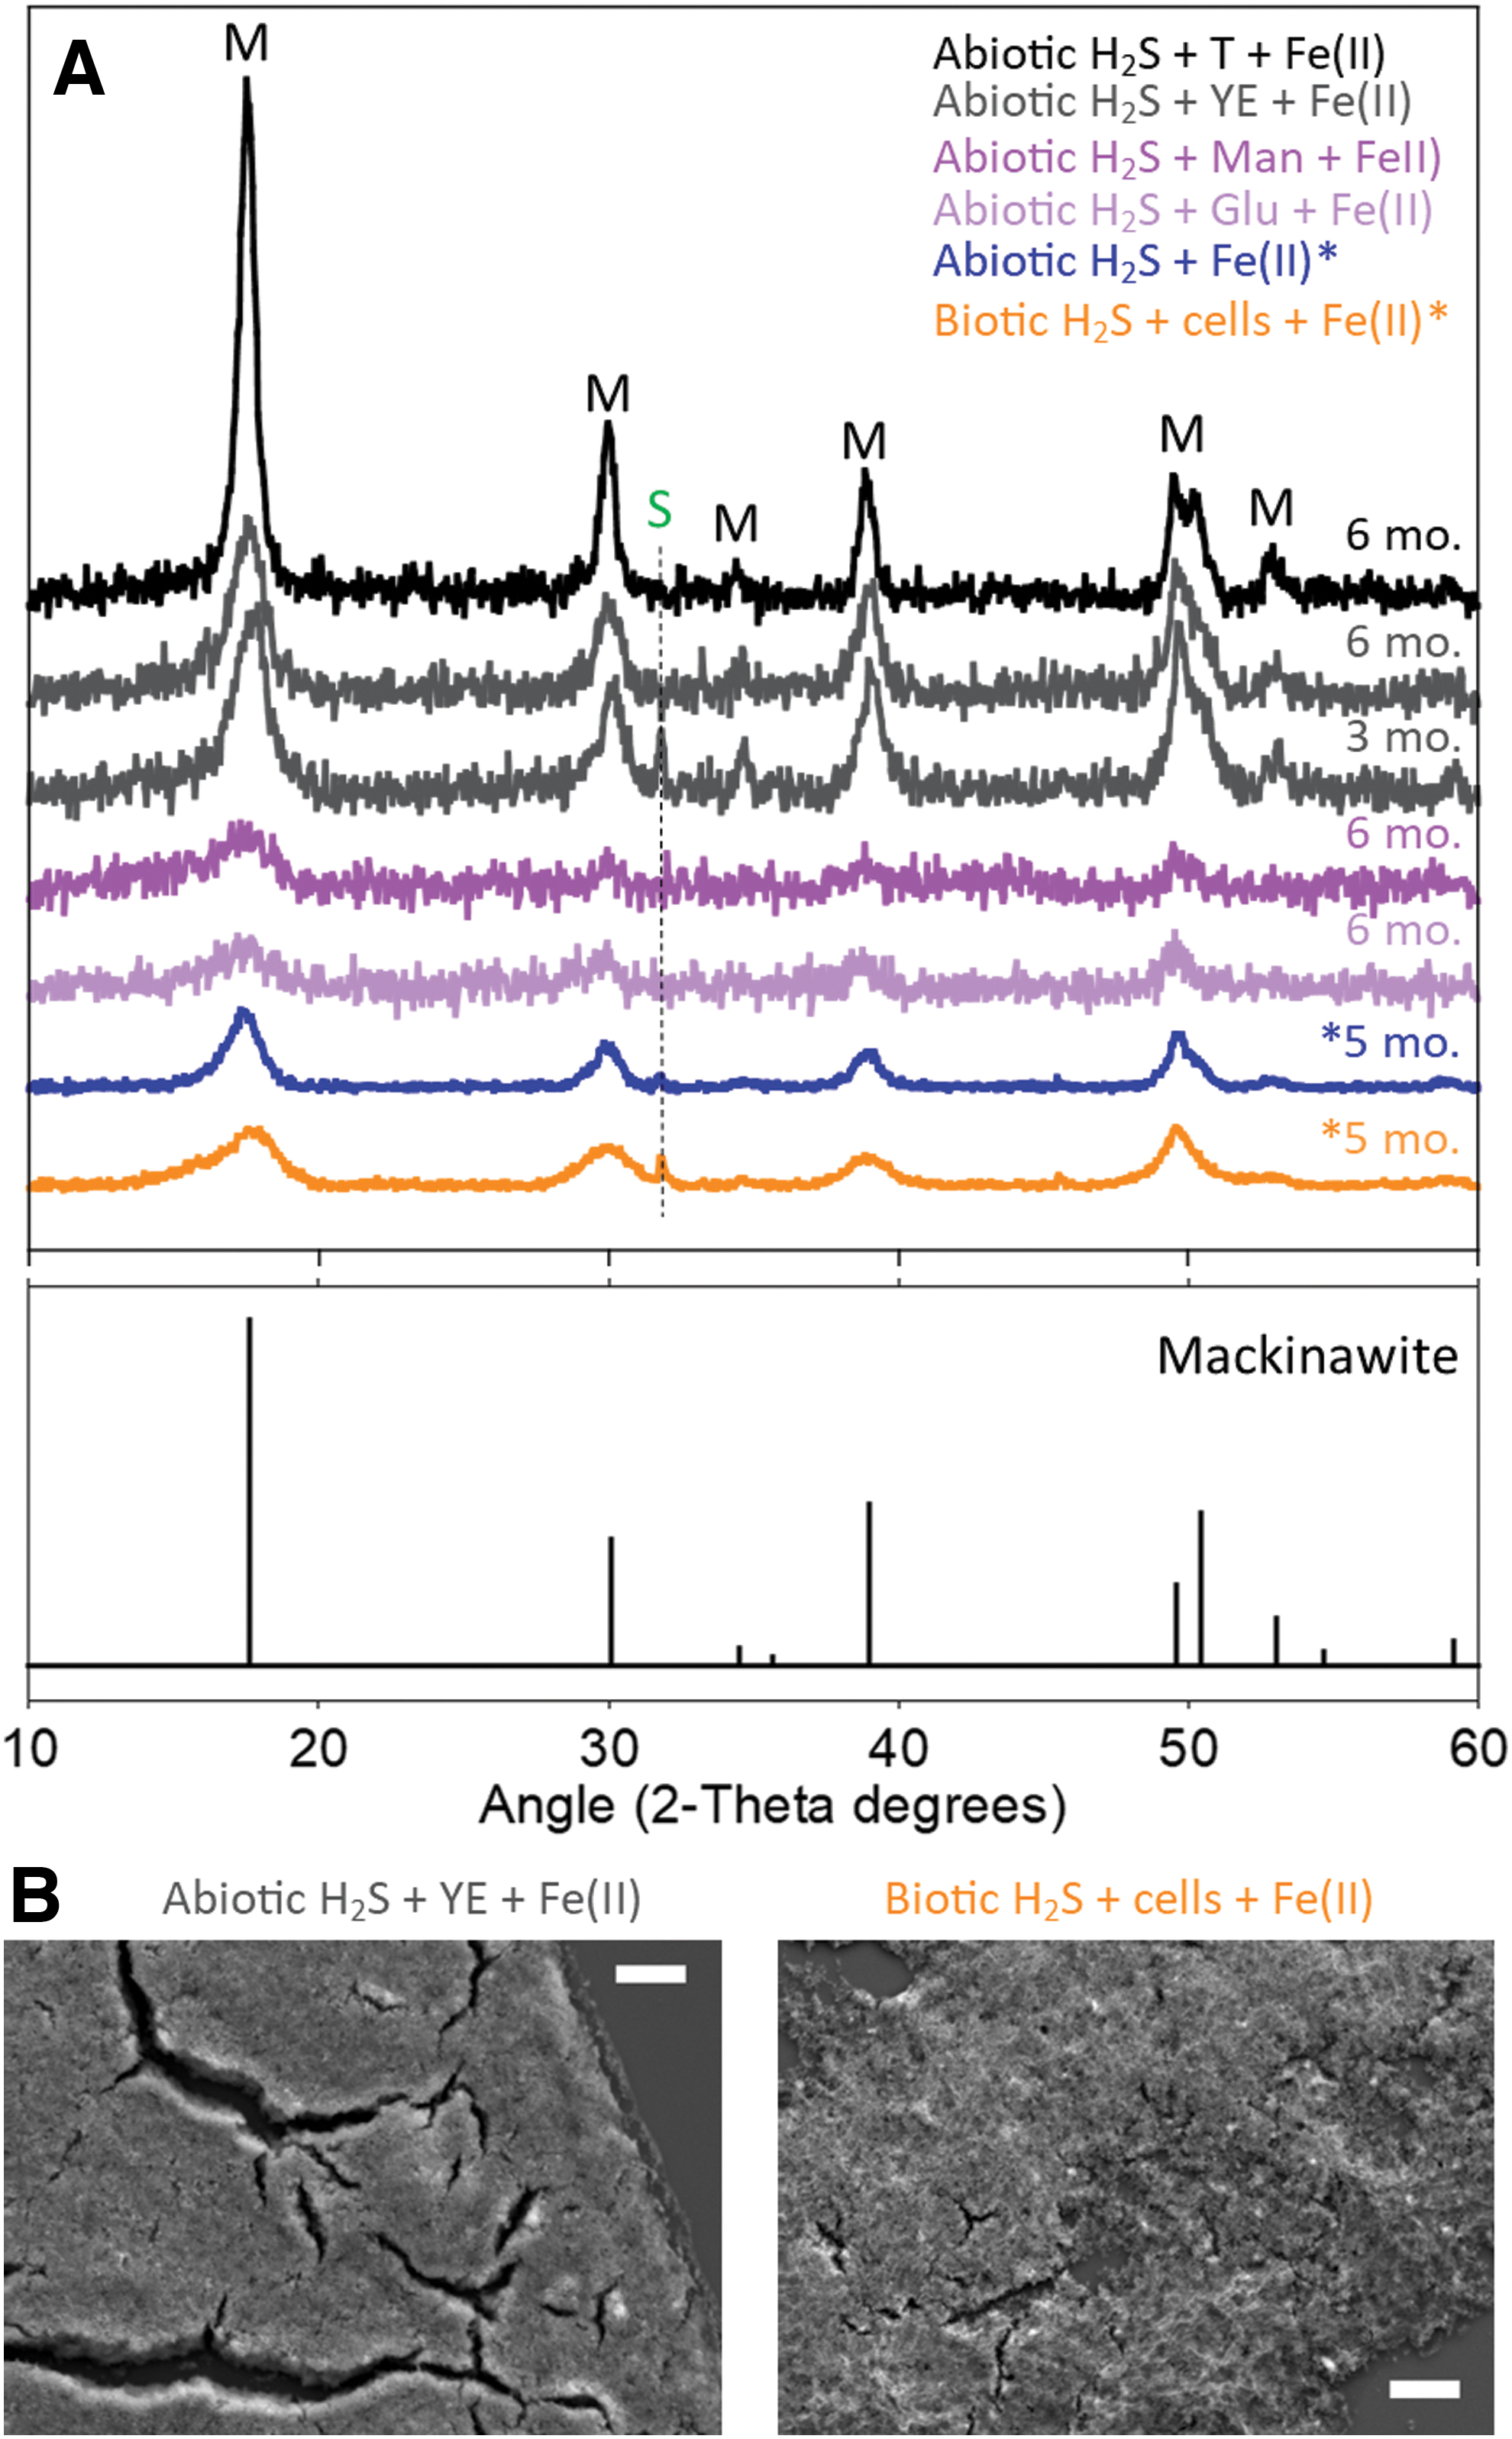
The calculated mineral particle size of mackinawite precipitated with simple and complex organic molecules (Table 2) was in the range of abiotic mackinawite (Wolthers et al., 2003; Picard et al., 2018; Mansor et al., 2019) and of mackinawite precipitated with biotic sulfide away from cells, but much smaller than mackinawite precipitated at the surface of live and dead sulfate-reducing bacteria (Picard et al., 2018). Iron sulfide minerals precipitated with yeast extract and those precipitated in the presence of biotic sulfide and cells displayed a fine texture (Fig. 1B). A fine texture observed in SEM indicates limited aggregation and is consistent with a small particle size (Picard et al., 2018).
Particle Size of Iron Sulfide Minerals Precipitated in the Mineral Medium in the Presence of Simple and Complex Organic Molecules (This Study), Compared with Abiotic Minerals and Biotic Minerals from Other Studies (Wolthers et al., 2003; Picard et al., 2018; Mansor et al., 2019)
In all studies, the mineral particle size was calculated by using the Scherrer equation.
NEXAFS spectroscopy was used at the Fe L3,2-edges and at the S L-edge to gain insights into the chemistry of Fe and S in iron sulfide mineral aggregates, respectively. Average NEXAFS spectra at the Fe L3,2-edges collected from mineral aggregates were all similar to the spectrum of abiotic mackinawite precipitated in the culture medium (Fig. 2A). These spectral features are characteristic of the tetragonal coordination of Fe(II) in FeS (Todd et al., 2003). NEXAFS spectra at the S L-edge were acquired for a subset of conditions and all displayed spectral characteristics of abiotic mackinawite (Fig. 2B). However, the limited intensity of the pre-edge spectral features of FeS prevents further interpretation of the spectra (Farrell et al., 2002). Overall, the Fe and S chemistry was homogeneous in mineral aggregates precipitated in prebiotic and biotic conditions.
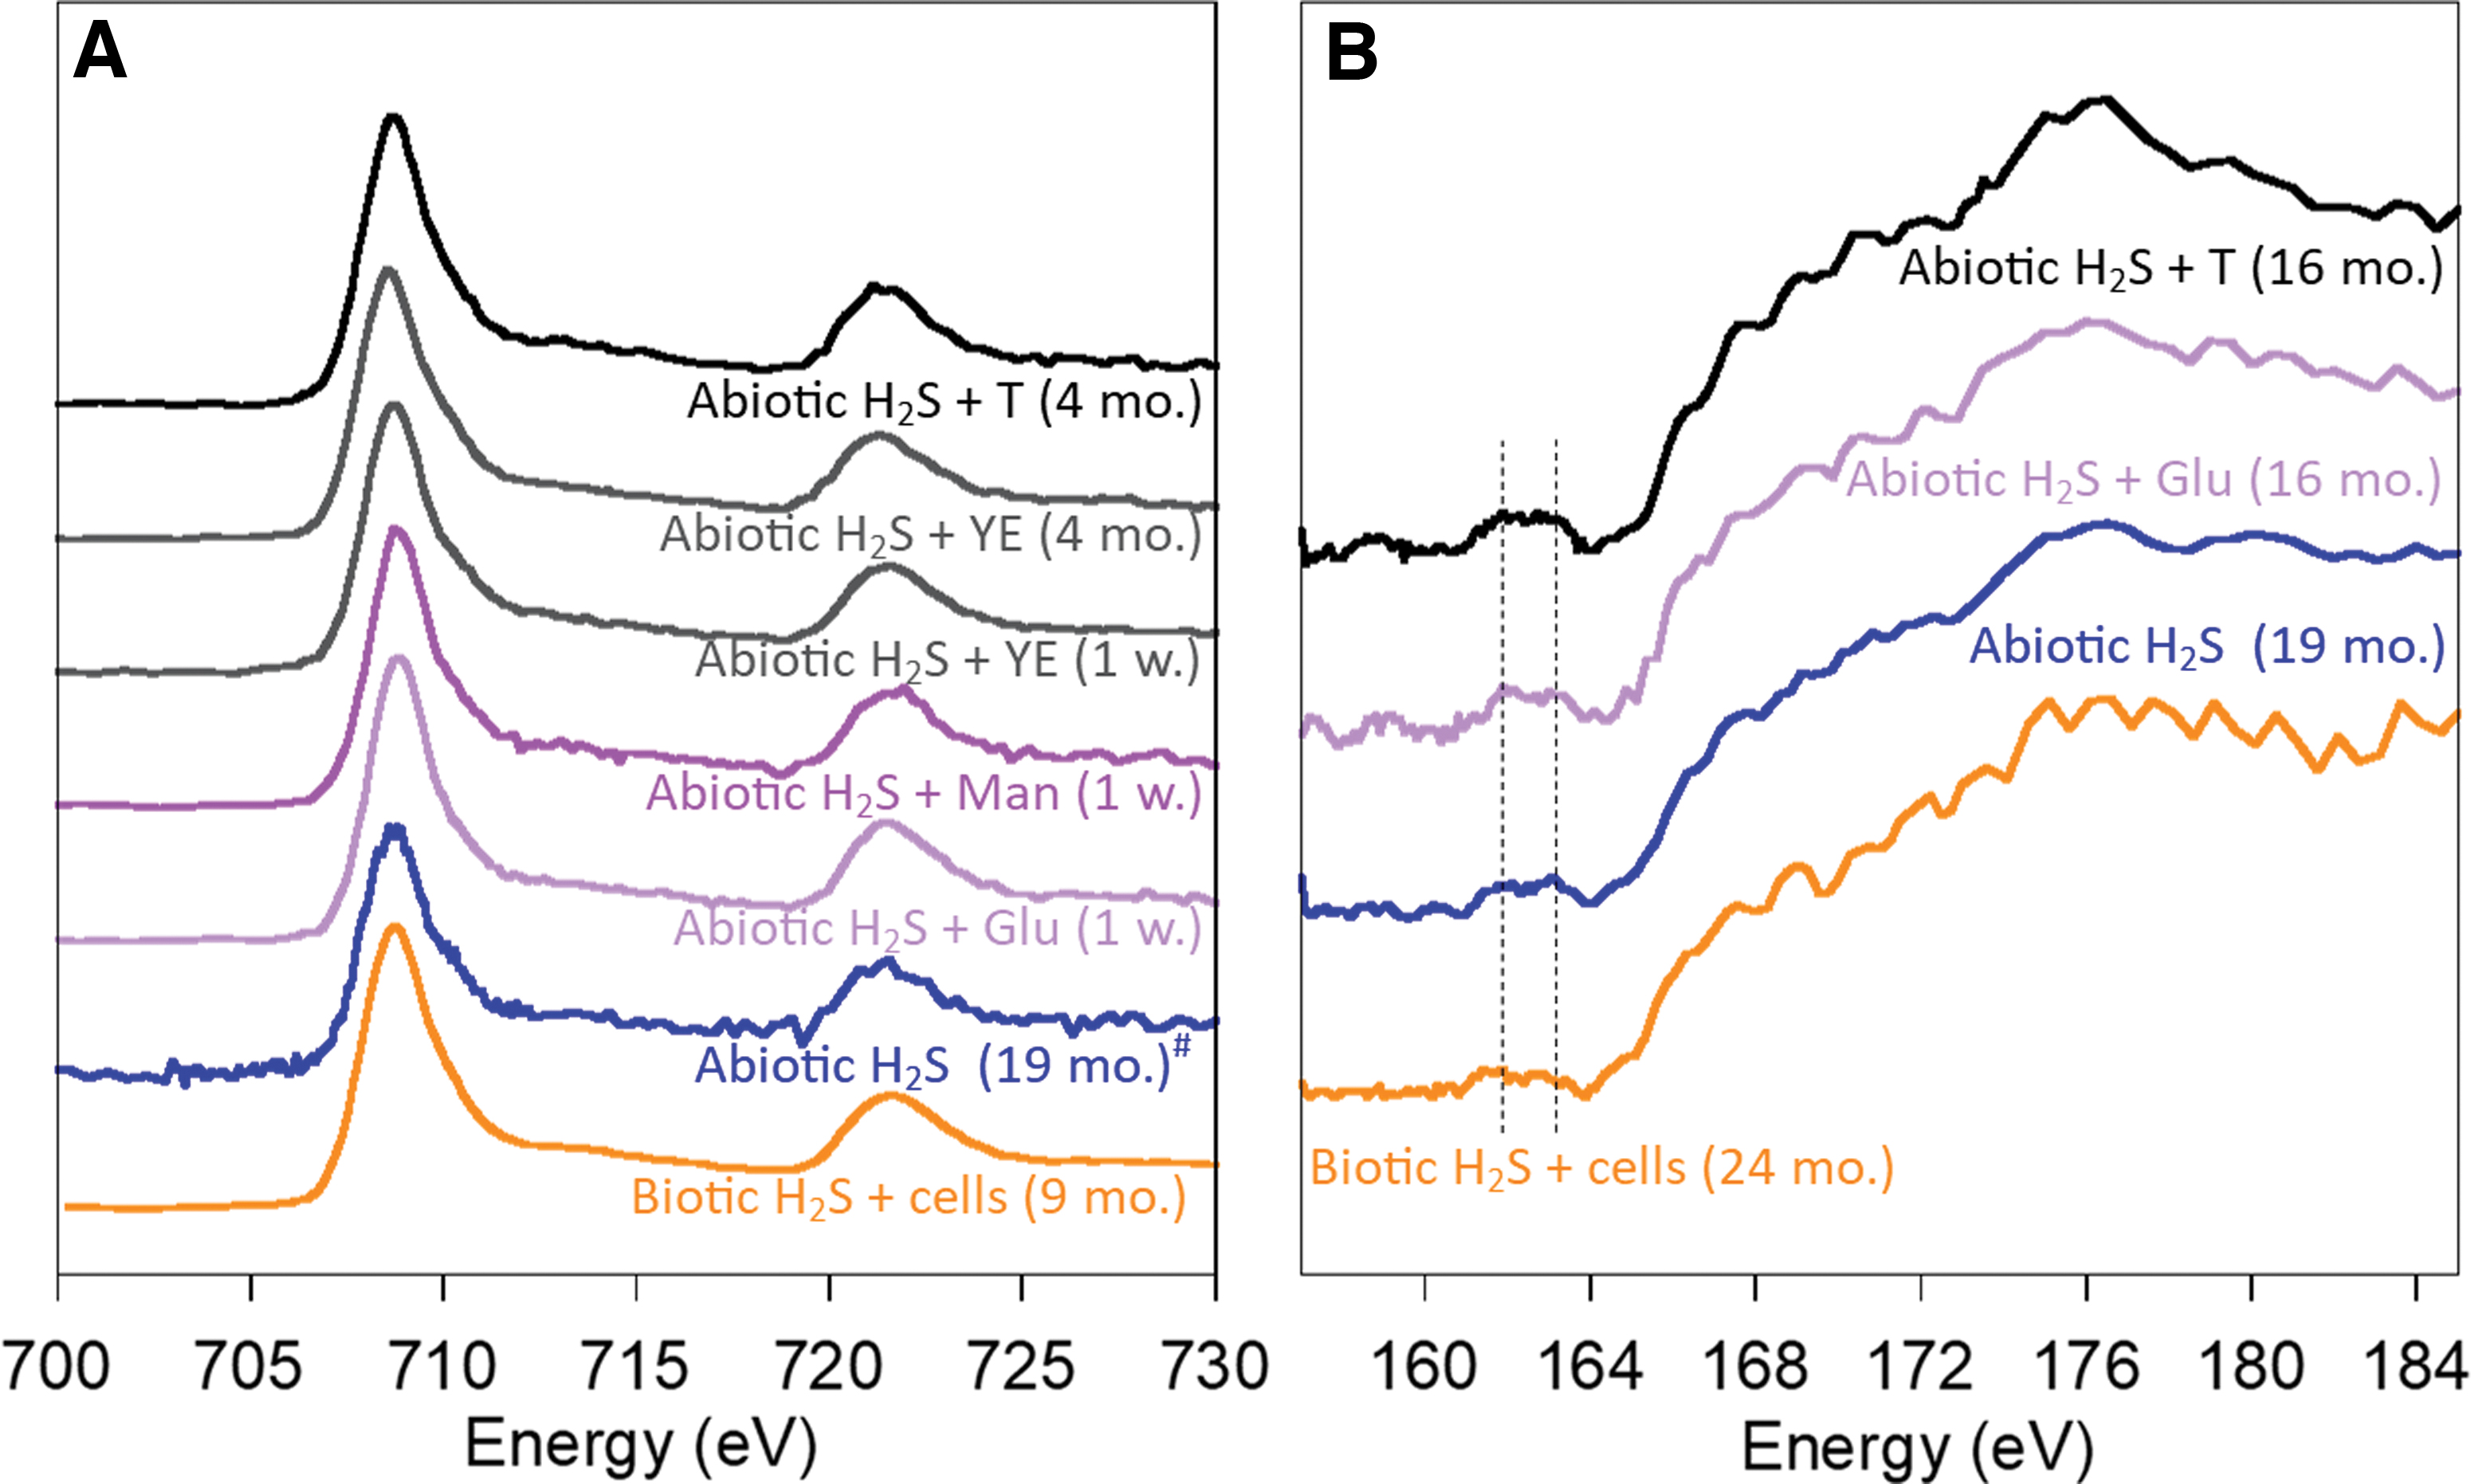
Fe L3,2-edges and S L-edge NEXAFS spectroscopy of Fe and S in iron sulfide minerals precipitated in abiotic conditions, iron sulfide minerals precipitated in prebiotic conditions in the presence of tryptone (T), yeast extract (YE), mannose (Man), and glucose (Glu), and iron sulfide minerals precipitated in the presence of biotic H2S and cells.
3.2. Characterization of the organic phase of iron sulfide mineral aggregates precipitated in prebiotic and biotic conditions
NEXAFS spectroscopy was used at the C K-edge to characterize the composition of organic carbon associated with minerals (Fig. 3). The spectra of monosaccharides typically exhibit a peak between 289.1 and 289.6 eV (289.3 eV for the glucose spectrum in Fig. 3A), which is attributed to the C1s-3p/σ* transition of C-O in O-alkyl groups (C-OH) (Solomon et al., 2009). The C K-edge spectroscopic signature of minerals precipitated with glucose and mannose was similar to one another but did not match the spectrum of glucose (Fig. 3A). A main broad and undefined feature appeared between 288.3 and 288.7 eV. These values are in the range of the C1s-3p/π* transition of C = O in -COOH groups (288.4–288.7 eV). If the presence of carboxylic functional groups can be confirmed, these spectral modifications indicate a potential transformation of glucose/mannose into sugar acids during the formation of iron sulfide minerals. Polymerization of these sugar acids into acidic polysaccharides is not excluded; the C K-edge spectrum of acidic polysaccharides (see alginate spectrum in Fig. 3B) also presents the main feature attributed to carboxylic groups at 288.7 eV (Chan et al., 2004). In addition, a new feature appeared at ∼285.2 eV in the spectra of minerals precipitated with glucose and mannose (Fig. 3A). This indicates the presence of stable aromatic ring structures. This supports the hypothesis that iron sulfide minerals promote transformations and changes in the structure of monosaccharides. The spectra of tryptone and yeast extract were similar to one another and displayed a peak at 285.2 eV, which corresponds to the C1s-3p/π* transition of C = C in aromatic ring structures and a peak at 288.7 eV which corresponds to the C1s-3p/π* transition of C = O in carboxyl-carbonyl (COOH-COO−) structures in amino acids and small peptides (Fig. 3A) (Stewart-Ornstein et al., 2007; Solomon et al., 2009). Although the exact composition of tryptone and yeast extract is unknown, their C K-edge spectra are consistent with these organic mixtures being produced by enzymatic hydrolysis of large proteins (tryptone) or autolytic digestion of yeast cells (yeast extract), respectively. The C K-edge spectra of minerals precipitated with tryptone and yeast extract were similar to one another and retained a shape similar to these of the original molecules. However, the main peak of the spectra was slightly shifted toward lower energies (288.2–288.3 eV) in comparison to the tryptone and yeast extract spectra (Fig. 3A). The spectral feature at 288.2 eV is from the C1s-3p/π* transition of C = O in the amide bond, as seen in the spectrum of albumin (Fig. 3B). Such an energy shift is commonly attributed to the formation of amide bonds (Stewart-Ornstein et al., 2007). This observation indicates that small peptides and/or amino acids might have undergone polymerization into larger peptides/proteins during the precipitation of iron sulfide minerals. The spectral feature at 285.2 eV is still present in the spectra of minerals and indicates the presence of aromatic amino acids. In addition, the C K-edge spectra of minerals precipitated with tryptone and yeast extract were very similar to the spectra of minerals precipitated with biotic H2S and cells, described hereafter.
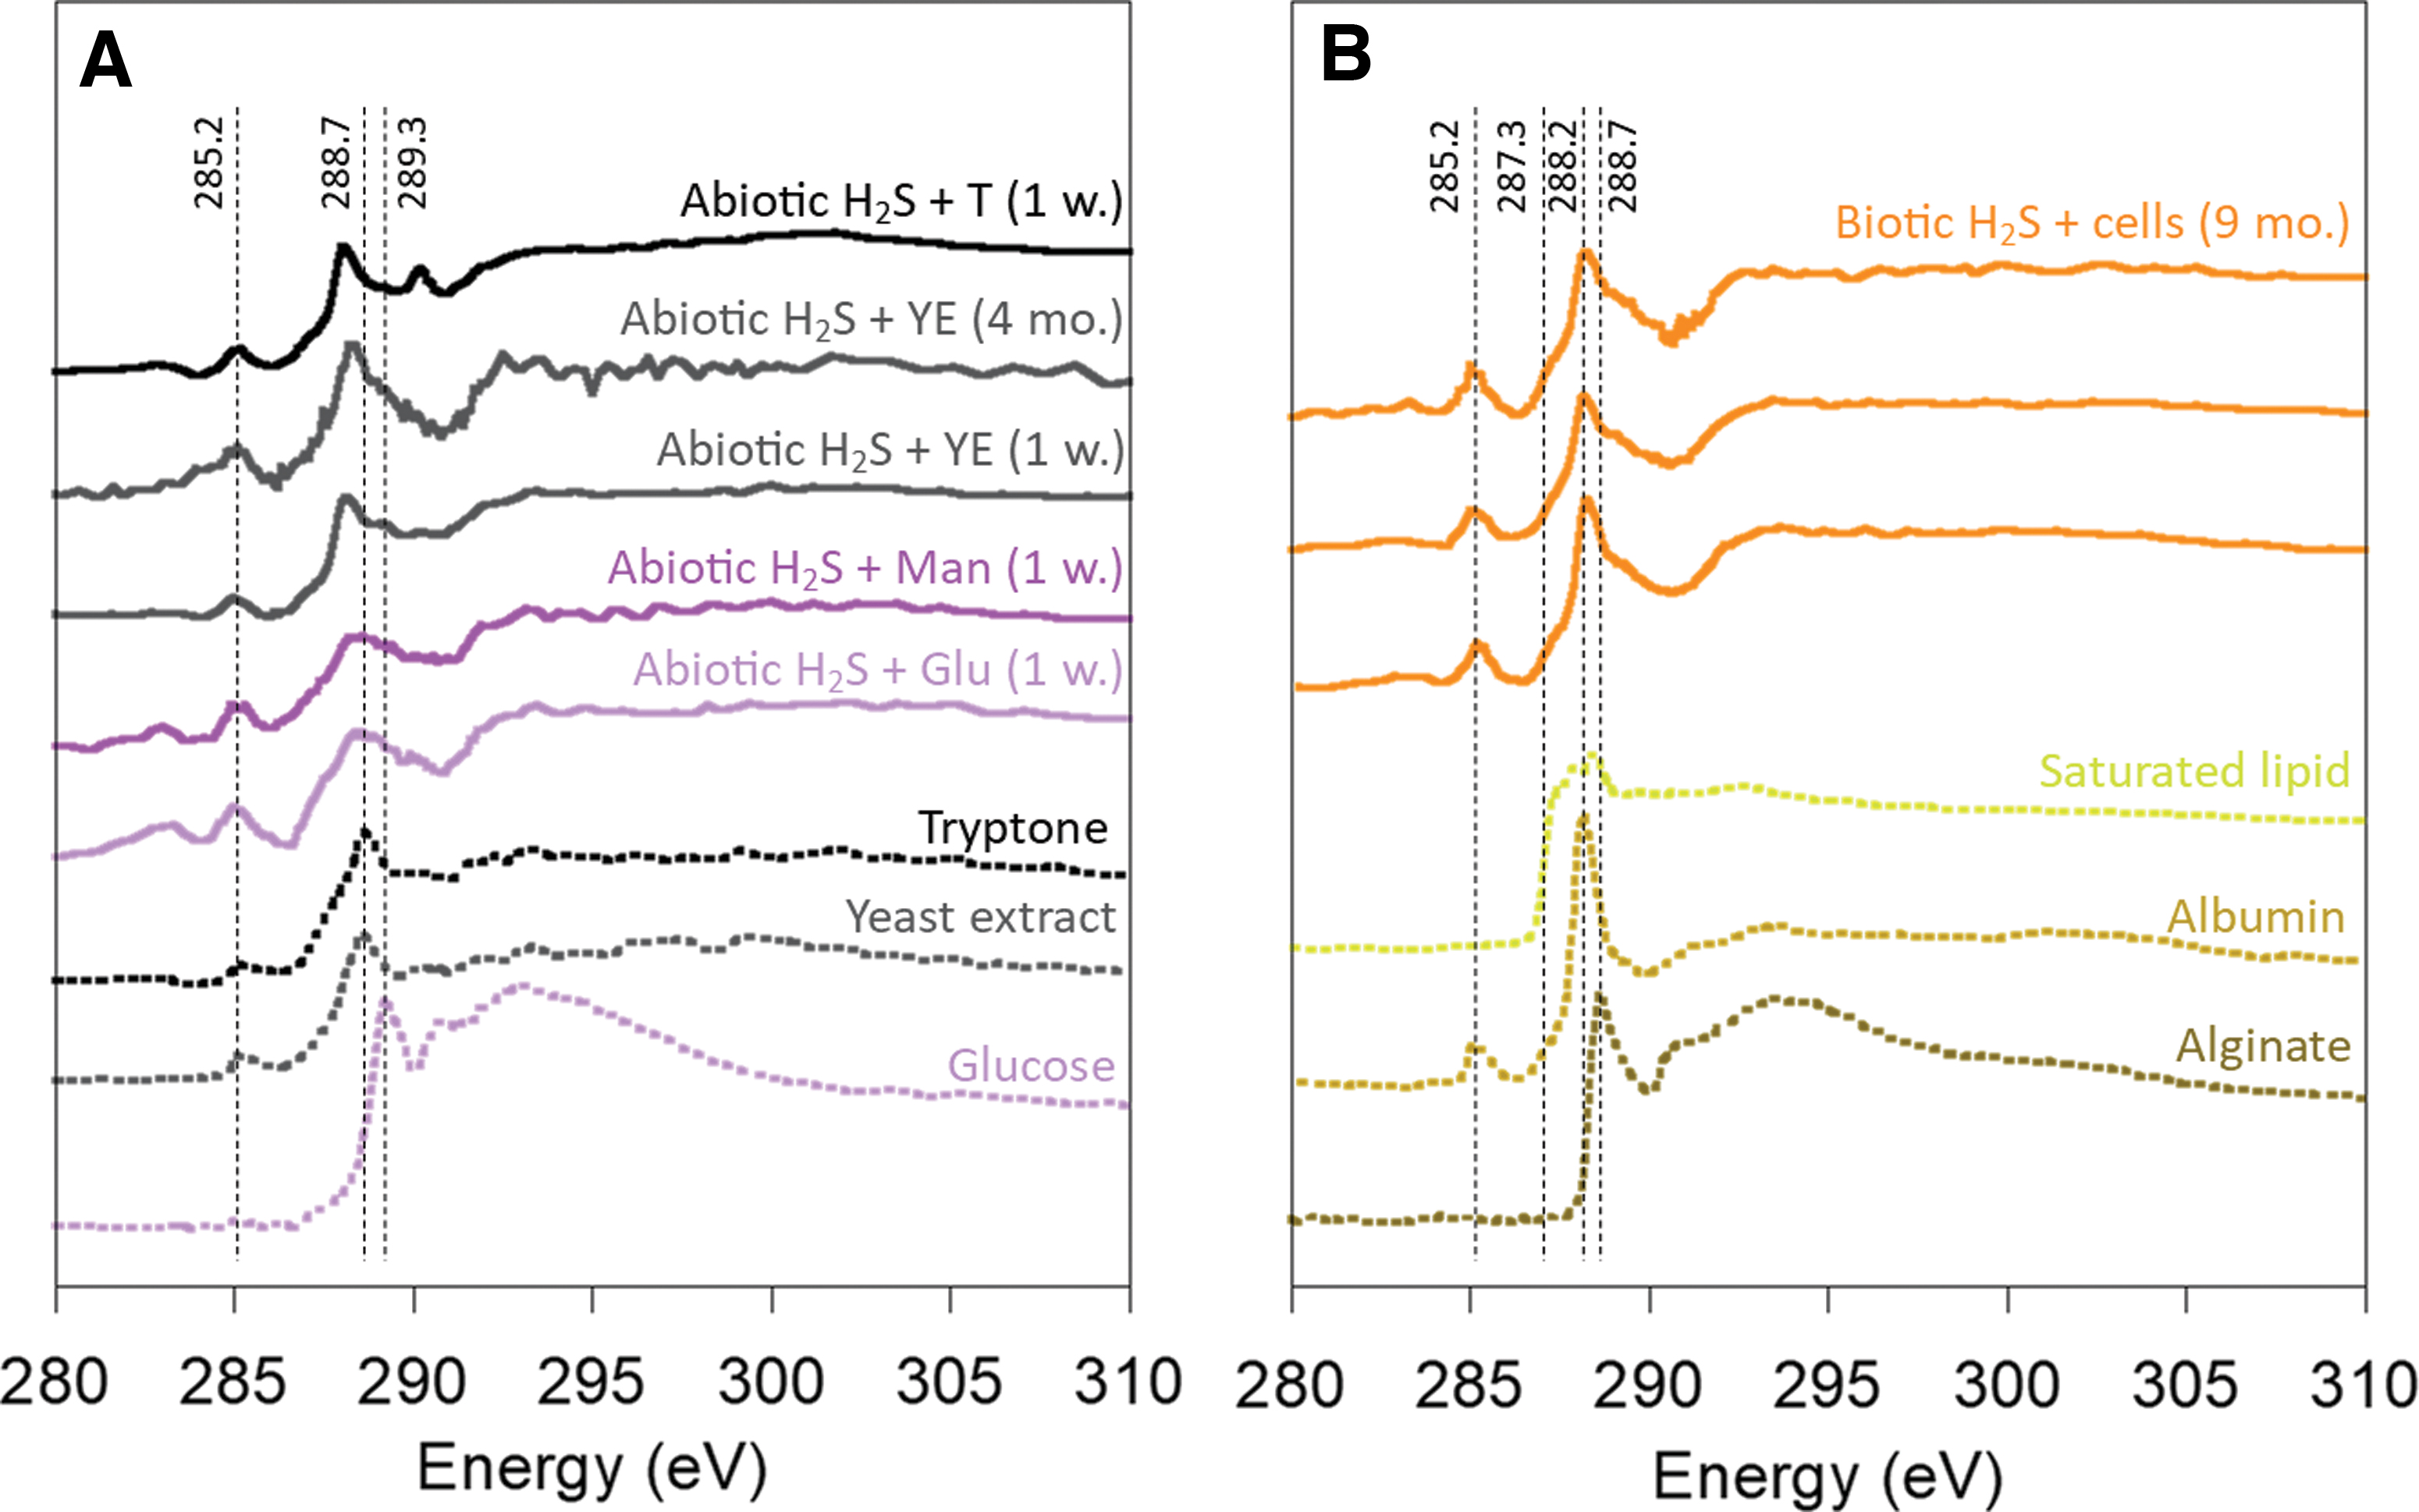
C K-edge NEXAFS spectroscopy analysis of organic carbon in iron sulfide minerals. The main features of standard spectra and their energies (in eV) are represented by dashed lines. The explanation of these features is in the text.
Average C K-edge spectra acquired from three mineral aggregates precipitated with biotic sulfide in the presence of cells (but away from them) are represented in Fig. 3B. Their features were most similar to the C K-edge spectroscopic signature of microbial cells reported in other studies (see, e.g., Miot et al., 2009a; Cosmidis et al., 2015), as well as of iron sulfide minerals precipitated near microbial cells (Picard et al., 2019). The spectra can be deconvoluted into a mixture of spectra of the three main biomolecules composing cells (proteins, polysaccharides, and lipids) (Picard et al., 2019). Indeed, the main features of the spectra of microbial cells are those of proteins (288.2 eV, C1s-3p/π* transition of C = O in the amide bond, and 285.2 eV, C1s-3p/π* transition of C = C in aromatic ring structures), polysaccharides (contribution in the range 288.4–288.7 eV, C1s-3p/π* transition of C = O in -COOH groups), and saturated lipids (shoulder at 287.3 eV, C1s-3p/σ* and C1s-3p/π* Rydberg-like excitations from C-H and in -CH and -CH2 groups). Spectra of albumin, alginate, and saturated lipids are presented in Fig. 3B to illustrate the main spectral features described earlier.
NEXAFS spectroscopy at the O K-edge confirmed that the sample preparation was done in strict anoxic conditions. Features of Fe oxides and oxyhydroxides are clearly visible in O K-edge NEXAFS spectra (Chan et al., 2011; Picard et al., 2016b) and were not observed in our spectra. When used in samples precipitated in the absence of oxygen, spectroscopy at the O K-edge allows the probing of oxygen in functional groups of organic carbon (Picard et al., 2019). The main peak observed at ∼532.1 eV is indicative of the O1s → π* transition of C = O that occurs in functional groups of biomolecules (Fig. 4) (Chan et al., 2011; Picard et al., 2016b). The broader feature at 538–540 eV is assigned to the O1s → σ* transition of C-O in hydroxyl groups (Zubavichus et al., 2005). Although the broad feature is present in the O K-edge spectra of minerals precipitated with glucose and mannose and indicates the presence of some oxygen-containing functional groups, the first feature is absent and the spectra are very noisy. Overall, organic carbon (and therefore associated functional groups) might be present at low concentrations in these minerals, indicating a low affinity of Fe-S minerals with hexoses. These results correlate well with those of NEXAFS spectroscopy at the C K-edge.
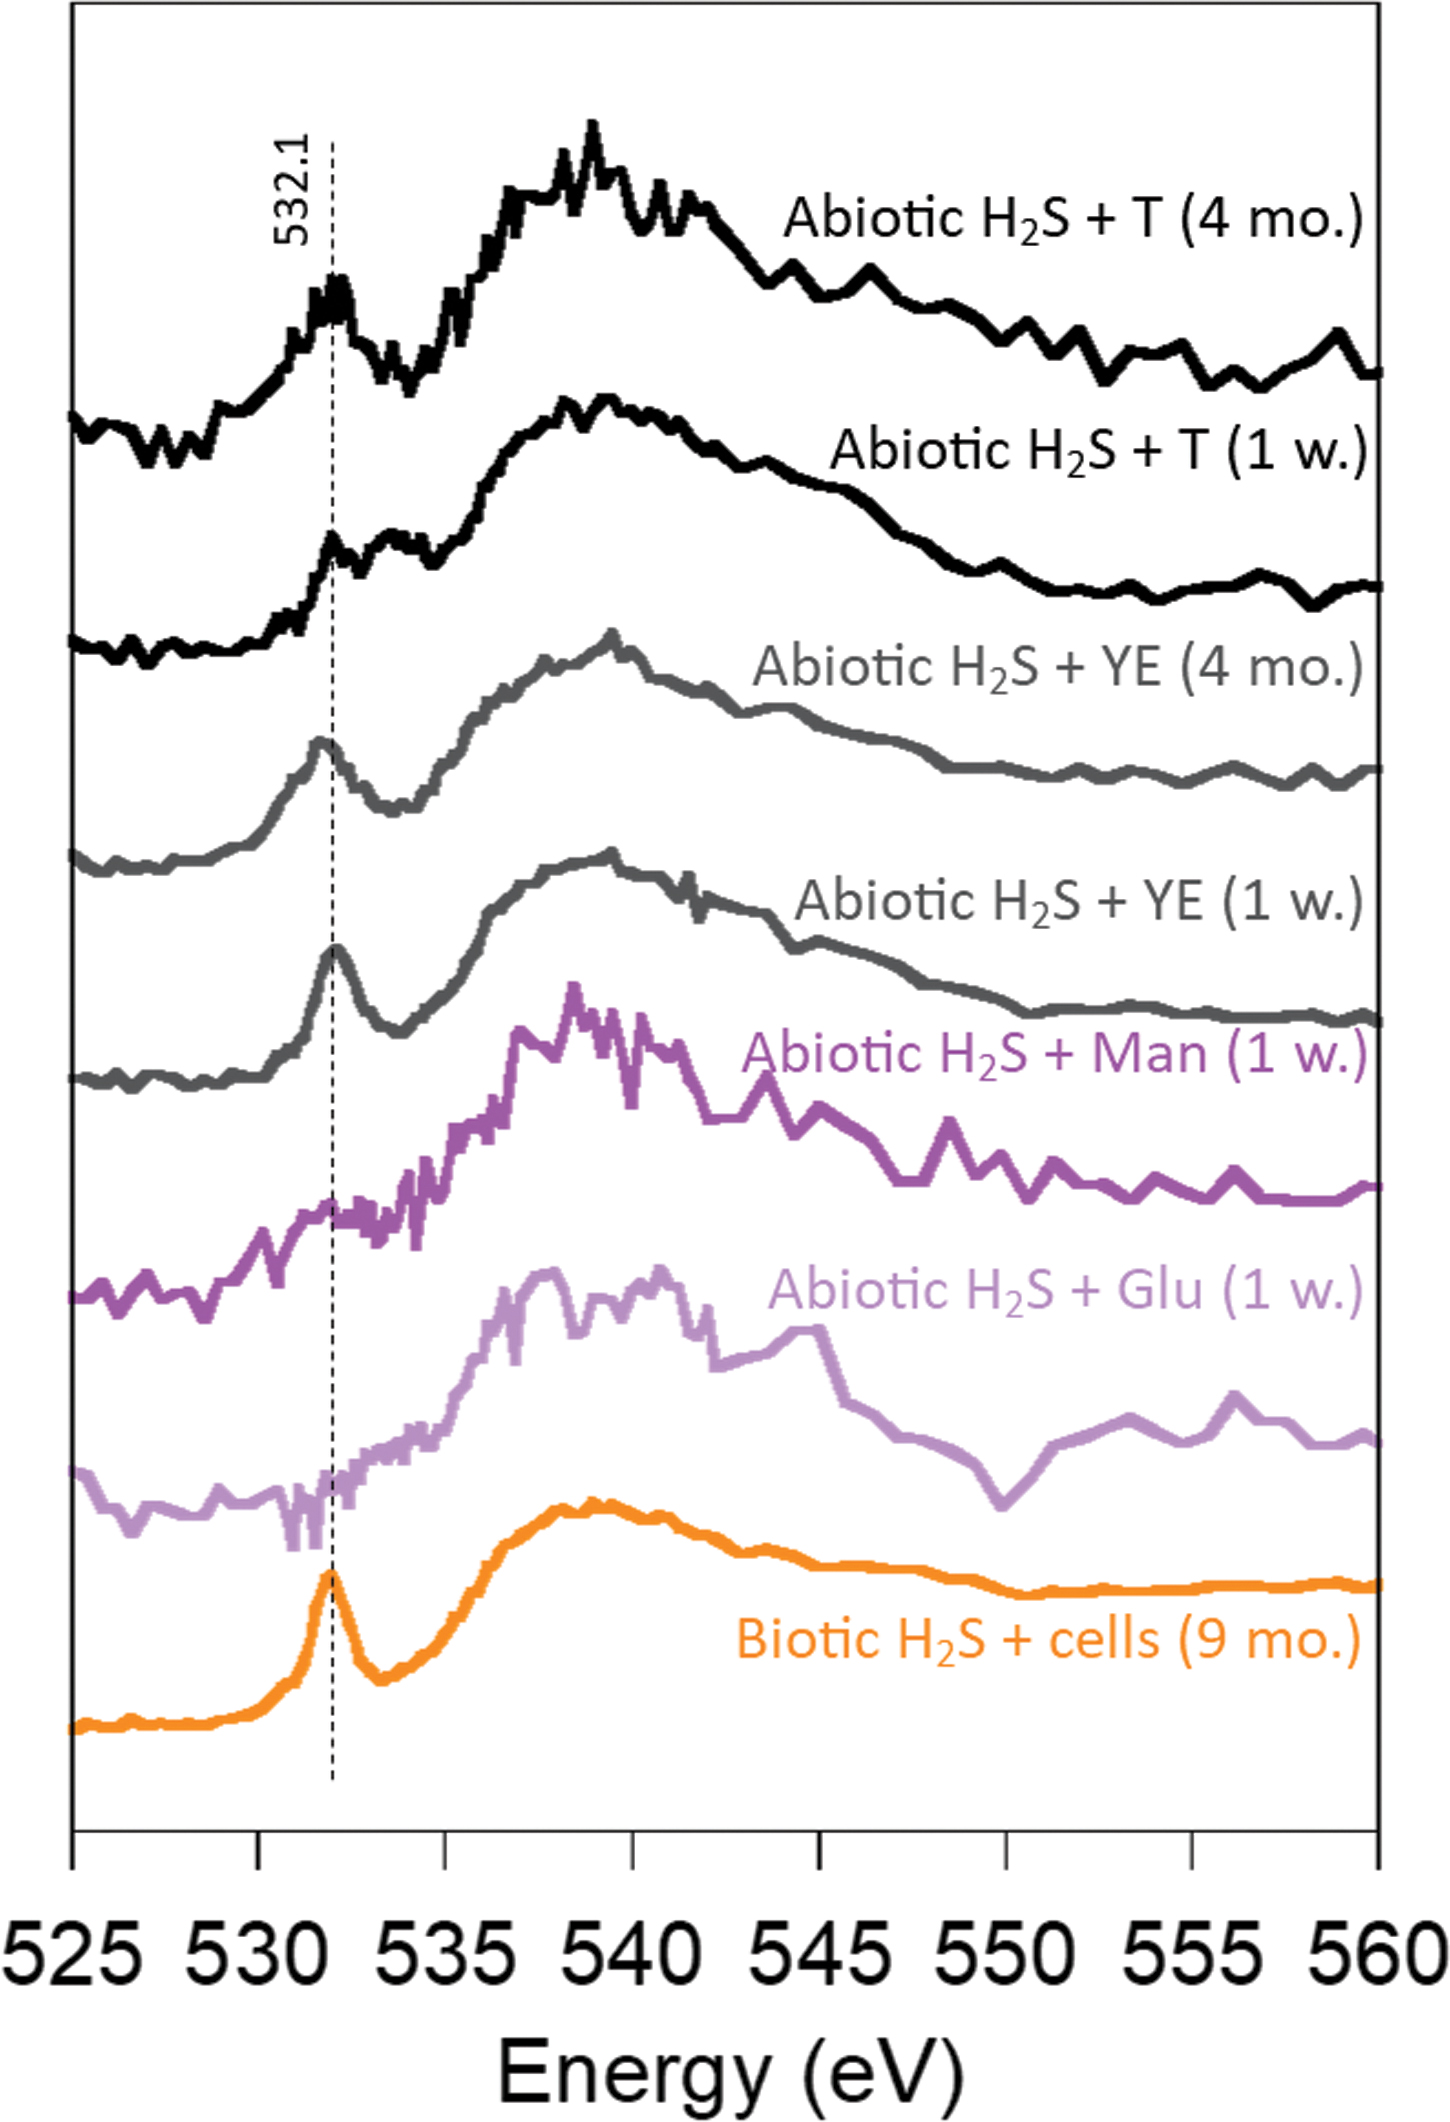
O K-edge NEXAFS spectroscopy analysis of oxygen-containing functional groups in iron sulfide minerals precipitated in the presence of organic molecules (Glu, glucose; Man, mannose; T, tryptone; YE, yeast extract) and precipitated in the presence of biotic sulfide and cells. The dashed line represents the energy in eV of the main feature of the O K-edge spectra of organic molecules. Color images are available online.
3.3. Organic carbon distribution in prebiotic iron sulfide mineral aggregates
STXM revealed that organic carbon (Corg) was homogeneously distributed in prebiotic minerals precipitated with simple and complex organic molecules after 1 week of incubation and after up to several months of incubation (Fig. 5). Not all conditions could be measured at all times because of beamtime availability, but the sampling procedure gives an overview of the general evolution of minerals precipitated in prebiotic conditions. A positive linear correlation between Fe and Corg was observed in prebiotic mineral aggregates (Fig. 5C). The Pearson's correlation coefficient calculated for the prebiotic dataset indicated a decreasing correlation between Fe and C in the following order: Prebiotic tryptone > Prebiotic glucose/mannose >> Prebiotic yeast extract (Table 3). The Pearson's correlation coefficient also decreased as a function of incubation time (Table 3). In the Fe-C scatter plot for minerals precipitated with yeast extract (Fig. 5, 1 week incubation), we observed a deviation of the Corg content to lower levels at high Fe levels (measured in OD units), which could be explained by the thickness of mineral aggregates. When the Fe content is high, mineral aggregates are sometimes too thick for C measurements to be performed reliably. Therefore, in this case, the Corg content in areas of high-Fe contents could have been underestimated.
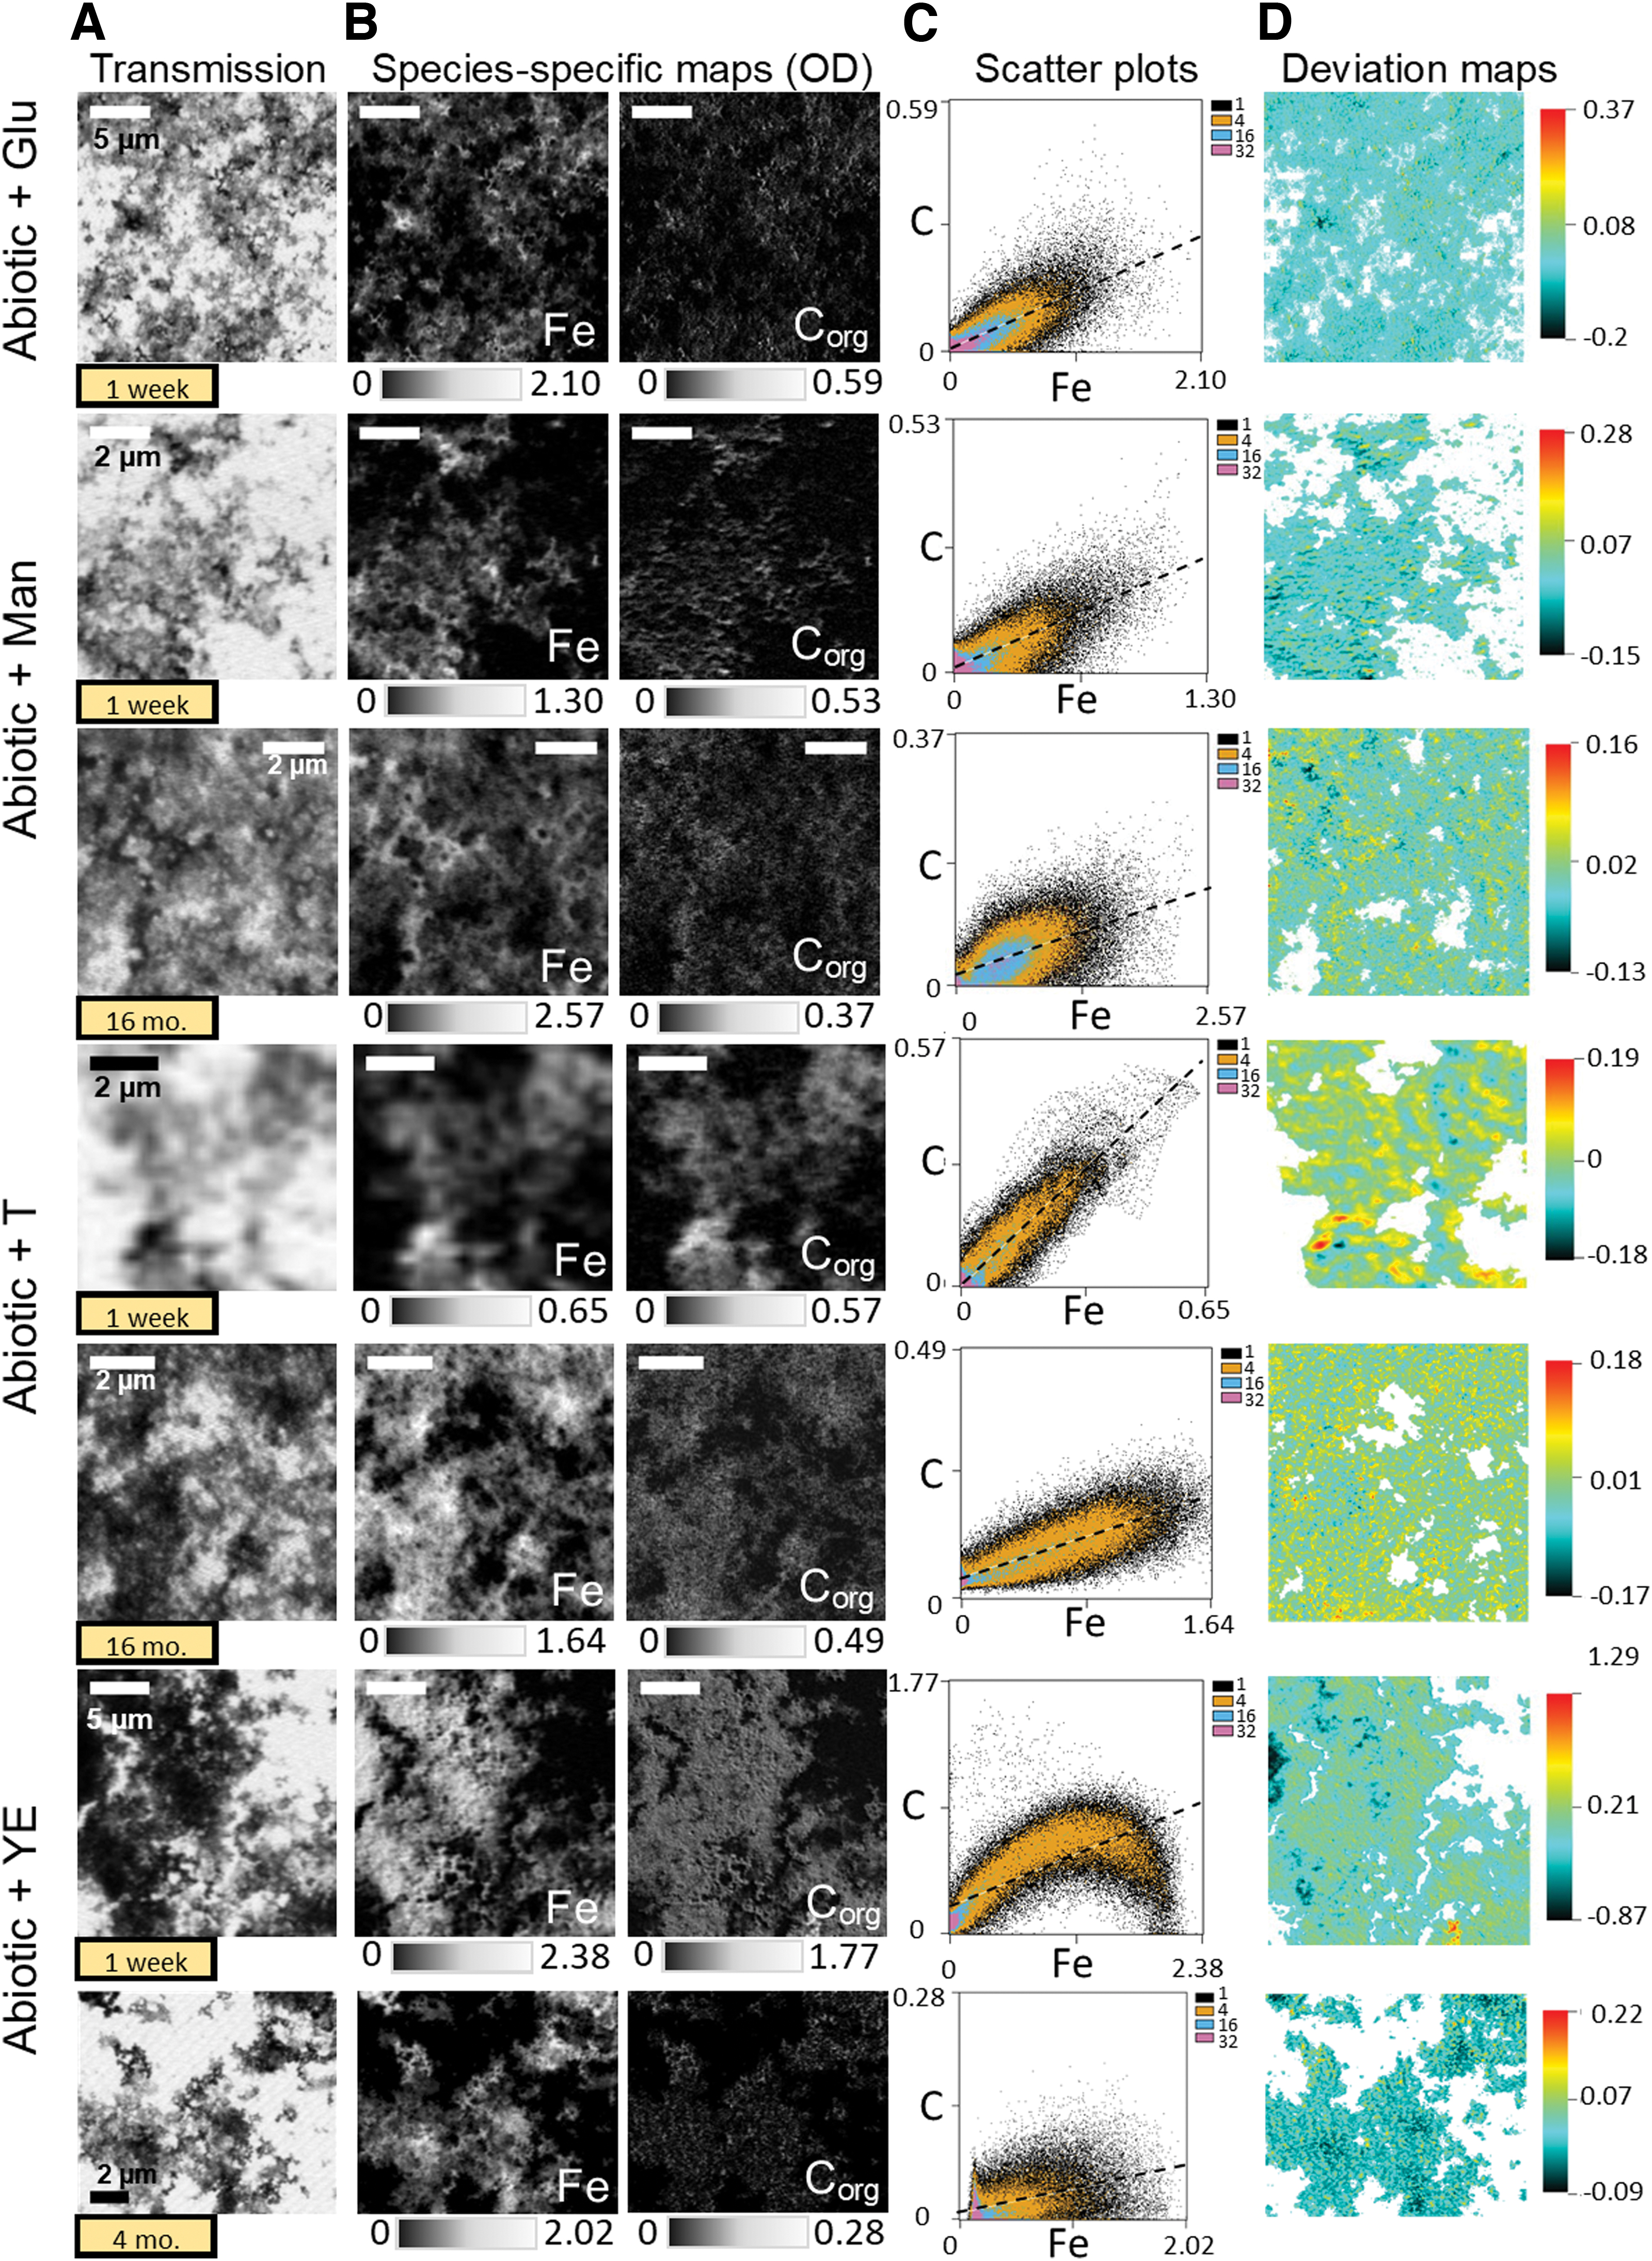
STXM high-resolution imaging of Fe and C in iron sulfide minerals precipitated with glucose (Glu), mannose (Man), tryptone (T), and yeast extract (YE) and incubated at 35°C for up to 16 months.
Analysis of Scanning Transmission X-Ray Microscopy Datasets from This Study and from Picard et al. (2019)#
Maximum and average values of OD were collected from Fe and C maps acquired of the same mineral aggregates. Fe and C thicknesses are estimated from average OD values (see Section 2).
# indicates that the dataset is from Picard et al. 2019.
OD, optical density.
3.4. Filamentous structures in prebiotic iron sulfide minerals
Filamentous structures were observed at a high resolution in STXM images of minerals precipitated with organic molecules (Fig. 6). Most observations occurred in minerals precipitated in the presence of glucose and yeast extract, although some hook-like structures were also observed in minerals precipitated in the presence of mannose (See Fe map of 16-month mineral aggregate in Fig. 5). The structures contained organic material (as evidenced by maps of Corg and/or O) (Fig. 6). Those structures were not observed in SEM images, probably because mineral aggregates were more diluted and dispersed in samples prepared for STXM than for SEM.
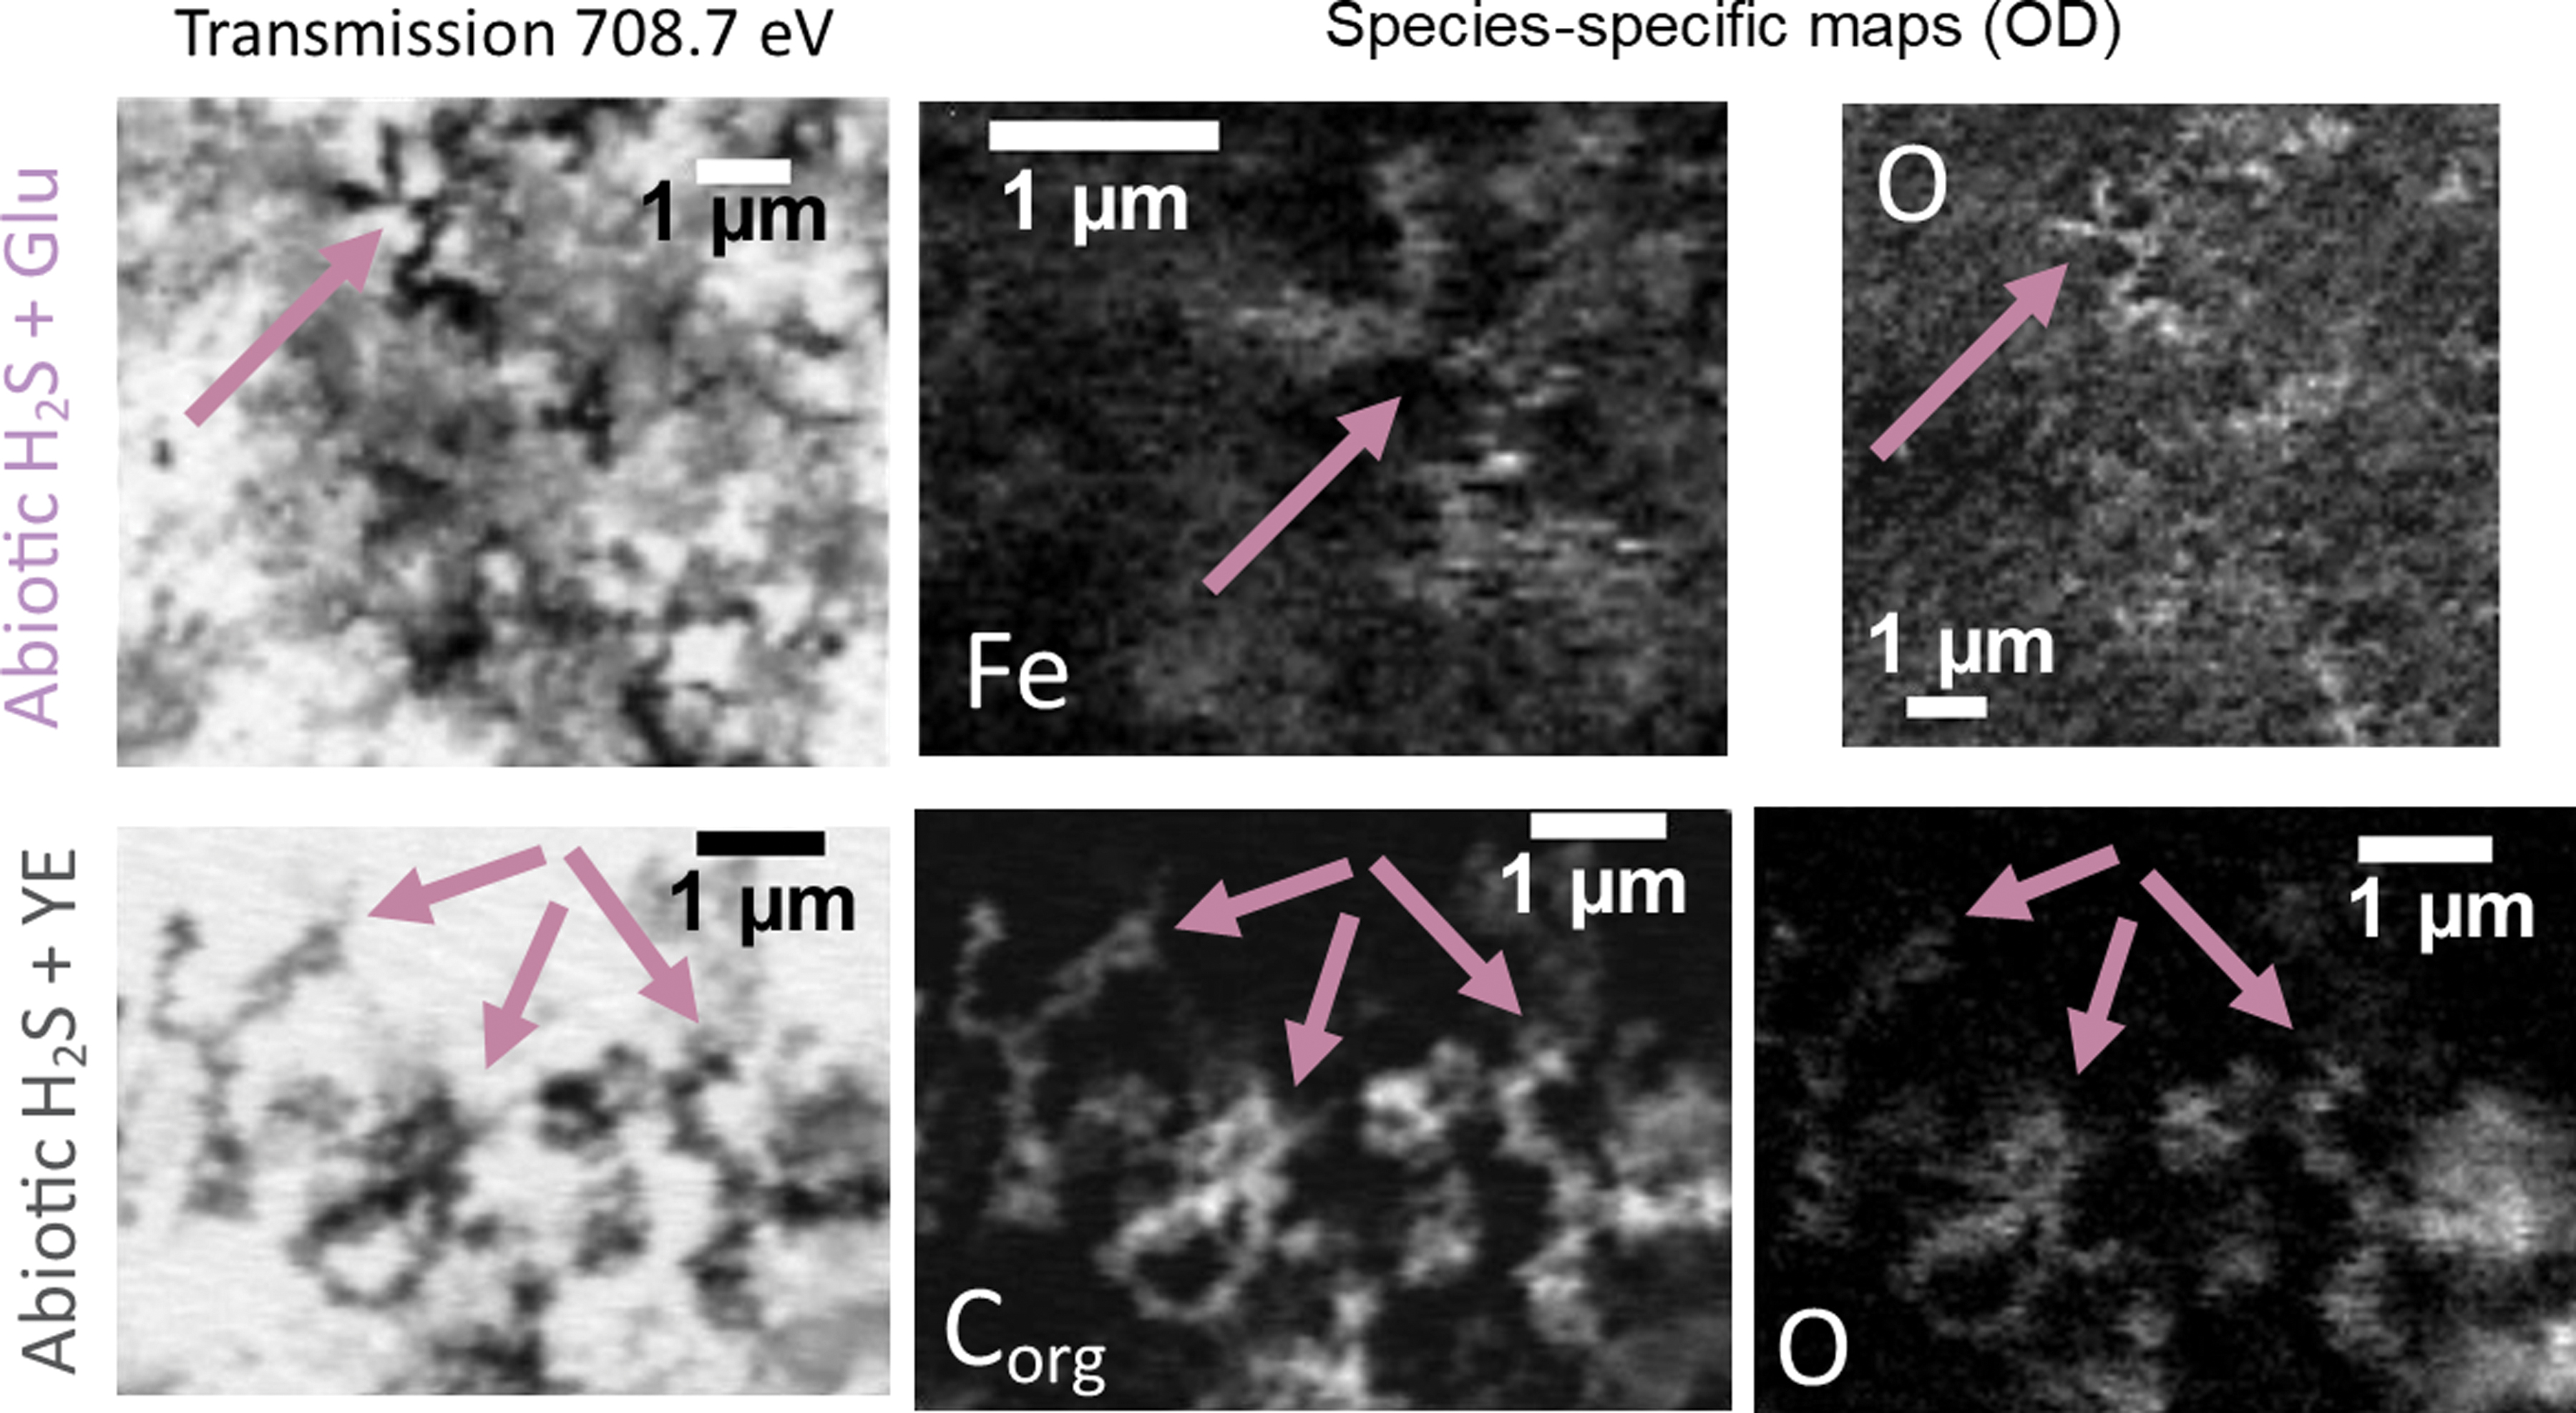
STXM transmission and OD maps of minerals precipitated in the presence of glucose and yeast extract (after 1 week of incubation at 35°C). Ambiguous filamentous structures are indicated by arrows. The first column represents transmission images at 708.7 eV; the other images are either Fe, C or O maps, as indicated. Color images are available online.
3.5. Organic carbon distribution in biotic iron sulfide minerals
In comparison to prebiotic minerals, mineral aggregates precipitated with biotic sulfide in the presence of cells displayed a more heterogeneous Corg distribution (Fig. 7A). Corg was distributed throughout the minerals, which is shown by a clear relationship between Fe and C levels in the scatterplots. However, features with high organic carbon content with the shape and the size of microbial cells could be observed in mineral aggregates (pointed by arrows in Corg maps in Fig. 7A). This is indicated in the scatterplot by a cloud of data points with high C and low Fe deviating from the major axis regression line (Fig. 7A). The distribution of O from oxygen-containing functional groups was closely linked to that of Corg (Fig. 7B), as indicated by a Pearson's correlation coefficient of 0.95464. C K-edge and O K-edge spectra were extracted from the hot spots in the C and O maps and compared with those of extracellular regions in the maps (Fig. 7C). The C K-edge and O K-edge spectra of hot spots displayed an increase in intensity of the main peak at 288.2 and 532.1 eV, respectively, in comparison to the spectra of extracellular material.
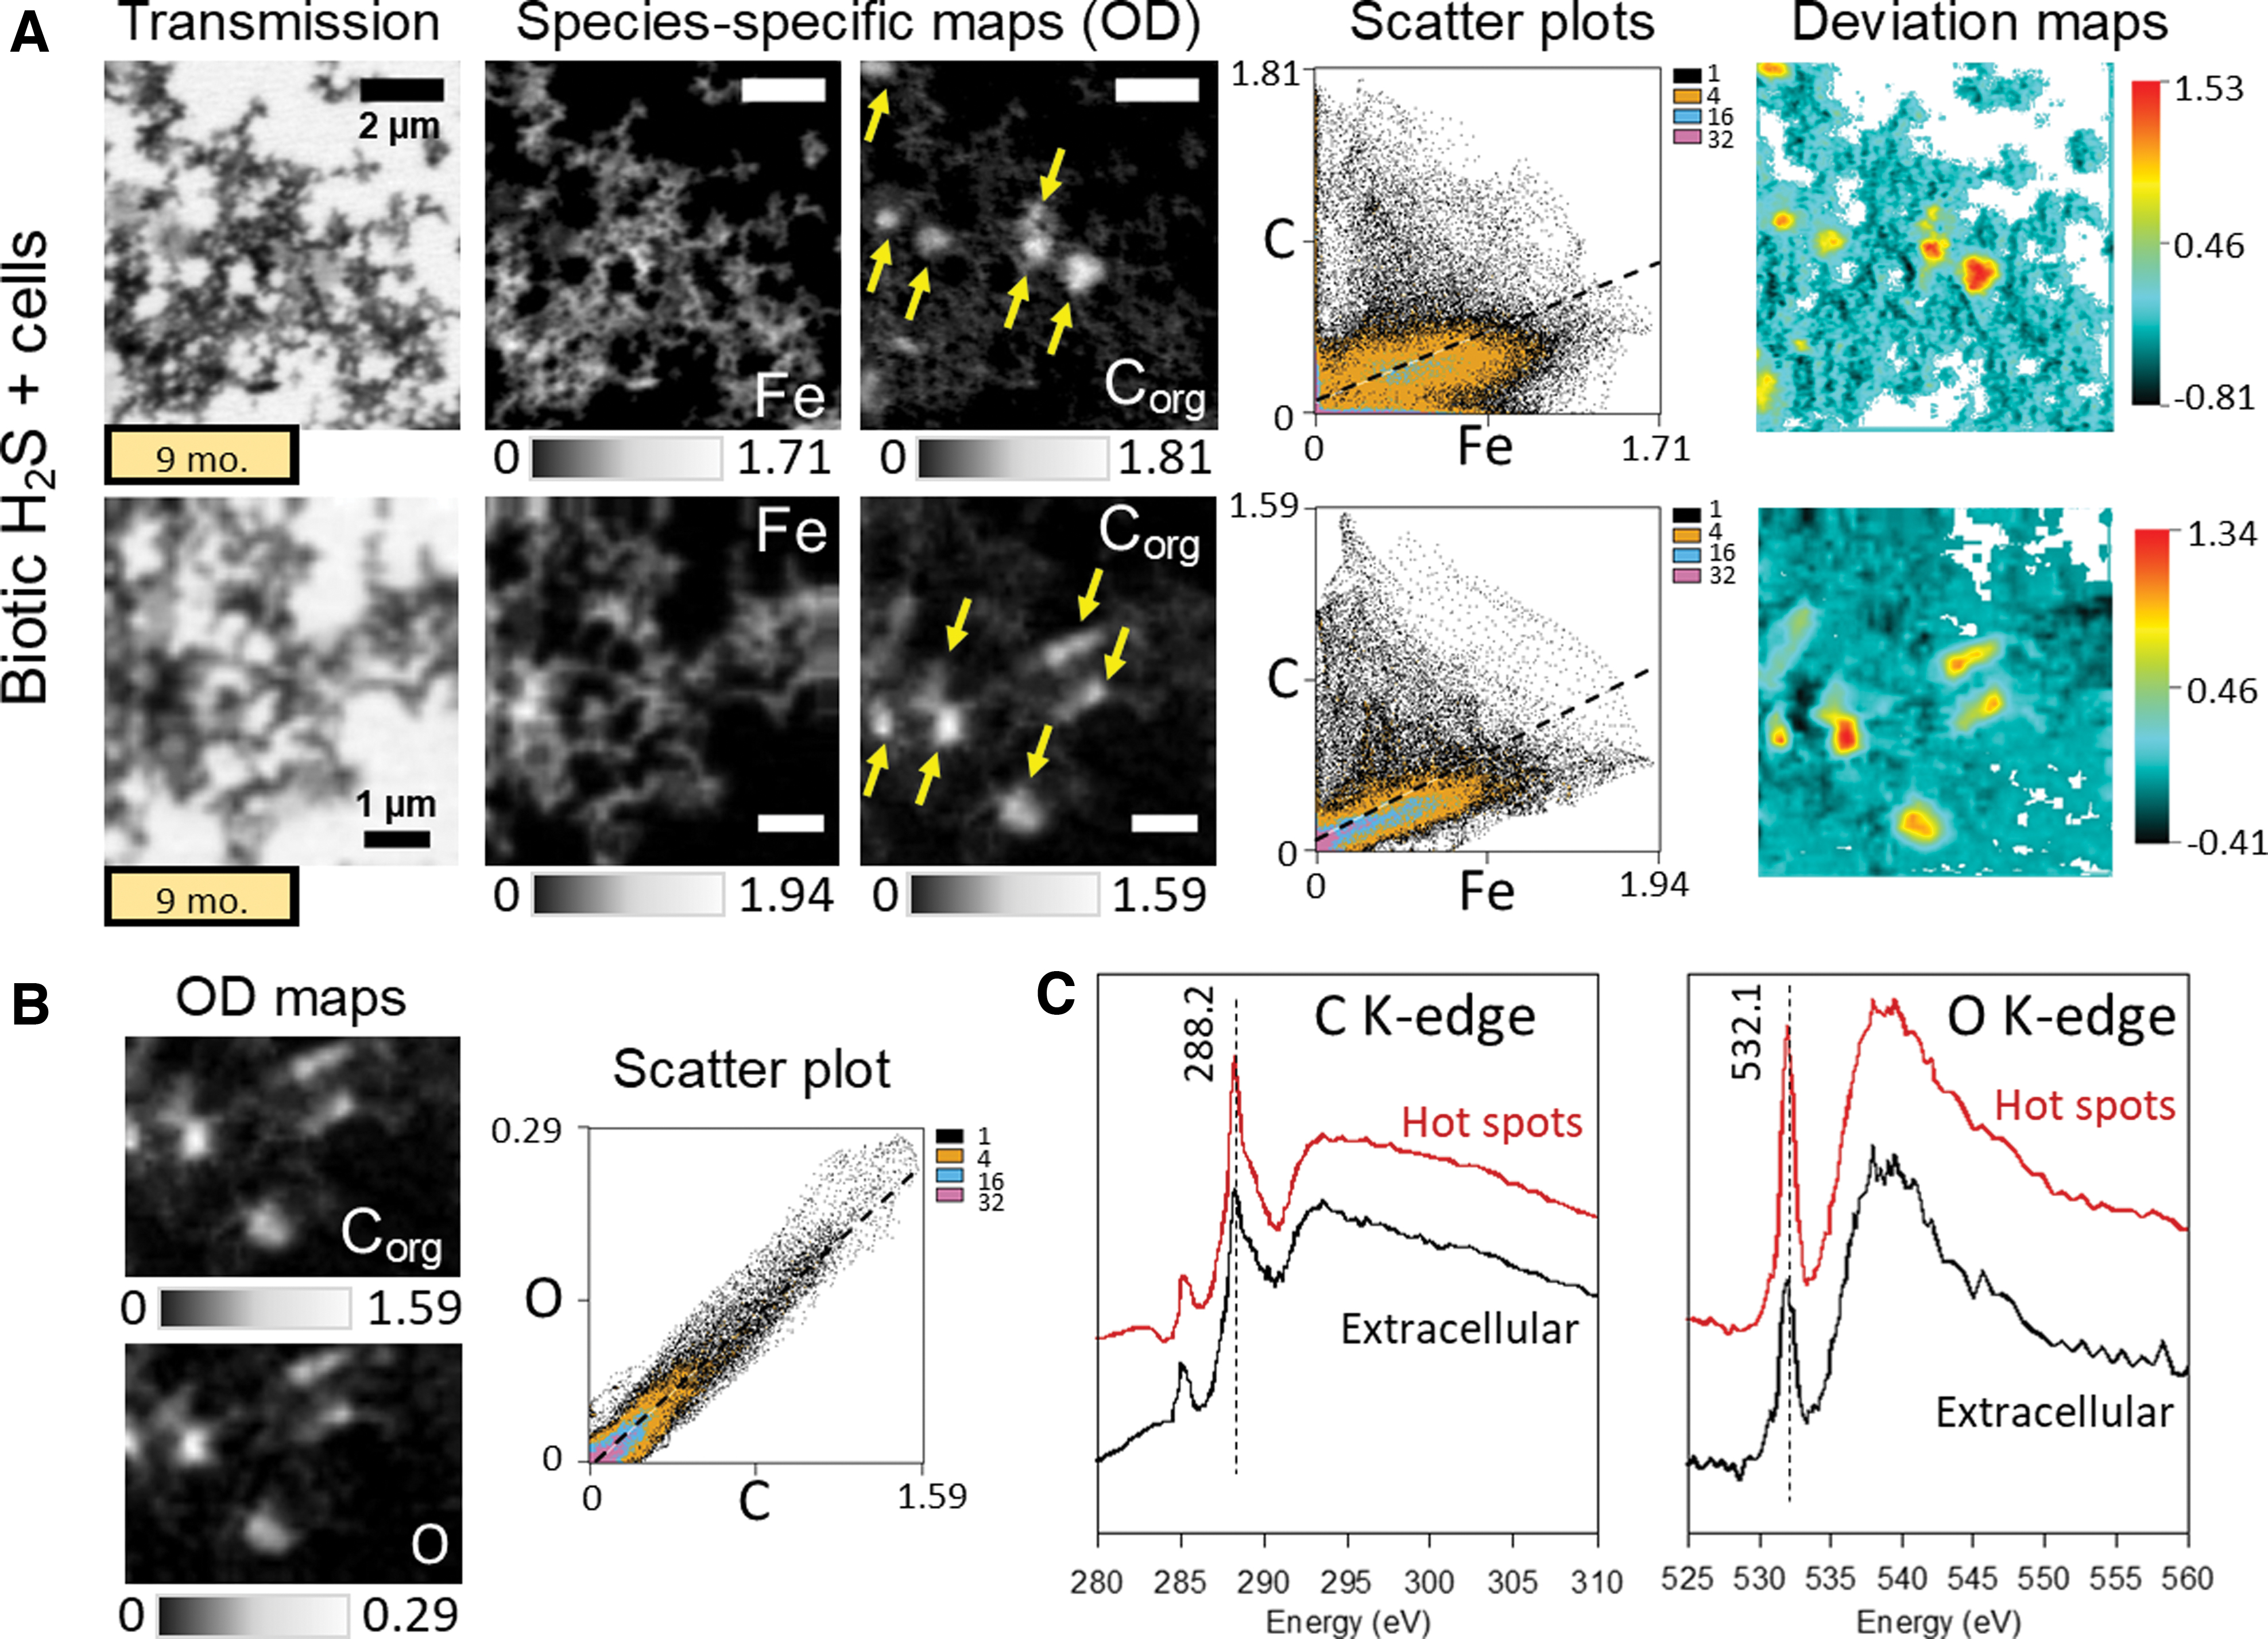
STXM analysis of iron sulfide minerals precipitated with biotic H2S away from cells and incubated for 9 months at 35°C.
3.6. Affinity of iron sulfide minerals for organic molecules
The evolution of the affinity of iron sulfide minerals for Corg was evaluated as a function of incubation time (Fig. 8). The C/Fe ratios in mineral aggregates were calculated by using thicknesses of Fe and C in solid phases estimated from STXM data (Table 3). We also estimated thickness ratios in iron sulfide minerals precipitated in other biotic conditions by using the STXM dataset from the work of Picard et al. (2019). All experiments had an excess of C to Fe in the solution, as indicated by C/Fe molar ratios >1; however, prebiotic experiments had C/Fe molar ratios roughly eight to fifteen times higher than biotic experiments (Table 1). Overall, the C/Fe thickness ratios in mineral aggregates decreased with increasing incubation times in all experimental conditions (Fig. 8). The sharpest decrease in C/Fe thickness ratios was observed in prebiotic minerals precipitated with yeast extract and tryptone. Although the exponential decay curve predicts the C/Fe thickness ratio in minerals precipitated with yeast extract to reach zero, it is more likely that the C/Fe thickness ratios in those minerals will reach levels similar to this measured in minerals precipitated with tryptone. The C/Fe thickness ratios decreased at a similar rate in minerals precipitated with mannose and in minerals from biotic experiments. After 3 months of incubation, C/Fe thickness ratios were always higher in all biotic experiments than in prebiotic experiments. Although we do not have decrease rates for C/Fe thickness ratios of minerals precipitated with glucose and minerals precipitated away from cells [biotic experiments to which Fe(II) was added], the data available fall in the range of minerals with mannose, and minerals from other biotic experiments, respectively. Overall, iron sulfide minerals appear to have a strong affinity with organic molecules from microbial biomass, and interactions between Fe-S minerals and these microbial organic molecules seem more stable over time than interactions occurring in prebiotic conditions.
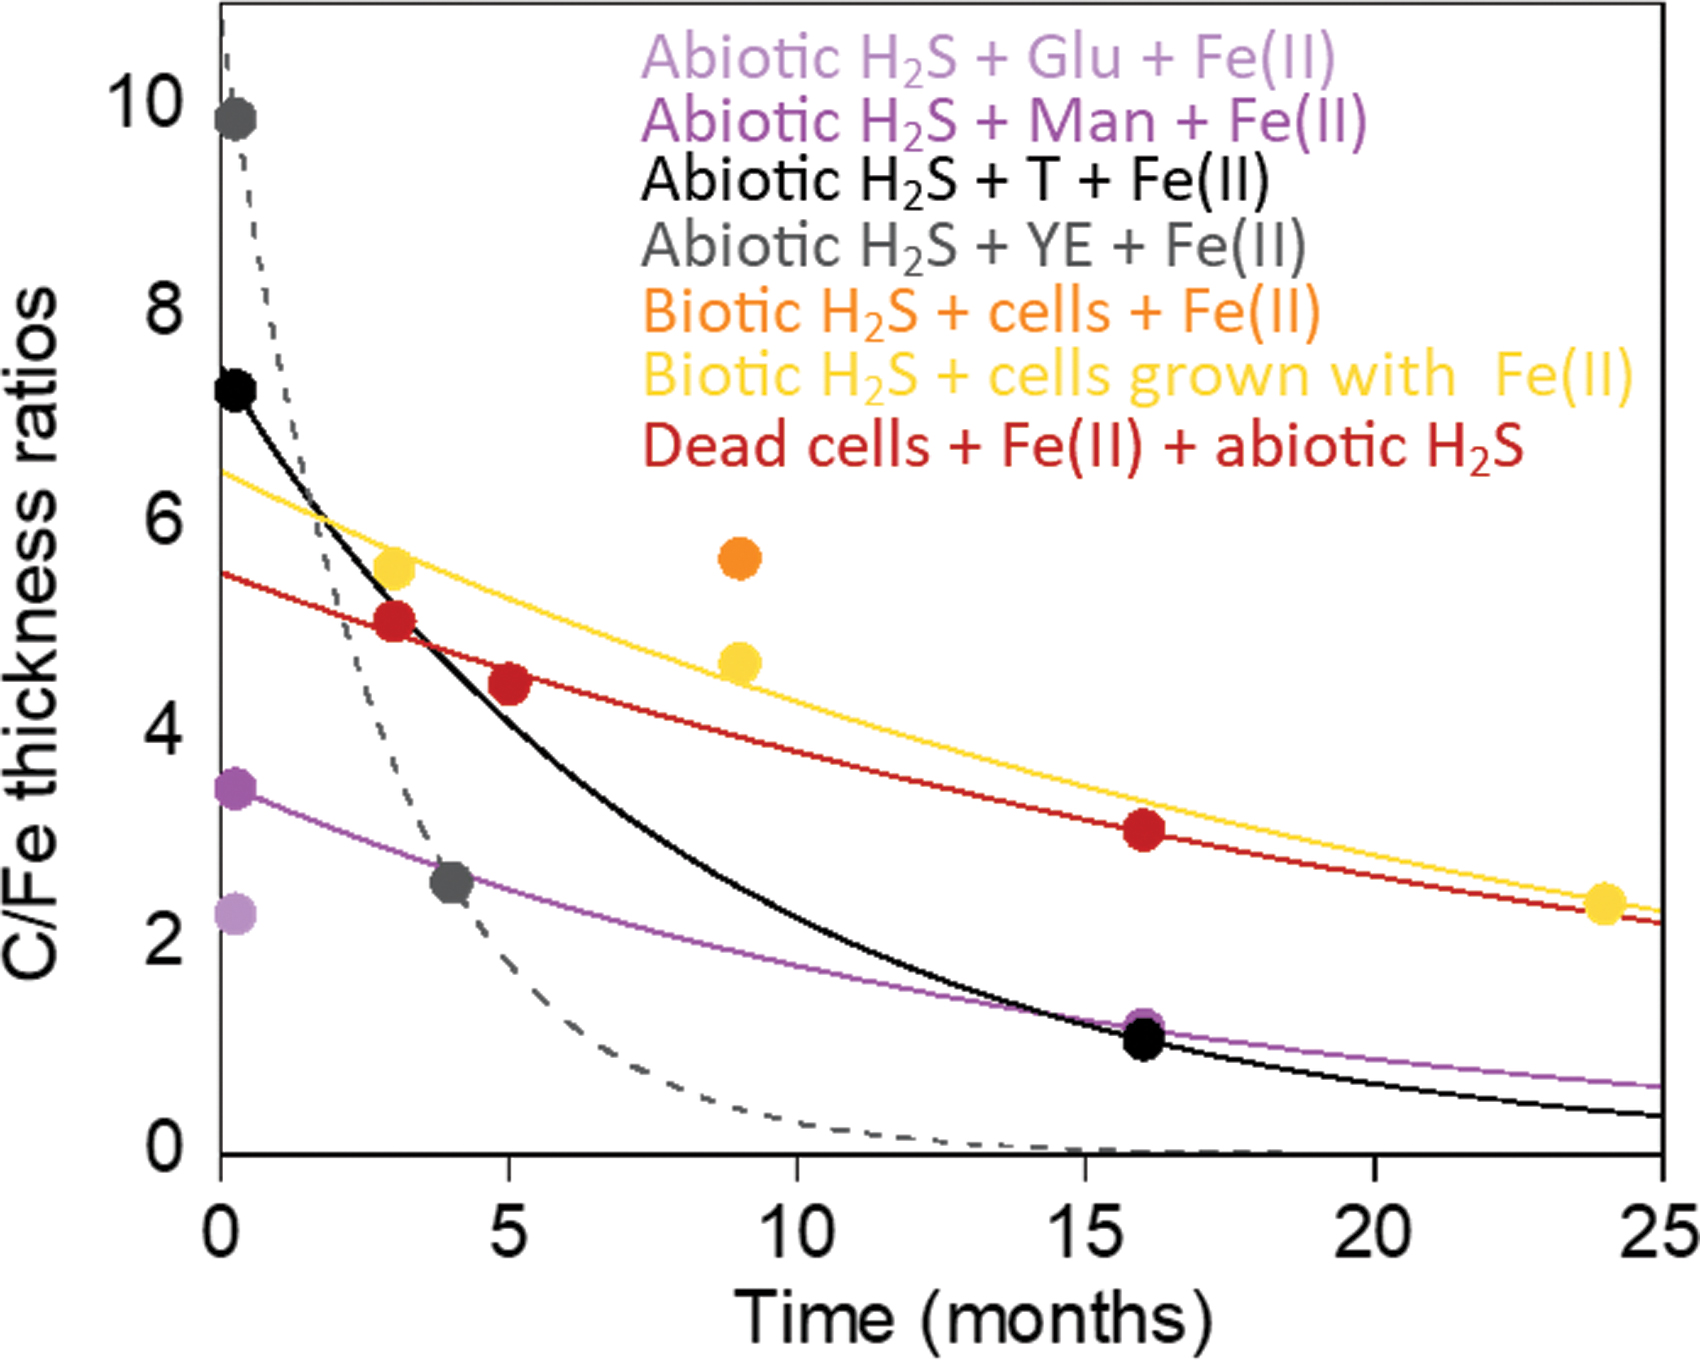
Average C/Fe thickness ratios in mineral aggregates plotted as a function of time. C/Fe thickness ratios were calculated by using average OD values extracted from OD maps (Table 3). When several datasets are available for one time point, the average C/Fe thickness ratio is represented. Exponential decay curves were used to fit data, except for minerals precipitated with glucose and minerals precipitated away from cells [Biotic H2S+cells+Fe(II)], for which only one time point is available. C/Fe thickness ratios in mineral aggregates decrease as a function of time. C/Fe thickness ratios appear to be more stable in mineral aggregates precipitated in biotic conditions (with live or dead cells) than in mineral aggregates precipitated in prebiotic conditions. Color images are available online.
4. Discussion
The success of astrobiological research hinges strongly on our ability to look for both extinct and extant life. The upcoming NASA Mars2020 and ESA ExoMars missions are prioritizing life detection and include instruments that will characterize organic molecules in the subsurface of Mars and help determining whether these could constitute the building blocks of martian life or record past microbial activity (Vago et al., 2017; Williford et al., 2018). Minerals have the potential to preserve organic carbon for geologic timescales (Hemingway et al., 2019). A number of their properties—for example, mineralogy, morphology, particle size, aggregation pattern, organic carbon content and composition, and isotopic signatures—can be characterized at various spatial resolutions to determine whether living organisms influenced their formation (Banfield et al., 2001; Hays et al., 2017; Benzerara et al., 2019). With their biosignature suite, minerals therefore represent a promising target for the search of life on Mars. In this work, we used an experimental approach to constrain the formation pathways of organo-mineral interactions of interest for the search of life in the Mars subsurface.
If life has evolved on Mars, it would likely be microbial. In prokaryotes, there are only a few examples of well-controlled mineralization that produce intracellular minerals: for example, magnetite and greigite in magnetotactic bacteria (Lefevre and Bazylinski, 2013; Posfai et al., 2013), elemental sulfur globules in sulfide-oxidizing bacteria (Maki, 2013), and Ca-carbonate minerals in Cyanobacteria (Benzerara et al., 2014). As such, most prokaryotic influence on mineral formation occurs extracellularly as a result of their metabolic activity, as well as by providing cell surfaces and exopolymers as templates for mineralization (so-called biologically influenced mineralization) (Beveridge, 1989; Benzerara et al., 2019). Where oxygen prevails on Earth, iron-oxidizing microorganisms confer unique morphologies and composition to extracellular Fe(III)-oxyhydroxides, preserving unique signatures of microbial activity under low oxygen concentrations (Chan et al., 2011; Krepski et al., 2013). Early life on Earth evolved in the absence of oxygen; therefore, if life evolved on Mars, it would very likely be anaerobic (Westall et al., 2013). In this work, we focused on the potential for minerals produced in anoxic environments to preserve signatures of microbial life.
On Earth, iron sulfide minerals precipitate in anoxic sedimentary environments where iron is available and the organic carbon supply is high enough to fuel microbial sulfate reduction (Berner, 1970, 1984; Rickard et al., 2017). In these environments, SRM produce most of the sulfide that is required to precipitate iron sulfide minerals. Recent studies have demonstrated that the influence of SRM on the formation of metastable iron sulfide minerals (e.g., mackinawite FeS and greigite Fe3S4) goes beyond providing sulfide (Picard et al., 2016a, 2018, 2019; Stanley and Southam, 2018; Mansor et al., 2019). However, the biological influence is more complex than it seems. The availability of microbial cell surfaces for the nucleation and growth of iron sulfide minerals appears to be the main driver in determining particle size of iron sulfide minerals. In conditions that promote the formation of mackinawite (FeS) (summarized in Fig. 9), minerals precipitated in the presence of live and dead cells of the bacterium D. hydrothermalis have a larger particle size and aggregate more than minerals precipitated in abiotic conditions (Picard et al., 2018). In these experiments, cells are in contact with Fe(II) in the medium before the production of sulfide starts. Live and dead cells, therefore, serve as templates for the nucleation of mackinawite and promote its growth. In the process, live and dead cells also become encrusted in iron sulfide minerals (Picard et al., 2018). A larger mackinawite particle size was also observed in the presence of live cells of the bacterium Desulfovibrio vulgaris than in abiotic conditions; however, the magnitude of size difference was not as large as in our study (Mansor et al., 2019). On the contrary, when Fe(II) is added in experiments after sulfide has been produced by live cells, the increase in particle size and aggregation does not occur, and cells do not become encrusted. Iron sulfide mineral precipitation is very rapid when Fe(II) and sulfide come in contact with one another and there is no possibility for Fe(II) to bind to cells (Picard et al., 2018). In the current study, we showed that the particle size of mackinawite precipitated in the presence of simple and complex organic molecules is in the range of abiotic minerals and minerals precipitated away from cells (Table 2).
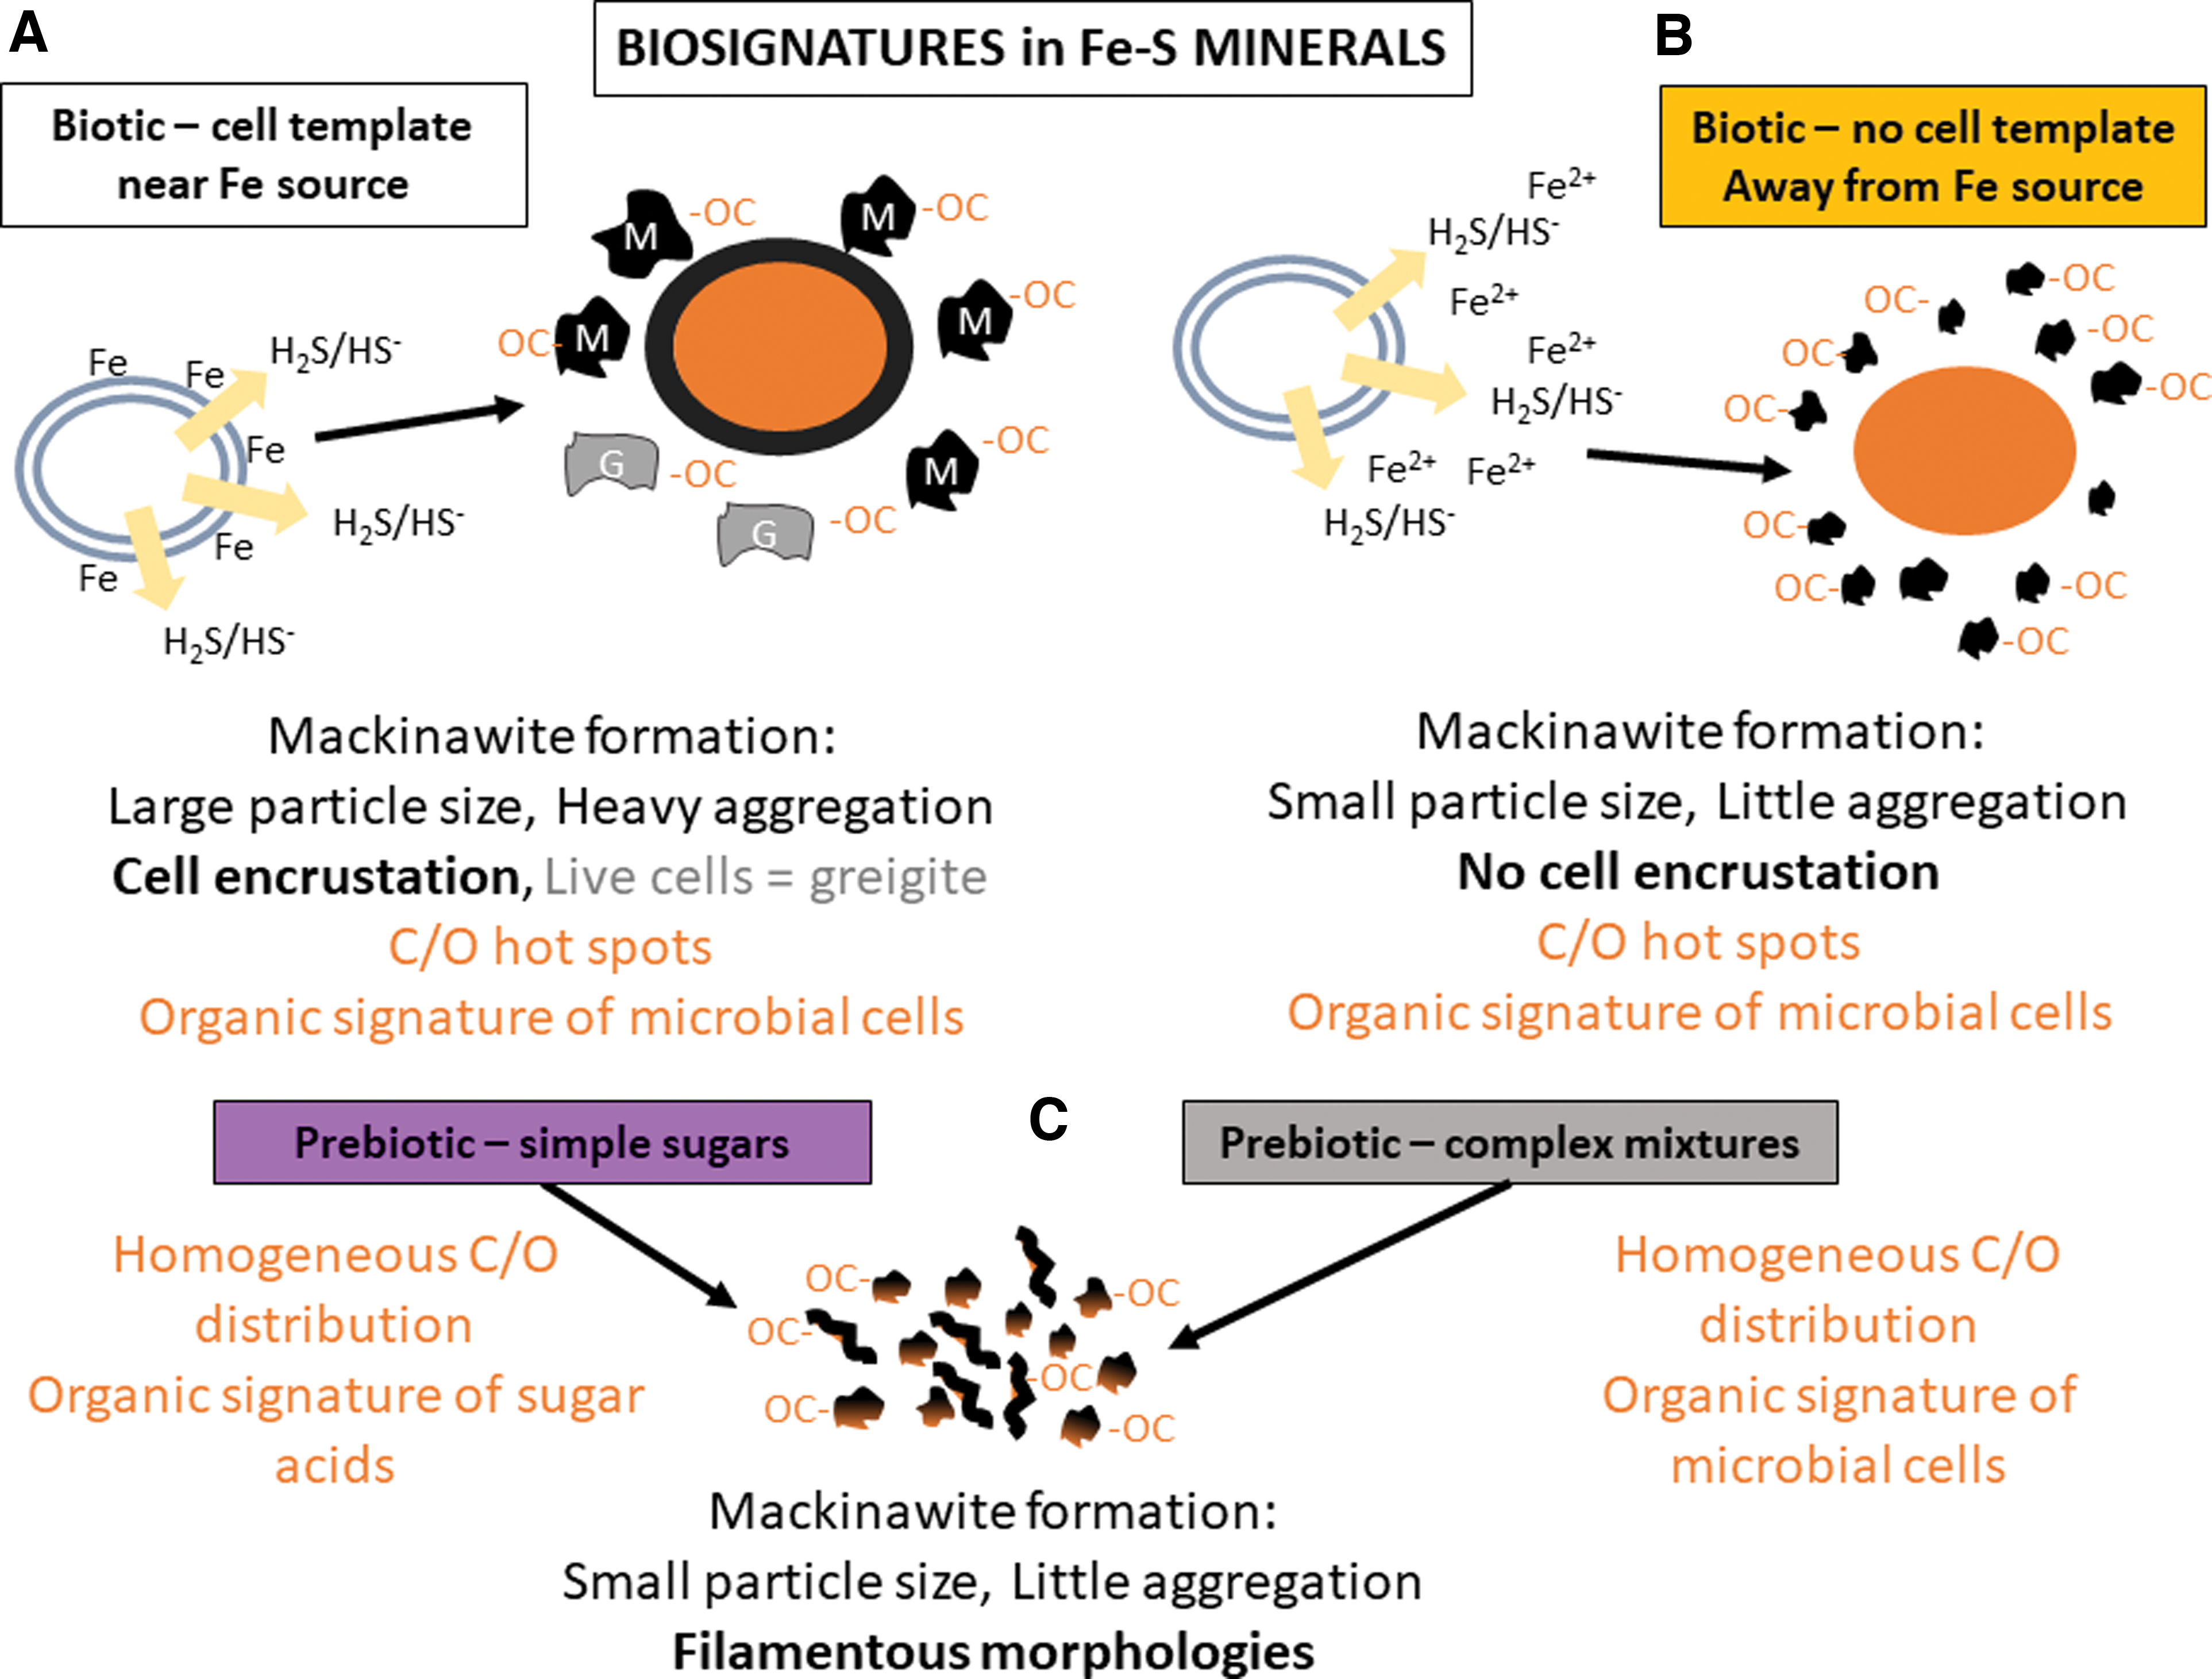
Schematic diagram of biosignatures that can be preserved in iron sulfide minerals. This is based on data collected for
Mineral aggregation and texture reflect particle size in iron sulfide minerals. In SEM images, mackinawite precipitated in abiotic, prebiotic, and biotic (with minerals away from cells) appears fine-textured, whereas mackinawite/greigite precipitated near live cells appears bulky and aggregated (Fig. 1B) (Picard et al., 2018). The surface of microbial cells that become encrusted in iron sulfide minerals appears similar to that of non-encrusted cells when observed with SEM (Picard et al., 2018). Although crusts can be detected around cells when using STXM (Picard et al., 2019), the detailed study of cell encrustation in iron sulfide minerals requires delicate preparation and ultramicrotomy to perform transmission electron microscopy (Picard et al., 2018). Prebiotic conditions promote the formation of iron sulfide minerals with thin filamentous aggregated morphologies, which could potentially be mistaken for extracellular appendages that some microorganisms produce (Figs. 5 and 6). For example, Miot et al. (2009b) reported extracellular filaments of similar size in cultures of Fe(II)-oxidizing bacteria (Miot et al., 2009b). In our study, abiotic filamentous structures could be observed with STXM but not with SEM, which might be due to the way samples are prepared. In the STXM preparation, mineral suspensions are much more diluted, which can influence aggregation. One has to be cautious when interpreting the origin of organo-mineral structures based solely on the morphology. A variety of biomorphic and ambiguous organo-minerals structures have been shown to form as a result of abiotic sulfide oxidation in the presence of organic molecules (Cosmidis and Templeton, 2016; Cosmidis et al., 2019). Nanoparticle aggregation occurs in a variety of abiotic organic and inorganic systems (Lin et al., 1989). Oriented aggregation can lead to the formation of various morphologies, including the ones observed in this study (Penn and Soltis, 2014). In the biomedical field, the use of proteins or peptides is an established procedure to control the morphology of nanoparticle aggregates (Yang et al., 2017). The morphology of nanoparticle aggregates is controlled by the mechanisms of aggregation, which can be varied by changing pH or ionic strength in solution, or by drying nanoparticles (Gilbert et al., 2009). Indeed, the morphology of mackinawite nanoparticle aggregates can be controlled by changing temperature (Lai and Chen, 2009) or pH (Matamoros-Veloza et al., 2018b). In our experiments, we could observe abiotic filamentous morphologies in the presence of glucose and yeast extract, and abiotic hook-like structures in the presence of mannose. Experimental conditions were kept stable during incubations (pH and temperature); however, sample preparation included washing and drying minerals, which also influence aggregation. What exactly controls the morphology of the iron sulfide filaments in our study is unknown, and in situ studies would be required to explore the aggregation mechanisms of iron sulfide minerals at simulated prebiotic conditions.
Although scaffolding is important for the physical properties of minerals, microbial activity appears to drive mineral transformations. However, only live encrusted cells promote the transformation of mackinawite to greigite (Fig. 9) (Picard et al., 2018). A transformation of mackinawite to greigite happens after 5–6 months in cultures where live cells are grown with Fe(II) (Picard et al., 2018; Mansor et al., 2019). In contrast, in the presence of dead cells, in experiments where Fe(II) is added to fully grown cultures, in simulated prebiotic conditions, and in abiotic conditions, mackinawite remains stable (Picard et al., 2018).
Minerals precipitated with live and dead cells in the conditions that promote encrustation and mineral growth incorporate organic molecules derived from microbial biomass. Interactions between microbes and minerals were shown to last for at least 2 years (Picard et al., 2019). The current study follows up on these observations and reports the associations between organic molecules and minerals precipitated at simulated prebiotic conditions (Fig. 5), as well as between microbial biomass and minerals precipitated in conditions that do not promote encrustation and mineral growth (Fig. 7). In all these conditions, the chemistry and distribution of Fe and S appears homogeneous, based on NEXAFS spectroscopy at the Fe L-edge and S L-edge (Fig. 2) (Picard et al., 2019). On the contrary, the chemistry and distribution of C and O appear as important factors to help distinguishing between prebiotic and biotic conditions. While C was distributed homogeneously in prebiotic minerals (Fig. 5), hot spots of C appear in mineral aggregates that were precipitated with live and dead cells (whether conditions promoted encrustation or not) (Fig. 7) (Picard et al., 2019). Interestingly, differences were observed between autoclaved cells and gamma-irradiated cells (Picard et al., 2019). Although in both cases, cells were preserved (as indicated by the presence of hot spots), the correlation between Fe and C in minerals precipitated with autoclaved cells was much stronger than with gamma-irradiated cells and the Fe-C scatter plot of autoclaved cells resembled that of prebiotic minerals (Picard et al., 2019). This could be explained by the release of intracellular material and lysis of many cells during autoclaving. We assume that, in natural environments, dead cells would mostly remain intact, similarly to gamma-irradiated cells, and that the distribution of C in mineral aggregates containing dead cells would preserve cell shape and size. The distribution of O (from O-containing functional groups) shadowed the distribution of C (Fig. 7). In 1-week incubations in prebiotic conditions, iron sulfide minerals displayed more affinity to proteinaceous material (tryptone and yeast extract) than for simple sugars (as indicated by lower C/Fe thickness ratios in the latter case) (Table 3 and Fig. 8), although the concentration of simple sugars in solution was higher than this of complex molecules. This could be explained by the different functional groups available in organic molecules to bind to minerals. Chemical bonds between N-atoms in amine groups and Fe-atoms in mackinawite and pyrite seem to play an important role for the interactions between oligonucleotides and iron sulfides minerals (Plekan et al., 2007; Hatton and Rickard, 2008; Mateo-Martí et al., 2008), and between methylamine and iron sulfide minerals (Dzade et al., 2013). Similarly, in biogenic zinc sulfide aggregates, proteins have been found to be the binding component between nanoparticles (Moreau et al., 2007). After 16 months of incubation, C/Fe thickness ratios in prebiotic mineral aggregates precipitated with mannose and tryptone reached the same level. The C/Fe thickness ratios in mineral aggregates decreased as a function of time in all experimental conditions; however, they remained twice as high in biotic minerals than in prebiotic minerals after >1 year of incubation (Fig. 8 and Table 3), despite higher C/Fe molar ratios in prebiotic experiments than in biotic experiments. This indicates that biotic conditions produce more stable organo-mineral aggregates than prebiotic conditions. Also, C/Fe thickness ratios are in the same range in all experiments that contain cells (live or dead). It should be noted that C concentrations in our experiments were higher than natural dissolved organic carbon (DOC) concentrations in sediments, which can vary greatly (Burdige and Komada, 2015). However, DOC concentrations in anoxic marine sediments of organic-rich coastal areas, where iron sulfide minerals precipitate, can peak up to 10 mM (Alperin et al., 1994). Similarly, in organic-rich sediments of Guaymas Basin, dissolved organic concentration can reach up to 8.8 mM (Zhuang et al., 2019). The decrease in C/Fe thickness ratios in iron sulfide minerals over time points toward a loss of organic carbon originally contained in the mineral structure and/or bound to the surface of minerals. The release of organic carbon in the medium could happen due to weakening interactions between organic molecules and minerals, which would imply either changes in the structure of the minerals and/or changes in the physical properties of the mineral surface. Neither spectroscopy nor XRD data indicate obvious changes in the chemistry of prebiotic or biotic minerals as a function of time, which could explain the decrease in C/Fe thickness ratios of minerals. The crystallinity or particle size did not significantly change as a function of time in minerals (Picard et al., 2018). Analytical methods such as X-ray absorption spectroscopy at the Fe K-edge and S K-edge, as well as surface characterization methods such as X-ray photoelectron spectroscopy, could help determine the binding mechanisms between organic molecules and Fe-S minerals and explain the carbon loss over time.
Shifts in the spectroscopic signatures of organic carbon associated with prebiotic minerals were observed (Fig. 3), suggesting potential changes in the composition of organic molecules during iron sulfide mineral precipitation. We observed the apparent formation of sugar acids from hexoses in one case (simple prebiotic conditions), whereas a potential polymerization of peptides and/or amino acids produced large peptides/proteins in the other case (complex prebiotic conditions). It has been proposed that pyrite could have played a role in the emergence of life, with pyrite forming thin layers similar to membranes and playing a catalytic role in the formations of early organic molecules (Russell et al., 1993, 1994; Mielke et al., 2011; White et al., 2015). In the formation of mackinawite in abiotic systems, a highly reactive nanoparticulate solid-phase precursor has been identified (Matamoros-Veloza et al., 2018a). Based on these results, the catalytic power of metastable iron sulfide minerals should be further explored.
5. Conclusions
Microbial sulfate reduction is an ancient metabolism on Earth that has been proposed to be a candidate metabolism for early life on Mars. Given the proposed abundance of iron sulfides in the subsurface of Mars, our results suggest that, if microbial life evolved on Mars, iron sulfides could potentially retain a suite of biosignatures. Therefore, understanding the formation of iron sulfide minerals in laboratory experiments is essential to constrain potential biosignatures that could be expected in the Mars subsurface. Overall, the organo-iron-sulfide-mineral system is complex. However, we have identified parameters that would help identify whether microbial life was involved in the precipitation of iron sulfide minerals (Fig. 9). Although some parameters could be remotely assessed (mineralogy and particle size using XRD, bulk elemental composition, bulk isotopic composition), high-resolution analyses would be required to fully characterize the biosignature suite contained in iron sulfide minerals. Morphology and texture analysis using several types of microscopy would help distinguish cell-like elements from abiotic structures, and elemental analysis and speciation at high resolution would help identify C/O hotspots associated with preserved cells. Bulk and high-resolution isotopic analysis of S and C would complement these measurements, as both these elements would record the metabolic activity of SRM (Kaplan and Rittenberg, 1964; Canfield, 2001; Londry and Des Marais, 2003; Londry et al., 2004). Additional high-resolution analyses would include trace metal analysis that could potentially be sequestered by cells and/or by iron sulfide minerals (Large et al., 2014; Glass et al., 2018; Gregory et al., 2019). All these parameters would increase the chances of correctly identifying the precipitation pathways of iron sulfide minerals (Westall et al., 2015; Hays et al., 2017; Neveu et al., 2018). Proving that life existed on another planet is the biggest challenge in astrobiology; however, biominerals in the subsurface appear as a promising target for the search of life on Mars.
Footnotes
Acknowledgments
This work was performed in part at the CNS, a member of the National Nanotechnology Coordinated Infrustructure Network (NNCI). CNS is part of Harvard University. The authors thank Shao-Liang Zheng for support at the X-ray laboratory of the Department of Chemistry and Chemical Biology, Harvard University. This research used resources of the Advanced Light Source, which is a DOE Office of Science User Facility under contract no. DE-AC02-05CH11231. The STXM measurements were also performed at the Canadian Light Source, which is supported by the Canada Foundation for Innovation, Natural Sciences and Engineering Research Council of Canada, the University of Saskatchewan, the Government of Saskatchewan, Western Economic Diversification Canada, the National Research Council Canada, and the Canadian Institutes of Health Research. The authors thank the staff of beamlines and analytical facilities for their support. A.P. would like to thank Caroline Peacock, Julie Cosmidis and Besty Swanner for inspiring discussions.
Author Disclosure Statement
No competing financial interests exist.
Funding Information
This work was supported by the National Science Foundation under Grant Numbers NSF-1344241 and NSF-1542506, as well as by NASA under grant numbers 80NSSC19K1427 and 80NSSC18K1140 awarded to P.R.G. This work benefited from the support of a Deep Energy award to A.P. from the Deep Carbon Observatory.
Supplementary Material
Supplementary Table S1
Abbreviations Used
References
Supplementary Material
Please find the following supplemental material available below.
For Open Access articles published under a Creative Commons License, all supplemental material carries the same license as the article it is associated with.
For non-Open Access articles published, all supplemental material carries a non-exclusive license, and permission requests for re-use of supplemental material or any part of supplemental material shall be sent directly to the copyright owner as specified in the copyright notice associated with the article.