
Abstract
Aims:
Hyperammonemia, defined by elevated ammonia levels, may co-occur in various neurological disorders, but its effects on cerebrovascularity are not fully understood. This study aimed to investigate how hyperammonemia affects brain endothelial cells senescence and selected within in silico analysis micro RNA-183-5p in this process.
Results:
Reduction in cerebrovascular density in hyperammonemia-induced rats, similar to that seen in 12-month-old rats, using von Willebrand factor staining, was observed. MicroRNA (miRNA) profile analysis of the brain cortex and plasma identified miRNA-183-5p contributing to endothelial senescence. In vitro studies of ammonia-treated rat brain endothelial cell line 4 showed senescent features, including increased β-galactosidase activity, higher mRNA levels and fluorescence intensity of p16 and p21, and altered senescence-associated secretory phenotype. Additionally, the transfection of miRNA-183-5p mimic induced similar senescent characteristics in endothelial cells, whereas miRNA-183-5p mimic inhibition reversed some effects.
Innovation:
This study is the first to link hyperammonemia-induced cerebrovascular dysfunction with miRNA-183-5p, highlighting its role in promoting endothelial senescence. The findings suggest that miRNA-183-5p could be a target for therapeutic interventions, preventing ammonia-induced brain endothelial dysfunction.
Conclusion:
Hyperammonemia promotes brain endothelial cells senescence through miRNA-183-5p, reducing cerebrovascular density. This may contribute to cerebral dysfunction seen in hyperammonemia-associated neurological disorders. Targeting miRNA-183-5p could offer a novel therapeutic strategy to mitigate endothelial dysfunction and preserve brain health in hyperammonemia. Antioxid. Redox Signal. 43, 254–271.
Introduction
Hyperammonemia co-occurs in neurological disorders with toxic, metabolic, and neurodegenerative etiology, for example hepatic disorders, including nonalcoholic fatty liver disease, postoperative cognitive dysfunction, metabolic syndrome, neurodegenerative diseases (e.g., Alzheimer’s diseases), or aging (Kumar et al., 2021; Piazzolla and Mangia, 2020; Shavkuta et al., 2020). Clinically, the most frequent cause of hyperammonemia is a consequence of liver impairment resulting in insufficient clearance of circulating ammonia, which, including a synergic role of systemic inflammation, induces a multicomplex neuropsychiatric syndrome named hepatic encephalopathy (HE) (Upadhyay et al., 2016). Circulating ammonia enters the brain and affects various aspects of brain homeostasis, exerting mild-to-severe alterations leading to brain function decline (Bajaj et al., 2010; Bosoi and Rose, 2009). The critical clinical complication of HE is cerebral edema, which involves ammonia-triggering self-amplifying mechanisms linked to osmotic disturbances and oxidative/nitrosative stress, exaggerated by disruption of the blood–brain barrier (BBB) (Jayakumar et al., 2012). Changes in cerebral microvascularity accompany the dysregulation of cerebral blood flow (CBF), further promoting brain dysfunction (Kurz et al., 2004; Reitsma et al., 2007).
In recent years, the endothelial cell (EC) senescence has emerged as a mechanism involved in vascular pathologies. In contrast to the extensive studies of the process in the periphery, limited studies documented the senescent ECs in the brain (Alavi et al., 2023; Kiss et al., 2020; Sikora et al., 2021). In hyperammonemia-associated pathological conditions, features of the brain endothelium senescence escape verification. Importantly, ammonia-induced markers of asthenic, senescent-like astrocytes were demonstrated in vitro and brains of HE animal models, and, albeit indirectly, in the postmortem brain tissue samples of HE patients with cirrhosis (Oenarto et al., 2016; Görg et al., 2015). Several works have documented that ammonia can trigger astrocyte senescence in an oxidative/nitrosative stress-dependent manner (Görg et al., 2015, 2013), thereby explaining the clinical observation that cognitive impairment in patients with liver cirrhosis can persist after resolution of an acute episode of overt HE (Bajaj et al., 2010; Jalan and Rose, 2022; Rose and Jalan, 2004).
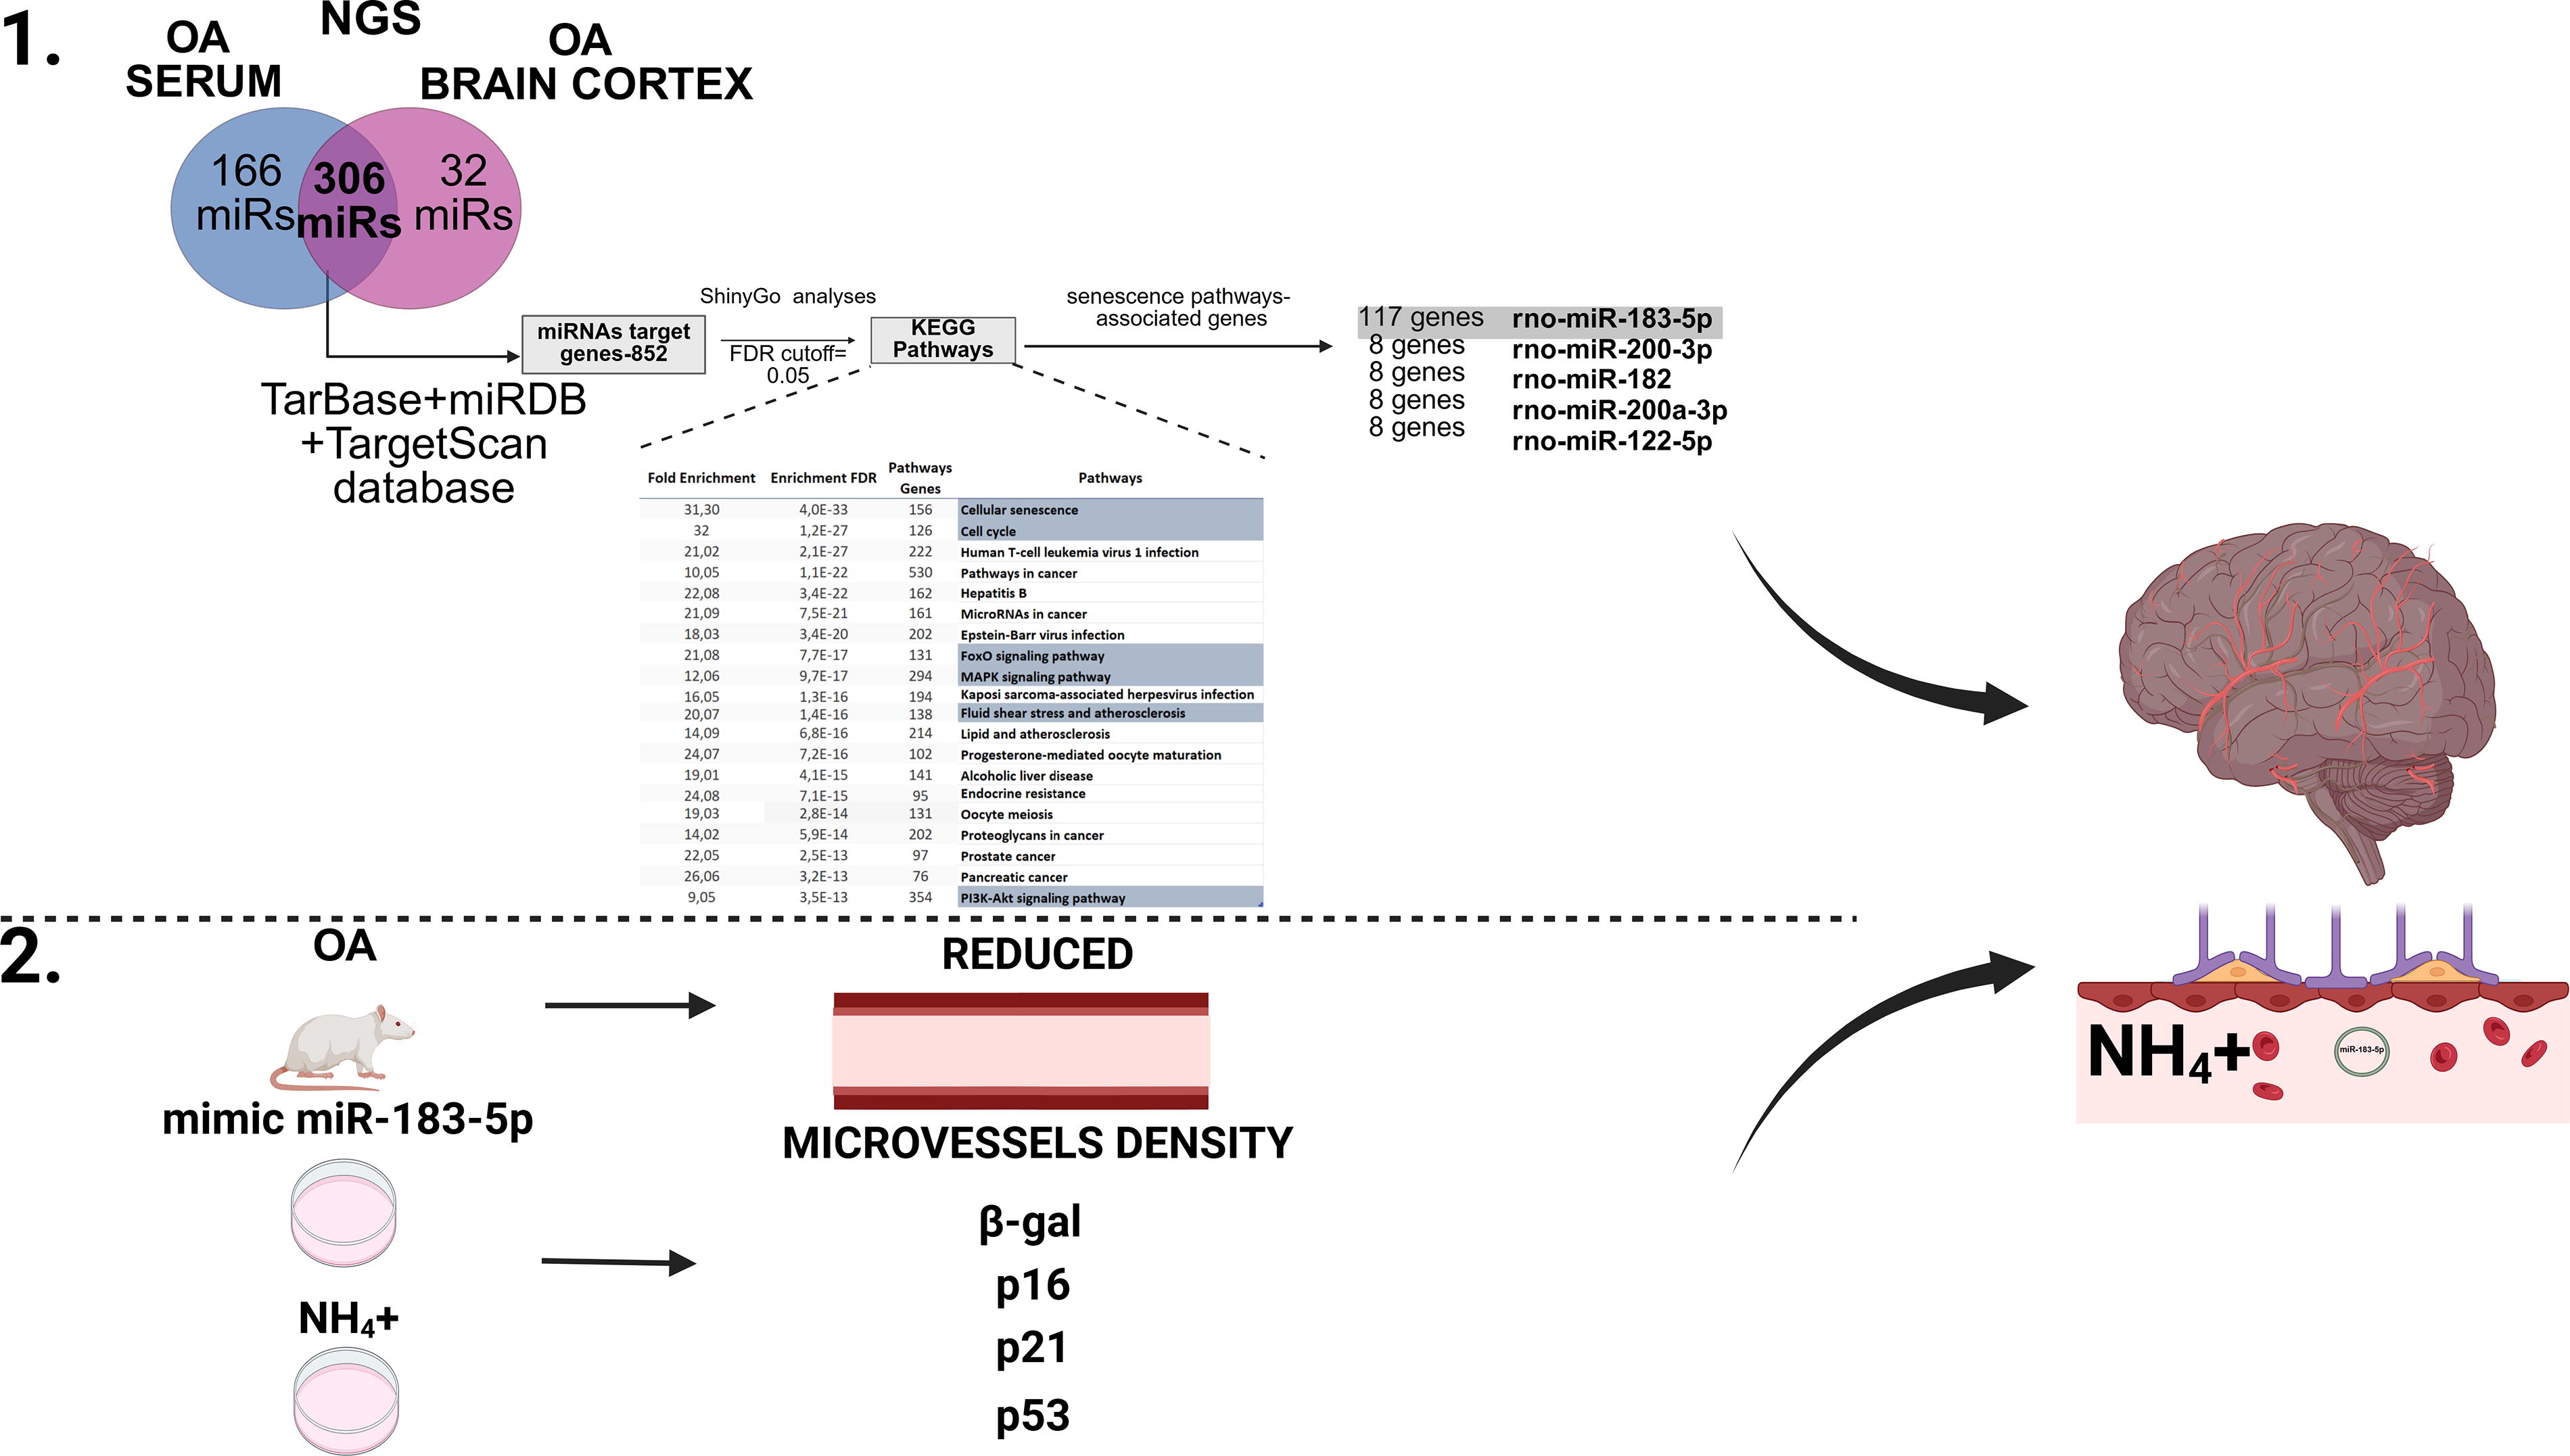
In this study, summarized on Fig. 1, we verified the effect of hyperammonemia on the induction of senescent phenotype in rat brain ECs. We also attempted to decipher the molecular mechanism, engaging the noncoding microRNA (miRNA), which, to our knowledge, has not been studied directly as yet.
Results
Identification of differential miRNAs in both serum and brain cortex of OA rats: pathways enrichment and target genes identification
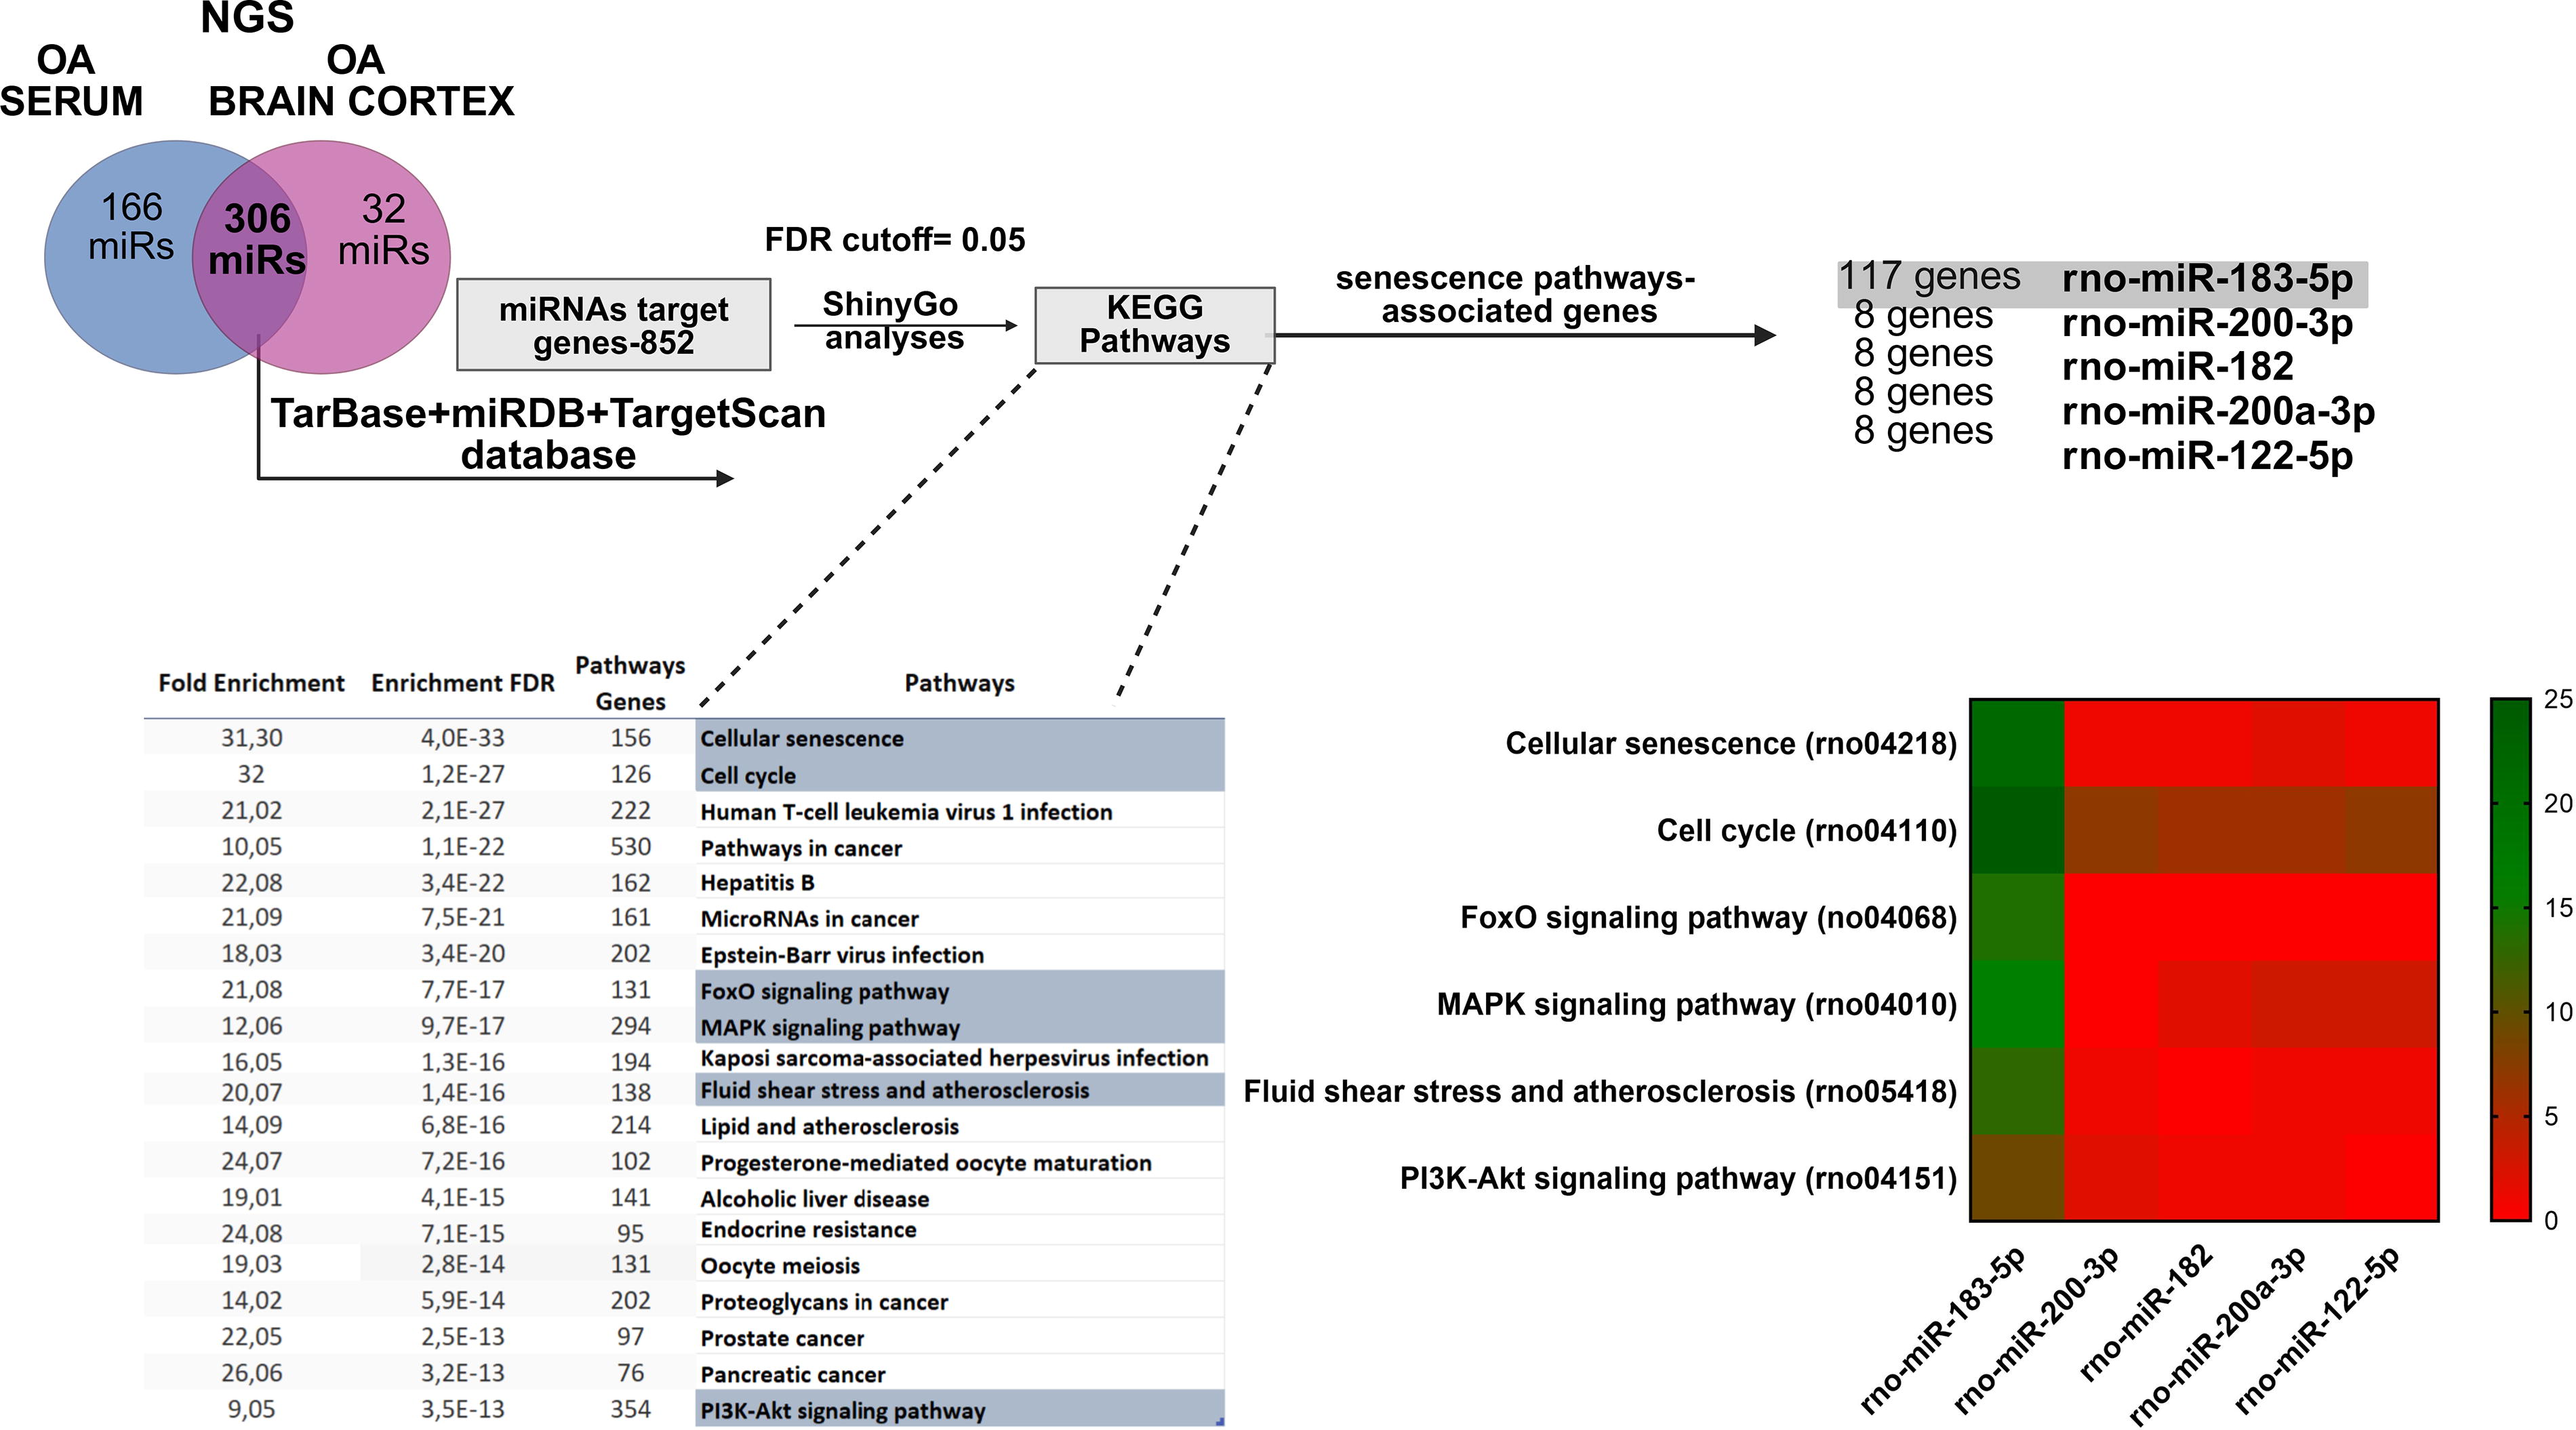
In total, 306 overlapped, differently altered miRNAs in both the serum and brain cortex of ammonium acetate (OA) rats were identified (Fig. 2; top; Supplementary Table S2). The current approach was built on previously obtained next generation sequencing (NGS) row data from plasma samples and from the newly received data from the brain samples, which were used to identify miRNAs associated with BBB disruption (Orzeł-Gajowik et al., 2023). Raw data from prior work are deposited in the Supplementary Data (Supplementary Table S1) and in the present study served for in silico analysis. By reusing the NGS raw data, we aimed to supplement our current analysis and enhance the robustness of our findings while adhering to the 3R rules that advocate for the reduction of animal usage in scientific research. These miRNAs were cross-referenced against three databases (TarBase/miRDB/TargetScan) to define 852 miRNA target genes. To gain insight into the shortlisted 306 miRNA pathways, their 852 target genes were assigned to the defined physiological processes using ShinyGO analysis (Ge et al., 2020). ShinyGO analysis offers distinctive functionalities, including visual representations of enrichment results and gene characteristics and the ability to access KEGG and STRING through an API to retrieve route diagrams and protein–protein interaction networks. ShinyGO analysis was carried out to identify the functional enrichment of selected genes using a false discovery rate (FDR) level of 0.05. The pathways, along with their relative fold enrichment and FDR values, indicate the frequency of pathways appearing in the list of miRNA target genes compared with what would be predicted by chance. Indicated pathways include the following biological processes: cellular senescence, cell cycle, forkhead box O (FoxO) signaling pathway, mitogen-activated protein kinase (MAPK) signaling pathway, fluid shear stress and atherosclerosis, and phosphoinositide 3-kinase (PI3K)-AKT signaling pathway. Indicated pathways and their relative fold enrichment and FDR values indicate the frequency of pathways appearing in the list of miRNA target genes compared with what would be predicted by chance. Comparing the number of common genes acquired through TarBase/miRDB/TargetScan databases with the senescence-associated ShinyGo analysis pathways, miRNA-183-5p was reported to regulate 117 genes. Since the next on the list, miR-200-3p, regulates only 17 genes (see heatmap), miR-183-5p was chosen for further research. The miRNAs listed along the x-axis include rno-miR-182, rno-miR-200a-3p, and rno-miR-122-5p (the most changed miRNAs from NGS analysis). The color intensity in the heatmap represents the enrichment of each miRNA in these pathways. The color intensity reflects the number of genes involved in specific KEGG pathways regulated by each miRNA, with green indicating the highest number of genes and red indicating the lowest number of genes. The number of genes from KEGG pathways and their enrichment regulated by the miRNAs are thus visually depicted in this heatmap.
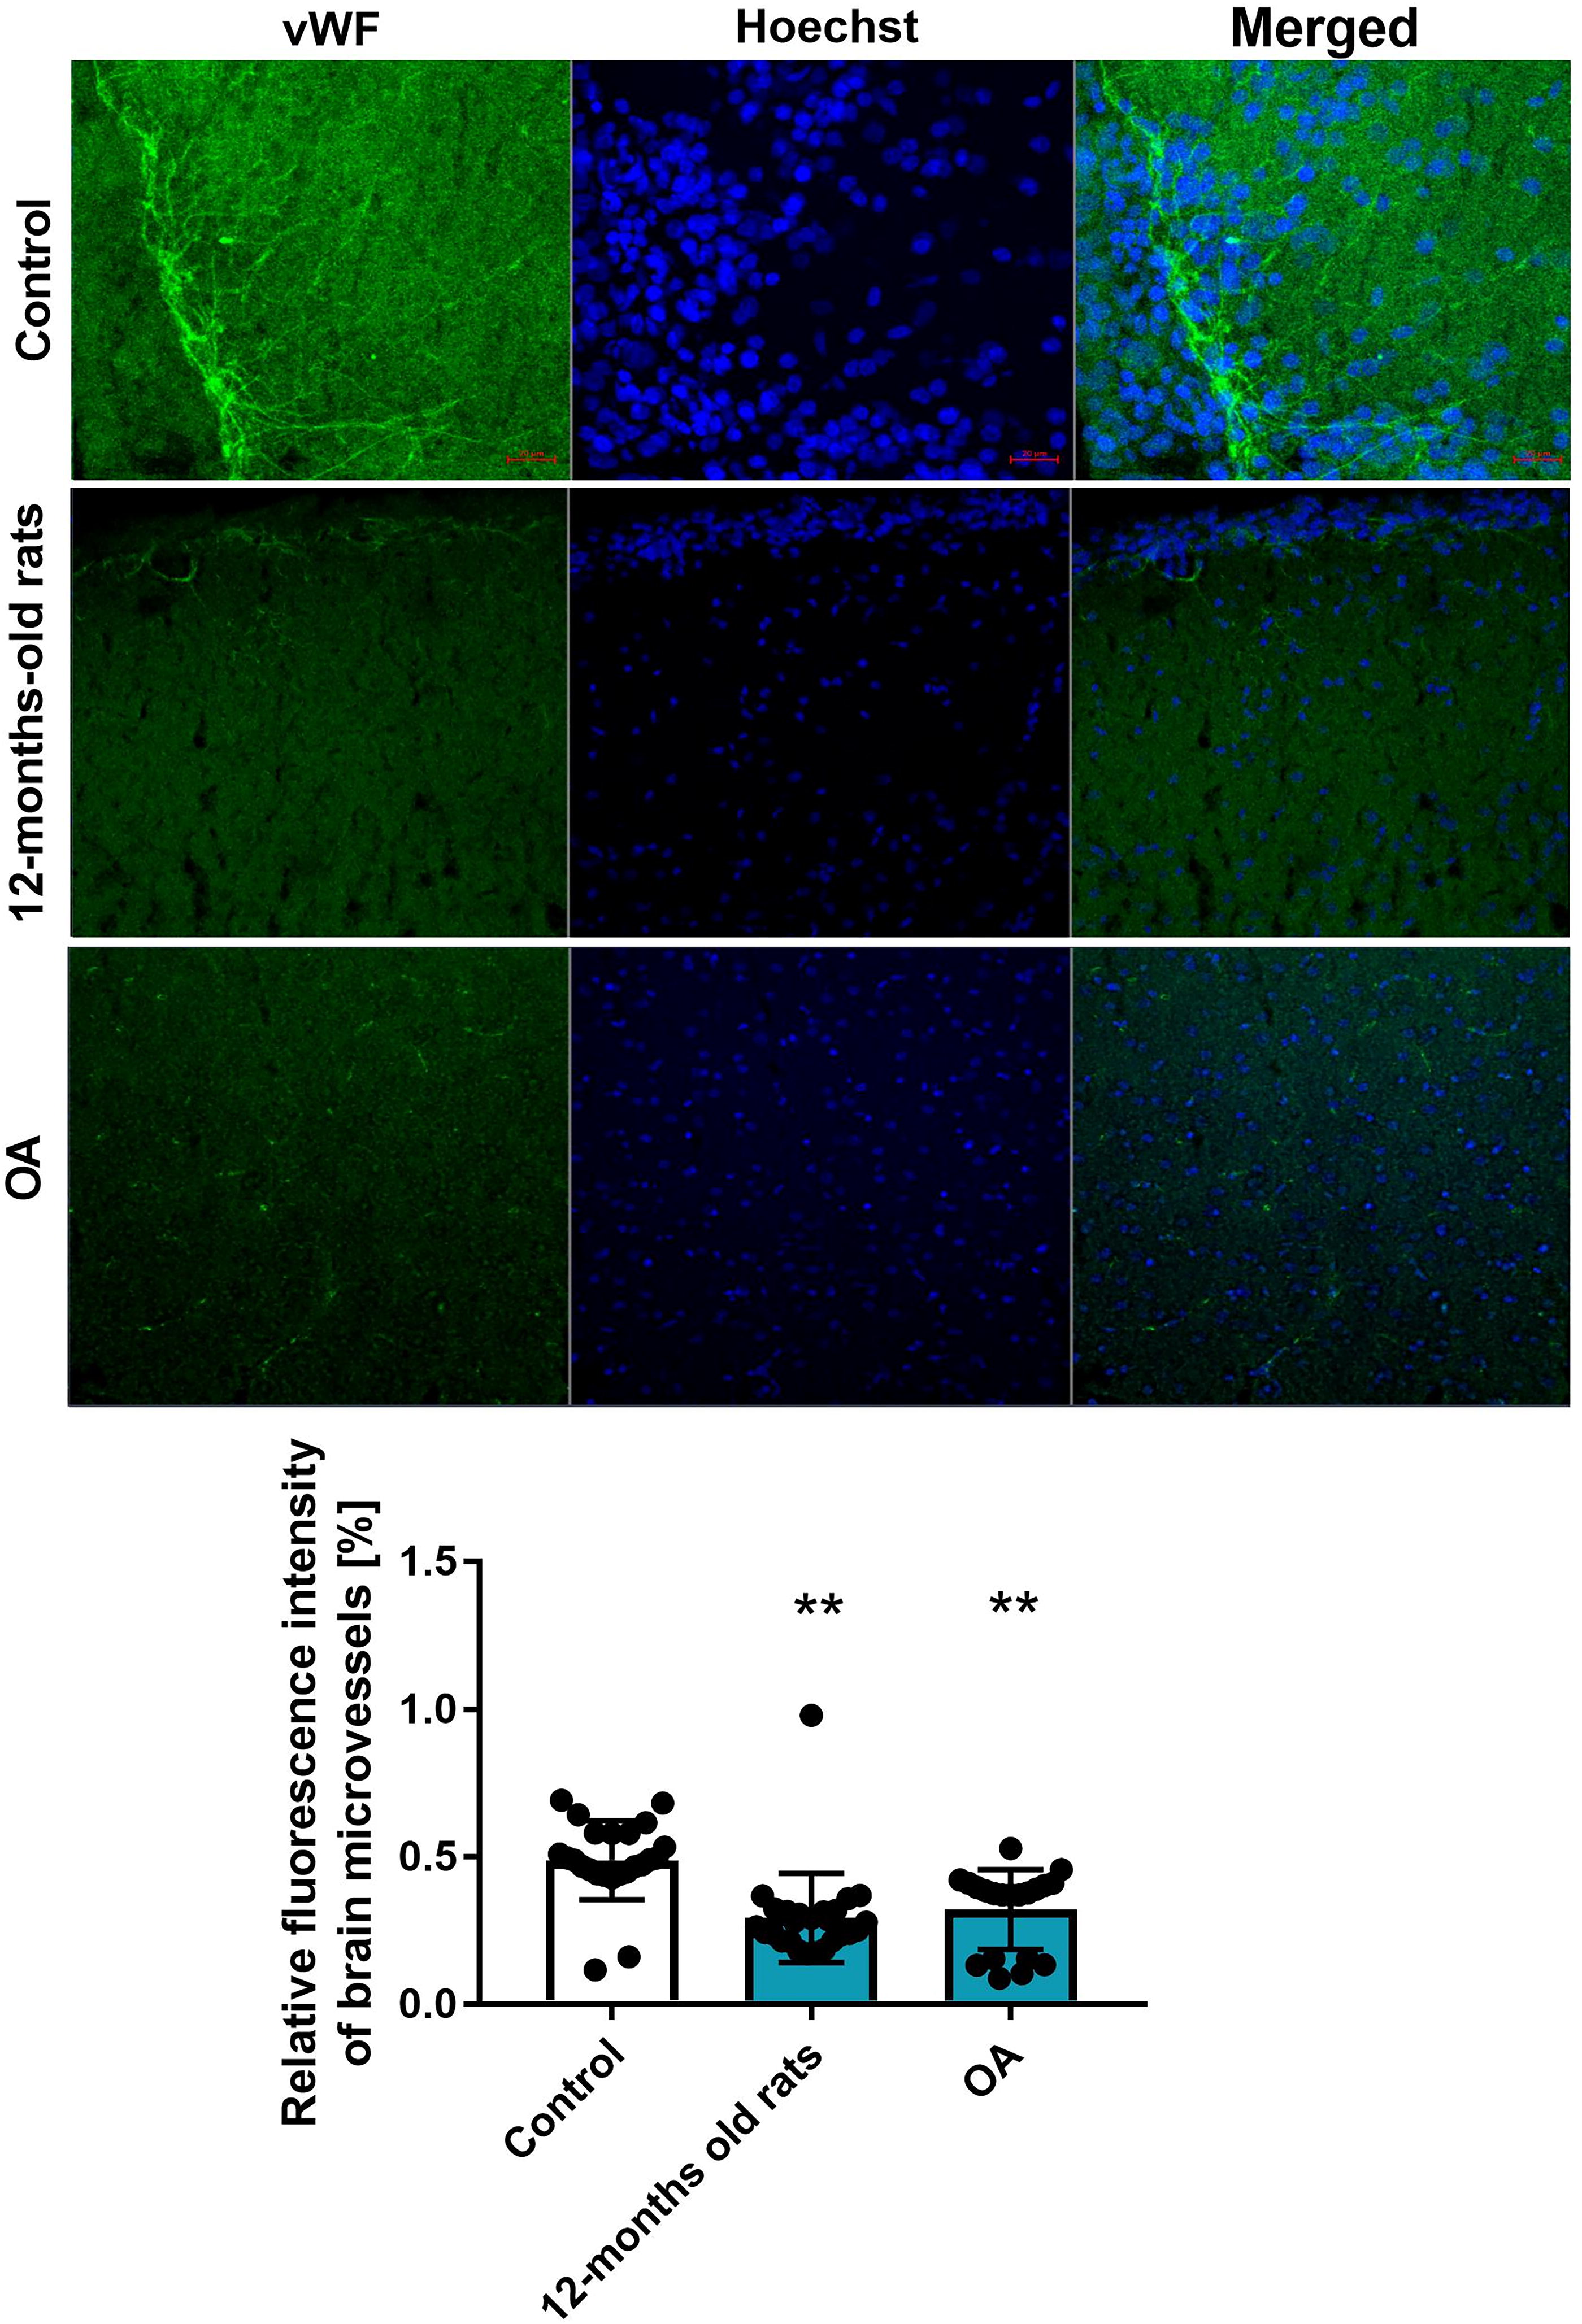
Ammonia and aging reduce brain microvascular density
To verify the phenotypic effect related to identified pathway enrichment analysis, ammonia or aging impact on microvascular density was evaluated in the brain cortex of control (2 months old), middle-aged (12 months old), and OA rats (Fig. 3). We measured the immunofluorescence intensity von Willebrand factor (vWF), a marker of EC-composing microvessels. The cortical region of a 12-month-old rat brain exhibits a significant reduction (∼35%) in vWF staining compared with the control. A noticeable (∼40%) decrease in vWF intensity, indicating a decline in microvessels fluorescence, was observed in the OA group.
The effect of ammonia on rat brain EC phenotype
Treatment with 5 mM ammonia for 24 h induces changes in the phenotype of rat brain endothelial cell line 4 (RBE4) cells toward the senescent character. First, we observed reduced by ∼20% RBE4 cell proliferation and captured by the live cell HoloMonitor recording of cell number. Results corroborate the observation from our laboratory, which demonstrated ammonia-induced RBE4 cell reduction with an MTT test assessing cell viability (Skowrońska et al., 2012). The cell parameters verified with HoloMonitor are presented in Supplementary Figure S1. Ammonia treatment of RBE4 cells induces a ∼0.6-fold increase in β-galactosidase staining intensity (Fig. 4A) in comparison with the control; the effect is also illustrated with fluorescence intensity of β-galactosidase (Fig. 4C; top left). Similarly, the β-galactosidase fluorescence intensity in RBE4 cells cultured for 3 weeks was observed (Fig. 4C, top right). We determine the mRNA level and fluorescence intensity of two cell cycle regulatory genes, namely p16 and p21 in ammonia-treated RBE4 cells (Fig. 4B). A notable rise in the expression levels of 44% and 66% in the p16 mRNA and p21mRNA, respectively, as well as fluorescence intensity with a corresponding increase in p16 protein levels by ∼70% and p21 protein levels by 28% was demonstrated in RBE4 cells treated with 5 mM ammonia.
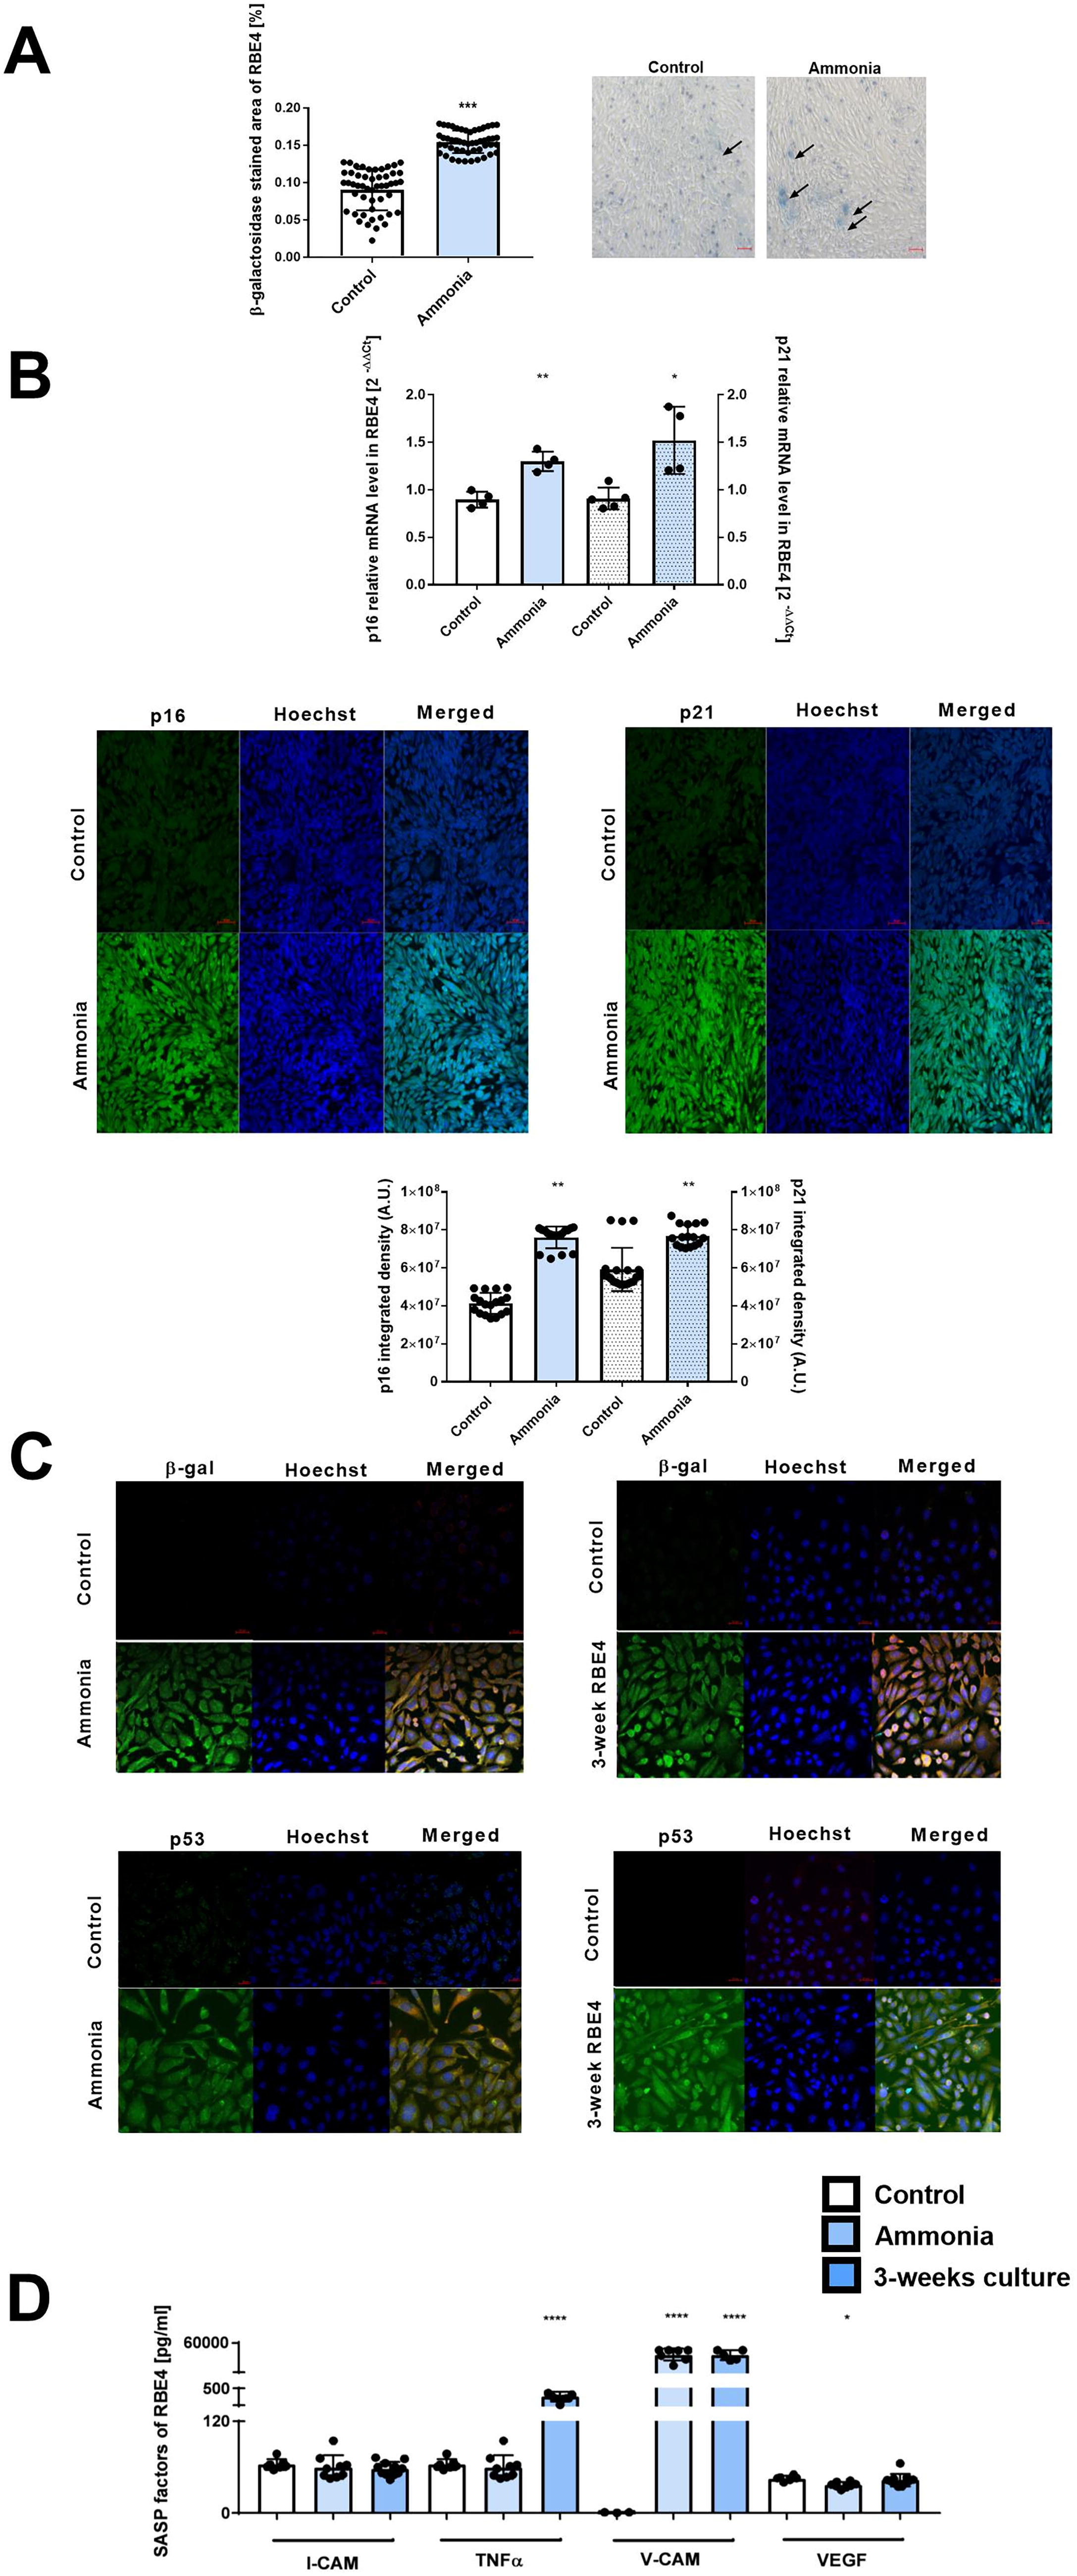
Next, we documented an increase in tumor suppressor p53 fluorescence intensity, indicating DNA damage and/or cellular stress in RBE4 cells treated with ammonia and in RBE4 cells cultured for ammonia and 3-week-old RBE4 cell line (Fig. 4C).
Finally, we measured concentrations of selected senescence-associated secretory phenotype (SASP) factors (I-cell adhesion molecule [CAM], tumor necrosis factor alpha [TNF-α], V-CAM, and vascular endothelial growth factor [VEGF]) of the RBE4 secretome. The RBE4 cells treated with ammonia-induced ∼8-fold change increase of V-CAM, whereas 3 weeks RBE4 cells reached ∼100-fold change in elevation of TNF-α level and ∼100-fold change in V-CAM (Fig. 4D).
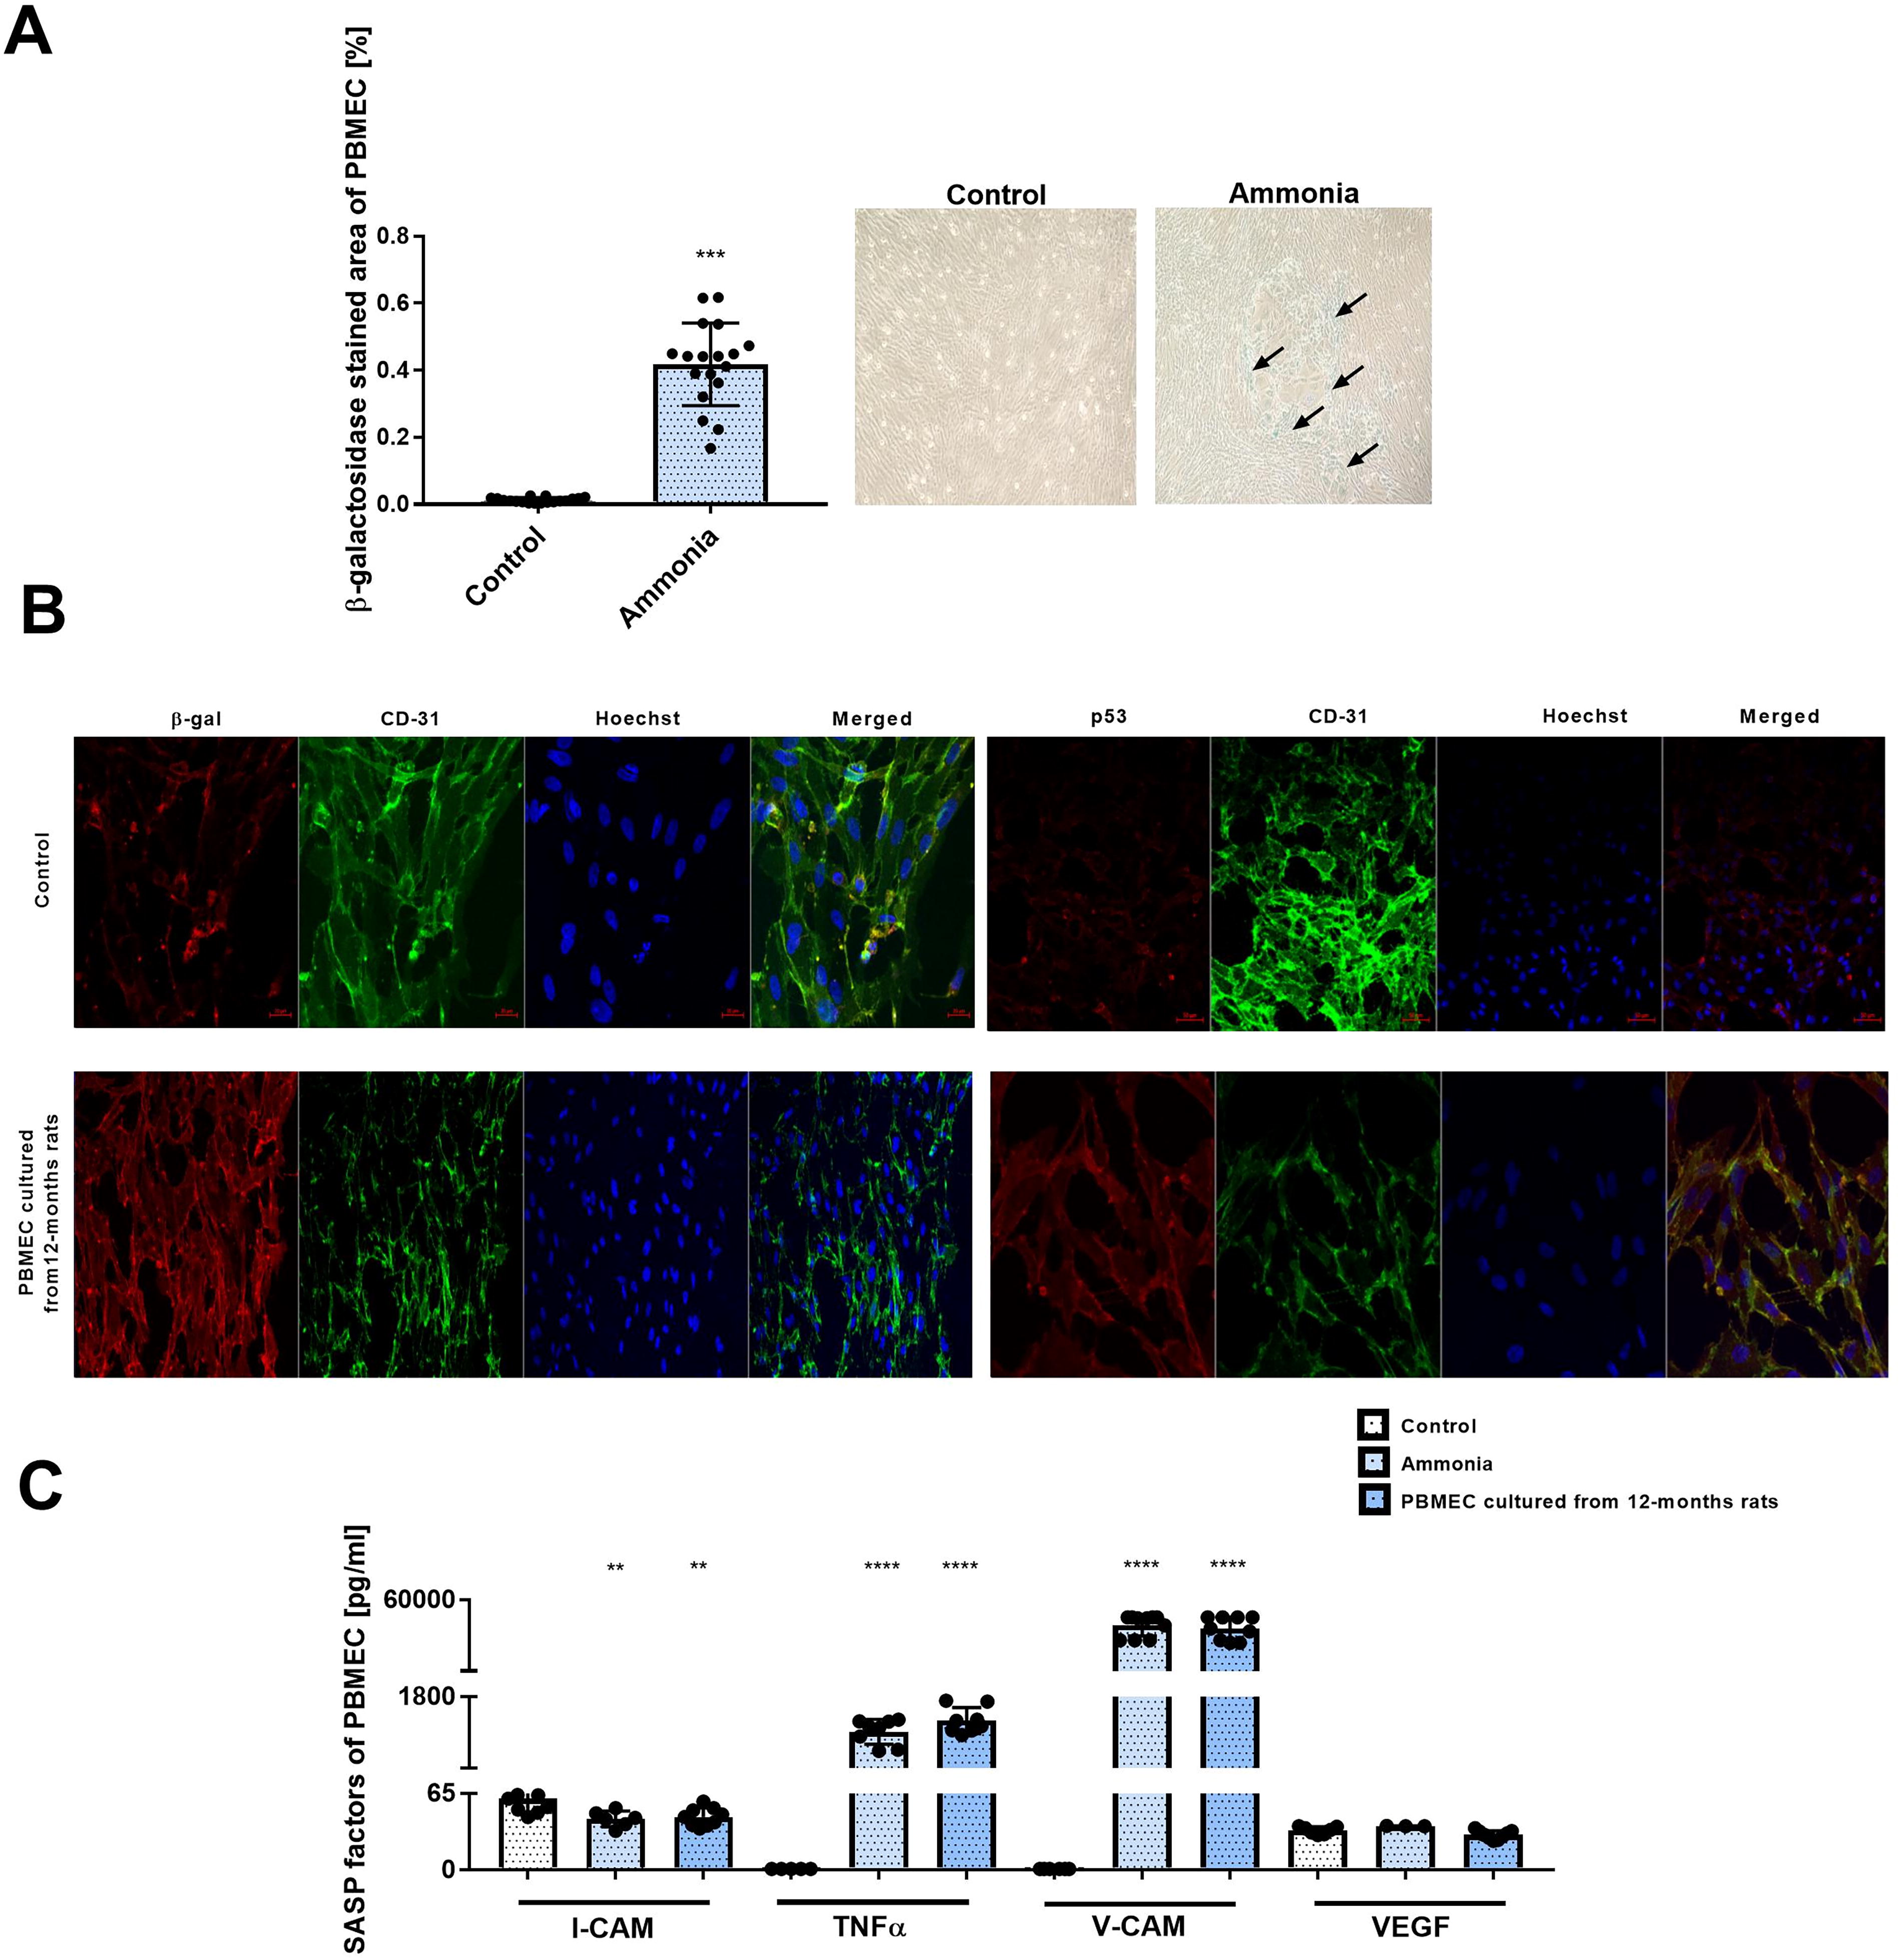
Similarly, the activity of β-galactosidase in primary brain microvascular endothelial cell (PBMEC) treated with 5 mM ammonia for 24 h was increased by ∼4-fold (Fig. 5A), concurrently with visible immunofluorescence intensity of β-galactosidase (Fig. 5B, left panel) and p53 (Fig. 5B, right panel) observed in PBMEC culture from 12-month-old rats. No significant changes were observed in the p16 and p21 mRNA expression levels (data not shown). The identity of PBMEC was checked with a CD-31 endothelial marker.
The SASP factor levels in PBMEC change divergently (Fig. 5C). I-CAM-1 level was significantly reduced (∼0.7-fold change) in the ammonia and 12-month-old cultures (∼1.2-fold change). The TNF-α level was increased by ∼900-fold change in ammonia-exposed cells and to ∼1300-fold in cells cultured from 12-month-old rats. The V-CAM level was elevated by ∼1000-fold in ammonia, and ∼800-fold change augmentation was noted in the PBMEC cultured from 12-month-old rats. The VEGF concentration was unaltered.
The involvement of miR-183-5p in the ammonia-induced phenotype of brain ECs
We verified the ammonia effect on the expression level of miR-183-5p in the cerebral cortex homogenates of OA, 12-month-old rats, RBE4 cells treated with 5 mM ammonia for 24 h, and isolated extracellular vesicles (EVs). The quantitative real-time polymerase chain reaction analysis of miR-183-5p revealed a ∼1.7-fold increase in 12-month-old rats and a ∼2-fold increase in OA rats (Fig. 6A, left). The miR-183-5p level in RBE4 treated with ammonia was ∼2-fold raised compared with the control; additionally, in EVs of ammonia-treated RBE4 cells, we observed a ∼2.1-fold increase in miR-183-5p expression level compared with the respective control (Fig. 6A). Results suggest that miR-183-5p may contribute to ECs’ response to ammonia. The correctness of EVs isolation was verified by fluorescence correlation spectroscopy (FCS) measurements by exosome size, distribution, and diffusion properties measurement. The quantitation was performed on isolated and fluorescently stained exosomes, confirming the presence of objects with an average hydrodynamic radius of 11.6 nm in the sample. The fluorescence signals from the exosomes were significantly higher than the background signal (see Supplementary Fig. S2). The FCS autocorrelation curves were fitted with a one-component anomalous diffusion model due to the non-uniform size of the measured particles. An example of an FCS autocorrelation curve is shown in Supplementary Figure S2B. In the sample, molecules with hydrodynamic radii of 22.5 and 7.6 nm, with a median of 11.1 nm, were present. Importantly, no mobile fluorescent molecules other than exosomes were identified in the sample according to the one-component fit model. The values of all parameters obtained from FCS analysis are summarized in Supplementary Table S1.
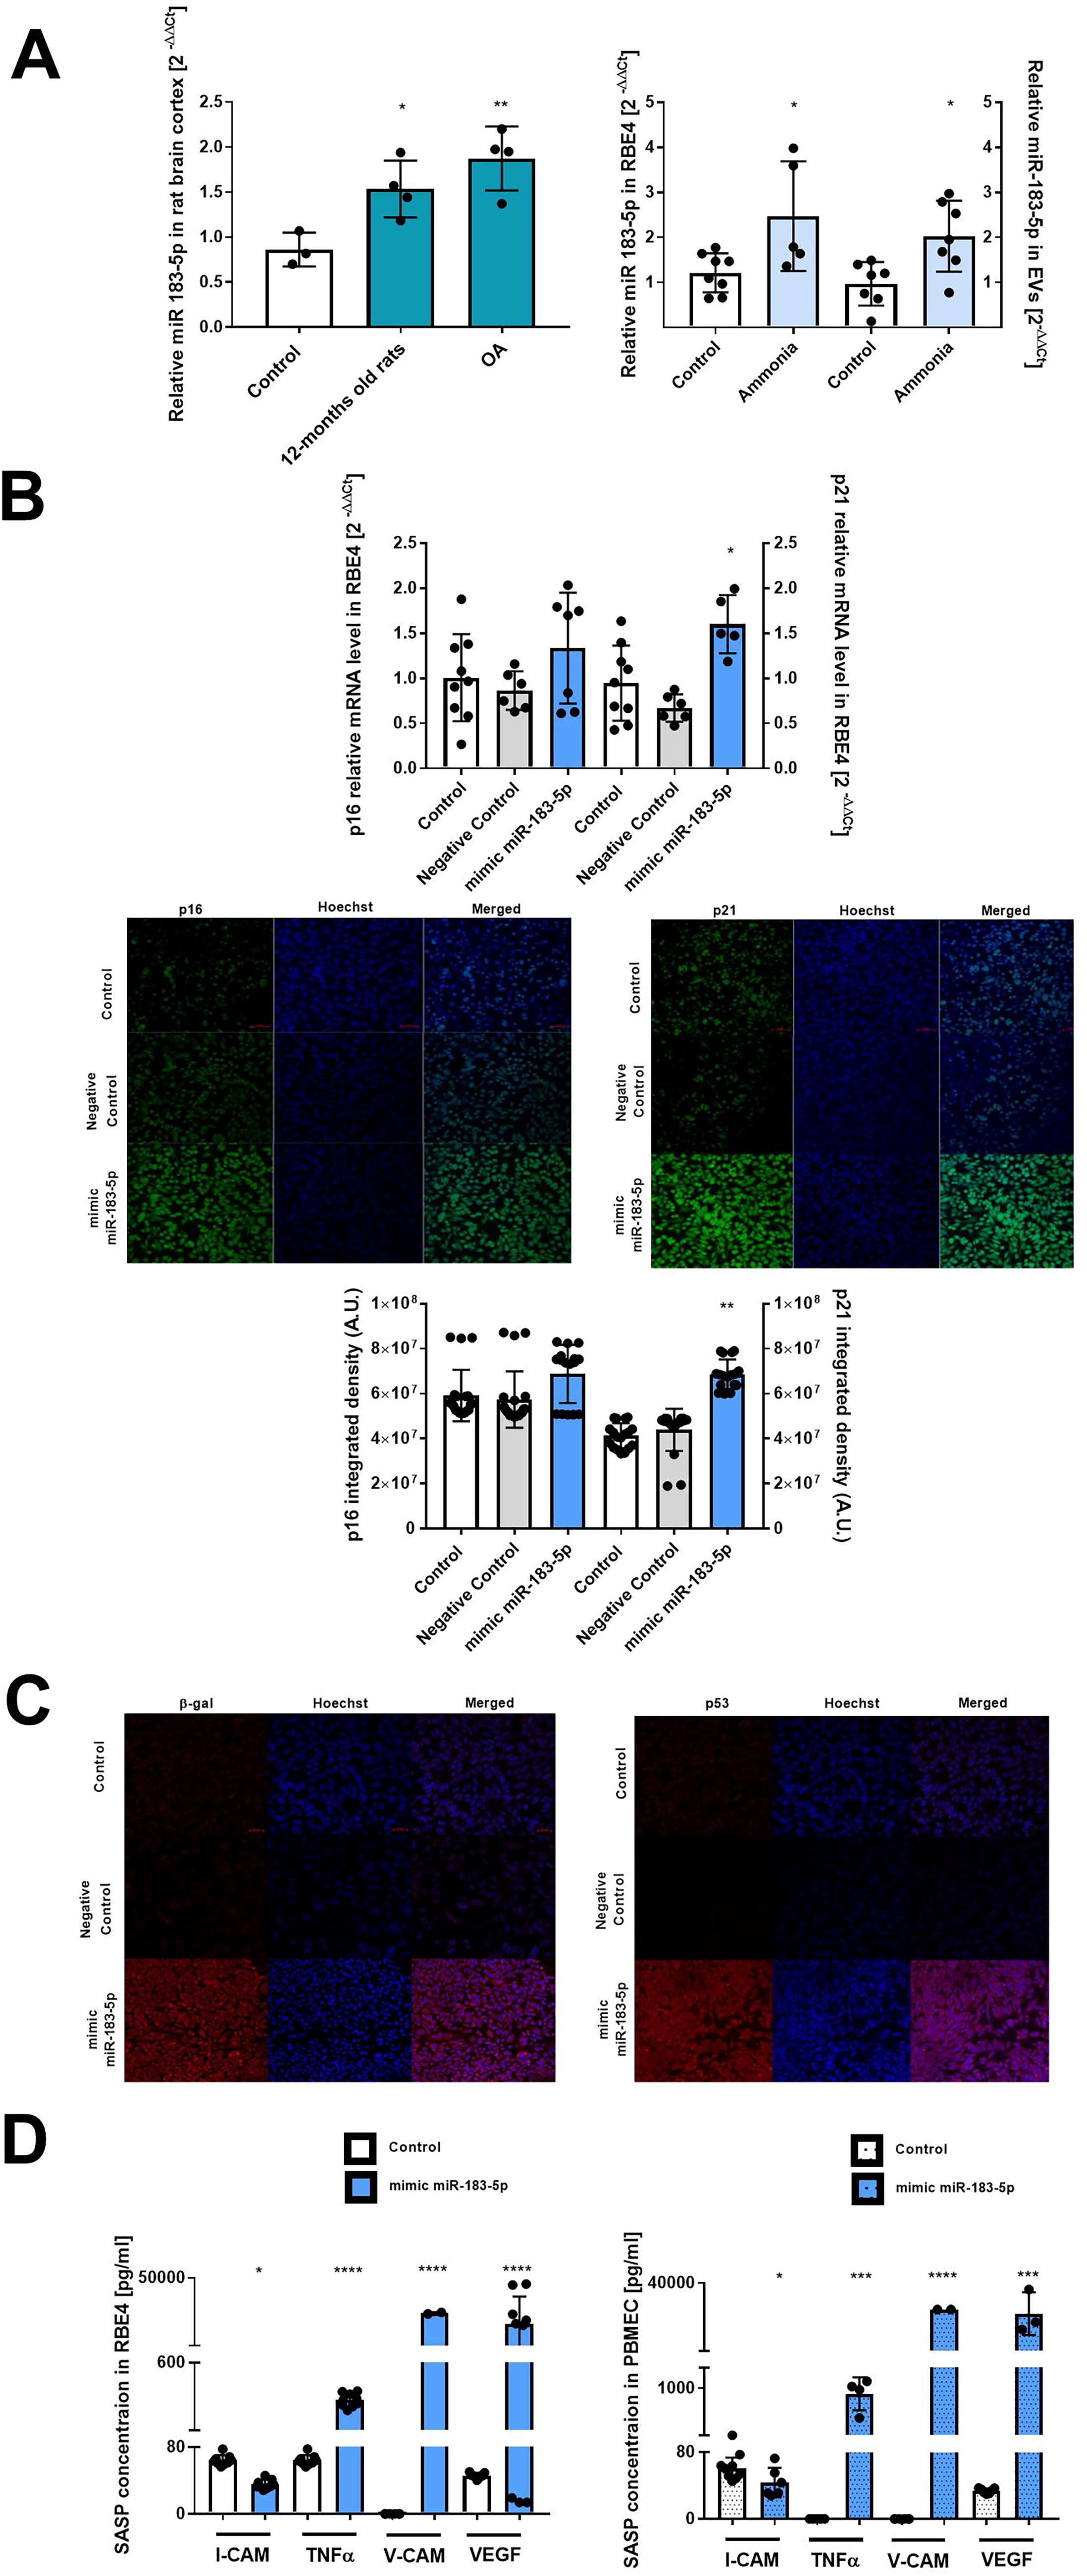
We further characterize the EC phenotype toward senescence in RBE4 cells transfected mimic-miR-183-5P. Thus, we first analyzed mRNA expression levels and immunofluorescence intensity of the cell cycle regulators p16 and p21 mRNA (Fig. 6B). The p16 mRNA level was unchanged, and an increase by ∼70% in the case of p21 mRNA (Fig. 6B) was observed. The increase in p21 fluorescence intensity by ∼60% in the mimic-miR-183-5p transfected cell was also observed (Fig. 6B). The degree of complementarity between the miRNA sequence and the p16 and p21 mRNA genes was utilized with TargetScan bioinformatics software. The alignment identified putative binding locations of miR-183-5p and both mRNA interactions (Supplementary Fig. S3).
Accordingly, we verified β-galactosidase and p53 fluorescence intensity in RBE4 cells transfected with mimic-miR-183-5p (Fig. 6C), confirming the impact of miR-183-5p to induce features of senescent phenotype in the ECs.
SASP factors (I-CAM-1, TNF-α, V-CAM, and VEGF) upon transfection of RBE4 and PBMEC with mimic-miR-183-5p depict divergent responses. The concentrations of I-CAM-1 in both the transfected and control groups were similar. The TNF-α level was significantly increased in both RBE4 and PBMEC cells (Fig. 6D) and ∼4 times higher compared with the respective control. The transfection with mimic-miR-183-5p presents a 400-fold rise in VEGF level in both RBE4 and PBMEC cell types.
To reverse the effect of ammonia, we used an miR-183-5p inhibitor (Fig. 7A). In RBE4 cells treated with the miR-183-5p inhibitor, a ∼30% decrease of miR-183-5p was observed compared with the control. MiR-183-5p expression in RBE4 cells treated with miR-183-5p inhibitor in the presence of ammonia was unaltered.
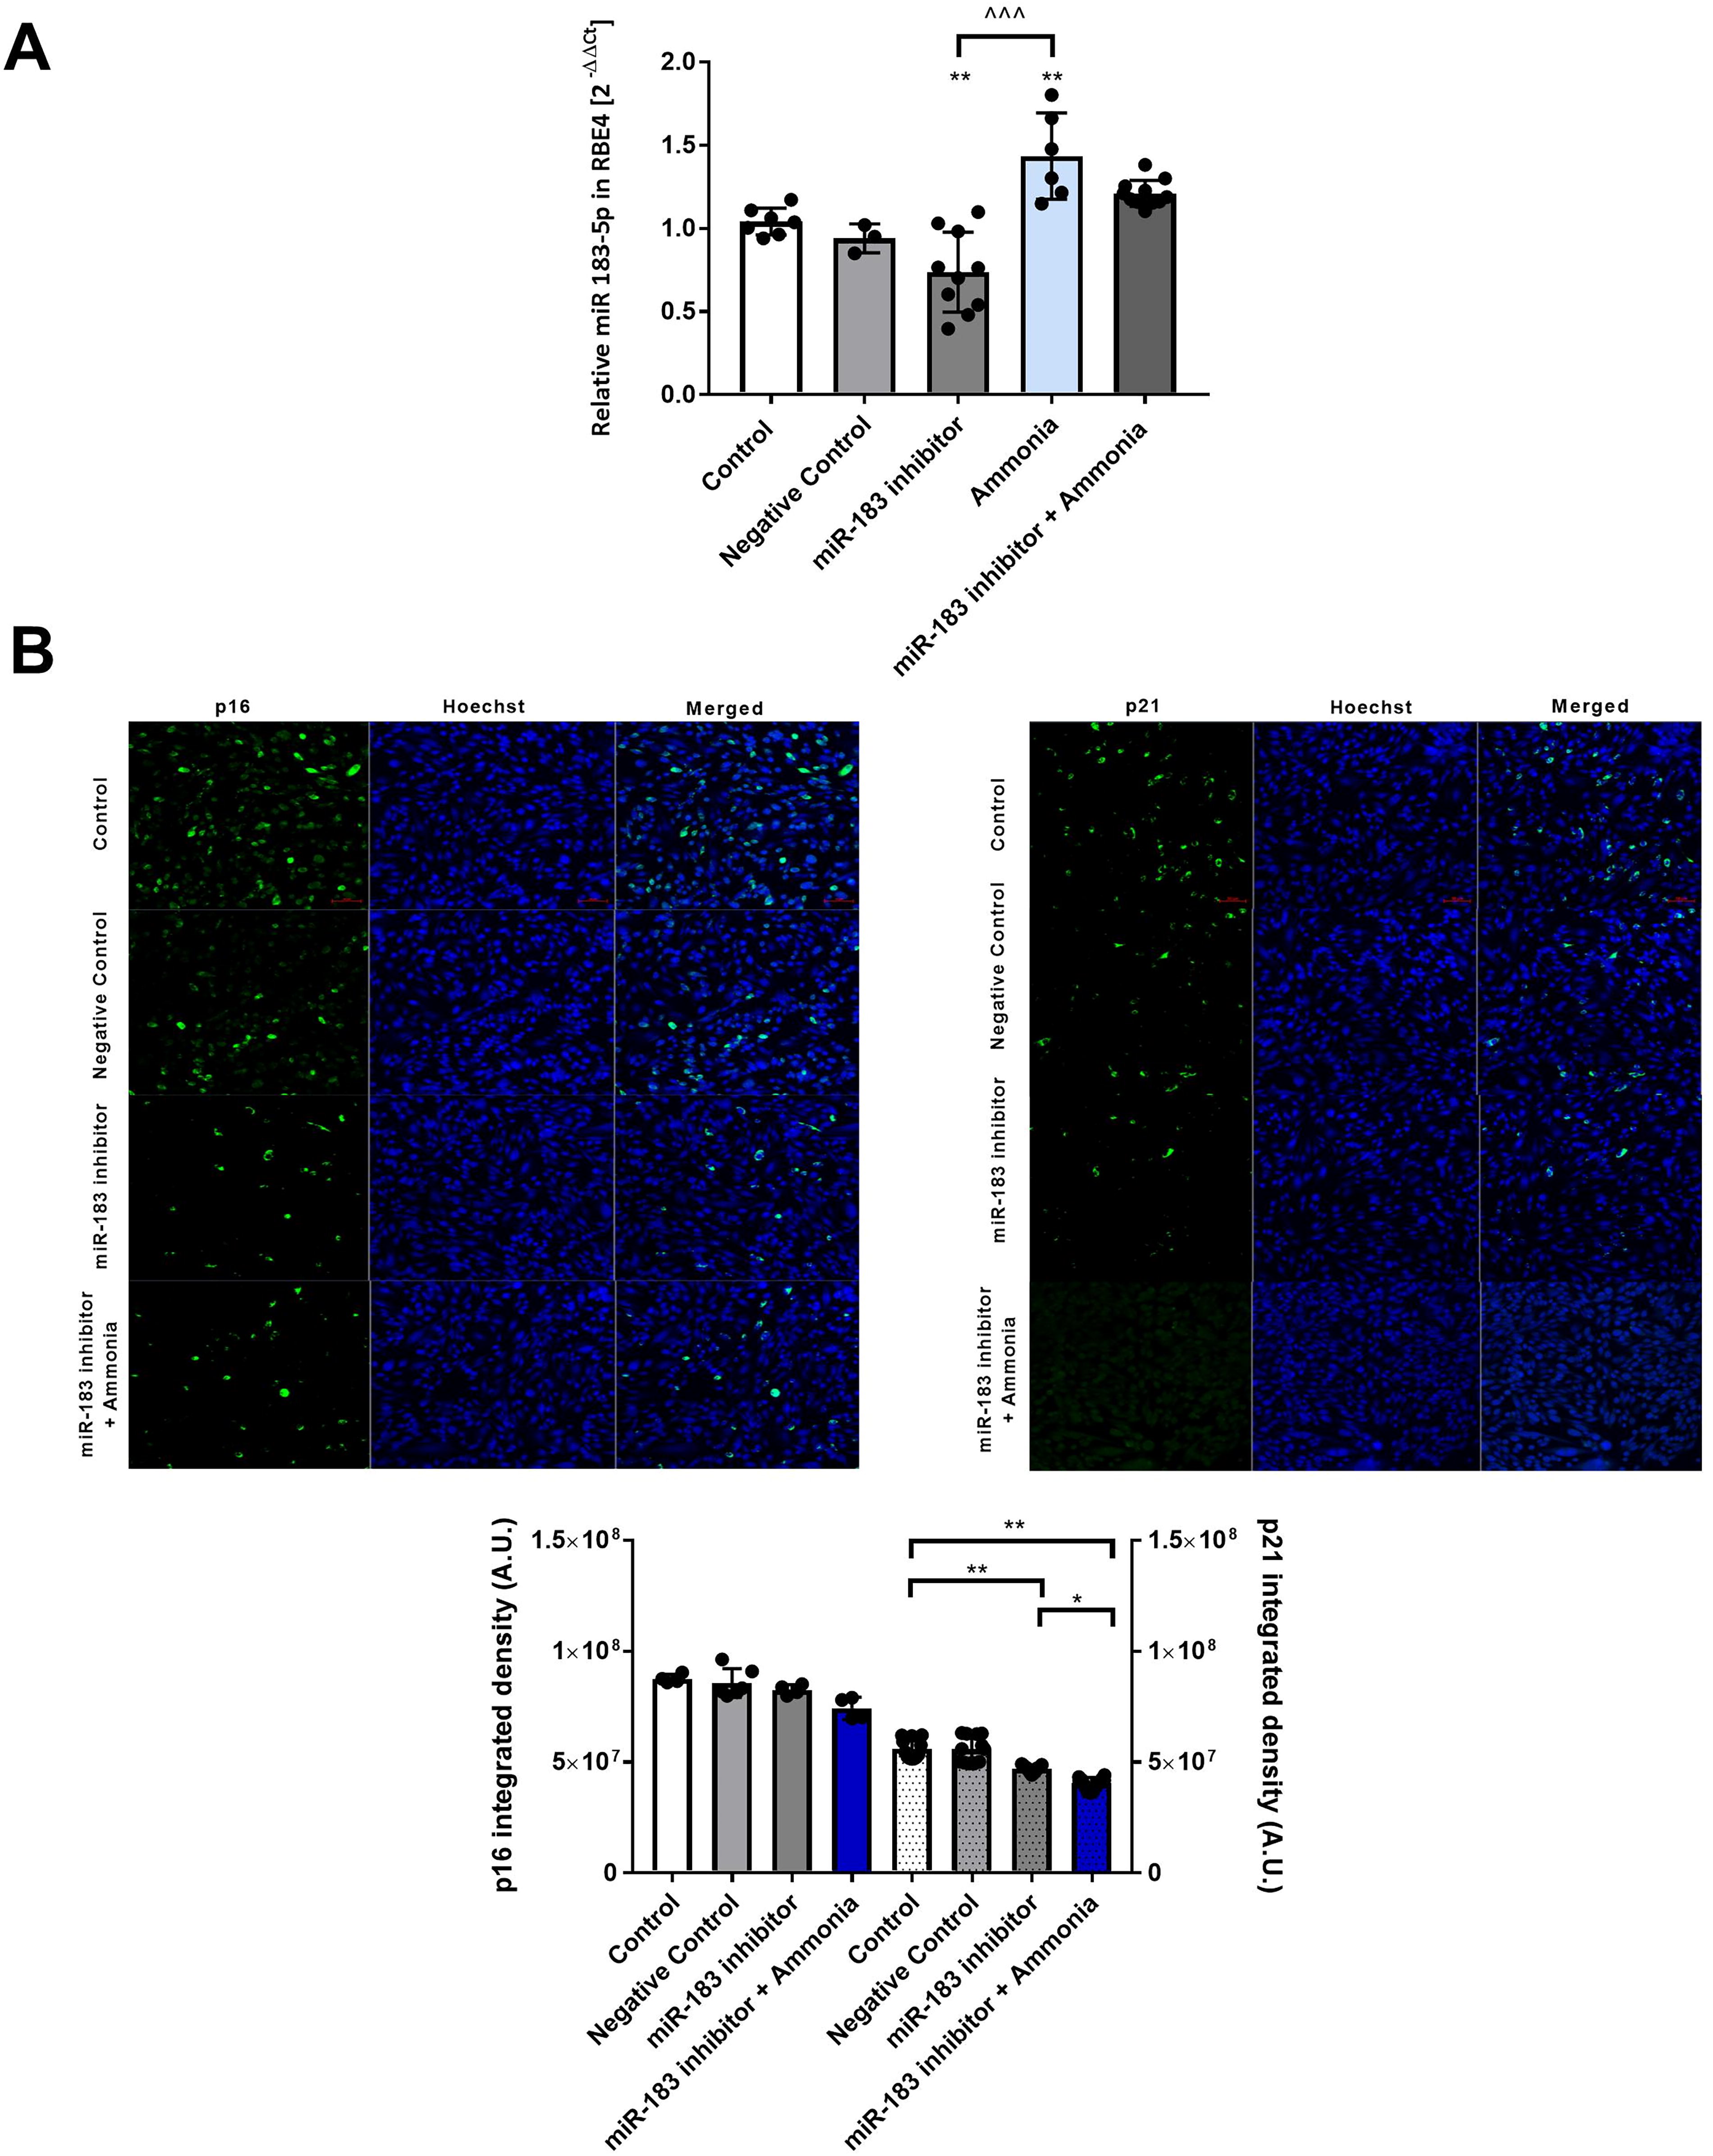
Finally, we quantified the integrated fluorescence density of p16 and p21 in RBE4 cells treated with miR-183-5p miRNA inhibitor added alone or in combination with 5 mM ammonia (Fig. 7B). The p16 fluorescence intensity was unchanged in treated groups, whereas p21 fluorescence density was reduced by ∼15% in the presence of the miR-183-5p miRNA inhibitor added alone or with ammonia.
Discussion
Proper brain functioning is guaranteed by cerebrovasculature homeostasis maintenance with an active guiding role of intact BBB. Disturbances of the BBB at varying degrees may trigger and/or accompany many neurological diseases, including physiological aging and diseases with hyperammonemia-related factors (Hernández-Rabaza et al., 2016).
In the present study, we demonstrate an undetermined aspect of hyperammonemia related to EC senescence that may contribute to cerebrovascular dysfunction observed in this pathology. We identified the potential miRNA candidate contributing to EC senescence by analyzing circulating and cerebral miRNA profiles in OA rats. We then documented the reduction of rat brain cerebrovascular density induced by hyperammonemia and compared the observation with decreased cerebrovasculature measured in brain cortexes of the 12-month-old rats. Finally, we verified the impact of identified miRNA-183-5p toward senescent phenotype changes induction and implicated not yet described alterations in ECs evoked by hyperammonemia.
All brain-composing cells undergo senescence and aging-related changes (Knopp et al., 2023); thus, the accumulation of senescent astrocytes and neurons leads to structural and functional decompositions resulting in cognitive impairment; in line, endothelial dysfunction contributes to an age-dependent drop in microvascular density (Reed et al., 2016). However, senescent ECs have not been frequently identified in the brain tissue of patients with neurodegenerative diseases (Garwood et al., 2014). In turn, in vitro studies have shown that oligomeric β-amyloid can induce secretion of SASP from the ECs (Angom et al., 2019).
We observed a reduction in endothelial marker vWF staining in the 12-month-old rat brain cortex and in OA rats, documenting a decrease in brain vasculature in our experimental setting.
In this context, our observation corroborates previous findings of more pronounced cognitive deficits and quality of life impairment demonstrated in older patients with cirrhosis compared with age‐matched patients without cirrhosis (Liu et al., 2019). This clinical observation was linked with changes in brain connectivity assessed by imaging study and specific astrocytic and neuronal markers also reflected in the animal model.
Brain endothelial dysfunction is frequently accompanied by CBF reduction, affected hemodynamic response, and vascular reactivity, detected during physiological aging to mild cognitive impairment (Sweeney et al., 2018). Such alterations were detected in patients with congenital hyperammonemia, acute liver failure, and neurological disorders, including neurodegenerative diseases (Almdal et al., 1989; Jalan et al., 2004; Savy et al., 2018; Su et al., 2014). In general, the CBF values reported in acute liver failure are variable, linking a global decrease in brain energy metabolism as one of the primary events associated with the pathogenesis of HE. Experimentally, acute liver failure in rats induces decreased cerebral perfusion (Czarnecka et al., 2018); of note, one interesting, albeit still unproven, hypothesis claims that CBF is differently regulated in the cerebral cortex and cerebellum as well as at the early and late stages of HE (Felipo, 2013).
At the molecular level, an impaired tight junction (TJ) organization within senescent ECs was shown in progeroid mice (Yamazaki et al., 2016) and in the brain tissue of mice models of Alzheimer’s disease (Kook et al., 2012). The substantial disruption in TJ proteins within the ECs and BBB leakage were demonstrated at the late and/or severe stages of hyperammonemic encephalopathies (Baek et al., 2020; Chen et al., 2009; Grant et al., 2018; Orzeł-Gajowik et al., 2023), where changes develop progressively.
Cellular senescence is the irreversible cell growth arrest that induces signaling cascades of p53/p21 and p16 pathways, one of the characteristic features of cellular senescence (Barboza et al., 2006; Beausejour, 2003). Morphological screening is the simplest way to identify senescent cells; thus, increased size, granularity, and the lysosomal enzyme senescence-associated β-galactosidase (β-gal) activation became detectable (Dimri et al., 1995).
The accumulation of senescent cells has been observed in physiological age and is the culprit of numerous age-related diseases (Muñoz-Espín and Serrano, 2014; Van Deursen, 2014); moreover, population-based studies have shown a positive correlation between DNA damage and p53 in the endothelium in human brain samples of Alzheimer’s disease; notably, changes may occur independently of disease pathology (Garwood et al., 2014). Senescence can be triggered by a variety of stressors, including oxidative stress, replicative and oncogenic activation (Warboys et al., 2014), telomere attrition (Kurz et al., 2004), DNA damage (Zhan et al., 2010), and mitochondrial dysfunction (Dai et al., 2012). Since ammonia is a cause of oxidative/nitrosative stress, as was shown many times in both in vitro and in vivo experiments by free radical production, increased RNA oxidation, higher lipid peroxidation, and lower antioxidant enzyme activity in the cerebral cortex to listed a major pathomechanistic factors (Zielinska et al., 2025), this neurotoxin may trigger endothelial senescence.
Our in vitro experiments on RBE4 cells treated with ammonia documented a cell proliferation drop, in line with previously observed cell viability decrease detected with MTT assay (Skowrońska et al., 2012). Phenotypic changes were further visualized by increased β-gal and cell growth arrest proteins, complementary-documenting ammonia-induced features of senescence. It is worth adding that mitochondrial dysfunction is a significant feature of senescent ECs, characterized by mitochondrial mass decline and decreased electron transport chain activity resulting in oxidative stress induction (Kurz et al., 2004; Ungvari et al., 2008). Our recent data documented that high ammonia affected mitochondria morphology and mitochondria number in EC-composing BBB in HE models (Milewski et al., 2024). The changes were associated with mitochondrial membrane potential drop in ECs contributing to increased monolayer permeability (Orzeł-Gajowik et al., 2023), corresponding to early demonstrated changes in the study by Jayakumar et al. (Jayakumar and Norenberg, 2013). At the more functional level, hyperammonemia affected the activity of endothelial nitric oxide synthase (eNOS) by reducing nitric oxide (NO) availability and thus contributing to endothelial dysfunction (Jayakumar et al., 2012). In this context, reduced eNOS content and activity co-occurred with eNOS uncoupling, as was documented in the cerebral cortex tissue of rats with acute liver failure (Milewski et al., 2021). Likewise, at the periphery, eNOS uncoupling adds to the mechanism of ECs’ premature aging (Rajapakse et al., 2011). eNOS failure is crucial to EC aging in humans (Matsushita et al., 2001); thus, eNOS decrease contributes to oxidative stress and inflammation, all exaggerating EC death (Rippe et al., 2012). While the SASP is heterogeneous and can vary, (He and Sharpless, 2017; Hernandez-Segura et al., 2017; Maciel-Barón et al., 2016) endothelial SASP, beyond increased levels of reactive oxygen species and NO levels, is characteristic of endothelial markers I-CAM-1, V-CAM, and VEGF; of note, ammonia elicits a pro-inflammatory response that aligns to a great degree with SASP (Wang et al., 2019; Williams et al., 2022).
MiRNA profiling defines inter-organ communication and homeostasis within the liver–brain axis, whereas dysregulation of specific miRNAs contributes to both liver and cerebral diseases (Szabo and Bala, 2013). For example, expressing in the brain miR212/132 is sensitive to external cues from the liver (Bala and Szabo, 2012). Circulating miRNAs regulate BBB integrity by targeting TJ proteins, basement membrane components, and inflammatory pathways (Wang et al., 2021b), and several miRNAs such as miR-15a/16-1, miR-501-3p, and miR-210 are acknowledged in these processes (Orzeł-Gajowik et al., 2021; Toyama et al., 2021).
We analyzed the most significantly changed miRNA in the brain cortex and serum from OA rats and identified 306 miRNAs with predicted target genes using TarBase, miRDB, and TargetScan databases. The miR-183-5p, which controls 117 genes, associated with senescence pathways, was selected with the ShinyGO web-based program. Within in silico analysis, we revealed possible miR-183-5p targets, pathways of cellular senescence, cell cycle, FoxO signaling, and MAPK signaling, and respective genes, such as p53, p21, p16INK4a, cyclin-dependent kinases, and FoxO (Davis et al., 2017). miRNA-183-5p verification implicated its contribution to ammonia-evoked brain endothelium senescence. In this context, our data corroborate with previous data (Orzeł-Gajowik et al., 2023) documenting a ∼3-fold increase of miR-183-5p in 5 mM ammonia-treated primary culture of rat ECs.
MiR-183-5p is a member of the miR-183 cluster situated on chromosome 7q32.2, consisting beyond miRNA-183-5p also miR-96 and miR-182 (Nguyen et al., 2022). miR-183-5p has been linked to apoptosis regulation, cell proliferation, and migration in various cancers (Sarver et al., 2010; Zou et al., 2021). Under physiological conditions, miR-183-5p has been detected in neurons and sensory organs (Pierce et al., 2008) and documented to regulate the expression of genes involved in synaptic formation and plasticity (Piscopo et al., 2019), metabolism of glucose, and lipid balance in ECs (Wang et al., 2021a).
Other data document miR-183-5p involvement in age- and endothelium-related processes. An age-dependent increase of miR-183-5p levels was related to suppression of proliferation and induction of senescent phenotype in bone marrow stromal cells (Davis et al., 2017). miR-183-5p was identified within the panel of 15 miRNAs, overlapping human and mouse miRNA profiles showing significantly changed expression in the aging neurovascular unit (Goodall et al., 2019). Notably, the miR-183 family members, miR-183 and miR-182 via SUMOylation control, preserve homeostasis and facilitate neuroprotection under stress conditions (Bernstock et al., 2016).
Here, the transfection of ECs with mimic-miR-183-5p induces the secretion of inflammatory response factors characteristic of endothelial dysfunction and inflammation. The accumulation of I-CAM-1, transmembrane glycoprotein regulating cell-to-cell interaction signals, characterizes late passages of ECs (Zhou et al., 2006). In line, senescence-associated I-CAM-1 overexpression was observed in conditionally immortalized human vascular smooth muscle cells (Gorgoulis et al., 2005). Also, senescent endothelial progenitor cells benefit from VEGF gene delivery, which enhances angiogenesis (Lee et al., 2021). Additionally, senescent fibroblasts secrete VEGF, suggesting its role in the senescent cell microenvironment maintenance (Coppé et al., 2010). VEGF also increases levels of miR-183-5p (Zhang et al., 2019), suggesting a feedback mechanism; thus, VEGF not only triggers angiogenesis but also influences EC senescence through miR-183-5p in defined conditions. The existing regulatory loop emphasizes the role of miR-183-5ps in facilitating the impact of VEGF (Zhang et al., 2019). TNF-α promotes EC senescence through various mechanisms, for example, upregulation of senescence marker p21 (Wan et al., 2022) and secretions of SASP factors (Nikolajevic et al., 2022). TNF-α can also induce premature senescence in endothelial progenitor cells (Zhang et al., 2009) and other cell types (Li et al., 2017) through PI3K/Akt signaling pathway activation (Li et al., 2017). Finally, V-CAM-1 adhesion molecule upregulation is likewise notable in senescent ECs (Yepuri et al., 2012). The improvement of endothelial function, often associated with the reverse action of senescence-related changes, includes V-CAM-1 and I-CAM-1 molecules (Yu et al., 2023).
Of note in the context of this study, cellular stress response by rule activates pro-survival pathways that are under the control of protective vitagenes that include, among others, members of the Hsp family, sirtuins, and the thioredoxin–thioredoxin reductase system (Brihaye et al., 2022). However, the comprehensive picture of cerebrovascular dysfunction in hyperammonemia is complex and needs further examination.
In brief, the study indicates that hyperammonemia in vivo alters cerebrovasculature density, possibly via a mechanism reflecting endothelial senescence involving miR-183-5p. Endothelial senescence, beyond the contribution to brain aging, may exacerbate cerebrovasculature dysfunction at the level of the neurovascular unit in patients with hyperammonemia. The results offer a perspective for therapeutic intervention directed at mitigating endothelium senescence, an accompanying component of cerebral dysfunction.
Materials and Methods
Animal models
Ninety-five 8- to 10-week-old and nine 48- to 53-week-old male Sprague–Dawley rats, from the outbred animal colony re-supplied by the Animal House of Mossakowski Medical Research Institute, Warsaw, Poland (Approval no. 57/2015; 473/2017 and 462/2017 of Local Ethics Committee for Animal Experimentation, Warsaw, Poland, as compliant with Polish Law), were randomized to the experimental groups. All efforts have been made to reduce the number of animals and minimize their suffering. The study complies with the Animal Research: Reporting In Vivo Experiments guidelines (study design, experimental procedures, housing and husbandry, and statistical methods) for reporting animal research. Animals were given free access to water and standard rodent chow and housed in constant temperature, humidity, and 12 h light-dark cycling.
Hyperammonemia was induced by intraperitoneal administration of OA in a dose of 600 mg per kg for 3 days. Rats were sacrificed by decapitation, and the brains were quickly removed, and the cerebral cortex and blood serum (Hindfelt, 1975a) were isolated.
RNA extraction and NGS
Total RNA was extracted from 200 μL rat plasma using the miRNeasy Serum/Plasma Advanced Kit (Qiagen, Hilden, Germany) and 20 mg of brain cortex using Invitrogen™ mirVana™ miRNA Isolation Kit (Thermo Fisher Scientific, Waltham, USA).
Plasma samples were thawed on ice and centrifuged at 12,000 g for 5 min to remove cellular debris. For each sample, 200 μL of plasma was mixed with 1 mL of Qiazol, followed by extraction steps directly according to the manufacturer’s instructions. Finally, RNA was eluted in 10 μL of nuclease-free water and stored at −80°C for further analysis.
Brain tissue samples were dispensed in 2 mL of lysis buffer in a homogenization vessel placed on ice. Next, an amount of acid-phenol: chloroform equal in volume to the homogenate volume was added and vortexed for 60 s to mix; after centrifugation for 5 min at the highest speed (10,000 g) at room temperature, the water phase was carefully removed, and RNA was eluted in 100 μL nuclease free and stored at −80°C for further analysis.
Total RNA quantification was made spectrophotometrically with a NanoDrop 2000 (Thermo Fisher Scientific, Waltham, USA), and 1 µg of total RNA was used for library preparation.
The serum NGS was performed using the DNBSEQ G400 (MGI2000) system in SE50 mode (BGI Company, Shenzhen, China). A minimum of 20 million paired-end reads were generated per sample, and quantification includes the raw read count and normalized expression level as CPM values (counts per million reads mapped) to account for the variability in the library size. Next, miRDeep2 Quantifier analysis-based miRbase2.0 library was used to identify miR sequences. The Quantifier script of the miRDeep2 tool, which applied the default parameters, was used to quantify the miR expression level.
Brain cortex NGS was conducted on a NextSeq 500 sequencing instrument. The average number of reads was 10 million per sample; next, RNA was converted into miRNA NGS libraries. Library preparation QC was performed using either Bioanalyzer 2100 (Agilent) or TapeStation 4200 (Agilent). Based on the quality of the inserts and the concentration measurements, the libraries were pooled in equimolar ratios. NGS raw data were de-multiplexed, and FASTQ files for each sample were generated using the bcl2fastq software (Illumina Inc.).
Bioinformatic analysis
To establish the subsequent procedures, brain cortex and serum NGS data were analyzed. A total of 306 identified serum and brain cortex miRNAs were taken for further analysis (Fig. 2). The miRNAs were analyzed using miRNA target prediction databases (TarBase, miRDB, TargetScan) to forecast the potential target genes regulated by selected miRNAs. ShinyGO analysis was conducted on the predicted target genes list, including their biological functions and participation in different pathways. The statistical significance was maintained by an FDR cutoff of 0.05 following database recommendations. The analysis yielded fold enrichment scores, enrichment scores, FDR values, and gene counts, which serve as robustness indicators and statistical significance of the relationship between the miRNAs and the identified pathways. The KEGG pathway analysis revealed miRNAs’ target genes, potentially associated with senescence pathways.
Cell culture
PBMECs were isolated from the brain cortex of 14-day-old or 12-month-old Sprague–Dawley male rats from the animal colony of Mossakowski Medical Research Institute, Polish Academy of Sciences, directly according to the protocol (Ruck et al., 2014). Briefly, after decapitation, brains were isolated, and cortices were dissected under sterile conditions. After homogenization, tissue was enzymatically and mechanically dissociated with 1 mL of 10 × Trypsin/and Type IV collagenase solution at 37°C for ∼30 min. Pellets followed centrifugation and cleaning steps (800 g for 5 min, ∼20°C; 1500 g for 15 min ∼20°C; 800 g for 15 min), and then the supernatant was discarded. Cells were seeded on a 6-well plate coated with collagen I (Corning, NY, USA) and cultured in Dulbecco’s modified Eagle’s medium (DMEM) containing 20% FBS and supplemented with 1.0 ng/mL basic fibroblast growth factor (bFGF) and 20 μg/mL bovine sodium heparin. In the first 2 days, puromycin was added to the culture medium to inhibit neuron and astrocyte growth. The medium was changed the next day and then every 2–3 days.
RBE4 was cultured in 24-transwell plates or 100 mm dishes (Corning, NY, USA) coated with collagen type I. Cells were cultured on the DMEM/Ham’s F10 medium with Glutamax (Gibco, Thermo Fisher Scientific, Waltham, USA) with the addition of 10% of heat-inactivated FBS, 1 ng/mL bFGF, and gentamicin (Gibco, Thermo Fisher Scientific, Waltham, USA) at 37°C in a humidified atmosphere of 95% air and 5% CO2 and cultured for 5 days when cells displayed endothelial phenotype and reached ∼90% of the surface confluence.
RBE4 was seeded at the density of 2 × 10⁴ for 5 days and reached 90% confluence. RBE4 cultured for 21-day cells served to determine senescence, with the culture media being replaced every 3 days.
For the transfection procedures, cell was seeded at density of 3.3 × 10⁵ in 24-well plates (Corning, NY, USA).
Treatment and transfection
The RBE4 cells were treated with 5 mM ammonium chloride (“ammonia”) for 24 h. Of note, the extracellular ammonium concentration was 2–3 times lower than the intracellular level in the autopsied brain tissue of patients with severe hyperammonemia (Hindfelt, 1975a, 1975b).
The transfection was carried out using the HiPerFect transfection reagent (Qiagen, Cat. No. 301704, Hilden, Germany) according to the recommendations provided by the manufacturer. The applied concentration of the mimic was 20 nM for 24 h. RBE4 cells were transfected with the following sequences: 5′-UAUGGCACUGGUAGAAUUCACU-3′ for mimic-miR-183-5p (Qiagen; Cat. No. 339173YM00471390-ADA, Hilden, Germany) and 5′-UCACCGGGUGUAAAUCAGCUUG-3′ for negative control (Qiagen Cat. No. 339173YM00479902-ADA, Hilden, Germany).
miRNA inhibition was assessed by using the Lipofectamine™ RNAiMAX Transfection Reagent (Cat. No. 13778030, Thermo Fisher Scientific, Waltham, USA), miR-183-5p specific inhibitor (Cat. No. AM12830, Thermo Fisher Scientific, Waltham, USA, with the following sequence: 5′-UAUGGCACUGGUAGAAUUCACU-3′), and specific mirVana miRNA inhibitor, negative control #1 (Cat. No. 4464076, Thermo Fisher Scientific, Waltham, USA) in concentration of 50 nM for 24 h.
Proliferation analysis
The cells were seeded in 6-well plates at a density of 1 × 10⁵ cells per well and incubated for 24 h with ammonia before real-time monitoring. The digital holograms of cells were created using the HoloMonitor M4 Digital Holography Cytometer (Phase Holographic Imaging PHI AB, Lund, Sweden). Results were computed using Hstudio M4 software, developed by Phase Holographic Imaging PHI AB, located in Lund, Sweden.
β-gal staining
Staining was performed using a β-Galactosidase Staining Kit (ab102534, Abcam, Cambridge, UK). Cells were washed with phosphate-buffered saline (PBS), fixed for 15 min at room temperature, washed, and the working solution of β-galactosidase plus X-Gal was incubated overnight at 37°C in a dry incubator (no CO2). The senescent cells were observed under an optical microscope (Nikon DIAPHOT 300) and counted from three random vision fields.
SASP analysis
TNF-α, I-CAM-1, V-CAM, and VEGF were measured using custom preconfigured ProcartaPlex Immunoassays (Cat. No. PX010-10420-901 Thermo Fisher Scientific, Waltham, USA). Cells were treated as mentioned in the Materials and Methods section, and cell-free supernatants were collected, vortexed, and centrifuged at 10,000 g for 7 min and kept at−80°C. Afterward, 50 μL of cell culture supernatants and standards was added to a custom plate. The analyte concentration was measured using the MAGPIX Multiplexing Instrument (Luminex, TX, USA) with XPonent software. Fresh culture media were used as controls for background subtraction.
RNA extraction and qRT-PCR
To separate total RNA from brain cortex, RBE4 cells, and EVs, TRI Reagent (Cat. No. T9424, Sigma-Aldrich, Missouri, USA) was used. Then, 1 µg of the RNA was reverse transcribed using the high-capacity cDNA reverse transcriptase kit (Cat. No. 10400745, Applied Biosystems, Waltham, MA, USA). RT-PCR was carried out using TaqMan assays from Applied Biosystems: p21(Rn00589996_m1), p16 (Rn00580664_m1), β-actin (Rn00667869), and TaqMan Universal PCR Master (Cat. No. 43-044-37, Applied Biosystems, Waltham, MA, USA) mix in a total volume of 10 µL, with 1 µL cDNA added. Reactions were run for 10 min at 95°C, then 40 cycles of 15 s at 95°C, and 1 min at 60°C using the ABI 7500 instrument (Applied Biosystems). The results were computed for the actin product and presented using the equation (2−ΔΔ C t) as the quantity of target, normalized to an endogenous reference, where the Ct was the target amplification threshold cycle.
To quantify miRNAs, reverse transcription and cDNA synthesis were performed using the TaqMan Advanced miRNA cDNA Synthesis Kit (Cat. No. A28007, Invitrogen, Waltham, MA, USA) according to the manufacturer’s protocol. The levels of miRNAs expression were measured by quantitative RT-PCR with a miRCURY LNA SYBR Green PCR Kit (Cat no. 339345, Qiagen, Hilden, Germany) with miRCURY LNA miRNA PCR Assay primer: rno-miR-183-5p (Cat no. QG-339306_YP00206030, Qiagen, Hilden, Germany). The snRNA U6 was used as a normalization control (Cat no. QG-339306_YP02119464, Qiagen, Hilden, Germany). The Applied Biosystems 7500 Sequence Detection System (Applied Biosystems, Foster City, CA, USA), according to the manufacturer’s instructions, was used. The relative expression levels of miRNAs were calculated using the 2−ΔΔCt.
Immunohistochemical and immunofluorescent staining
Brain cortex slices were fixed with 4% paraformaldehyde/PBS and permeabilized with 0.25% Triton X-100/PBS. Second, slices incubated with antibodies against vWF (1:400, Cat. No. ab6994 Abcam, Cambridge, UK) overnight at 4°C and then exposed to secondary antibody Alexa Fluor 488 goat anti-rabbit IgG (H + L) (1:1000, Cat. No. A11008, Thermo Fisher Scientific, Waltham, MA, USA). The nuclei were labeled with Hoechst 33258 (Cat. No.: H1398, Thermo Fisher Scientific, Waltham, MA, USA). Images were acquired in a confocal laser scanning microscope LSM780 (Zeiss, Jena, Germany) and processed using the ZEN 2012 (Zeiss, Jena, Germany). Fluorescence intensities were measured using the Image J software (NIH, Bethesda, MD, USA).
RBE4 and PBMEC cells were seeded onto collagen I-coated coverslips at 3 × 10² cells/well density and cultured for 5–7 days. Cells were rinsed with PBS and fixed with 4% paraformaldehyde/PBS and permeabilized with 0.25% Triton X-100/PBS. Second, cells were incubated with antibodies against β-Gal (1:400, Cat. No. ab616, Abcam, Cambridge, UK), p53 (1:400, Cat. No. ab131442, Abcam, Cambridge, UK), p16 (1:250, Cat. No. 80772, Cell Signalling, MA, USA), p21 (1:300, Cat. No. ab188224, Abcam, Cambridge, UK), and CD-31 (1:400, Cat. No. ab28364, Abcam, Cambridge, UK) and incubated overnight at 4°C and then exposed to secondary antibody Alexa Fluor 488 goat anti-rabbit IgG (H + L) (1:1000, Cat. No. A11008, Thermo Fisher Scientific, Waltham, MA, USA).
Images were acquired in a confocal laser scanning microscope LSM780 (Zeiss, Jena, Germany) and processed using the ZEN 2012 (Zeiss, Jena, Germany). To quantify fluorescence intensity, the images were rescaled to achieve a magnification factor of 20. Furthermore, normalization was performed to account for variations in exposure time across all samples. Fluorescence intensity was measured in 8–10 regions of interest using ImageJ (Fiji) software, with background fluorescence subtracted in both control and analyzed pictures. Integrated density was measured using ImageJ software to quantify signal intensity. Images were converted to 8-bit grayscale. The integrated density, defined as the sum of pixel intensities within the image, was extracted for quantitative analysis. Measurements were performed on at least 8–10 regions to ensure reproducibility.
EV isolation and immunocytochemical staining
EVs were isolated from the culture media of RBE4. A total of 106 cells were grown on 100 mm2 cell culture dishes. The supernatants of the cell culture were gathered and subjected to centrifugation at a force of 200 g for 10 min, followed by another centrifugation at a force of 500 g for 10 min at a temperature of 4°C. The resulting samples were divided into smaller portions and stored at a temperature of −70°C for future utilization. Cell culture supernatants were thawed, spun down at 2000 g for 20 min to remove cellular debris, and then centrifuged at 100,000 g for 75 min at 4°C. The pellets were rinsed with deionized PBS (DPBS) and then underwent additional centrifugation at 100,000 g for 75 min at 4°C. Next, the supernatant was removed, and the pellet was resuspended in 1 mL of DPBS and kept at a temperature of −70°C until it was required.
The isolated EVs were rinsed with PBS, centrifuged for 100,000 g for 20 min, fixed with 4% paraformaldehyde/PBS, and permeabilized with 0.25% Triton X-100/PBS. Then EVs were incubated with antibody against CD-9 (1:400, Cat. No. ab223052, Cambridge, UK) and incubated overnight at 4°C and then exposed to secondary antibody Alexa Fluor 488 goat anti-rabbit IgG (H + L; 1:1000, Cat. No. A11008, Thermo Fisher Scientific, Waltham, MA, USA).
FCS analysis
FCS measurements of EVs were conducted using a Nikon Eclipse TE2000U confocal microscope coupled with Pico Harp 300 FCS equipment (PicoQuant, Germany). We used a 60× objective (N.A. 1.2) with water immersion. A 561 nm pulsed diode laser was used to excite the fluorescence of labeled exosomes. The fluorescence photons were collected using Single-Photon Avalanche Diodes (MPD and PerkinElmer). A 594 long-pass filter (Chroma, USA) was positioned in the optical path before the detector. The laser power was equal to 16 µW.
The confocal volume was characterized during calibration using a nanomolar solution of rhodamine B in PBS. All measurements were conducted at 25 ± 0.5°C temperature and maintained by a climate chamber (Okolab, Italy). Twenty independent FCS measurements, lasting 120 s, were performed for the tested sample.
Obtained FCS data were fitted with one component anomalous diffusion model, using Equation 1.
The QiuckFit 3.0 software (DKFZ, Germany) was used to fit the appropriate mathematical model to the FCS curves. The fitted parameter was the diffusion time of exosomes (one component). Based on the value
The hydrodynamic radius of fluorescent exosomes, Rh, was calculated using the Stokes–Sutherland–Einstein equation:
The principle of FCS measurements is presented in Figure 8. First, the focal volume was positioned within the tested sample. Then, the SymphoTime software (PicoQuant, Germany) captured a fluctuation record of the fluorescence intensity of molecules diffusing through this volume. Using mathematical processing, detected fluctuations were represented as an autocorrelation curve. Finally, we fit the obtained FCS curve by an appropriate mathematical model, describing the process inside the tested sample.

Statistical analysis
Data were analyzed and visualized using Prism 7 (GraphPad Software Inc., La Jolla, USA). Results were presented as mean ± standard deviation. The statistical significance between various groups or treatments was measured by unpaired t test or one-way analysis of variance with Dunnett’s post hoc test. In all experiments, p value <0.05 was considered to be statistically significant, ****p < 0.0001, ***p < 0.001, **p < 0.01, *p < 0.05.
Footnotes
Authors’ Contributions
K.O.G.: Conceptualization (equal), data acquisition and methodology (equal), data analysis (lead), and writing and original draft preparation (equal). K.M., A.M., A.E.M., and K.K.: Data acquisition and methodology. M.O.M.: Data acquisition. M.Z.: Conceptualization (equal), writing and original draft preparation (equal), writing, review, and editing (lead), and funding acquisition (lead).
Data Availability
The datasets used and analyzed during this study are available from the corresponding author upon reasonable request.
Ethics Approval
Animal experiments were performed at Mossakowski Medical Research Institute, Polish Academy of Sciences Warsaw conformed to the legislations for animal protection and care in the European Community Council Directive (2010/63/EU) and were approved by the 4th Local Ethics Committee for Animal Experimentation, Warsaw, Poland (approval no. 57/2015).
Author Disclosure Statement
The authors declare no competing interests.
Funding Information
This work was supported by the National Science Centre of Poland No. 2015/19/B/NZ4/01902 and ESF POWR.03.02.00-00-I028/17-00. Aneta Magiera was supported by the Foundation for Polish Science (FNP) through the START scholarship.
Supplementary Material
Supplementary Data
Supplementary Figure S1
Supplementary Figure S2
Supplementary Figure S3
Supplementary Table S1
Supplementary Table S2
Supplementary Table S3
Abbreviations Used
References
Supplementary Material
Please find the following supplemental material available below.
For Open Access articles published under a Creative Commons License, all supplemental material carries the same license as the article it is associated with.
For non-Open Access articles published, all supplemental material carries a non-exclusive license, and permission requests for re-use of supplemental material or any part of supplemental material shall be sent directly to the copyright owner as specified in the copyright notice associated with the article.