
Abstract
Aims:
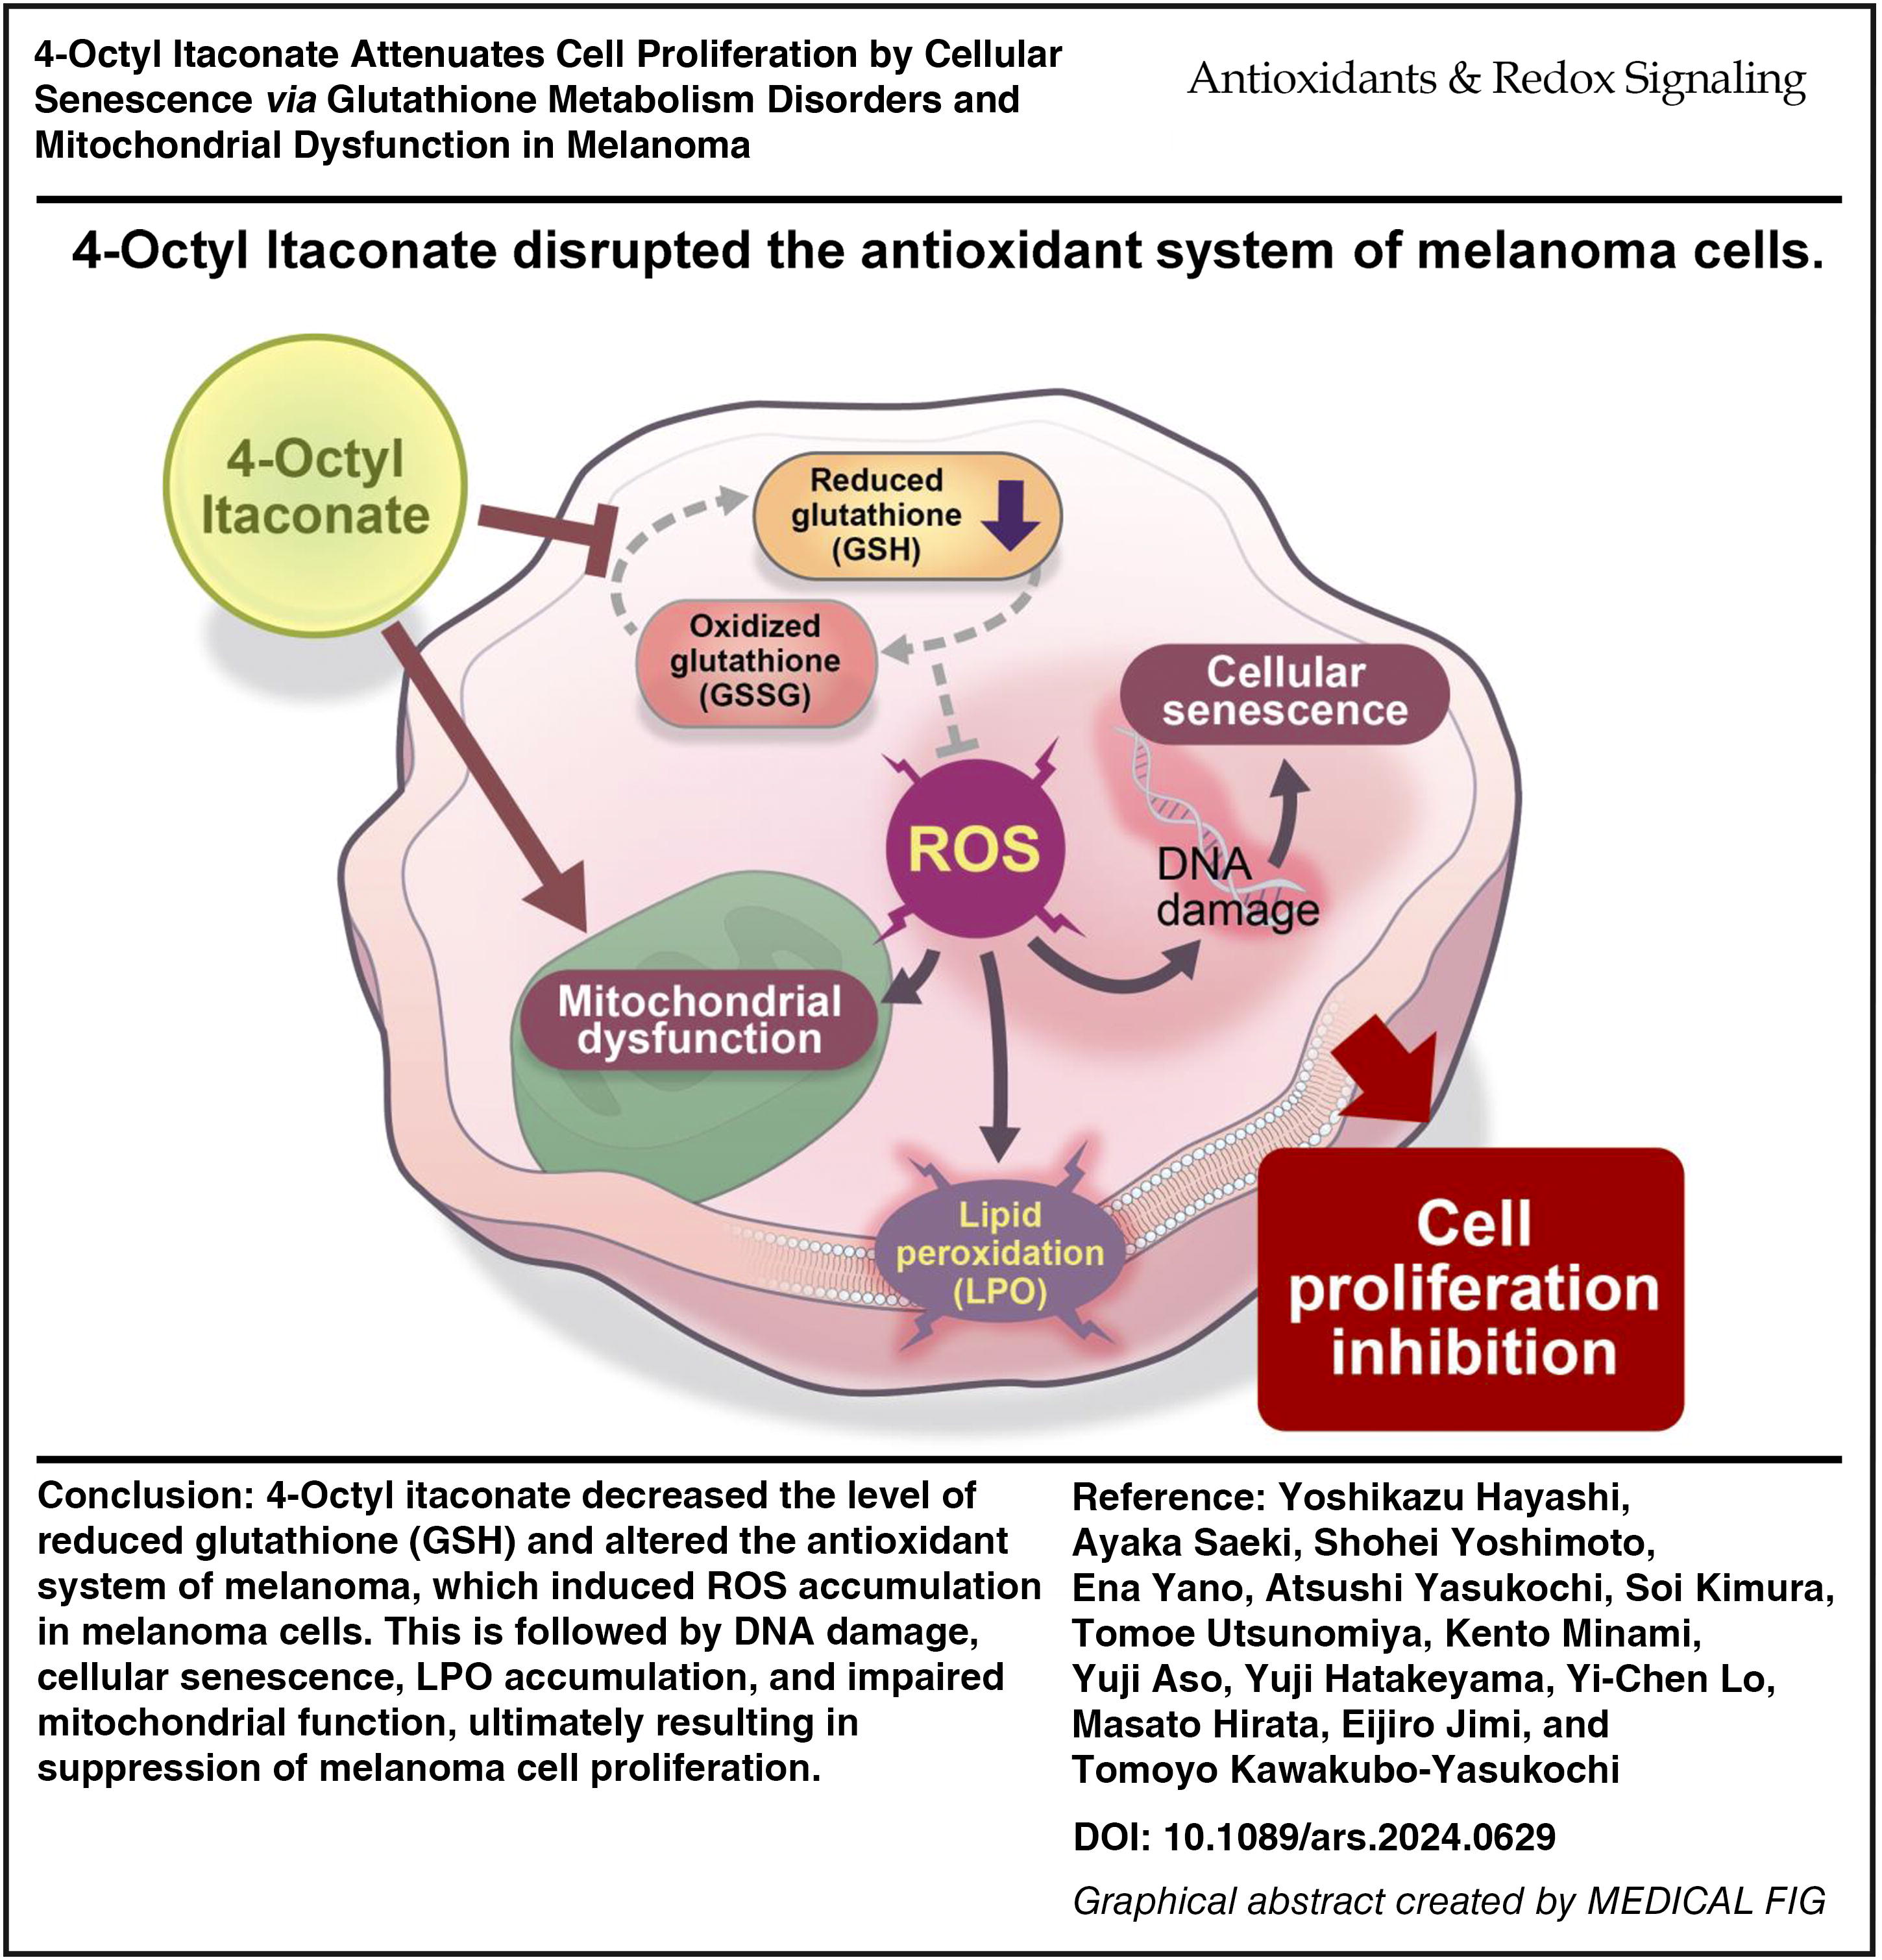
Itaconate (IA) is synthesized in the citric acid cycle via cis-aconitate decarboxylase (ACOD1); however, its biological significance in cancer remains incompletely understood. In previous studies, 4-octyl itaconate (OI) was used as a membrane-permeable form of IA, but little detailed verification of the difference in biological activities between IA and OI exists. Here, we investigated the direct effects of IA and OI on melanoma.
Results:
The proliferation of melanoma cells treated with OI was significantly suppressed in vitro, and our transcriptomic analysis revealed drastic changes in the expression of glutathione metabolism-related genes in OI-treated cells. Indeed, OI treatment decreased intracellular glutathione levels, followed by increased production of reactive oxygen species and expression of γH2AX, a marker of DNA damage, and β-galactosidase, a marker of cellular senescence. We further showed that the mitochondrial respiratory capacity in B16 cells was significantly decreased by OI treatment. OI administration also suppressed the growth of B16 tumor transplants in vivo, and the expression of γH2AX was increased in tumor tissues of OI-treated mice. In addition, minimal effects of OI treatment were observed in melanocytes and normal tissues. We also proved that not only exogenous IA, which enters intracellularly, but also endogenous IA has little effect on melanoma proliferation activity, via an investigation using Acod1-overexpressing transfectants and Acod1-deficient mice.
Conclusion:
This work revealed that OI disrupts the antioxidant system via the collapse of glutathione metabolism and inhibits cancer cell proliferation. Antioxid. Redox Signal. 42, 547–565.
Introduction
Although medical science has advanced rapidly in recent decades, cancer remains a leading cause of death worldwide and accounted for nearly 10 million deaths in 2020, or almost one in six deaths, according to the World Health Organization (World Health Organization, 2022). Although it usually involves severe side effects on normal cells and tissues, chemotherapy is one of the most important treatments for cancer and has a long history (Muggia et al., 2015). The development of molecular targeted drugs that exploit the characteristics of cancer and have the advantage of having fewer side effects than existing anticancer drugs has progressed since the beginning of the 21st century (Zhong et al., 2021). However, they have limitations, such as only applying to patients with specific biomarker-expressing tumors (Zhong et al., 2021). In addition, previous studies demonstrated that combining two or more different drugs with either a chemotherapy drug or a molecular targeted drug exerts more synergistic antitumor effects than single-drug treatment (Jaaks et al., 2022). Therefore, a novel strategy for administering chemical substances is still required to overcome cancer progression.
Innovation
This study focused on a comparison between itaconate (IA), a potentially anti-inflammatory metabolite which had been thought not to permeate cell membranes, and its derivative 4-octyl itaconate (OI), a membrane-permeable form of IA. This is the first study about the anticancer activities of IA and OI, and whether they differ. Our findings highlight that IA could easily permeate cell membranes and that the antioxidant system of cancer cells was impeded by OI, but not by IA, by the abolition of glutathione metabolism, along with the reduction of cancer cell proliferation. These results should lead to the development of OI as an anticancer agent.
Recently, several publications have highlighted the role of amino acids in cancer metabolism, and the tricarboxylic acid (TCA) cycle has been highlighted as an important mechanistic example of amino acid involvement in cancer (Lieu et al., 2020). Itaconate (IA), a TCA cycle metabolite, was discovered in 1836 by Samuel Baup (Baup, 1836), who found it to be a product of the thermal decomposition of aconitate and named it “itaconate” by Crasso in 1840 by rearranging the letters of “aconitate” (Crasso, 1840; O’Neill and Artyomov, 2019; Turner, 1840). In Krebs’s original laboratory notebooks, IA is recorded as one of the intermediate metabolites along with succinate, oxaloacetic acid, and malic acid; however, it was thought at the time that IA, unlike succinate and malic acid, did not affect mammalian metabolism at all (Holmes, 1993). In the 21st century, focus has been placed on the biological roles of IA and IA-synthesizing cis-aconitate decarboxylase (ACOD1). For example, the expression of IA and ACOD1 was found to be notably increased in the lungs of mice infected with tuberculosis (Shin et al., 2011) and in RAW264.7 macrophages activated by lipopolysaccharide treatment (Strelko et al., 2011; Sugimoto et al., 2012). In addition, IA is a factor that regulates the glycolytic pathway and promotes the accumulation of succinate in mitochondrial respiration, which regulates macrophage metabolism and inhibits inflammation (Cordes et al., 2016; Lampropoulou et al., 2016). Endogenous IA can activate Activating transcription factor 3 (ATF3)-mediated stress responses (Bambouskova et al., 2018). In addition, Nuclear factor erythroid 2-related factor 2 (NRF2), a transcription factor that regulates the expression of genes involved in oxidative stress response and drug detoxification (He et al., 2020), is activated by IA via the alkylation modification of Kelch-like ECH-associated protein 1, which inhibits succinate dehydrogenase and suppresses Interleukin (IL)-1β production, thereby exerting an anti-inflammatory function (Mills et al., 2018). These previous studies suggest that IA is an important metabolite in various pathophysiological events in mammals. However, IA and its analogs, such as 4-octyl itaconate (OI), had been recognized to have similar effects in many previous studies because IA had been thought to have very low cell permeability (Li et al., 2023; Mills et al., 2018). Thus, IA derivatives such as OI were used in studies as cell-permeable itaconic acids (Li et al., 2023; Mills et al., 2018), which often resulted in controversial outcomes regarding the bioactivities of ACOD1, IA, and OI, as reported by Swain et al. (Swain et al., 2020). Recently, it was revealed that not only OI but also IA can permeate cell membranes, suggesting that these molecules have different cellular activities (Swain et al., 2020). OI regulates the Nrf2 signaling pathway and significantly suppresses the production of proIL-1β and IFN but not IA. These observations suggest that subtle alterations in the molecular structure can also lead to notable differences in their effects on cancer cells, as reported previously with other molecules (Dugave and Demange, 2003).
Abnormal cellular energy metabolism has been suggested as a hallmark of cancer progression, and various metabolites involved in cancer progression have been discussed. Cancer cells depend on several metabolic processes, which promote their survival. One example includes the Warburg effect; this phenomenon involves energy production through glycolysis, a less efficient ATP production process than in oxidative phosphorylation (Cairns et al., 2011; Warburg, 1956). Cancer cells also have modified antioxidant systems that confer stress tolerance on the cells (Harris et al., 2015). However, the roles of IA, IA derivative, and ACOD1 in cancer progression have remained largely unknown. Therefore, in this study, we investigated the direct effects of IA and OI on cancer cells using murine and human melanoma cells.
Results
Effects of IA and IA derivative on the viability of melanoma cells in vitro
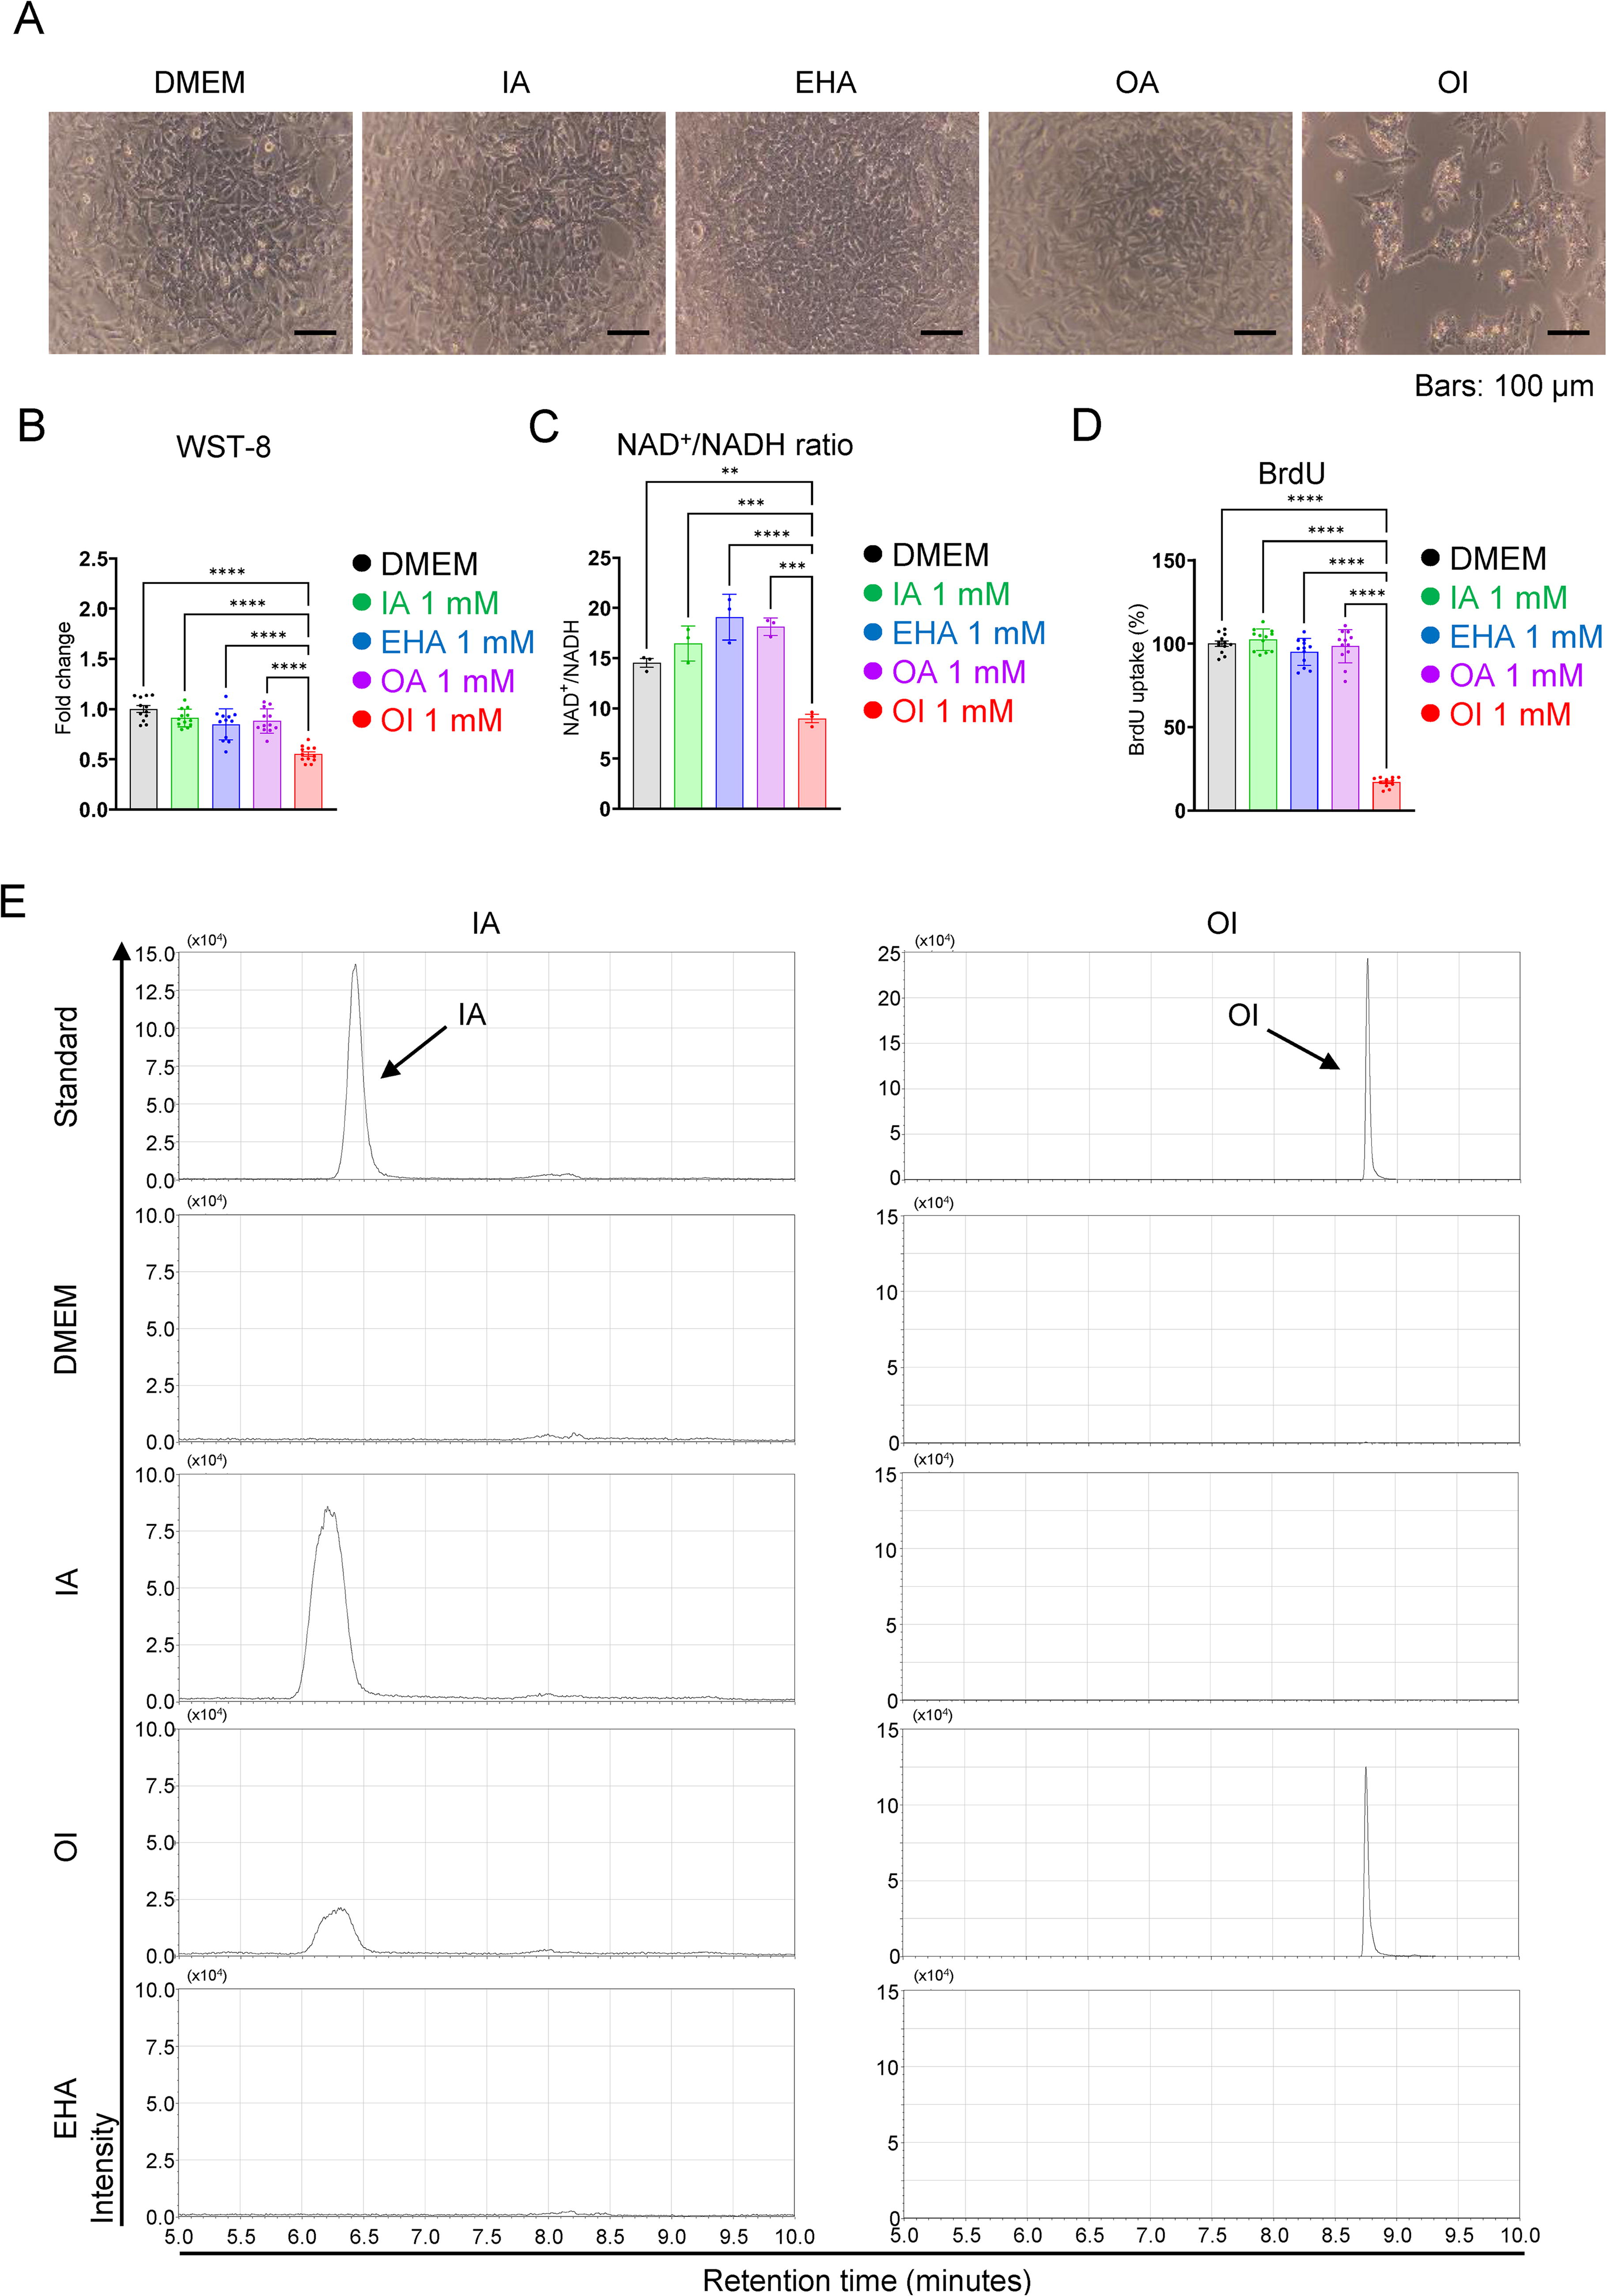
First, we examined the direct effects of IA, OI, or 2-ethylhexanoic acid (EHA) and octanoic acid (OA; Supplementary Fig. S1) as a control of OI on B16 cell viability. The proliferation of B16 cells was significantly suppressed by treatment with OI (1 mM) for 24 h (Fig. 1A, B). However, IA (1 mM), as well as EHA and OA, did not affect the rate of cell proliferation, as evaluated by WST-8 and BrdU assays (Fig. 1A–D). In addition, the effect of OI was concentration-dependent (Supplementary Fig. S2A), and its tumor-suppressive effect was also observed in human melanoma cell lines COLO679 and G361 (Supplementary Fig. S2B-C). We also confirmed that OI significantly reduced the NAD+/NADH ratio (Fig. 1C). Next, we investigated the intracellular permeability of IA and OI and their kinetics (from OI to IA) using each cell extract by mass spectrometry and confirmed that administered OI was mainly detected as OI, with a retention time of 8.8 min; only a portion of it was converted to IA, which was detected with a retention time of 6.4 min, in the cells (Fig. 1E). In addition, administered IA was detected as intracellular IA (Fig. 1E). Furthermore, to investigate whether endogenous IA affects tumor growth, we established stably Acod1-expressing B16 (B16-Acod1OE ) cells because B16 cells do not express Acod1 (Weiss et al., 2018), which is an IA-producing enzyme (Chen et al., 2019; Strelko et al., 2011). We confirmed Acod1 expression (Fig. 1F–H) and IA production in the B16-Acod1OE cells (Fig. 1I). The WST-8 assay revealed no difference between B16-Mock and -Acod1OE cells in terms of morphology (Fig. 1J), cell viability (Fig. 1I), and cell metabolic activity (Fig. 1L). These results indicate that intracellular OI exerts tumor-suppressive effects on melanoma cells.
OI treatment altered the expression levels of genes related to glutathione metabolism in B16 cells
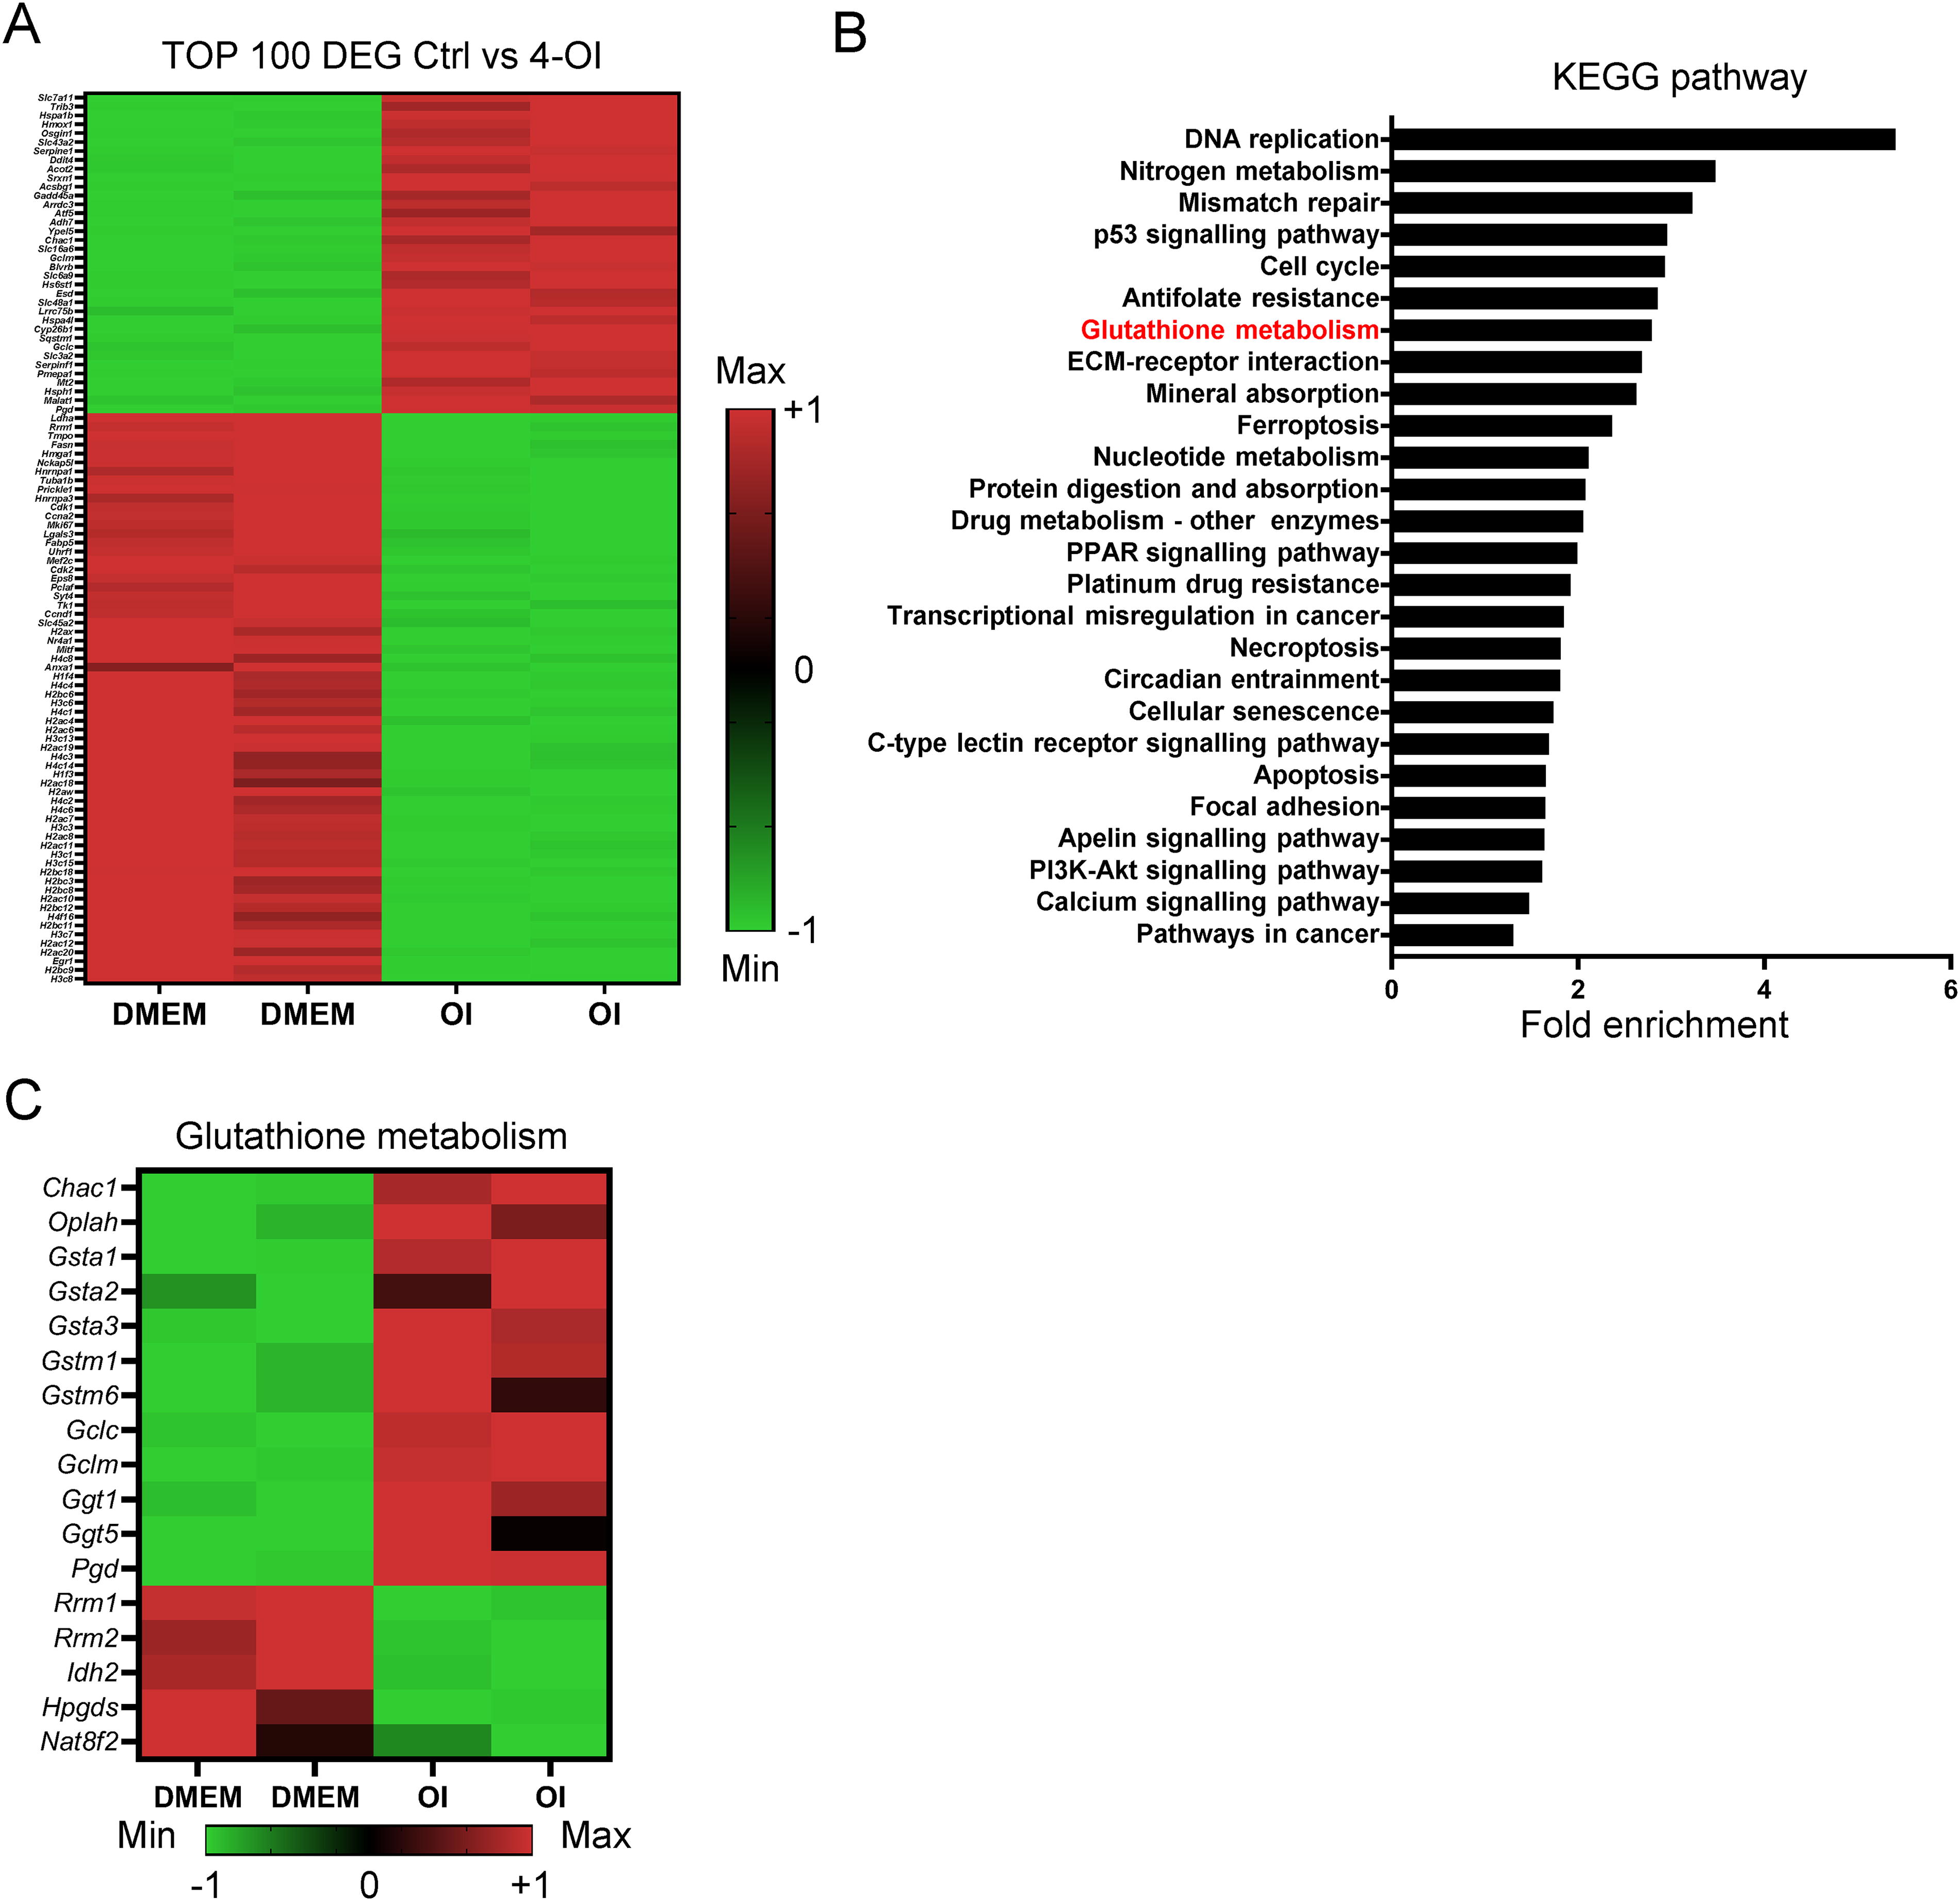
B16 cells subjected to control treatment or OI treatment for 24 h were used for transcriptomic analysis to elucidate the molecular mechanism underlying the anticancer effects of OI (Fig. 2A). KEGG pathway analysis revealed that several pathways, including glutathione metabolism, were significantly enriched upon OI treatment (Fig. 2B). In particular, the expression levels of glutathione-related genes in B16 cells were drastically altered by OI treatment, with the upregulation of Chac1 (ChaC glutathione-specific gamma-glutamylcyclotransferase 1), Oplah (5-oxoprolinase, ATP-hydrolyzing), Gsta1 (glutathione S-transferase alpha 1), Gsta2 (glutathione S-transferase alpha 2), Gsta3 (glutathione S-transferase alpha 3), Gstm1 (glutathione S-transferase mu 1), Gstm6 (glutathione S-transferase mu 6), Gclc (glutamate-cysteine ligase catalytic subunit), Gclm (glutamate-cysteine ligase modifier subunit), Ggt1 (gamma-glutamyltransferase 1), Ggt5 (gamma-glutamyltransferase 5), and Pgd (phosphogluconate dehydrogenase); and the downregulation of Rrm1 (ribonucleotide reductase catalytic subunit M1), Rrm2 (ribonucleotide reductase catalytic subunit M2), Idh2 (isocitrate dehydrogenase [NADP(+)]2), Hpgds (hematopoietic prostaglandin D synthase), and Nat8f2 (N-acetyltransferase 8 family member 2) (Fig. 2C). Subsequently, we validated the relative expression levels of these 17 genes at the mRNA level (Fig. 2D and Supplementary Fig. S3) and OPLAH, GSTA1, and GSTA2 at the protein level (Fig. 2E). Given that glutathione-mediated signaling events are well known as hallmarks of viable cells (Bansal and Simon, 2018; Kumar et al., 2012), these results suggest that OI exerts its anticancer effects via glutathione metabolism disorders. We further revealed that the expression level of the p21 gene (Cdkn1a [cyclin-dependent kinase inhibitor 1a]), functioning in cell cycle checkpoint regulation, was significantly elevated by OI treatment (Fig. 2F), and the expression of Cdk1 (cyclin-dependent kinase 1), a kinase that regulates the onset of mitosis, was decreased accordingly (Fig. 2F). These results suggest that OI administration also affected the checkpoint activation in melanoma cells. In addition, the expression levels of nitrogen metabolism-related genes were also differentially changed in Figure 2B, and we found that the expression levels of the nitric oxide synthase genes (nitric oxide synthase 1, nitric oxide synthase 2, nitric oxide synthase 3; Fig. 2G) and the amount of NO2 were significantly increased by OI stimulation (Fig. 2H). This suggests that OI disrupts the redox/reactive oxygen species (ROS)/nitric oxide (NO) homeostasis, which contributes to the reactive species interactome (Cortese-Krott, 2023).
OI treatment induces ROS accumulation and cellular senescence in B16 cells
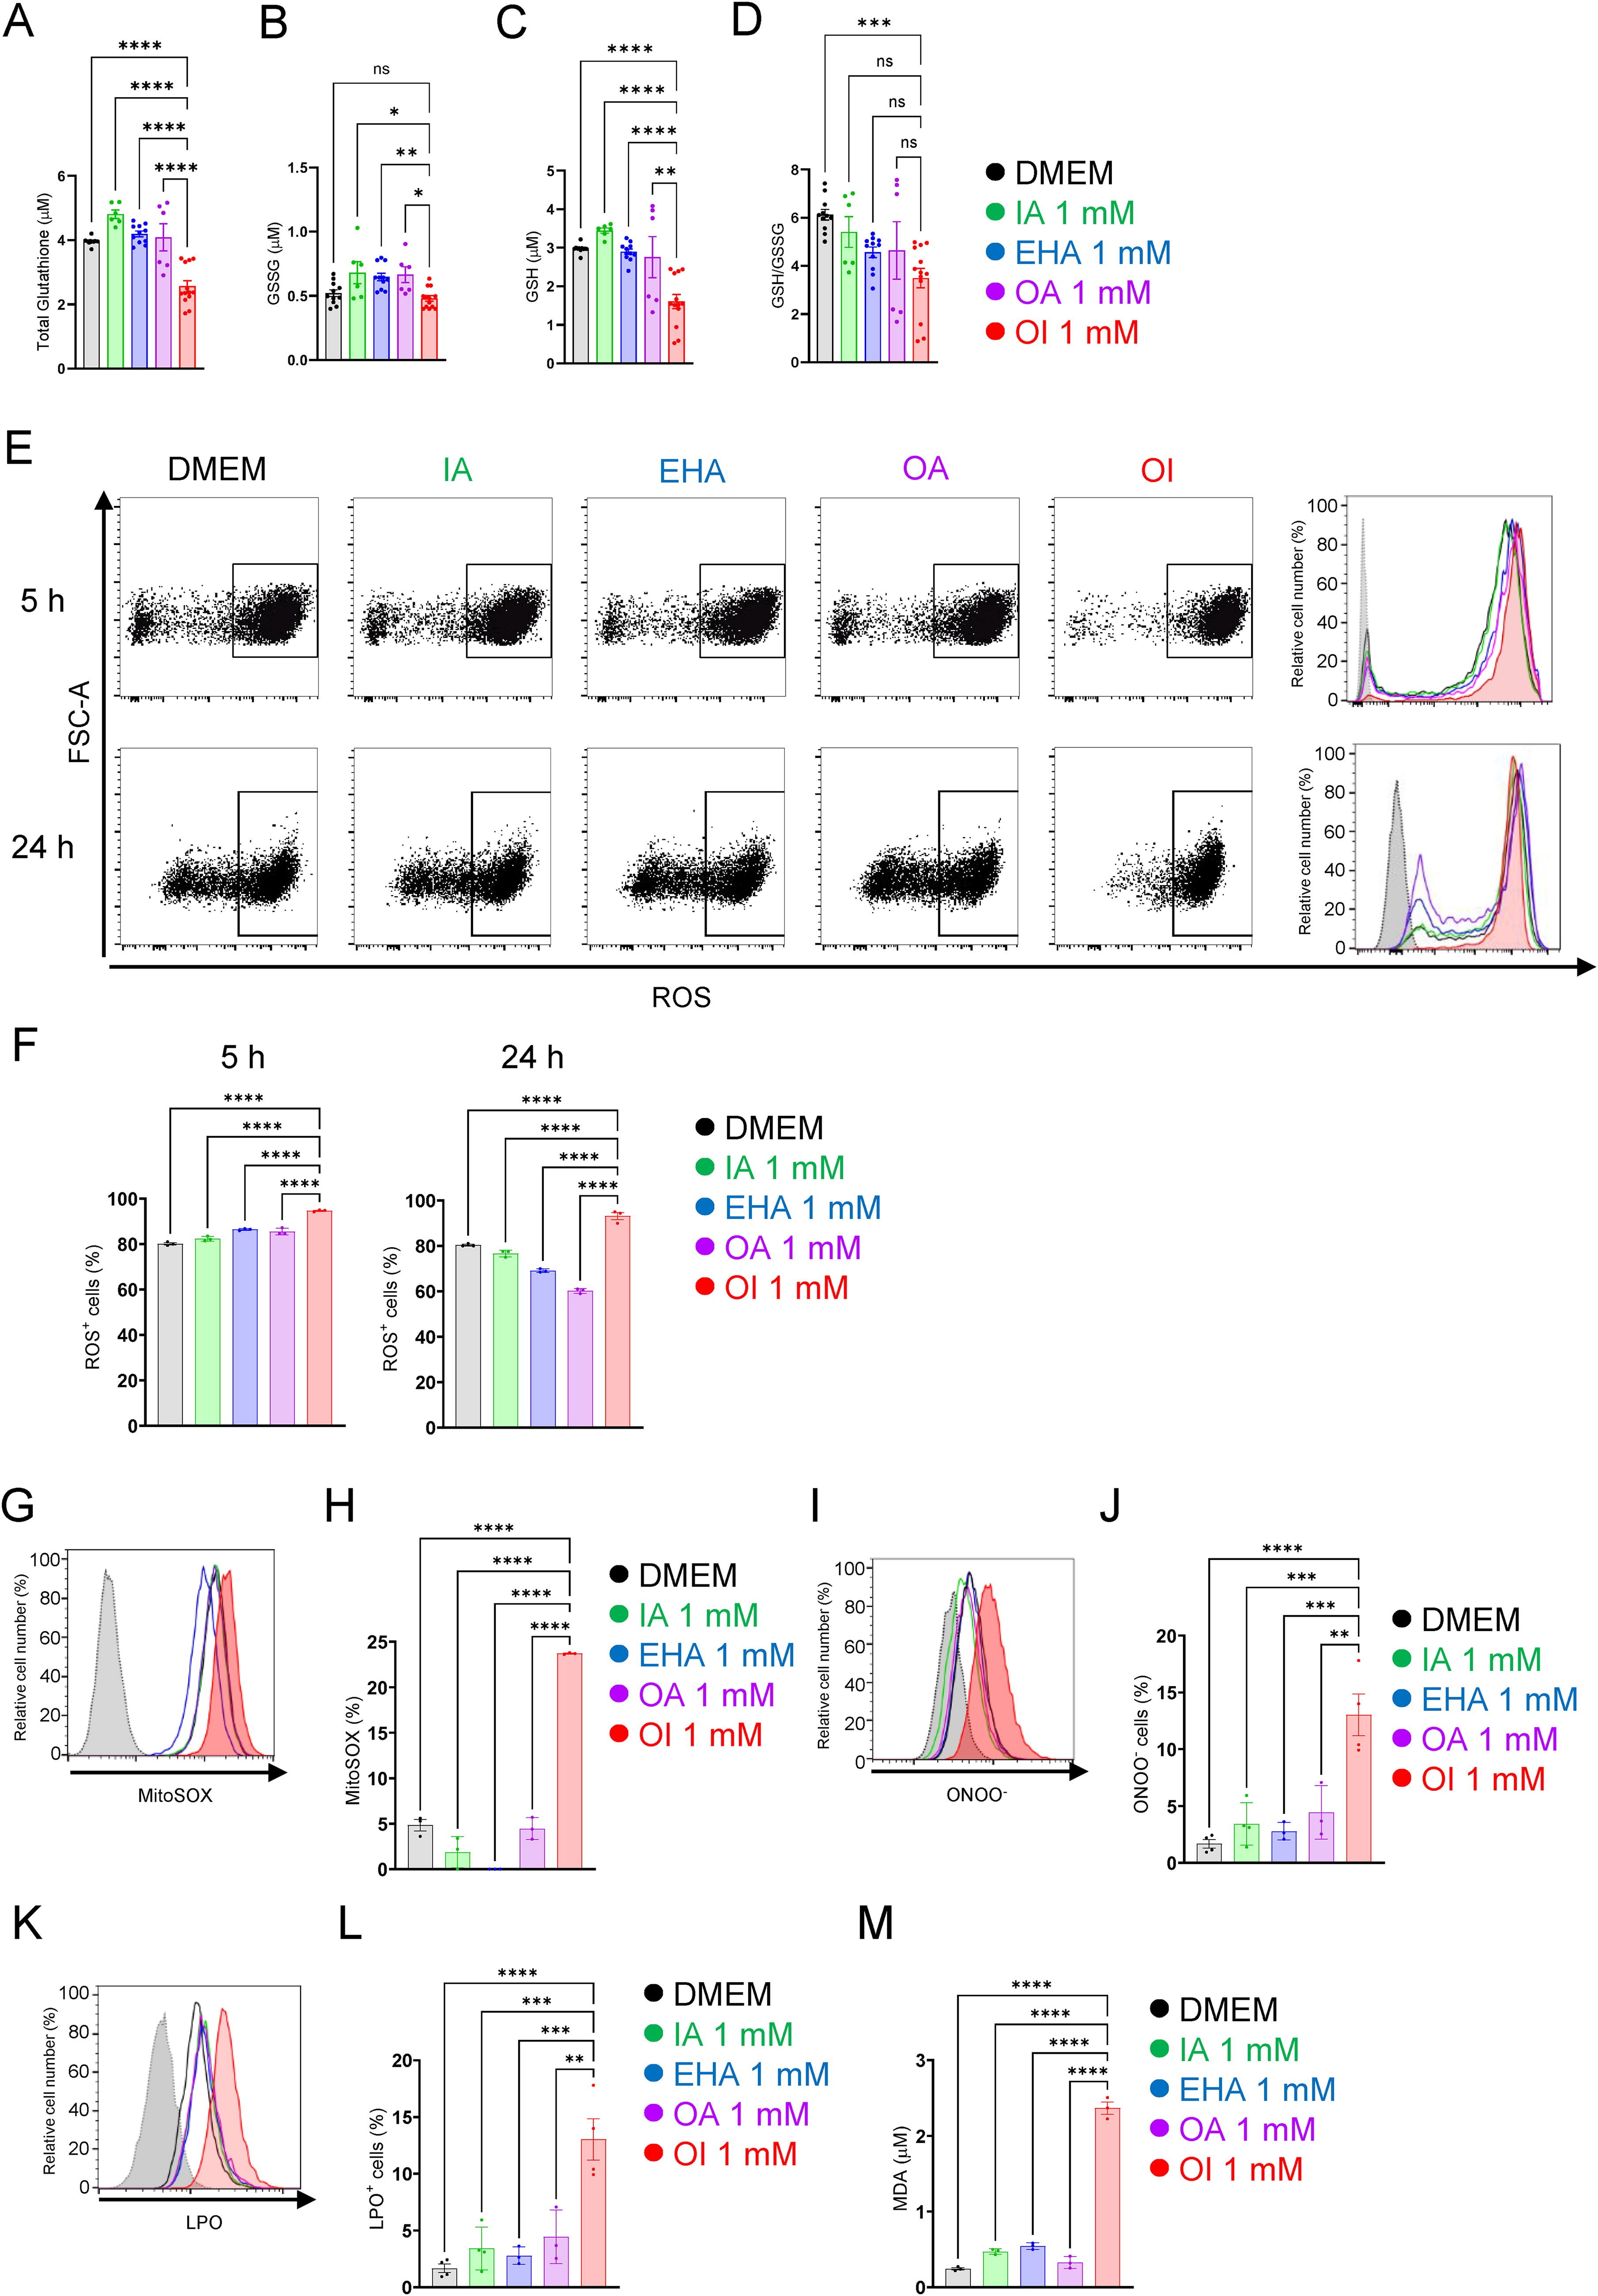
Subsequently, we determined whether these genetic changes are linked to intracellular events. Glutathione, a tripeptide that contains L-cysteine, L-glutamic acid, and glycine, exists typically in its reduced form (reduced glutathione [GSH]), which is considered to be one of the most important scavengers of ROS and is converted to its oxidized form (oxidized glutathione [GSSG]) by stimulation such as oxidative stress (Forman et al., 2009). Thus, glutathione metabolism is essential for cellular antioxidant defense and the regulation of various cellular events (Forman et al., 2009). Our data revealed that the total amount of glutathione was significantly decreased to ∼50% compared with that of the control 5 h after OI challenge (Fig. 3A). In addition, reduced form (GSH) was reduced by OI treatment (Fig. 3B–D). Next, we investigated whether the decrease in glutathione could induce the intracellular accumulation of ROS. Flow cytometry analysis revealed that the level of intracellular ROS was significantly increased in OI-treated B16 cells compared with that treated with Dulbecco’s modified Eagle’s medium (DMEM), IA, EHA, or OA, 5 and 24 h after administration of each molecule (Fig. 3E, F). Additionally, the OI-treated cells had higher mitochondrial O2- levels than in control groups (Fig. 3G, H). Furthermore, peroxynitrite (ONOO-; Szabó et al., 2007), a reactive product of the reaction of nitric oxide and superoxide radicals, was also increased by OI treatment (Fig. 3I–J). OI treatment also significantly increased the levels of lipid peroxidation (LPO) and malondialdehyde (MDA) that is a secondary product of LPO (Fig. 3K–M), which satisfied the evidence that higher levels of ROS lead to irreversible cellular damage, such as nuclear damage, cellular senescence, and LPO (Zhu et al., 2022). As shown in Figure 3N and O, the number of γH2AX granules in nuclei, a marker of nuclear damage, was markedly increased in B16 cells treated with OI for 5 h. Moreover, β-galactosidase (Fig. 3P, Q), which is a cellular senescence marker, was also increased by OI treatment in B16 cells. Previous studies reported that ferroptosis is an iron-dependent form of programmed cell death induced by the loss of glutathione function (Dixon et al., 2012); therefore, we investigated whether OI could induce ferroptosis. The results revealed that a ferroptosis inhibitor did not rescue the inhibitory effect of OI on the growth of B16 cells (Supplementary Fig. S4), suggesting that the OI-associated antitumor effect is unrelated to ferroptosis. Meanwhile, caffeic acid phenethyl ester, an inhibitor of glutathione S-transferases (Gülçin et al., 2016), at 100 μM or more rescued the viability of B16 cells treated with 1 mM OI (Fig. 3R). These results suggest that OI induces the accumulation of ROS via glutathione metabolic disorders, which can in turn suppress the proliferation of B16 cells.
OI impairs mitochondrial respiratory capacity
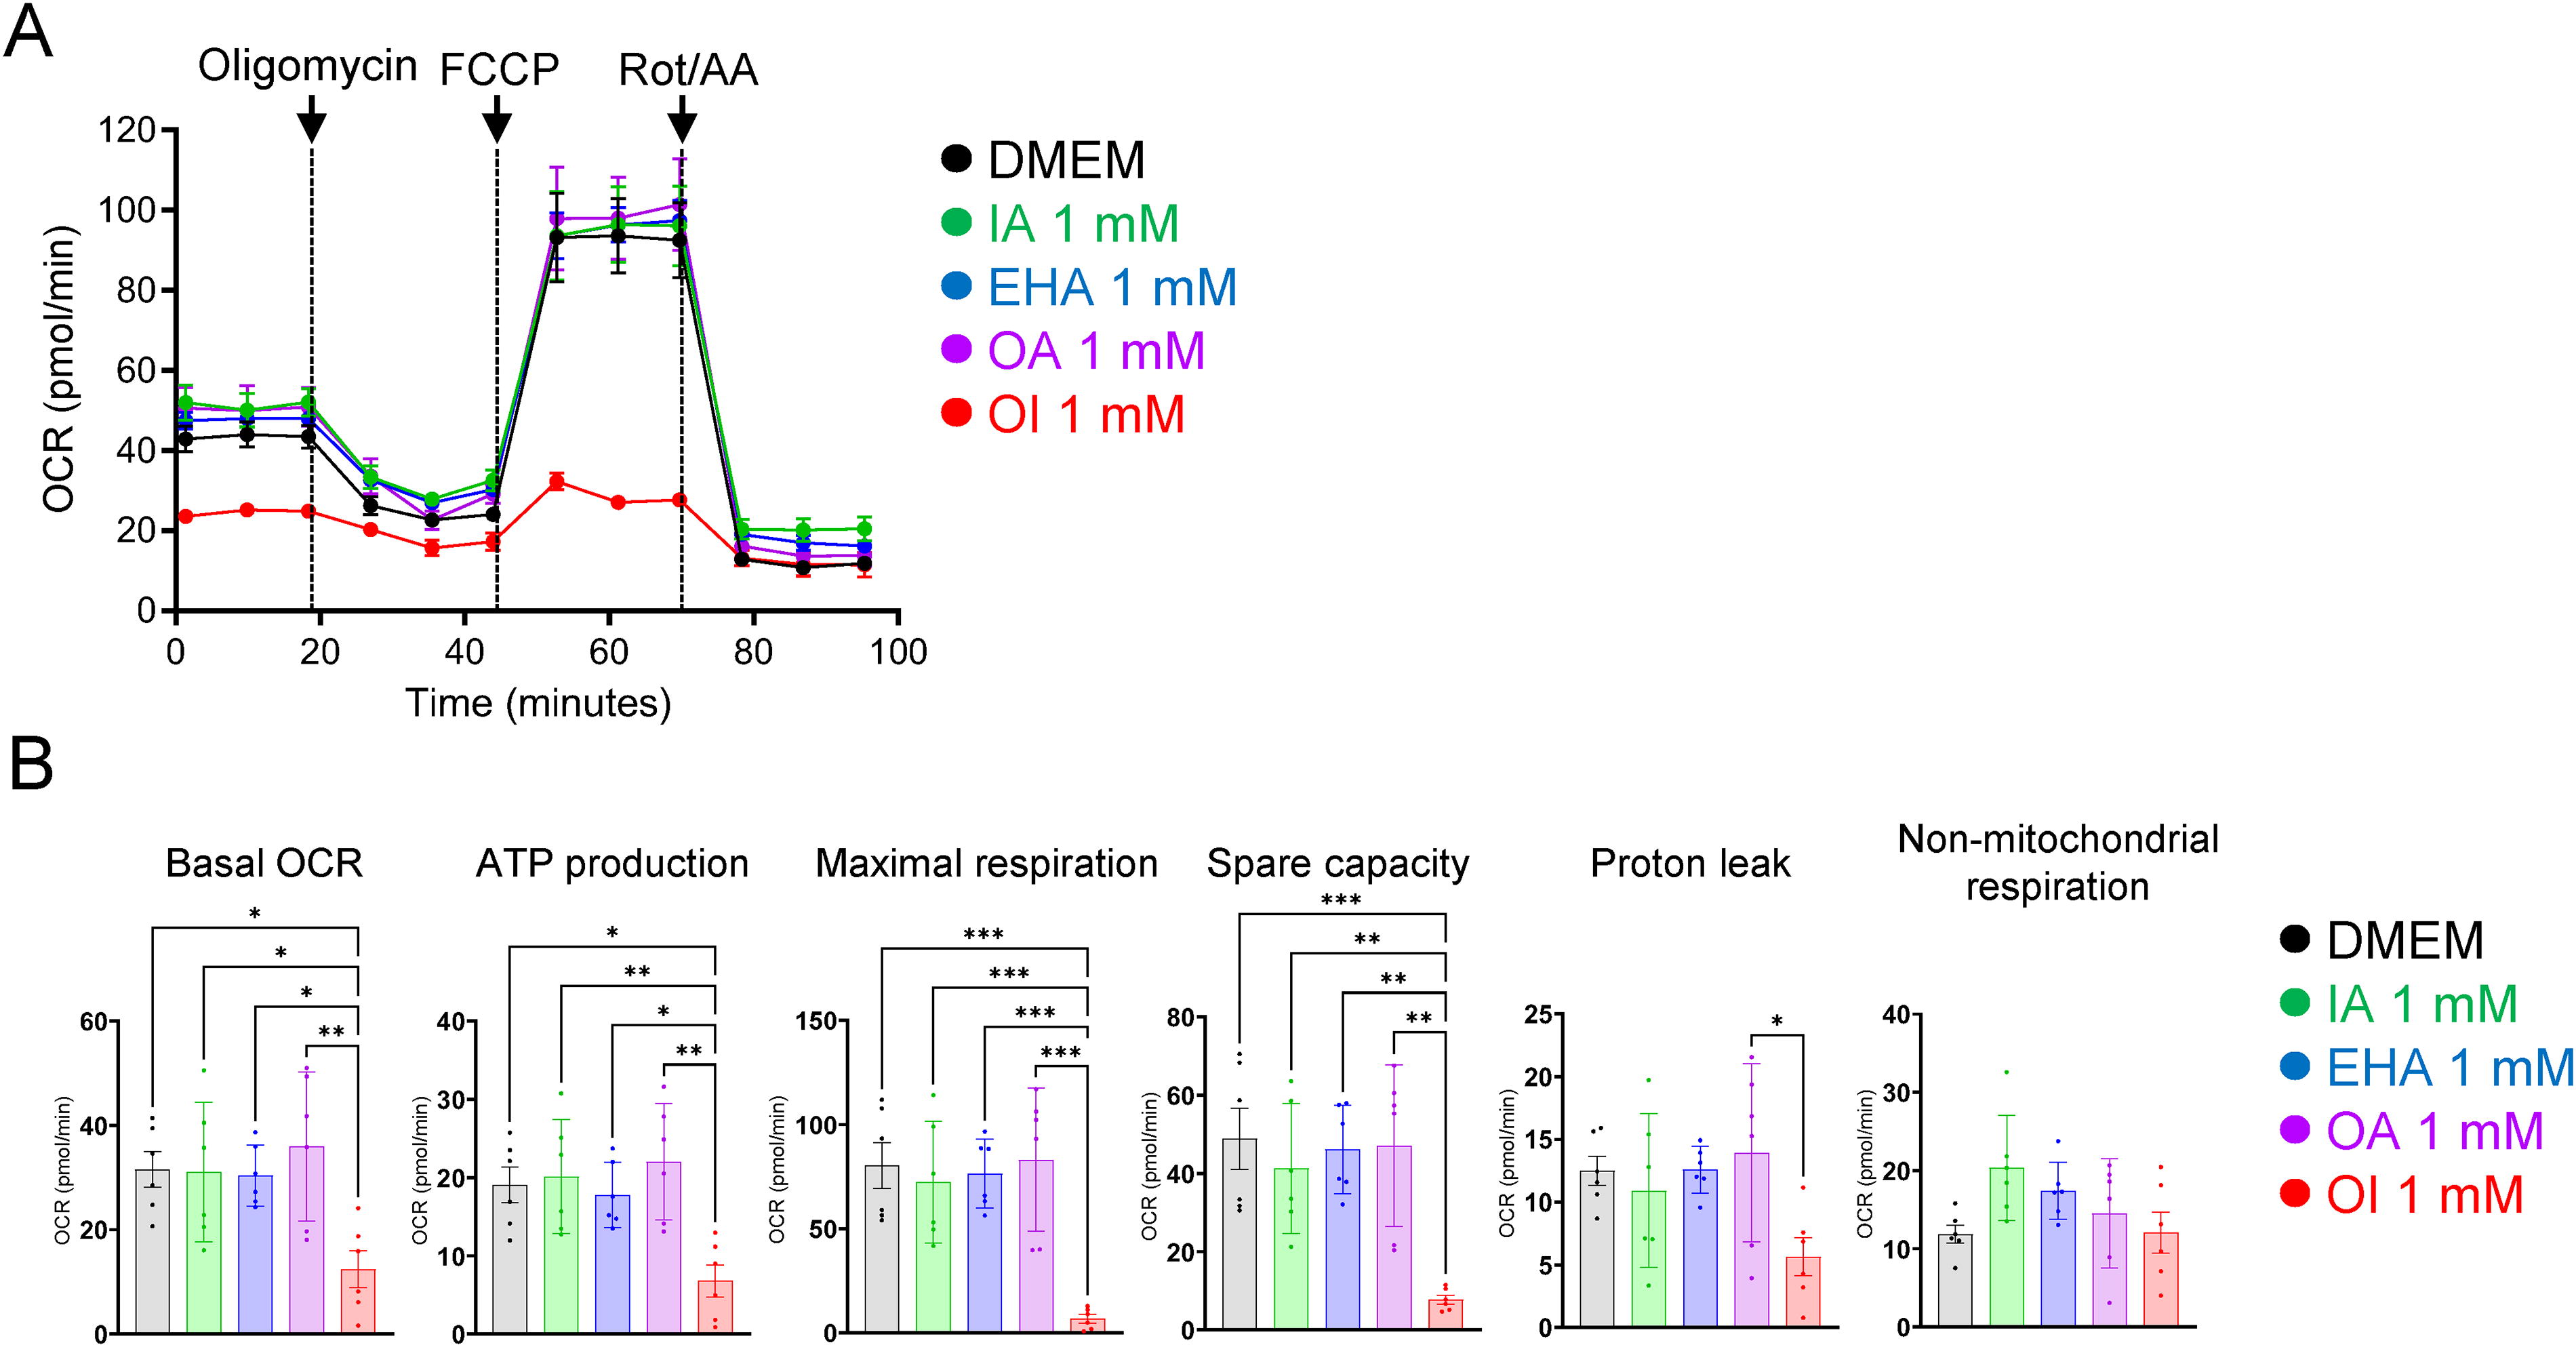
Previous studies have shown that ROS accumulation is associated with mitochondrial dysfunction (Phadwal et al., 2021). We thus assessed mitochondrial respiratory capacity after the OI challenge using the XFe24 Extracellular Flux Analyzer (Agilent Technologies [formerly Seahorse Bioscience]), with which cellular oxygen consumption and changes in the concentration of hydrogen ions leaving the cell can be measured in living cells as oxygen consumption rate (OCR).
In this assay, cells are treated with 1.5 µM oligomycin, an ATP inhibitor used for quantifying the amount of oxygen used for ATP production; 2 µM FCCP, an uncoupling agent used for determining the spare capacity; and 0.5 µM rotenone and antimycin A (ROT/AA), a mitochondrial complex inhibitor, in this order, after which the maximum respiratory capacity can be determined. Consequently, OI treatment for 24 h drastically reduced OCR in the cells, compared with other treatments (Fig. 4A), impairing basal OCR, OCR during ATP production, maximal respiration, and the spare capacity of mitochondria (Fig. 4B). Taken together, these results suggest that extracellular administration of OI impairs mitochondrial function intracellularly in B16 cells.
Intraperitoneal administration of OI suppresses the growth of B16 tumor transplants in vivo
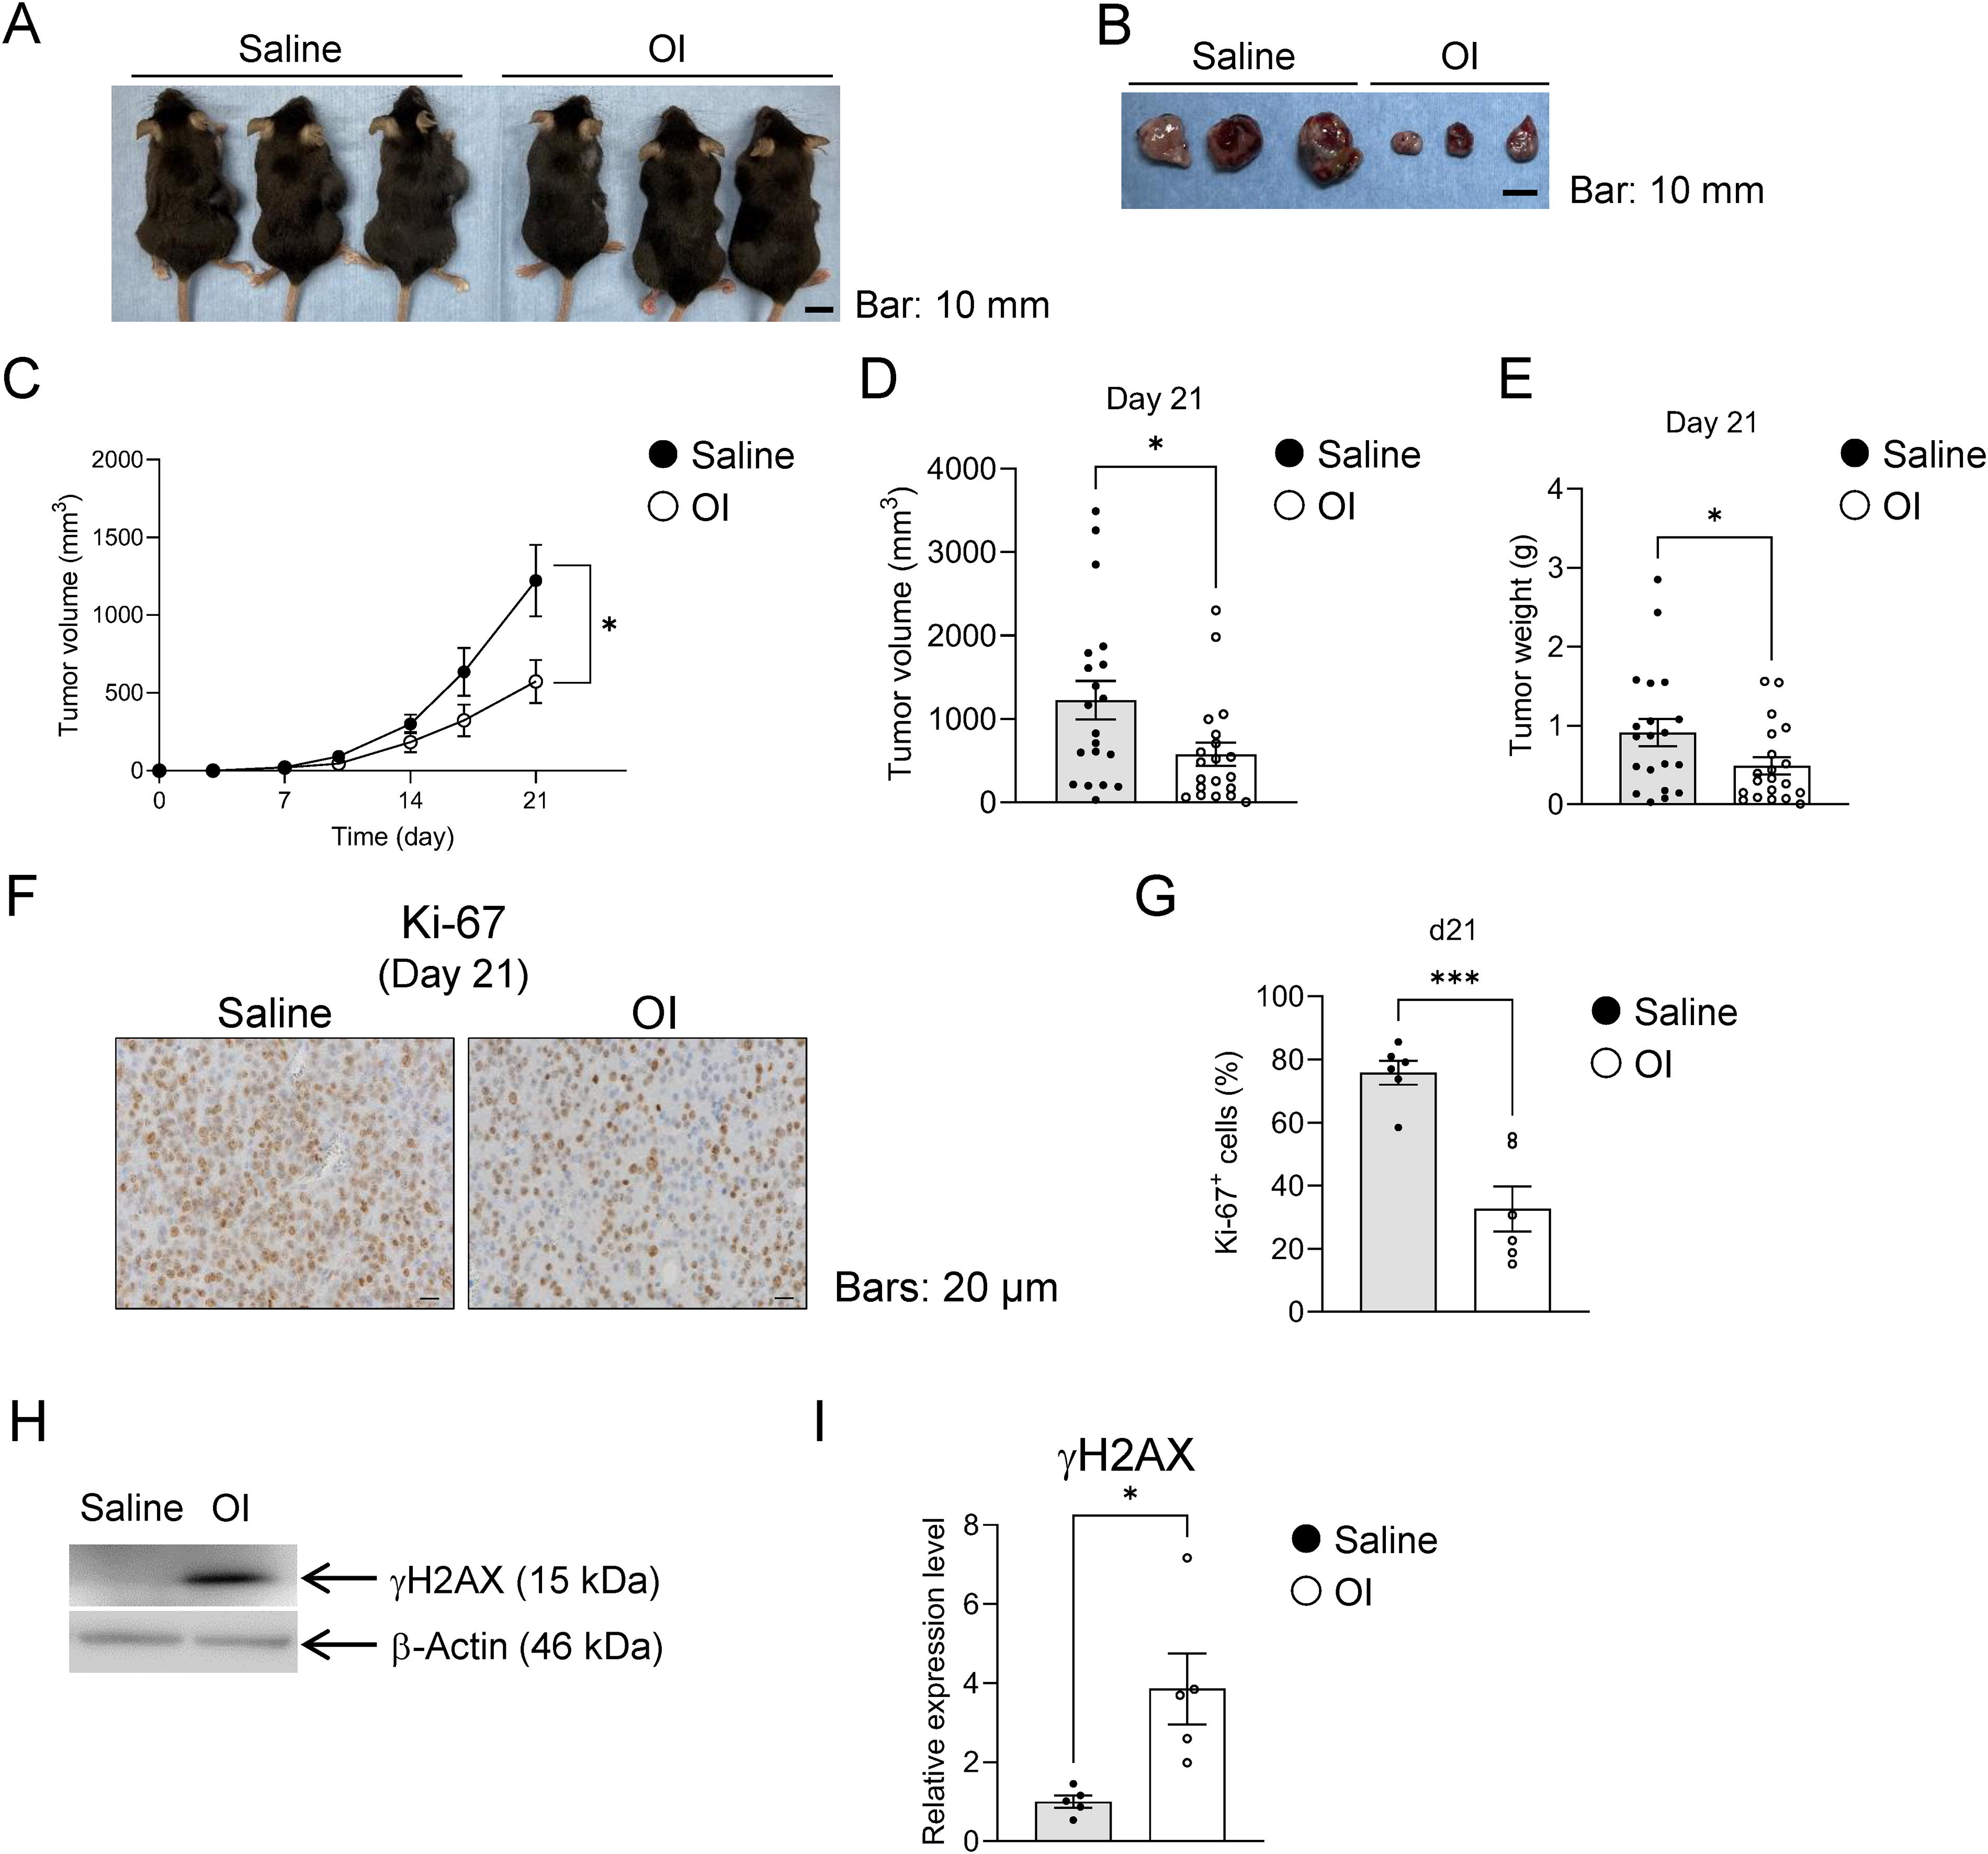
Next, we investigated the antitumor effect of OI in vivo using B16 tumor-bearing mice. Tumor volume and weight were significantly reduced in OI-treated mice compared with those in control mice 21 days after OI administration intraperitoneally twice a week (Fig. 5A–E). In the immunohistochemical staining for Ki-67, commonly known as an index of proliferation (Kawakubo-Yasukochi et al., 2019), the proportion of Ki-67-positive cells was significantly reduced in the tumor tissues of OI-treated mice compared with that in control mice (Fig. 5F, G). In addition, γH2AX, whose expression levels were upregulated by OI treatment in vitro (Fig. 3N, O), was significantly increased in the tumor tissues of OI-treated mice compared with those in control mice (Fig. 5H, 1). These results suggest that the antitumor effects of OI in vivo, as well as in vitro, are associated with impaired glutathione metabolism and subsequent DNA damage. We analyzed peripheral blood samples after the administration of saline, EHA, and OI to assess liver and kidney functions in tumor-bearing mice. The results showed no significant changes in blood urea nitrogen, creatinine, aspartate aminotransferase, or alanine aminotransferase among those mice (Supplementary Fig. S5). In addition, we found no difference in cell growth between OI-treated normal melanocytes and the other groups (Supplementary Fig. S6A). The cystine/glutamate antiporter system subunits—Solute Carrier Family 3 Member 2 (SLC3A2) and Solute Carrier Family 7 Member 11 (SLC7A11)—allow the extrusion and internalization of glutamate and cysteine, respectively, which are essential components of a glutathione molecule, and the loss of the transporters promotes cancer cell survival (Koppula et al., 2021). Indeed, the intracellular concentration of cysteine in B16 cells significantly increased, and that of glutamate decreased after OI treatment for 24 h, while there was no change in the intracellular level of glycine (Supplementary Fig. S7). Reverse-transcription quantitative polymerase chain reaction (RT-qPCR) data showed that the expression of SLC3A2 was much higher in normal melanocytes than in melanoma cells (Supplementary Fig. S6B), and SLC7A11 was also highly expressed in normal melanocytes compared with the level in G361 melanoma cells (Supplementary Fig. S6C); differences in susceptibility to the antitumor effects of OI may be determined by the expression levels and functions of these cotransporters. These findings suggest that OI suppresses melanoma cell proliferation through glutathione metabolism disorders in vivo, as well as in vitro, with minimal effects on normal melanocytes and tissues. In addition, we examined the impact of endogenous IA on tumor growth in vivo using B16-bearing Acod1-deficient (Acod1−/− ) mice. There was no difference in tumor proliferation rates between Acod1−/− mice and wild-type littermates (Supplementary Fig. S8), indicating that endogenous IA is not involved in the process of melanoma proliferation in vivo, which is consistent with our results (Fig. 1I–L).
Discussion
Although little research on IA or ACOD1 has been performed recently, some studies have focused on the pathophysiological roles of these molecules. However, most of these studies involved analyses of the functions of macrophages (Ackermann and Potter, 1949; Dervartanian and Veeger, 1964; Dervartanian and Veeger, 1965; Mills et al., 2016; Wang et al., 2023). Considering that IA can be detected in the blood of tumor-bearing animals, which is probably produced and secreted by macrophages in the tumor microenvironment (Weiss et al., 2018), IA has been considered to exert some potential effects on cancer cells. Meanwhile, Swain et al. recently proved that IA, which had been considered difficult to pass through cell membranes independently (Lin et al., 2021; Shi and Cai, 2022), easily permeates such membranes and that IA and OI exert different physiological activities (Swain et al., 2020). Thus, we investigated the direct effects of IA and OI on tumor progression using mouse and human melanoma cells in the present study. Indeed, we confirmed that exogenous IA was taken up by melanoma cells and that most of the administered OI remained as OI, and a small amount of it could be diverted into IA in the cells. We proved that an intracellular OI causes abnormal glutathione metabolism in melanoma cells, reduces mitochondrial functions, and ultimately terminates cell growth, followed by ROS accumulation. These findings are reminiscent of those in a previous study indicating that the enzymatic activity of ACOD1 is linked to ROS production in macrophages (Hall et al., 2013). Therefore, we also investigated the effect of endogenous IA on tumor proliferation ability by artificially manipulating the expression of Acod1. However, IA had no effect on melanoma cell proliferation.
Glutathione, an antioxidant ubiquitous in cells, alleviates intracellular oxidative stress, and its system is dependent on the balance among synthesis, hydrolysis, and recycling (Harris et al., 2015). Substantial oxidative stress typically experienced by cancer cells is accompanied by an increase in glutathione levels, which can contribute to cancer cells prominently increasing in number and gaining resistance to chemotherapeutic agents. Therefore, targeting glutathione metabolism has been widely investigated for anticancer therapy (Kennedy et al., 2020). The failure of glutathione-dependent antioxidant defenses induces ferroptosis and cell senescence (Sun et al., 2018); however, their molecular relationship has not been reported. Cellular senescence is characterized as a stable and terminal state of cell cycle arrest (Haff and Swim, 1956; Hayflick and Moorhead, 1961), inducing a DNA damage response associated with telomere shortening (Campisi and d’Adda di Fagagna, 2007; Serrano and Blasco, 2001), which can be induced by stresses such as ROS. Meanwhile, ferroptosis is an iron-dependent form of programmed cell death, often induced by the loss of glutathione function (Dixon et al., 2012). In our study, OI induced cellular senescence but not ferroptosis by increasing the accumulation of ROS produced due to glutathione depletion. However, the molecular mechanisms by which OI treatment induces cell senescence rather than ferroptosis require further elucidation.
In general, GSH/GSSG serves as an indicator of oxidative stress, which denotes the redox state of cells (Xiao and Loscalzo, 2020). Interestingly, we observed that GSH and GSSG levels were reduced, and these findings were consistent with lower levels of GSH/GSSG in OI-treated melanoma cells. Similarly, previous studies indicated that dimethyl itaconate, an IA derivative, also reduces GSH levels in bone marrow-derived macrophages by binding to the SH residue of cysteine (Bambouskova et al., 2018). Such findings suggest that OI might also interact in a similar manner with cysteine residue in melanoma cells, which results in lower GSH turnover. We observed an upregulation of gene expression not only for glutathione degradation-related molecules, including CHAC1, but also for glutathione synthesis rate-limiting enzymes such as GCLC and GCLM (Lu, 2009) in melanoma cells after OI treatment. OI treatment also increased the Pdg gene expression level. Considering the previous report that cancer cells are known to be highly dependent on G6PD (Pdg) to produce NADPH, which is essential for maintaining a GSH level (Ju et al., 2020), GSH synthesis-related genes might be increased as a compensatory reaction to the GSH decrease by OI treatment. However, it is challenging to ascertain whether the elevated expressions of each gene were a direct or indirect response to OI treatment.
In this study, we demonstrated that one of the reasons why OI has little effect on the proliferation ability of normal cells was that the expression levels of cystine transporters, such as SLC3A2 and SLC7A11, differ between melanoma cells and normal melanocyte cells. In addition, we also found that OI administration was not associated with any adverse effects on liver and kidney functions. However, the effects of long-term administration of OI on normal cells and tissues remain to be investigated.
In conclusion, this study demonstrated the direct anticancer effects of OI on melanoma cells, which are directly mediated by increased ROS accumulation due to impaired glutathione metabolism, dysfunction of mitochondrial respiratory capacity, and consequently, cellular senescence. A more complete understanding of its pharmacokinetics is expected to lead to translational success.
Materials and Methods
Materials
IA (C5H6O4), EHA (C8H16O2), OA (C8H16O2), and OI (C13H22O4), which is an itaconic acid with an octyl group attached, were purchased from Fujifilm Wako (Osaka, Japan), Tokyo Chemical Industry Co. (Tokyo, Japan), Nacalai Tesque (Kyoto, Japan), and Selleck Biotech (Tokyo, Japan), respectively. OA and EHA, a structural isomer of OA, were used to evaluate the effect of the octyl group (Supplementary Fig. S1). The effect of OI was compared with that of DMEM, IA, EHA, or OA in in vitro experiments. Unless otherwise stated in the figure legends, IA, EHA, OA, and OI reagents were compared at a concentration of 1 mM.
Mice
All mice used in this study were maintained and handled in accordance with the protocols approved by the animal ethics committee of Kyushu University (permission no. A21-456 and A23-106). Acod1 −/−and wild-type littermates (C57BL/6N), obtained from Jackson Laboratories (Bar Harbor, ME, USA), were maintained in a specific pathogen-free facility under a 12/12 h light/dark cycle with food and water provided ad libitum. B16 cells (1 × 10⁶ cells per mouse) in 0.2 mL of phosphate-buffered saline (PBS) were injected subcutaneously into the right flank of 8-week-old female mice under anesthesia. Saline or OI (25 mg/kg body weight) was injected intraperitoneally twice a week after tumor transplantation. Tumor size was measured with calipers every 3 or 4 days and calculated as ab 2/2, where a and b are the largest and smallest central cross-sectional dimensions, respectively.
Cell culture
A murine melanoma cell line, B16, and human melanoma cell lines, G361 and Colo679, were obtained from the RIKEN BioResource Center (Tsukuba, Japan). These cells were maintained in DMEM supplemented with 10% fetal bovine serum (Thermo Fisher Scientific, Waltham, MA, USA), penicillin (100 U/mL), and streptomycin (0.1 mg/mL). Human melanocytes were obtained from the JCRB Cell Bank (Osaka, Japan) and maintained in MGM™-4 Melanocyte Growth Medium-4 BulletKit (Lonza, Basel, Switzerland) supplemented with 130 µg of endothelin-3 (Lonza). All cells were maintained in a humidified atmosphere of 5% CO2 at 37°C.
Cellular assays (WST-8 and BrdU assays)
Cellular metabolic activity and proliferation rate were determined by a WST-8 assay (Cell Count Reagent SF; Nacalai Tesque, Kyoto, Japan) and BrdU uptake assay (BrdU Cell Proliferation ELISA Kit; Exalpha Biologicals, Shirley, MA, USA), respectively, in accordance with the manufacturers’ instructions. Cells (5 × 10⁴) were seeded in 96-well culture plates in a volume of 100 μL and precultured for 24 h. Then, the cells were treated for 24 h with IA (1 mM), EHA (1 mM), OA (1 mM), and OI (1 mM), after which each assay started. The absorbance at 450 nm was measured using a microplate reader (Bio-Rad, Hercules, CA, USA).
NAD+/NADH assay
The NAD+/NADH ratio was measured using the NAD/NADH Assay Kit-WST (Cat# N509, Dojido, Kumamoto, Japan) in accordance with the manufacturer’s instructions. Cells (5 × 10⁵) were seeded in 6-well culture plates in a volume of 2 mL and precultured for 24 h. Then, the cells were treated for 24 h with IA (1 mM), EHA (1 mM), OA (1 mM), and OI (1 mM), after which each assay started. After lysing the cells with the supplied NAD+/NADH extraction buffer, the obtained solution was collected by centrifugation and the filtrate was collected in a 10K filter tube.
High-performance liquid chromatography—tandem mass spectrometry analysis
High-performance liquid chromatography (HPLC)—tandem mass spectrometry assay was performed using LCMS-8050 (Shimazu, Kyoto, Japan), in accordance with a previously reported method (Winterhoff et al., 2021). Briefly, cells were extracted with 100% methanol, followed by centrifugation at 10,000 g and 4°C for 2 h using an Amicon Ultra-0.5 Centrifugal Filter Unit (UFC500396; Merck Millipore, Darmstadt, Germany), and the supernatants were transferred to mass spectrometry (MS) vials with inserts. For chromatographic separation (injection volume: 10 µL), a Kinetex C18 column (dimensions: 100 Å, 100 × 3 mm, 2.6 m, 00D-4462-Y0; Phenomenex, Torrance, CA, USA) was used with guard cartridges for C18 HPLC columns with an internal diameter of 2.0–3.0 mm (AJ0-4286; GL Sciences, Tokyo, Japan). The analytes were eluted with 0.2% (v/v) formic acid in water (solvent A) and 0.2% (v/v) formic acid in 100% methanol (solvent B) using the following gradient at a flow rate of 0.4 mL/min: 0–6.0 min: 1% B, 6.0–7.0 min: 1%–90% B, 7.0–8.0 min: 90% B, and 8.01–11.0 min: 1% B. The autosampler and column oven temperatures were set at 4°C and 30°C, respectively. After chromatographic separation, the analytes were ionized by electrospray ionization.
Transfection
B16 cells were transfected with Acod1_Omu01833D_pcDNA3.1+/C-(K)-DYK (Genscript, Piscataway, NJ, USA) using Lipofectamine-3000 (Thermo Fisher Scientific) in accordance with the manufacturer’s instructions. Stable transfectant was established from a single clone by a limiting dilution method with G418 (Thermo Fisher Scientific).
RNA sequencing
RNAseq was performed using MGI DNBSEQ-G400 FAST (MGI Tech, Shenzhen, China). Total RNA was isolated from tissues using Sepasol-RNA I Super G (Nacalai Tesque), in accordance with the manufacturer’s instructions. RNA samples were quantified using an ND-1000 spectrophotometer (NanoDrop; Thermo Fisher Scientific), and their quality was confirmed using an Agilent 2200 TapeStation system (Agilent, Santa Clara, CA, USA). After rRNA depletion using the MGIEasy rRNA Depletion Kit (MGI Tech), RNA directional libraries for MGI DNBSEQ-G400 FAST were prepared using the MGIEasy RNA Directional Library Prep Set (MGI Tech), in accordance with the manufacturer’s instructions. To identify up- or downregulated genes, Z-scores and non-log-scaled fold-change ratios were calculated from the normalized signal intensities of each probe. The criteria for up- or downregulated genes were as follows: upregulated genes, p value < 0.05 and ratio ≥2-fold; and downregulated genes, p value < 0.05 and ratio ≤0.5-fold. KEGG pathway analysis of differentially expressed genes (DEGs) was performed using DAVID (http://david.abcc.ncifcrf.gov/). In the KEGG analysis, all the DEGs were included in the analysis without distinction as to whether they were upregulated or downregulated. The dataset generated from this study is available from the Gene Expression Omnibus repository (https://www.ncbi.nlm.nih.gov/gds/) with accession number GSE279523.
RT-qPCR analysis
For RT-qPCR, total RNA was extracted from cells using Sepasol-RNA I Super G (Nacalai Tesque) and a High Pure RNA Isolation Kit (Roche Diagnostics, Mannheim, Germany). The RNA was reverse-transcribed using a Verso cDNA Synthesis Kit (Thermo Fisher Scientific), and the resulting cDNA was subjected to two-step qPCR analysis on a StepOnePlus real-time PCR system (Applied Biosystems, Waltham, MA, USA) using a PowerUp SYBR Green Master Mix (Applied Biosystems, Waltham, MA, USA). Cycling conditions were as follows: 50°C for 2 min and 95°C for 2 min (hot-start PCR), followed by 45 cycles of 95°C for 3 s and 60°C for 30 s. PCR primer sequences are listed in Supplementary Table S1.
Western blot analysis
Cells or tumor tissues were lysed and homogenized in RIPA buffer (Fujifilm Wako) containing protease inhibitor cocktail (Nacalai Tesque). After centrifugation, the supernatant was collected, and the protein concentration was measured using a Protein Assay BCA kit (Fujifilm Wako). Protein samples were incubated in SDS-PAGE sample buffer containing 2-mercaptoethanol (Nacalai Tesque) at 95°C for 5 min and then electrophoretically fractionated on glycine-based 5%–20% SDS-PAGE gradient SuperSep precast gels (Fujifilm Wako). For immunoblot analysis, proteins were transferred to Immobilon PVDF membranes (Merck Millipore), and nonspecific protein binding was blocked with Blocking One (Nacalai Tesque) for 30 min at room temperature. The following primary antibodies were used: ACOD1 (diluted 1:1,000, Cat# 19857; Cell Signaling Technology, Danvers, MA), OPLAH (diluted 1:1,000, Cat# sc-393570; Sant Cruz Biotechnology, TX, USA), GSTA1 (diluted 1:1000, Cat# 14475–1-AP; Proteintech, Rosemont, IL, USA), GSTA2 (diluted 1:1,000, Cat# 10505–1-AP; Proteintech), γH2AX (diluted 1:3,000, Cat#2577; Cell Signaling Technology), and β-actin (diluted 1:40,000, Cat# M177-3; MBL, Tokyo, Japan). After incubation with each primary antibody at 4°C overnight, the membranes were washed and incubated with the appropriate horseradish peroxidase-conjugated secondary antibodies (Cell Signaling Technology, Danvers, MA, USA) at 4°C overnight. After washing, the membranes were analyzed on Amersham™ ImageQuant™ 800 (Cytiva, Tokyo, Japan) or ImageQuant LAS4000 system (GE Healthcare, Chicago, IL, USA) using Chemi-Lumi One (Nacalai Tesque).
Glutathione quantification
GSSG and GSH levels in B16 cells, treated with IA, EHA, OA, or OI for 5 h, were quantified using GSSG/GSH quantification kit (Cat# G257; Dojindo), in accordance with the manufacturer’s instructions.
ROS quantification
ROS Assay Kit (Highly Sensitive DCFH-DA, Dojindo) was used for the measurement of intracellular ROS levels. Briefly, cells (5 × 10⁴) were seeded in 96-well plates and cultured overnight. They were then treated with IA, EHA, OA, or OI for 5 h, washed twice with PBS, and incubated with DCFH-DA for 30 min at 37°C. After washing, intracellular ROS was measured using a flow cytometer (FACSAria Fusion; BD Bioscience, Franklin Lakes, NJ, USA). The experiment was carried out according to the manufacturer’s instructions.
Mitochondrial superoxide quantification
MitoSOX Green (MitoSOXTM Mitochondrial Superoxide Indicators, for live cell imaging, Cat# M36005, Thermo Fisher Scientific) was used to detect mitochondrial-specific superoxide according to the manufacturer’s instructions. Briefly, cells (5 × 10⁴) were seeded in 96-well plates and cultured overnight. They were then treated with IA, EHA, OA, or OI for 5 h, washed twice with PBS, and then the cells were harvested with trypsin and the samples were prepared to give 5 × 10⁵ cells/500 µL PBS. To each sample, 1 µL of 0.5 mM MitoSOX (final concentration 1 µM) was added, and the samples were rotated in a CO2 incubator at 37°C for 20 min. After washing, intracellular ROS was measured using a flow cytometer (FACSLyric; BD Bioscience).
NO2 quantification
NO2/NO3 Assay Kit C-II-(Colorimetric)-Griess Regent Kit (Cat# NK05, Dojindo) was used to detect the concentration of nitrogen dioxide according to the manufacturer’s instructions. Briefly, cells (7 × 10⁵) were seeded in 96-well plates and cultured overnight. They were then treated with IA, EHA, OA, or OI for 5 h. The culture medium was then collected and centrifuged at 1000 g for 15 min, and the supernatant was further centrifuged through a 10K filter tube to remove the proteins and used as the sample.
Peroxynitrite quantification
Cell Meter Fluorimetric Intracellular Peroxynitrite Assay Kit Optimized for Flow Cytometry (Cat# ABD16317; AAT Bioquest, Inc. Pleasanton, CA) was used to detect intracellular peroxynitrite according to the manufacturer’s instructions. Briefly, cells (5 × 10⁴) were seeded in 96-well plates and cultured overnight, and then the cells were incubated in a CO2 incubator for 5 h after the addition of each reagent (IA, EHA, OA, or OI). At 4 h after reagent addition, Pongreen was added to each well without changing the culture medium, and incubation was continued for 1 h. After washing with HBSS, intracellular peroxynitrite was measured using a flow cytometer (FACSLylic; BD Bioscience).
Quantification of phosphorylation of Ser-139 residue of the histone variant H2AX (γH2AX)
γH2AX quantification was performed using the DNA Damage Detection Kit-γ-H2AX (Dojindo), in accordance with the manufacturer’s instructions. Briefly, cells (5 × 10⁴ cells) were seeded in 96-well plates and cultured overnight. They were then treated with IA, EHA, OA, or OI for 5 h. Cells were fixed in 100 µL of 10% formalin solution for 15 min at room temperature, and 100 µL of 0.1% Triton X-100/PBS was added for 30 min at room temperature for permeabilization. After blocking with 100 µL of 5% goat serum/PBS for 1 h at room temperature, the primary antibody anti-γH2AX (1:200) was applied for 1 h at room temperature. After incubation with the TRITC-conjugated secondary antibody (diluted 1:1,000) for 1 h at room temperature, the cells were washed and incubated with DAPI (2 mg/mL) for 10 min at room temperature. For quantification, the number of γH2AX-stained granules in nuclei was counted using a hybrid cell counting application (BZ-H4C; Keyence, Osaka, Japan) in the BZ-X800 Analyzer software BZ-H4A (Keyence).
β-galactosidase quantification
β-Galactosidase quantification was performed using Cellular Senescence Detection Kit-SPiDER-βGal (Dojindo), in accordance with the manufacturer’s instructions. Briefly, cells (5 × 10⁴) were seeded in 96-well plates and treated with IA, EHA, OA, or OI for 5 h. The cells were then stained with SPiDER-βGal working solution at 37°C for 30 min. Flow cytometry analysis was performed using a FACSAria Fusion (BD Bioscience) and FlowJo software (BD Bioscience).
Lipid hydroperoxide quantification
Cells (5 × 10⁴) were seeded in 96-well plates and treated with 1 µM Liperfluo (Dojindo) for 30 min at room temperature before starting IA, EHA, OA, or OI treatment. Flow cytometry analysis was performed using a FACSAria Fusion (BD Bioscience) and FlowJo software (BD Bioscience).
MDA quantification
MDA assay kit (Cat# M496, Dojindo) was used to measure intracellular MDA according to the manufacturer’s instructions. Briefly, cells were cultured overnight, and then the cells were incubated in a CO2 incubator for 5 h after the addition of each reagent (IA, EHA, OA, or OI). A total of 1 × 10⁷ cells were used for each sample. To prevent alterations in MDA levels after sample preparation, antioxidant PBS was added to the sample. Subsequently, the cell membrane was disrupted with a lysis buffer, after which a working solution containing 2-thiobarbituric acid was added. This solution forms dimers via MDA and exhibits fluorescence. Subsequently, the reaction was terminated through incubation at 95°C for 15 min. The samples were then subjected to centrifugation at 10,000 g for 10 min, after which the fluorescence intensity of the supernatant was quantified using a fluorescence plate reader. Excitation was set at 540 nm, and emission was set at 590 nm.
Measurement of mitochondrial oxidative consumption (OCR)
OCR was measured using a Seahorse XF Extracellular Flux Analyzer (Seahorse Bioscience, North Billerica, MA, USA). After preculturing in 24-well plates (2 × 10⁴ cells per well) for 24 h, cells were treated with IA (1 mM), EHA (1 mM), OA (1 mM), and OI (1 mM) for 24 h. After the culture medium had been replaced with extracellular flux assay medium (Seahorse Bioscience) containing 10 mM glucose, 1 mM pyruvate, and 2 mM glutamine, the cells were cultured in a CO2-free incubator for 1 h before measuring the OCR.
Immunohistochemical analysis
Tumor samples were embedded in paraffin and subjected to immunohistochemistry using primary antibody against Ki-67 (dilution 1:200; Cell Signaling Technology) incubated for 1 h at room temperature based on the polymer method (Kawakubo-Yasukochi et al., 2021). For quantification, Ki-67-stained cells were counted using a hybrid cell counting application in the BZ-X800 Analyzer software BZ-H4A (Keyence).
Statistical analysis
Student’s t test (two-tailed t test) and analysis of variance followed by Tukey–Kramer test were performed using GraphPad Prism 10 software (version 10.3.1; GraphPad Software, San Diego, CA, USA) where appropriate. Each parametric test was followed by a multiple comparison test after the D’Agostino and Pearson test was applied to determine and validate the presence of a normal distribution. All experiments were conducted on more than three times, and all quantitative data are presented as mean ± standard error of the mean. We used the number as a biological replication and performed each experiment thrice. p Values < 0.05 were considered statistically significant.
Electronic notebook
Electronic laboratory notebook was not used.
Footnotes
Acknowledgments
The authors thank Dr. Atsushi Doi, Dr. Hiroko Hagiwara, and Dr. Kaori Yasuda (Cell Innovator, Fukuoka, Japan) for assistance with RNA-seq analyses and thank Ms. Nao Kuboyama for technical assistance. The authors are also grateful for the technical assistance from the Research Support Center, Research Center for Human Disease Modeling, Kyushu University Graduate School of Medical Sciences, which is partially supported by the Mitsuaki Shiraishi Fund for Basic Medical Research, Section of Bioresource and Bioenvironmenal Sciences, Center for Advanced Instrumental and Educational Support, Faculty of Agriculture, Kyushu University, and Laboratory for Research Support, Medical Institute of Bioregulation, Kyushu University.
Authors’ Contributions
Y.H. and T.K.-Y. designed and performed experiments, analyzed data, and drafted the article. A.S., S.Y., E.Y., A.Y., T.U., K.M., and S.K. performed experiments and analyzed data. Y.A., Y.H., Y.-C.L., M.H., and E.J. evaluated the data and participated in preparing the article. All authors approved the final article. T.K.-Y. supervised the entire project.
Data Availability
The datasets used and/or analyzed supporting the findings of this study are available in this article or the Supplementary Information. Any raw data that support the results of this study are available from the corresponding author on reasonable request.
Author Disclosure Statement
No competing financial interests exist.
Funding Information
This study was supported by the Japan Society for the Promotion of Science (KAKENHI grants JP23K09133 to Y.H., JP24KJ1774 to A.S., JP20K18490 and JP22K17003 to E.Y., JP23K09161 to S.Y., JP22K10173 to A.Y., JP20H03854 and JP24K02868 to M.H., and JP22K09914 and JP22KK0263 to T.K.-Y.), JST Support for Pioneering Research Initiated by the Next Generation (SPRING JPMJSP2136 to A.S.), Kaibara Morikazu Medical Science Promotion Foundation, The Shinnihon Foundation of Advanced Medical Treatment Research, The Nakatomi Foundation, Takeda Science Foundation, Mochida Memorial Foundation for Medical and Pharmaceutical Research, Fukuoka Public Health Promotion Organization Cancer Research Fund, and Astellas Foundation for Research on Metabolic Disorders.
Supplementary Material
Supplementary Figure S1
Supplementary Figure S2
Supplementary Figure S3
Supplementary Figure S4
Supplementary Figure S5
Supplementary Figure S6
Supplementary Figure S7
Supplementary Figure S8
Supplementary Figure S9
Supplementary Figure S10
Supplementary Figure S11
Supplementary Table S1
Abbreviations Used
References
Supplementary Material
Please find the following supplemental material available below.
For Open Access articles published under a Creative Commons License, all supplemental material carries the same license as the article it is associated with.
For non-Open Access articles published, all supplemental material carries a non-exclusive license, and permission requests for re-use of supplemental material or any part of supplemental material shall be sent directly to the copyright owner as specified in the copyright notice associated with the article.