
Abstract
Nitrosative stress is a feature of Alzheimer's disease (AD).
Aims:
We aimed to identify the cause underpinning increased nitric oxide (NO) in neurons and the impact of NO on neuronal function in AD.
Results:
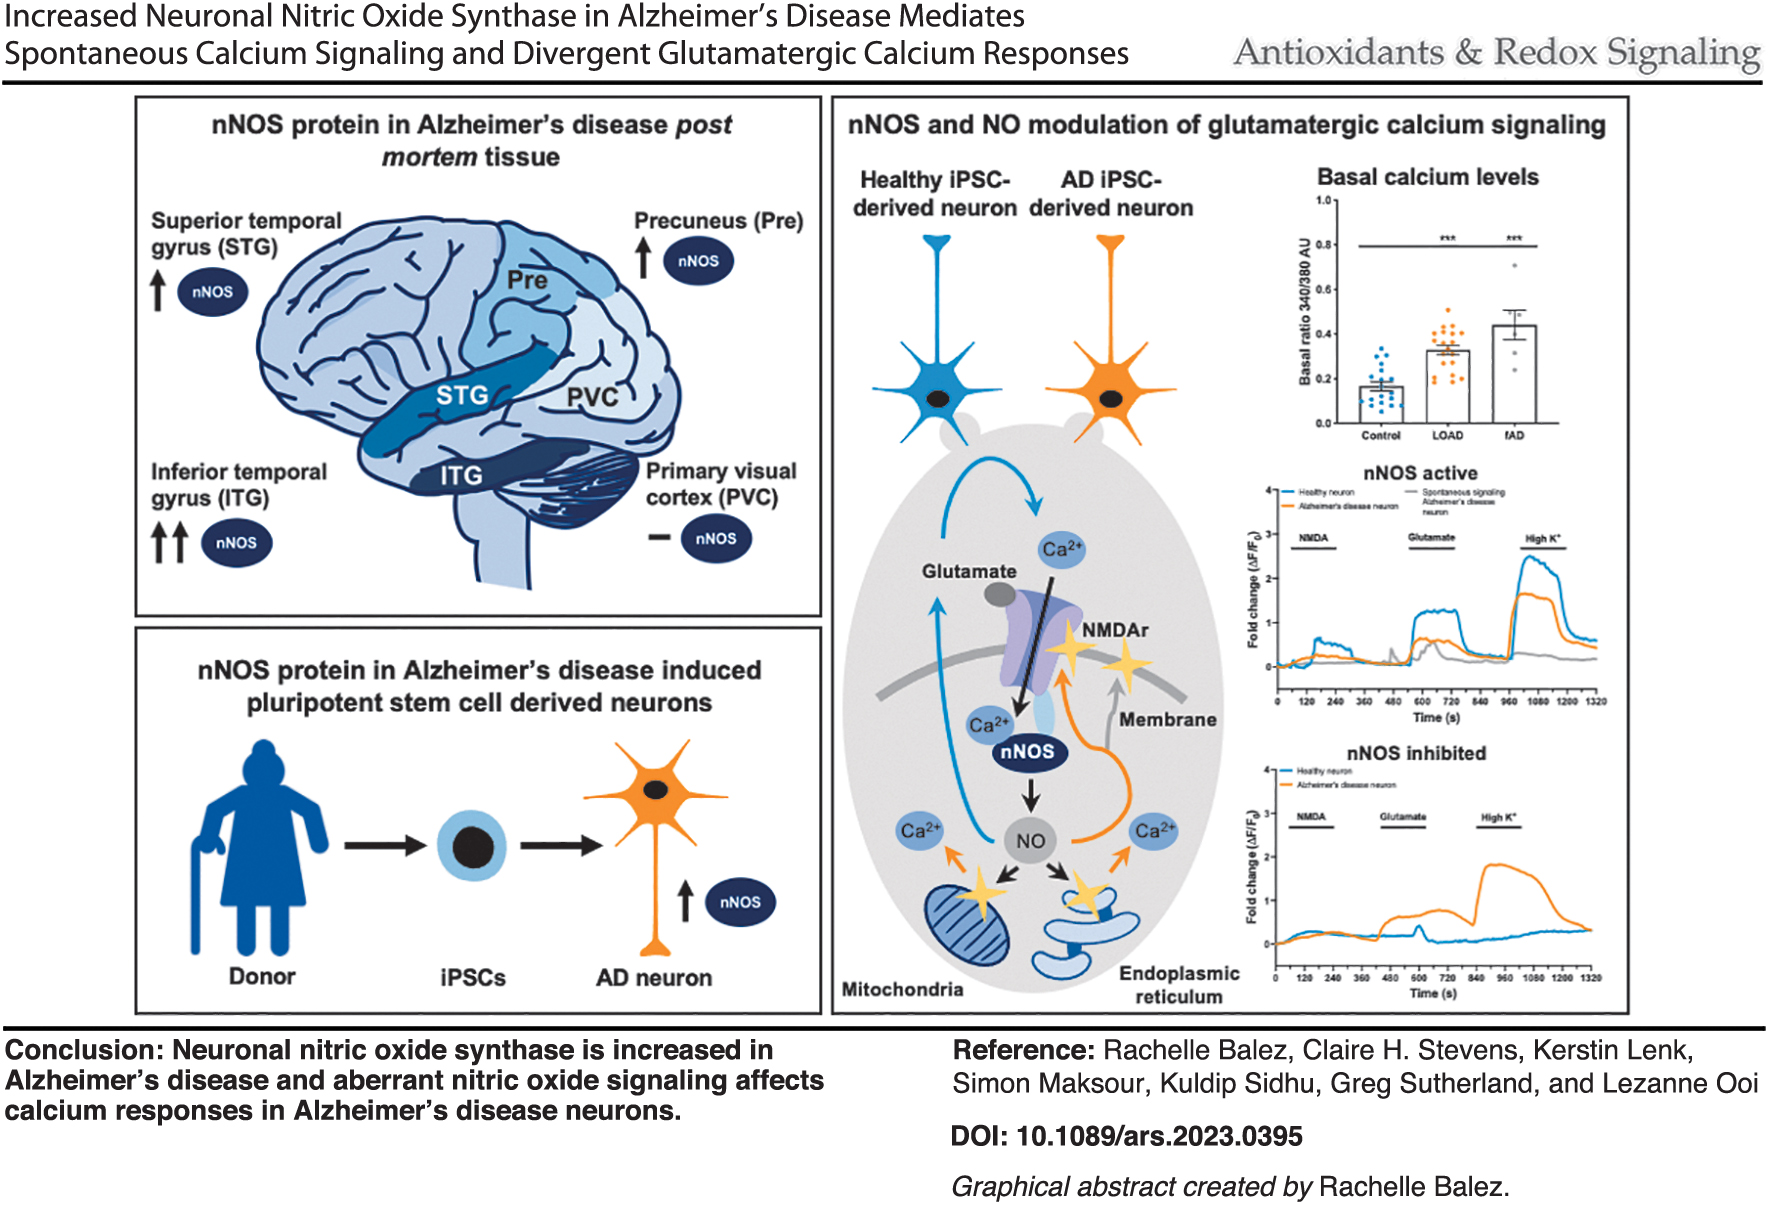
We analyzed neuronal nitric oxide synthase (nNOS) protein levels in postmortem tissue and induced pluripotent stem cell (iPSC)-derived neurons from Alzheimer's patients and controls by immunohistochemistry and Western blots. Furthermore, we assessed the impact of modulating nNOS function or NO levels on neuronal glutamatergic signaling using calcium imaging. We show that nNOS protein levels are increased in early and severely affected brain regions of AD postmortem tissue, but not late and mildly affected regions, or cognitively normal individuals. The increased nNOS phenotype was also present in iPSC-derived neurons from late-onset Alzheimer's disease (LOAD) patients compared with controls, along with increased levels of nitrite, a stable marker of NO.
Innovation:
We observed a divergent functional impact of NO that included strengthening the calcium response in control neurons, while dysregulating calcium signaling and altering the amplitude and kinetics of the calcium responses to glutamate in the AD neurons. Pharmacological scavenging of NO or inhibition of nNOS prevented aberrant spontaneous calcium signaling in AD neurons.
Conclusion:
Together these data identify increases in nNOS protein in AD. Functional data suggest that NO modulation of glutamatergic calcium signaling is neuroprotective under nonpathogenic conditions, with increased nNOS and NO contributing to dysregulated spontaneous calcium signaling in AD neurons.
Introduction
Alzheimer's disease (AD) is a multifactorial neurodegenerative disorder, characterized by the extracellular deposition of misfolded amyloid β (Aβ) protein and the intracellular accumulation of hyperphosphorylated tau (DeTure and Dickson, 2019). More than 95% of people who develop AD have late-onset AD (LOAD), through which age and the inheritance of the ɛ4 allele of the apolipoprotein E (APOE) gene are two of the biggest risk factors, however, the precise etiology remains unclear (DeTure and Dickson, 2019). By comparison, the rare and inherited form, known as familial AD (fAD), is caused by one of several known mutations that contribute to altered processing of the Aβ peptide (De Strooper et al., 2012).
Disruption to neuronal calcium signaling is hypothesized to be an early and central phenotype underlying the development of AD and the decline in memory and cognition (AACHW, 2017; Ito et al., 1994; Khachaturian, 1994). In addition, significantly elevated levels of oxidative and nitrosative stress markers, the consequence of increased amounts of reactive oxygen and nitrogen species, respectively, are also pathogenic features of AD (Law et al., 2001; Swerdlow and Khan, 2004). Within the brain, nitric oxide (NO) is produced by isoforms of the enzyme nitric oxide synthase (NOS) and serves as an important membrane-permeable neurotransmitter and neuromodulator (Arancio et al., 1996; Bon and Garthwaite, 2003). However, during disease, potentially pathogenic levels of NO biosynthesis can occur through two main mechanisms (Fernández-Vizarra et al., 2004). The first is via the glial-based pathway of cytokine-stimulated induction of inducible nitric oxide synthase (iNOS) in microglia and astrocytes (Aktan, 2004). The second, which is the focus of this work, is through excessive stimulation of glutamate receptors, leading to sustained function of the calcium-activated neuronal nitric oxide synthase (nNOS), which has been shown to localize with synaptic and extrasynaptic glutamate-activated N-methyl-D-aspartate (NMDA) receptors (NMDAr) through a common postsynaptic density-95 (PSD-95) binding domain (Kornau et al., 1995; Molokanova et al., 2014). Increasing evidence implies that during neurodegeneration, excessive activation of extrasynaptic NMDAr may drive the increased production of NO and reactive oxygen species (Molokanova et al., 2014; Talantova et al., 2013).
Innovation
There is increased neuronal nitric oxide synthase (nNOS) expression in late-onset Alzheimer's disease (LOAD) postmortem tissue, which is recapitulated in induced pluripotent stem cell (iPSC)- derived neurons from LOAD patients. iPSC-derived neurons from LOAD patients demonstrate alterations in calcium signaling. Increased spontaneous calcium signaling in Alzheimer's disease neurons is reduced by inhibiting nNOS or scavenging nitric oxide.
Under nonpathogenic conditions, NO is reported to strengthen glutamatergic calcium signaling and may be neuroprotective through facilitating long-term potentiation (Arancio et al., 1996) by increasing presynaptic glutamate vesicle release (Chakroborty et al., 2015; East and Garthwaite, 1991; Haley et al., 1992; Schuman and Madison, 1991; Steinert et al., 2010). Meanwhile NO can also downregulate excessive NMDAr activity via S-nitrosylation, with NO-related species providing a form of negative feedback (Ghatak et al., 2021; Granzotto et al., 2022; Lei et al., 1992; Lipton et al., 1993). However, a decrease in the enzymatic substrate L-arginine, or cofactor tetrahydrobiopterin, can uncouple the enzyme and result in the production of superoxide (Gebhart et al., 2019; Yi et al., 2009). In addition, phosphorylated tau can disrupt the association of nNOS with PSD-95 and increase superoxide release (Park et al., 2020).
An excess of these nitrogen and oxygen species can (1) modify synaptic and signaling proteins to disrupt or inactivate their function; (2) dysregulate and induce the release of calcium from intracellular calcium stores; and (3) readily react to form the reactive nitrogen species peroxynitrite, contributing to nitrosative stress (Erusalimsky and Moncada, 2007; Horn et al., 2002; Kakizawa et al., 2012; Koppal et al., 1999; Radi et al., 1991; Smith et al., 1997; Zahid et al., 2014). It is in this way that NO production is both regulated by, and can in turn modulate, neuronal calcium signaling.
There are several proposed mechanisms for NO-mediated dysregulation of calcium signaling in neurons (Horn et al., 2002; Lipton et al., 1993; Spiers et al., 2019; Steinert et al., 2010), however, there is contradictory evidence of the underlying cause(s) and a limited understanding of the impact that an endogenous excess of NO has on glutamatergic calcium signaling in AD.
We hypothesized that a contributing factor to nitrosative stress could be alterations to the amount of nNOS in the AD brain, however, there are conflicting data in the literature with several studies reporting a significant increase, decrease, or no change in protein levels (reviewed in Balez and Ooi, 2016). The use of a variety of indirect analysis techniques, assessment of different brain regions, and the small sample size of some cohorts could all contribute to this variability. To address these discrepancies, we have directly quantified nNOS protein levels in a large tissue cohort incorporating the analysis of pathology across a range of severely affected to largely unaffected brain regions at postmortem, to establish a protein expression profile of nNOS in the AD brain.
To complement the findings from postmortem studies with functional data on enzyme activity and neuronal calcium signaling, we used induced pluripotent stem cell (iPSC)-derived neurons generated from LOAD and fAD donors with an endogenous dysfunctional calcium signaling phenotype. Although studies have demonstrated several mechanisms of NO-mediated modulation of calcium signaling in AD, these works rarely assessed nNOS protein levels (Ghatak et al., 2021). Instead, previous studies have often relied on inducing nitrosative stress, dysregulated calcium signaling, or disease phenotypes, with the addition of high concentrations of NO (Chakroborty et al., 2015), excitatory agonists (Dias et al., 2016; Ghatak et al., 2021; Horn et al., 2002), or overexpression of protein aggregates (Chakroborty et al., 2015; Choi et al., 2018; Molokanova et al., 2014).
To the best of our knowledge, nNOS expression in iPSC-derived neurons generated from AD donors and the functional impact of endogenous NO on calcium signaling have not been assessed.
The first aim of this study was to resolve the long-standing controversy regarding the amount of nNOS in the human LOAD brain and to determine if the disease phenotype was recapitulated in iPSC-derived LOAD neurons. The second aim was to use iPSC-derived neurons to assess if endogenously increased nNOS/NO could shift from modulating physiological calcium signaling to pathogenic pathways in the context of LOAD. The results of this study resolve a long-standing controversy regarding region-specific variations in the amount and localization of nNOS and demonstrate the functional impact of endogenously increased nNOS/NO during AD.
Results
Cellular localization and relative expression of nNOS in human postmortem tissue from control and LOAD donors
Demographics and clinical indices for human postmortem tissue cohort
To assess nNOS expression and localization in the brains of LOAD patients, four brain regions from 17 control and 27 LOAD donors were used (case details provided in Supplementary Table S1). There were no significant differences in the age at death or tissue fixation time between the control and LOAD cases (Table 1 and Supplementary Fig. S1). The postmortem interval was significantly shorter in the LOAD cohort, likely a consequence of these individuals being in care before death (Table 1 and Supplementary Fig. S1). As expected, there was a significant association between donors carrying at least one copy of the ɛ4 allele of the APOE gene and the incidence of LOAD (Table 1 and Supplementary Fig. S1).
Demographic and Clinical Indices for Human Postmortem Tissue Cohort Used to Assess Relative Expression and Localization of Neuronal Nitric Oxide Synthase in the Brain
Analysis is reported as mean ± SEM of either unpaired two-tailed t testa or chi-square testc with significant differences indicated by b p < 0.01, n = 17 for control and n = 27 for LOAD.
APOE, apolipoprotein E; LOAD, late-onset Alzheimer's disease; SEM, standard error mean.
Aberrant localization and increased amount of nNOS in brain regions with increasing severity of AD pathology
Aberrant expression of nNOS has been reported in postmortem tissue from AD patients, however, the data within and between different brain regions are highly inconsistent. For this study, the cellular localization of nNOS was assessed in the inferior temporal gyrus (ITG), superior temporal gyrus (STG), precuneus (Pre), and primary visual cortex (PVC) by immunohistochemistry. These regions provide a range of AD severity across the brain at postmortem, with the ITG representing an early (clinically) and severely affected region (Paasila et al., 2019), the STG a moderately affected region (Youssef et al., 2018), the precuneus a late and mildly affected region (Guennewig et al., 2021), and the PVC a largely unaffected region (Guennewig et al., 2021; Paasila et al., 2019) (Supplementary Fig. S2).
These incrementally affected regions may act as a model of the natural history of AD, permitting the study of nNOS expression as the disease progresses (Sutherland et al., 2011).
A semiquantitative scale of immunoreactivity was developed to compare the severity of nNOS staining in control and LOAD tissue (Fig. 1a–e). Cases were ranked as follows: 0 = no nNOS immunoreactivity; 1 = occasional and light nNOS immunoreactivity in cell bodies from the lower cortical layers; 2 = dark nNOS immunoreactivity in cell bodies mainly confined to the lower cortical layers with no neurite pathology; 3 = frequent and dark immunoreactivity in cells across the cortical layers with occasional neurite pathology; and 4 = frequent and dark nNOS immunoreactivity in cells and neurites throughout the cortex and white matter.
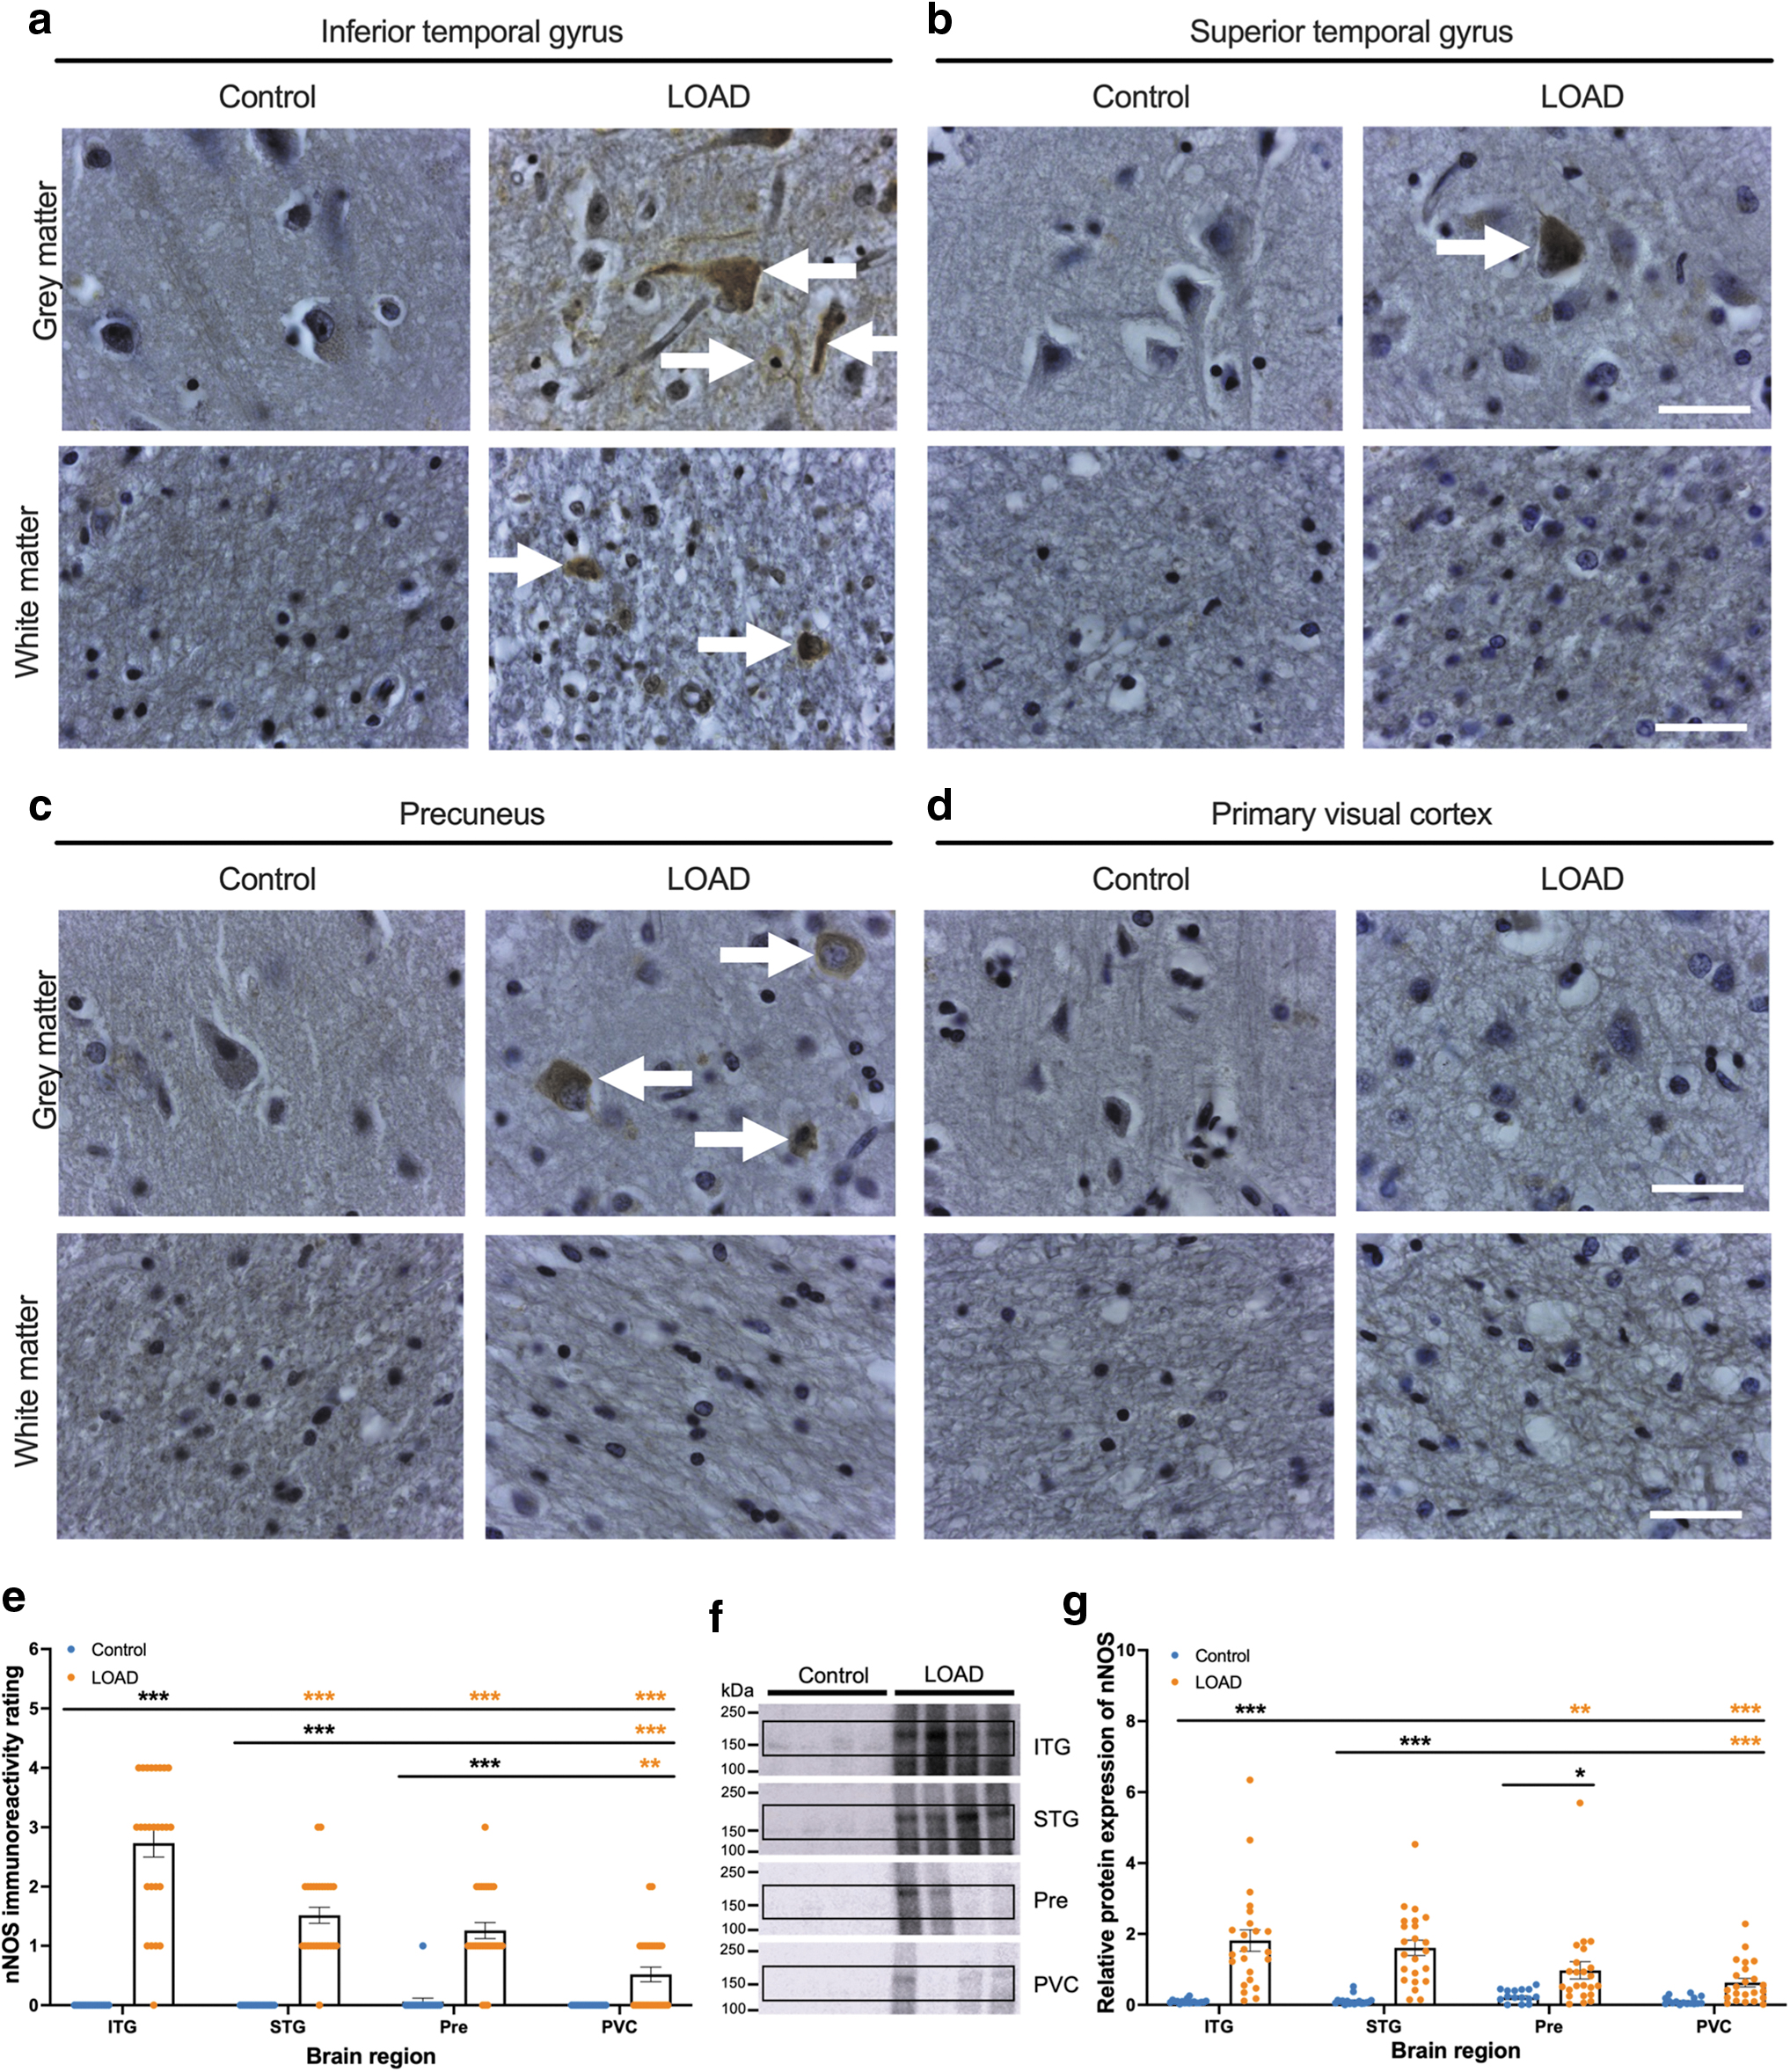
Across the four brain regions, there was a significantly higher level of nNOS immunoreactivity in the ITG, STG, and Pre in the LOAD cases in comparison with the same regions in the control cases (Fig. 1e). For the LOAD cases, the ITG had significantly more nNOS immunoreactivity in comparison with all other regions, with a positive nNOS staining across the cortical layers in the soma and neurites of neurons, as well as throughout the neuropil of the gray matter (Fig. 1a–e). There was also evidence of nNOS immunoreactivity in the cytoplasm of cells in both the gray and white matter of the ITG (Fig. 1a). There was no significant difference in nNOS immunoreactivity between the sexes for the ITG in the LOAD cases (Supplementary Fig. S3).
There was no significant difference in the severity of nNOS staining between the STG and Pre in LOAD cases, and staining for nNOS was observed in the cytoplasm of cells in the gray matter but was not visible in the neuropil or white matter (Fig. 1b, c, e). In the largely unaffected region of the PVC, there was significantly less nNOS immunoreactivity than in the ITG, STG, and Pre, with cases displaying occasional and light nNOS immunoreactivity in the lower cortical layers (Fig. 1a–e). Across the whole cohort, there was no correlation between nNOS immunoreactivity rating and age at death (years), Braak stage, fixation time (months), APOE genotype, or postmortem interval (hours), as determined by Pearson's correlation with 95% confidence interval (Supplementary Fig. S3).
To confirm the differences observed in nNOS expression from immunohistochemical analysis, Western blotting was used to quantify the relative protein amount, normalized to total protein (Fig. 1f, g and Supplementary Fig. S4). In line with the immunohistochemical results, there was low nNOS expression in the control tissue across the four brain regions (Fig. 1f, g). By comparison, there was a significantly higher level of nNOS expression in the LOAD ITG, STG, and Pre in comparison with the same regions in the control cases, although there was no significant difference in nNOS expression in the PVC of LOAD when compared with control cases (Fig. 1f, g).
For the LOAD cases, the ITG had a significantly higher amount of nNOS expression in comparison with the Pre and the PVC, while STG had a significantly higher amount of nNOS in comparison with the PVC, producing a trend aligned with the immunohistochemical observations (Fig. 1e, g). Thus, early and severely affected brain regions in AD exhibited increased nNOS, implicating AD-linked changes to nNOS regulation in the initial stages of the disease.
Increased amount of nNOS and nitrite in AD neuronal cultures
To investigate the functional consequences of increased nNOS identified in the postmortem studies, iPSCs from three controls, three LOAD, and an fAD donor were differentiated into neurons over a minimum of 54 days (Supplementary Fig. S5). The control and AD iPSCs were of similar ages and sex, had a >96.9% match with the corresponding fibroblasts, and a normal karyotype, with general donor information given in Supplementary Table S2. Immunocytochemical analysis of day 75 neurons (week 6 of neuronal maturation) demonstrated immunoreactivity for the neuronal marker microtubule associated protein 2 (MAP2), with little to no immunoreactivity for the glial marker glial fibrillary acidic protein (GFAP) across all lines, indicating the generation of neuronal cultures (Supplementary Figs. S6 and S14).
Live-cell calcium imaging using the ratiometric calcium indicator Fura-2 AM was performed on neurons differentiated for a minimum of 75 days, with a 60 mM high potassium (High K+) standard bathing solution (SBS) buffer used to depolarize neurons and induce a calcium response that could identify neurons post-imaging. All cells (100%) that had an influx of calcium following NMDA or glutamate, also responded to High K+ with an influx of calcium, indicating the generation of a highly pure culture of neurons that respond to glutamate (Supplementary Figs. S20 and S24). By day 47 of differentiation (week 2 of neuronal maturation), iPSC-derived neurons generated from LOAD and fAD donors had significantly shorter neurites with fewer branch-points, compared with control neurons (Supplementary Figs. S7 and S8). By day 54 (week 4 of neuronal maturation), LOAD neurons had significantly elevated levels of tau phosphorylated at S404 (Supplementary Figs. S9 and 10).
Meanwhile, the fAD neurons demonstrated a significantly higher Aβ42/40 ratio, in comparison with the control lines (Supplementary Fig. S11). These results indicate the generation of iPSC-derived neurons with key pathogenic phenotypes associated with AD.
We next investigated whether the increased nNOS in postmortem tissue from LOAD patients was recapitulated in iPSC-derived neurons generated from LOAD donors. Immunocytochemical analysis demonstrated immunoreactivity for the neuronal marker MAP2 across all lines, with low nNOS immunoreactivity throughout the cytoplasm and neurites of control neurons and an increase in nNOS immunoreactivity in the soma and neurites of neurons in all AD lines (Fig. 2a–c). It is widely reported that nNOS colocalizes with PSD-95 through a common PDZ binding domain, anchoring nNOS in the postsynaptic density and linking it to NMDAr (Kornau et al., 1995; Tomita et al., 2001). The flow of calcium ions through NMDAr following activation by glutamate is reported to stimulate nNOS and induce the formation of NO (Garthwaite et al., 1989). Neurons differentiated from these lines expressed nNOS localized with PSD-95 and the NMDA receptor subunit-NR1 (NMDAR1) (Supplementary Figs. S12–S14).
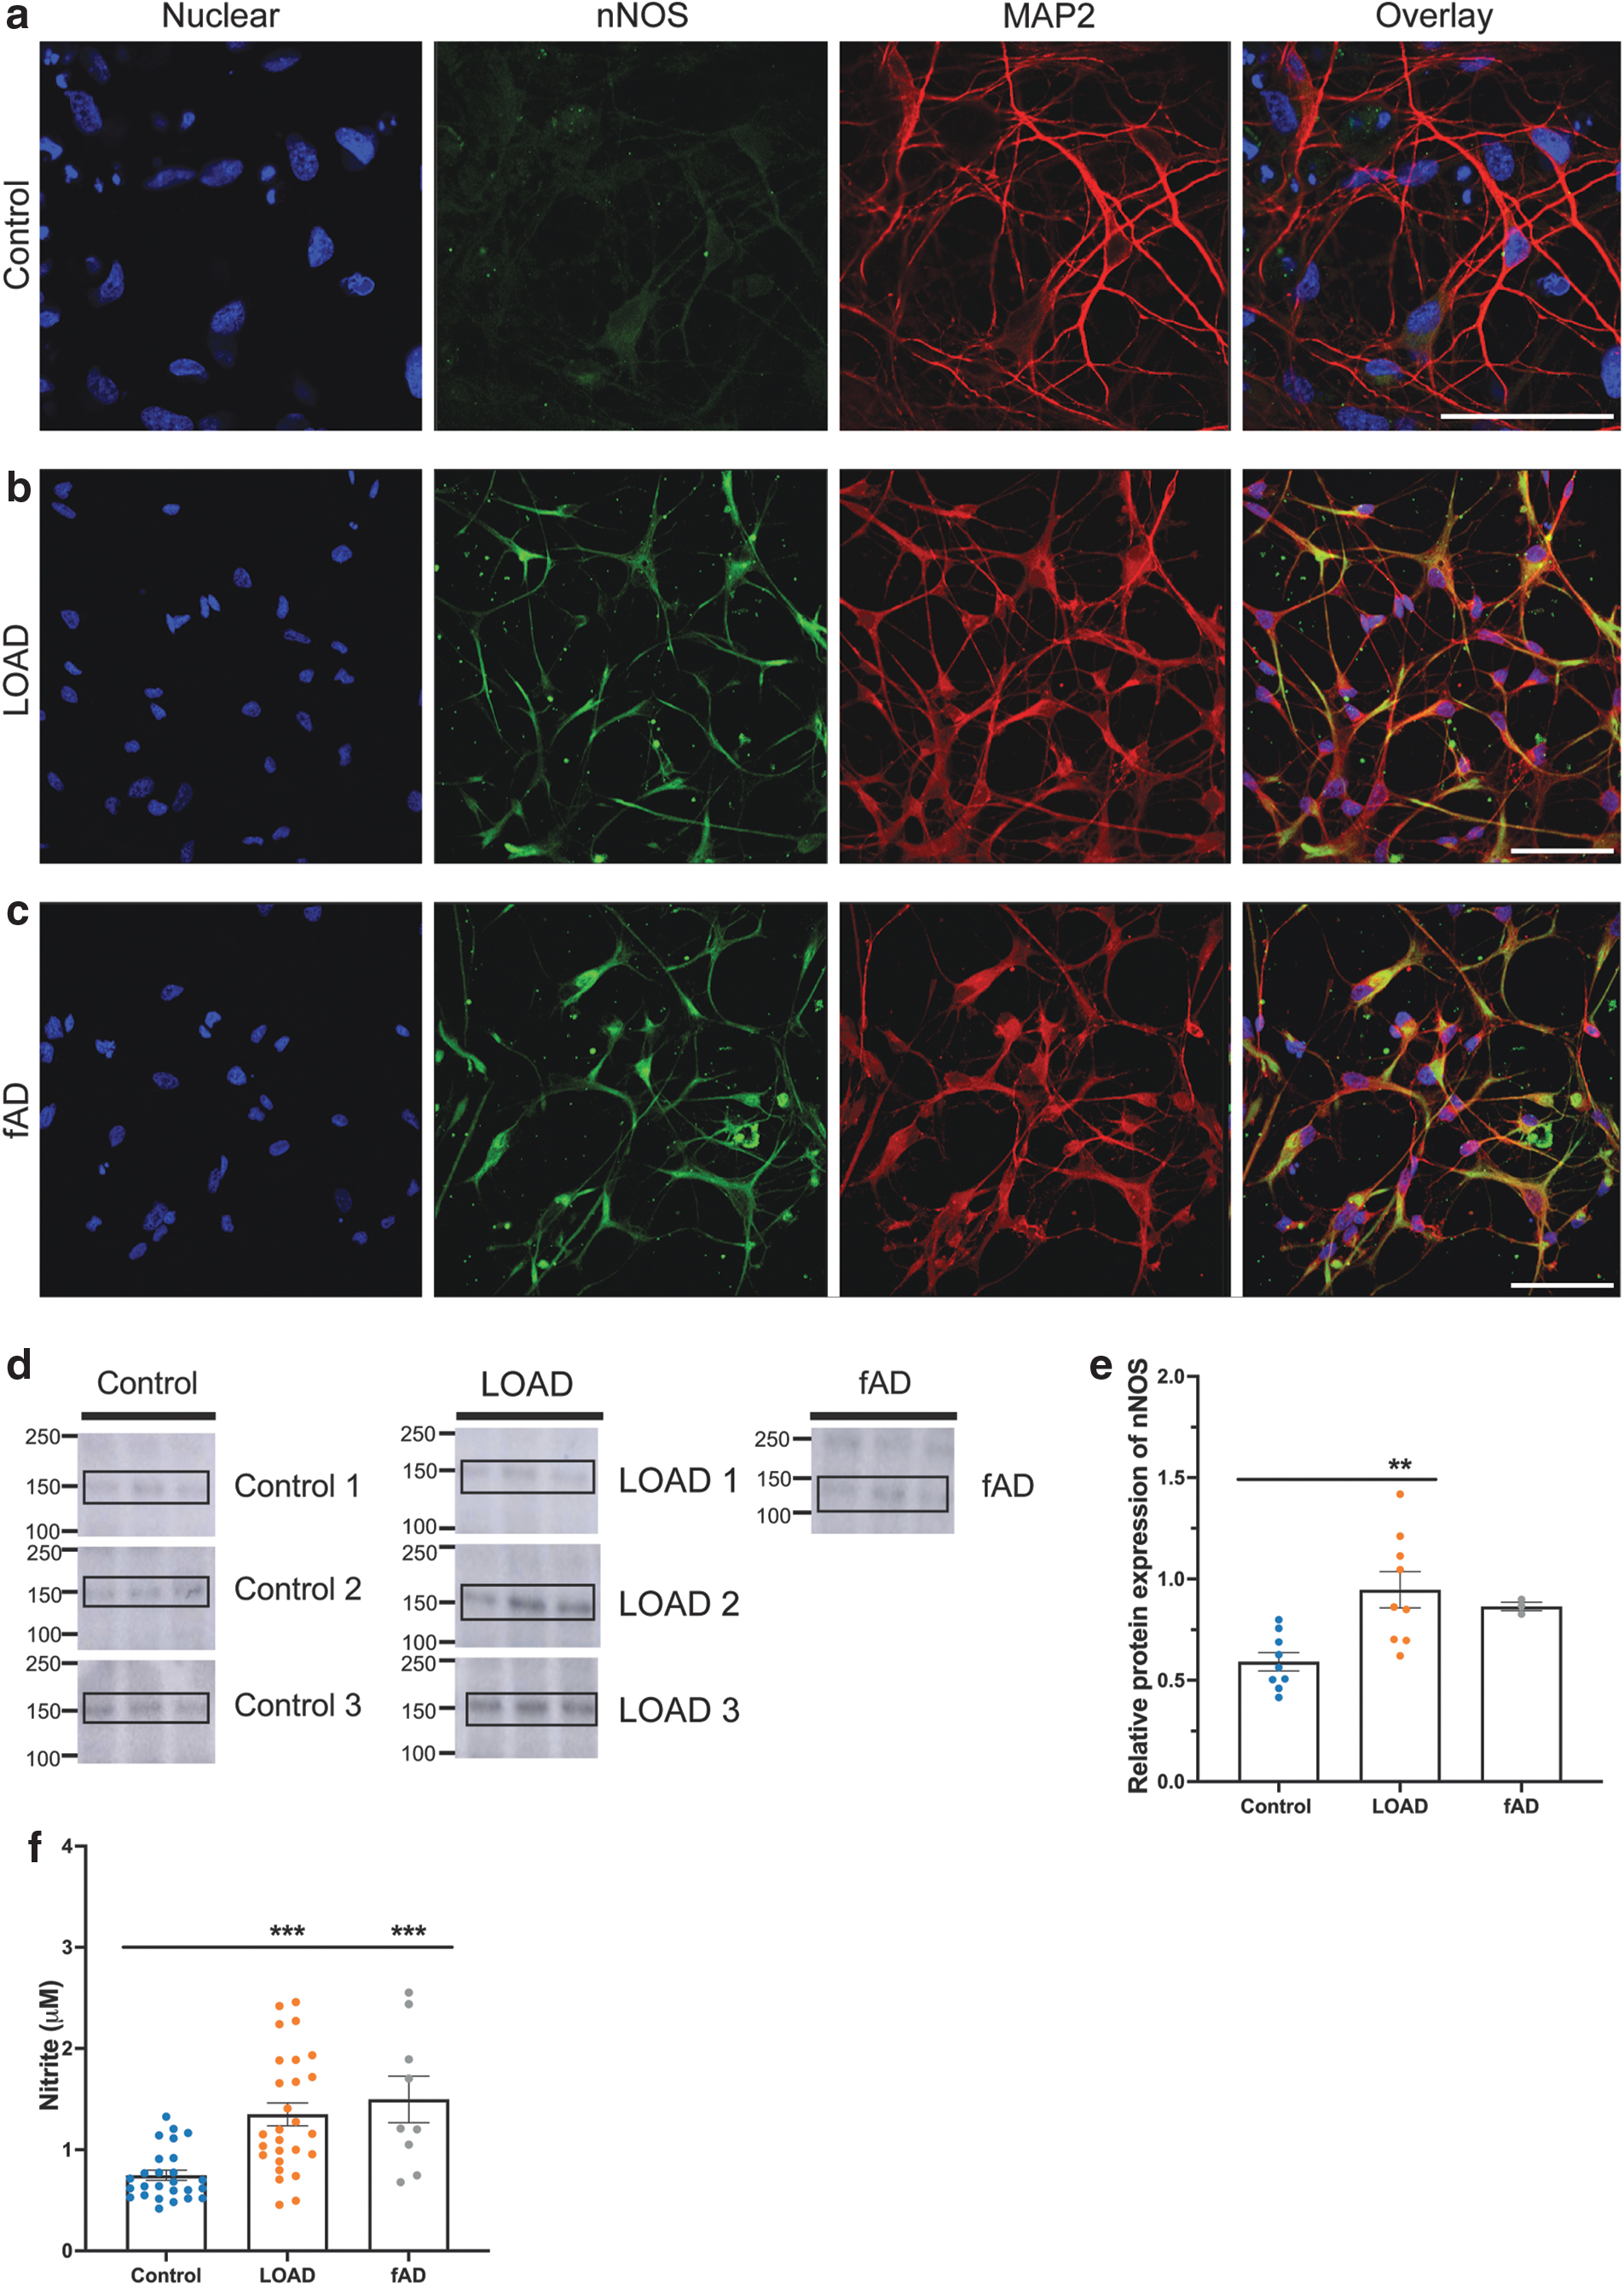
Western blotting was used to quantify relative protein amount in iPSC-derived neurons at day 54 (Fig. 2d, e and Supplementary Fig. S15). The relative amount of nNOS was significantly higher in the AD lines in comparison with the control lines (Fig. 2d, e), aligning with the immunocytochemical and human postmortem tissue Western blot results (Fig. 1). Nitrite, as a stable downstream product of NO production, was quantified by Griess assay in conditioned media from neurons at day 54. The AD lines had a significantly higher concentration of nitrite in comparison with the control lines (Fig. 2f). These results highlight that the increased nNOS expression in LOAD tissue postmortem is recapitulated in LOAD iPSC-derived neurons.
Modulation of NO alters calcium signaling
The production of NO by nNOS in postsynaptic neurons is induced by the flow of calcium ions through glutamate-activated calcium channels, specifically the NMDAr (Garthwaite et al., 1989). In this study, we hypothesized that the endogenously increased nNOS protein amount and NO levels could contribute to altered calcium signaling in AD. To investigate this hypothesis, live-cell calcium imaging was performed on neurons differentiated for a minimum of 75 days (week 6 of neuronal maturation) using the ratiometric calcium indicator Fura-2 AM. The fold change in the 340/380 ratio of fluorescence intensity over baseline fluorescence (ΔF/F0) was calculated to track changes to intracellular calcium levels in the soma of individual neurons over time.
To assess the functional implication of pharmacological modulation of NO levels on glutamatergic calcium signaling, before live-cell calcium imaging, neurons were pretreated with the nNOS inhibitor L-NNA, to determine the impact of acutely produced NO, or the NO scavenger carboxy-PTIO, to determine the impact of NO from intracellular reserves, such as nitrite. Neurons were then exposed to the NMDAr-specific agonist, NMDA, the excitatory neurotransmitter glutamate, and High K+, to induce the depolarization of neurons and an influx of calcium ions. Vehicle control experiments for the delivery of L-NNA or carboxy-PTIO, using 0.1% dimethyl sulfoxide (DMSO), demonstrated no difference in calcium traces for all donor lines (Supplementary Fig. S16). Inhibition of nNOS activity or scavenging of NO significantly reduced the level of nitrite, as determined by Griess assay, in all donor lines.
As expected, the level of nitrite following scavenging of NO was significantly lower than when nNOS activity was inhibited for the control and LOAD lines, when grouped by disease status (Supplementary Fig. S17). The basal ratio fluorescence of Fura-2 AM, representative of resting intracellular calcium levels, was not altered by inhibition of nNOS activity or scavenging of NO for each donor line (Supplementary Fig. S17). Representative experimental traces from a control and LOAD donor line and data grouped by disease status are reported here, with individual line responses reported in Supplementary Figures S20–S28.
Inhibition of nNOS reduced spontaneous calcium signaling and altered glutamate-induced calcium flux in healthy neurons
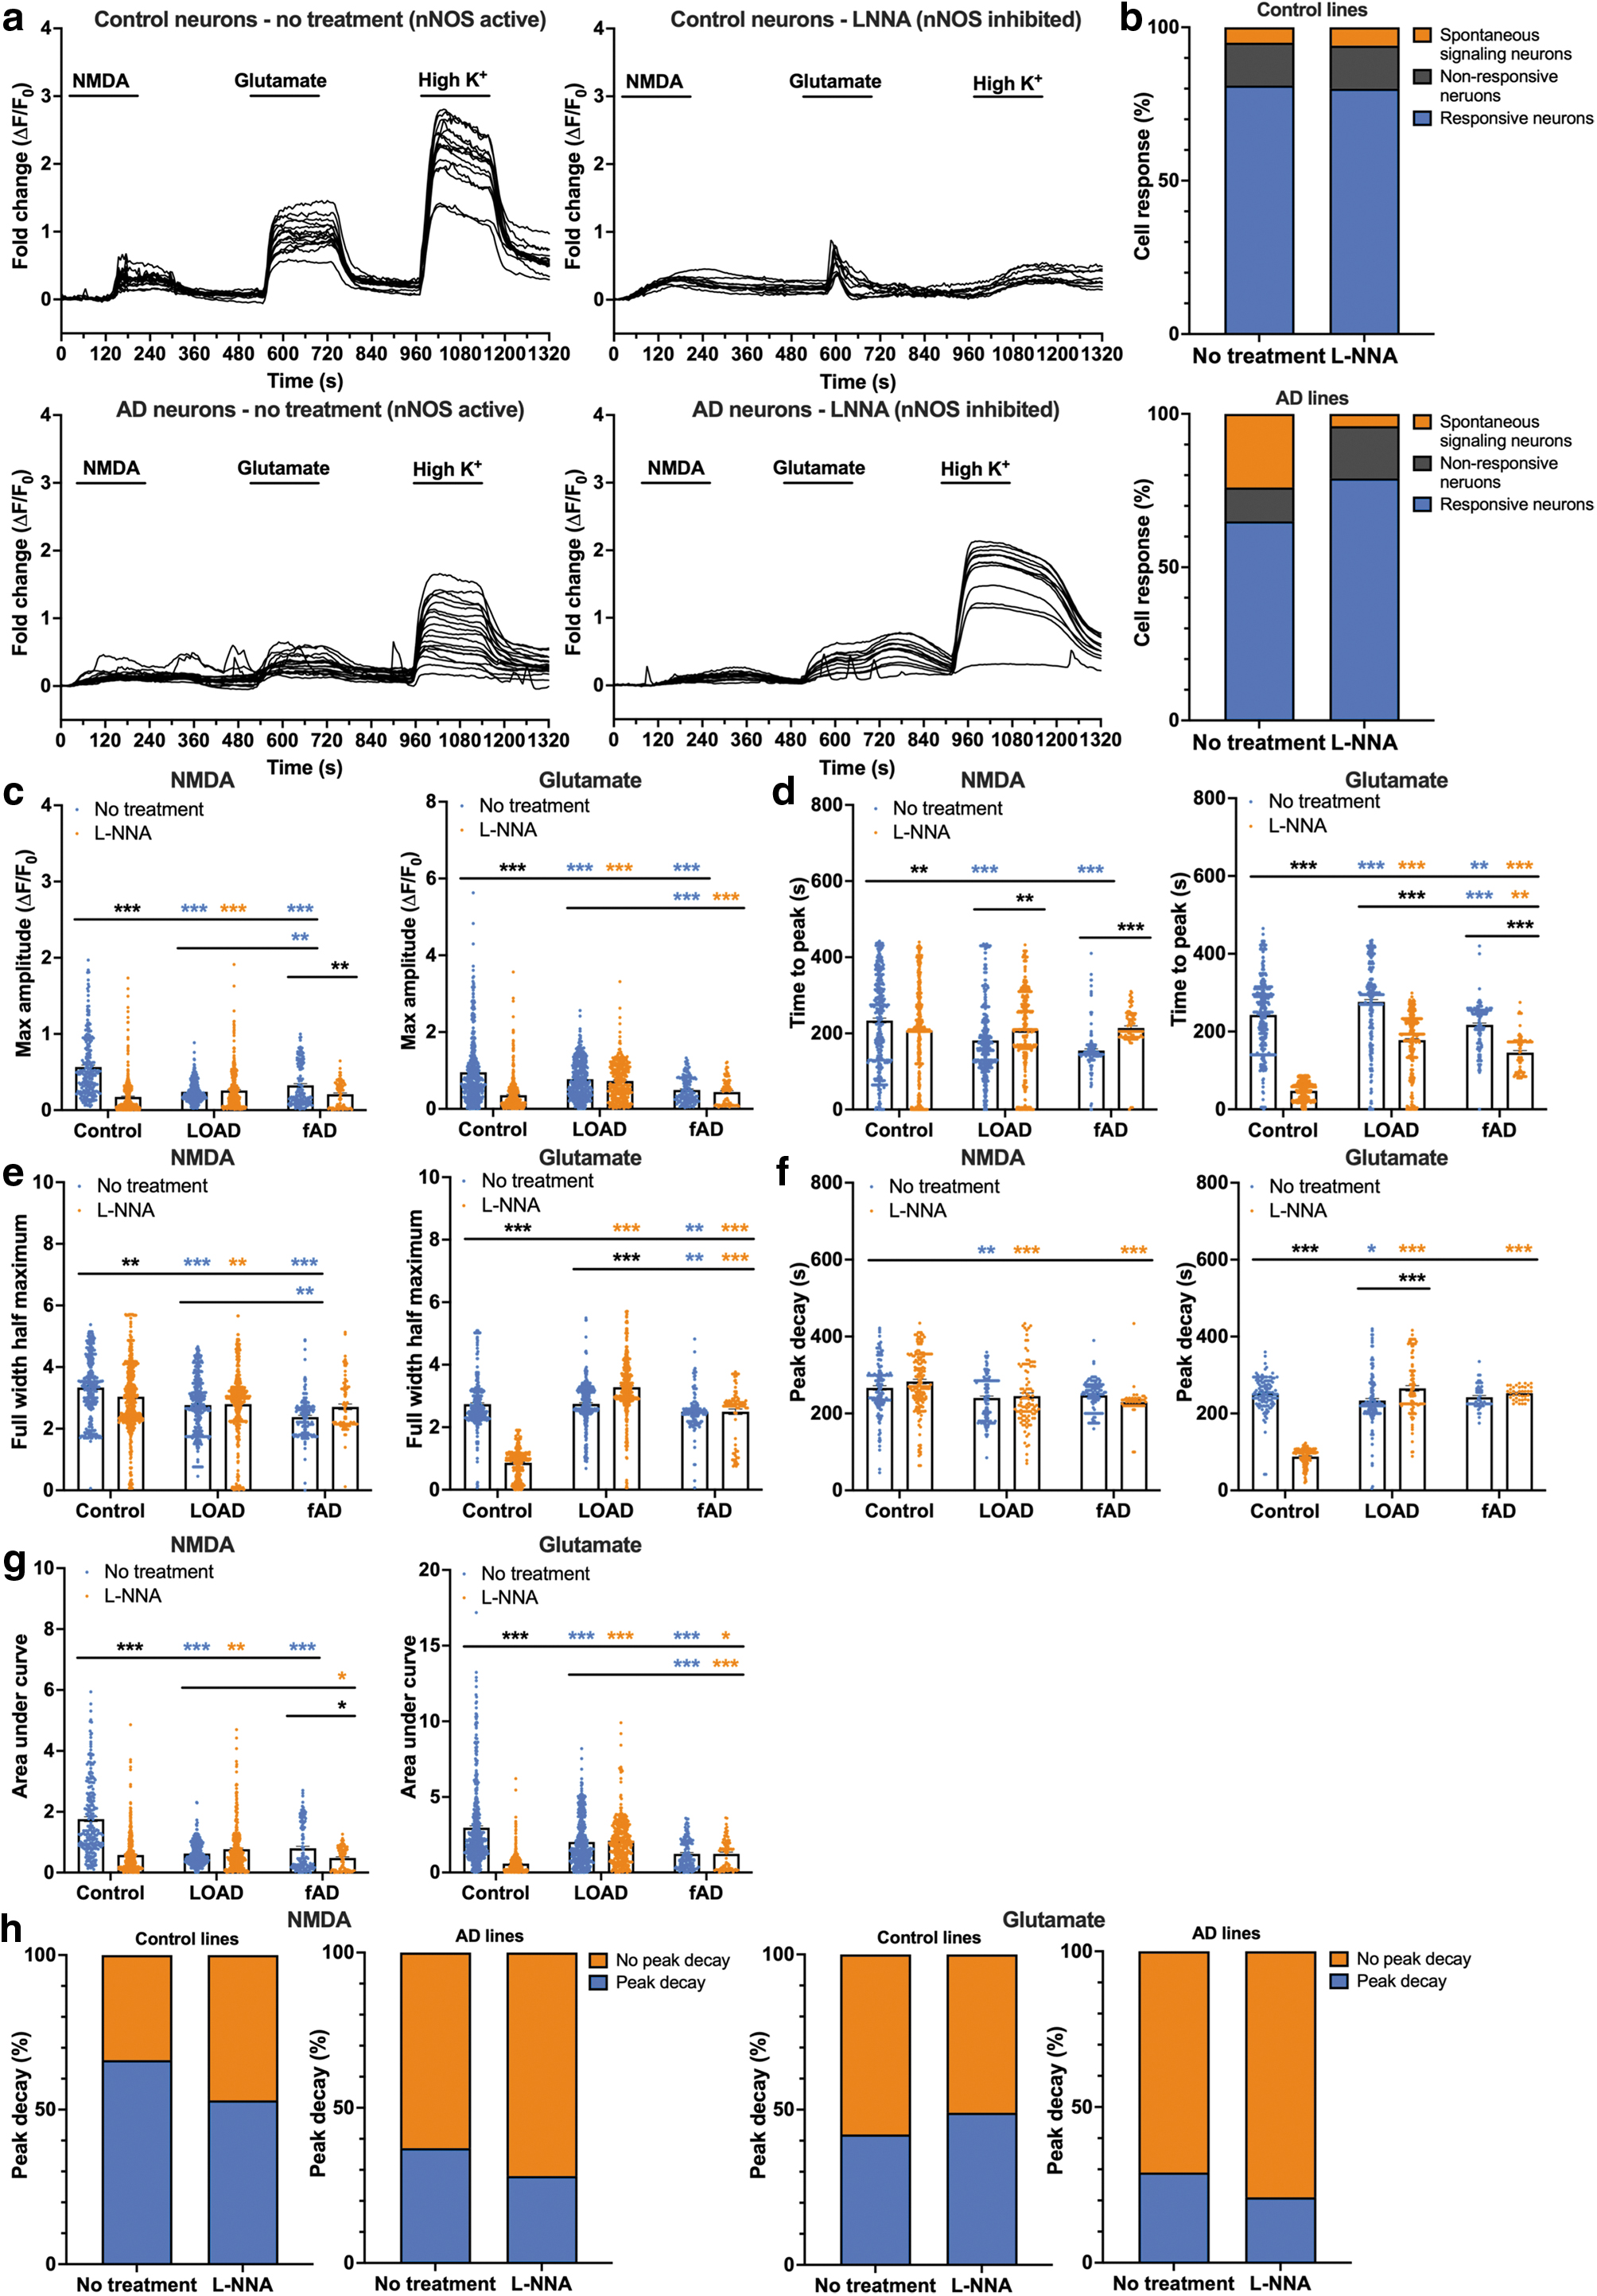
When nNOS was functional (in the absence of nNOS inhibition by L-NNA), both control and AD neurons from all lines responded to NMDA, glutamate, and High K+ with an influx of calcium (Fig. 3 a, b and Supplementary Figs. S20 and S21). However, the AD neurons exhibited an endogenous aberrant signaling phenotype with a sustained but significantly reduced calcium response amplitude to both NMDA and glutamate, along with subpopulations of neurons that were nonresponsive to excitatory agonists but demonstrated multiple spontaneous transient peaks in the absence of stimulus (Fig. 3a–c and Supplementary Figs. S20 and S21).
These spontaneous transient calcium peaks likely originated from extracellular sources as they were abolished in the presence of the calcium chelator ethylene glycol-bis(β-aminoethyl ether)-N,N,N′,N′-tetraacetic acid (EGTA) (Supplementary Fig. S18). In addition, neurons from the AD lines had a significantly higher basal 340/380 ratio fluorescence of Fura-2 AM in comparison with neurons from the control lines, suggesting elevated levels of resting intracellular calcium (Supplementary Fig. S19).
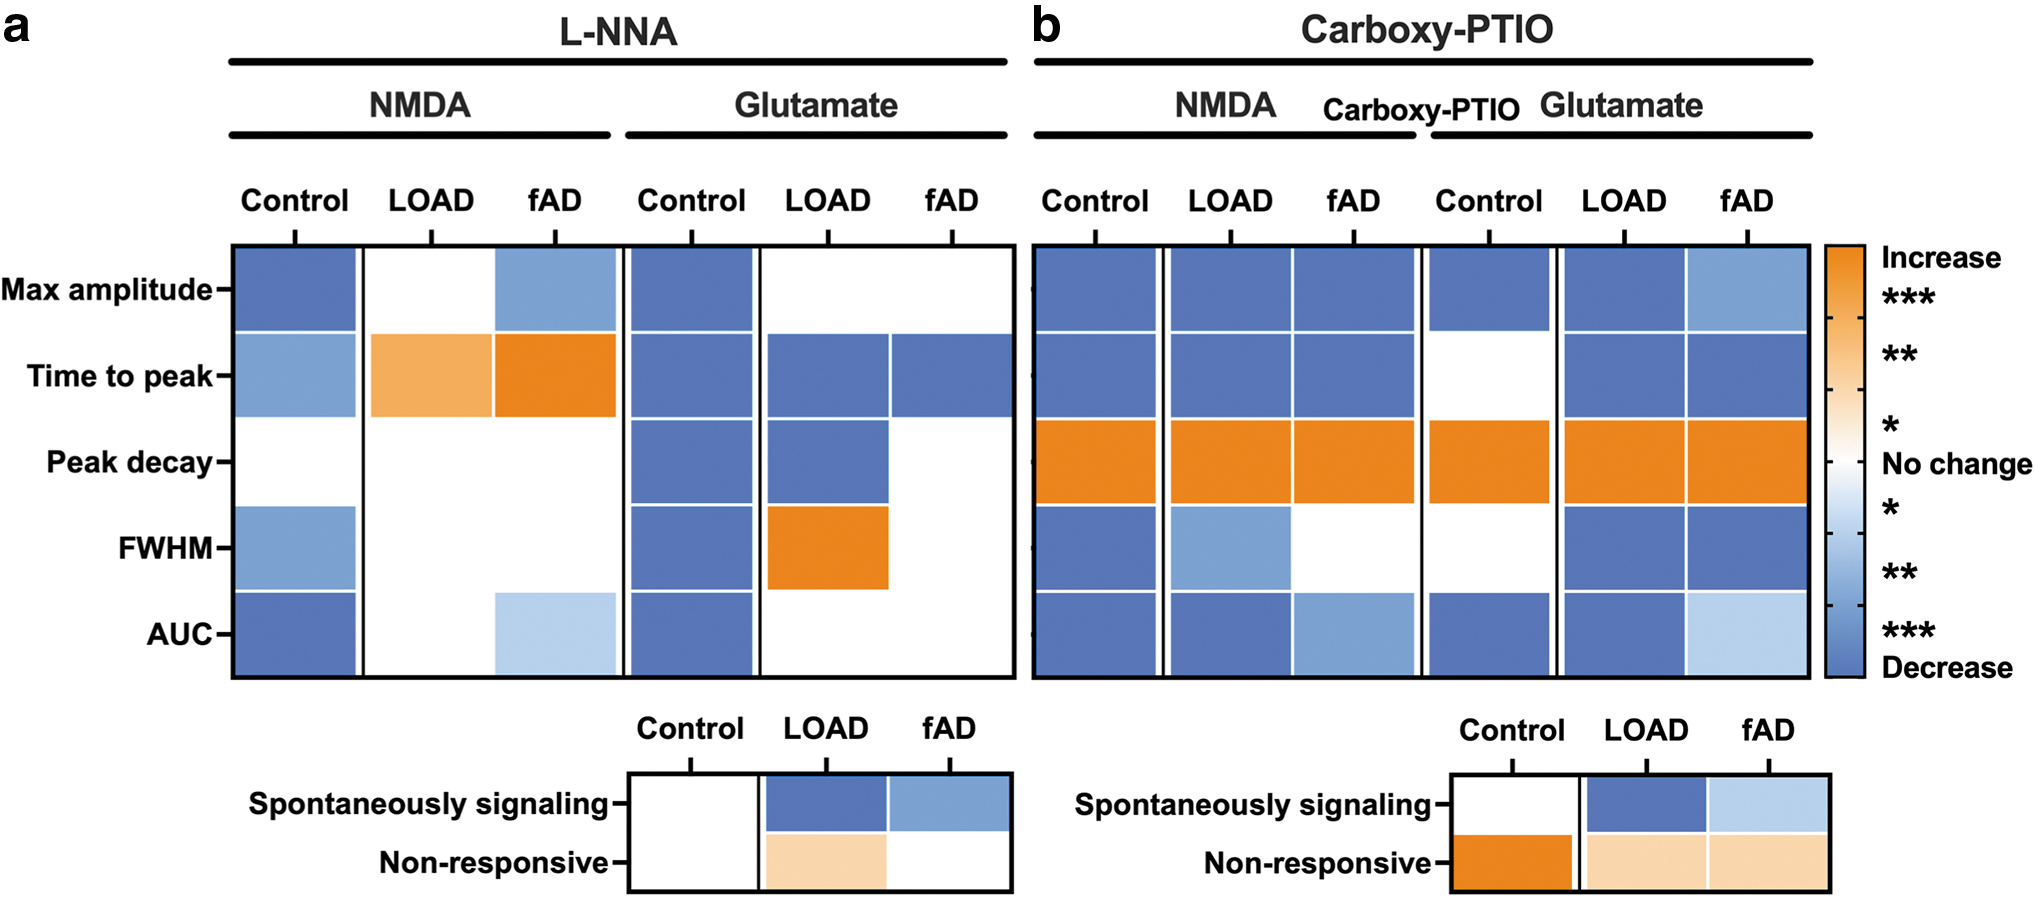
Inhibition of nNOS significantly reduced the amplitude of the calcium responses to NMDA and glutamate in the control lines (Fig. 3c and Supplementary Fig. S22A, B), indicative of the neuromodulatory role of NO. In contrast, inhibition of nNOS had a minimal effect on the amplitude of the calcium response in the AD lines, suggesting that the modulation of calcium signaling by NO is lost in these neurons (Fig. 3c and Supplementary Fig. S22A, B). This could be a consequence of functional decoupling of nNOS from PSD-95 and NMDAr, as demonstrated in tau pathology mice (Park et al., 2020), altered enzymatic function of nNOS, posttranslational modification of glutamatergic receptors, and/or elevated levels of nitrite in the AD lines. However, critically, inhibition of nNOS did reduce the number of neurons with spontaneous signaling in the absence of stimulus (Fig. 3b).
For the control lines, inhibition of nNOS altered the kinetics of the calcium peak, with a significant reduction in the time to peak and peak duration (full width half maximum; FWHM) in response to NMDA and glutamate, in addition to a significant reduction in the time for peak decay in response to glutamate (Fig. 3d–f and Supplementary Fig. S22C, H). This, in conjunction with the reduced amplitude, likely contributed to the significantly reduced global calcium response to NMDA and glutamate in the control lines when nNOS was inhibited (Fig. 3g and Supplementary Fig. S22I, J). In contrast, in the AD neurons, inhibition of nNOS had a minimal effect on the peak kinetics in response to NMDA, significantly increasing the time to peak, with no difference in the peak duration, time for peak decay, and consequently, the global calcium response (Fig. 3d–g and Supplementary Fig. S22C, E, G, I).
These data further support the hypothesis that modulation of calcium signaling by NO associated with nNOS activity is lost in AD neurons. However, in response to glutamate, inhibition of nNOS did significantly reduce the time to peak in the AD lines and significantly increased the peak duration and time for peak decay in the LOAD lines, although there was no overall difference in the global calcium response (Fig. 3d–g and Supplementary Fig. S22D, F, H, J). The proportion of neurons that returned to baseline following a calcium response to NMDA or glutamate was lower in the AD lines, in comparison with the control lines, with inhibition of nNOS exacerbating this trend (Fig. 3h and Supplementary Fig. S23).
Collectively, these results suggest that under nonpathogenic conditions, nNOS activity modulates calcium signaling in control neurons, with a loss of sensitivity to modulation by acutely produced NO during nNOS activity observed in AD neurons, through which inhibition of nNOS had a minimal effect. In addition, under AD pathogenic conditions, nNOS activity contributes to dysregulated calcium signaling, with spontaneous activity identified in subpopulations of neurons.
Scavenging of NO reduced spontaneous calcium signaling and glutamate-induced calcium flux in neurons
As NO can be released from intracellular nitrite and nitrate reserves, with the AD lines having higher endogenous nitrite (Fig. 2f), the consequence of endogenously elevated NO levels was then assessed through the scavenging of NO with carboxy-PTIO. When endogenous NO was present (in the absence of NO scavenger carboxy-PTIO), neurons from all donor lines responded to NMDA, glutamate, and High K+, with the AD lines demonstrating an aberrant signaling phenotype, including subpopulations of AD neurons nonresponsive to the excitatory agonists but demonstrating spontaneous transient peaks (Figs. 3a and 4a, b and Supplementary Figs. S24 and S25).
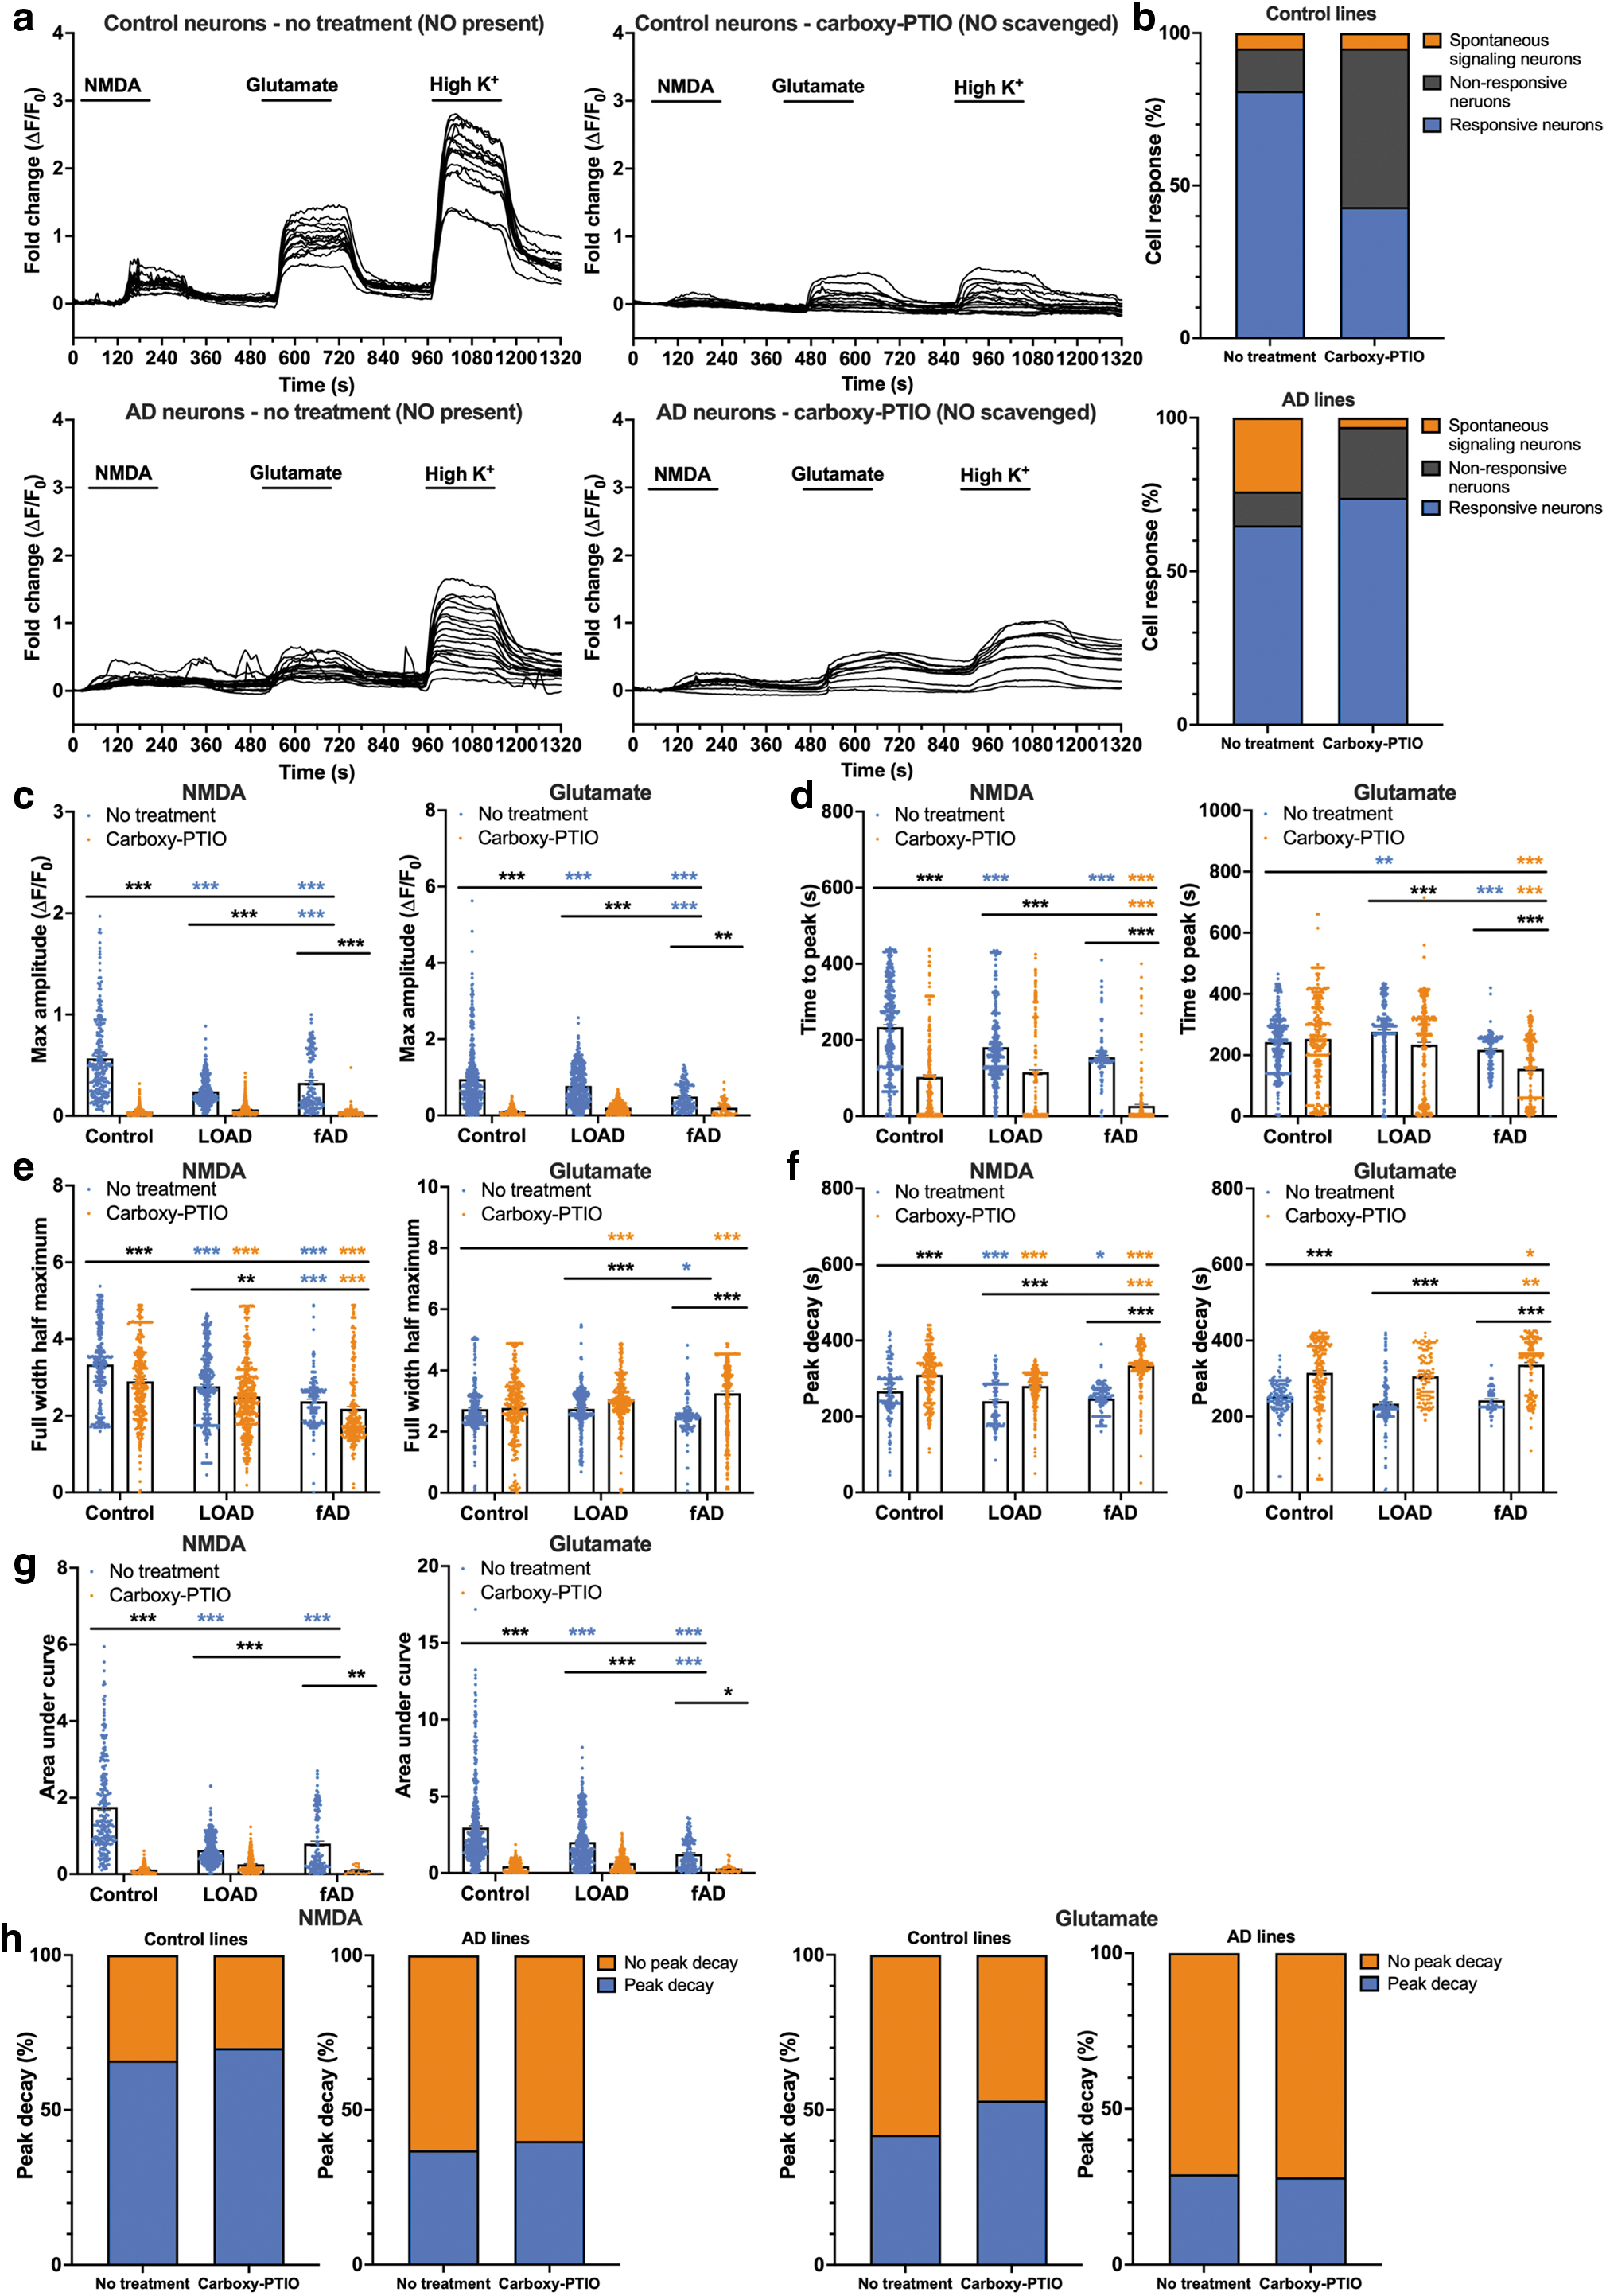
Scavenging NO significantly reduced the amplitude of the calcium response to NMDA and glutamate in the control lines and the AD lines, and reduced the proportion of AD neurons that signaled spontaneously in the absence of stimulus (Fig. 4b, c and Supplementary Figs. S25 and S26A, B). For both the control lines and the AD lines, scavenging NO altered the kinetics of the calcium peak in response to NMDA, significantly reducing the time to peak and peak duration, while significantly increasing the time for peak decay (Fig. 4d–f and Supplementary Fig. S26C, E, G). Consequently, scavenging NO resulted in a significantly smaller global calcium response to NMDA in the control lines and AD lines, compared with their respective untreated neurons, with no significant difference in the response between the control lines and AD lines (Fig. 4g and Supplementary Fig. S26I).
In contrast, in the absence of NO scavenger, control lines had a significantly larger global calcium response to NMDA, in comparison with the AD lines (Fig. 4g and Supplementary Fig. S26I). This suggests that cytosolic NO, potentially from nitrite/nitrate reserves, can modulate calcium signaling and may partially compensate calcium signaling in the AD lines in which modulation by NO from nNOS activity was lost.
Scavenging NO had a limited effect on the peak kinetics in response to glutamate in the control lines, with no significant difference in the time to peak or peak duration, although there was a significant increase in the time for peak decay (Fig. 4d–f and Supplementary Fig. S26D, F, H). As nNOS activity is not inhibited, this implies that in the control lines, NO produced during nNOS activity modulates glutamatergic calcium signaling more than persistent NO from nitrite, and may partially compensate for the scavenging of endogenous NO. In comparison, scavenging NO did alter the peak kinetics in the AD lines, significantly decreasing the time to peak and significantly increasing the duration of the peak and time for peak decay (Fig. 4g and Supplementary Fig. S26I).
This further supports the notion that in the AD lines, there is a loss of modulation of calcium signaling by NO during nNOS activity, as it was unable to compensate for the scavenging of endogenous NO, as observed in the control lines. In line with the calcium response to NMDA, scavenging NO significantly reduced the global calcium response to glutamate in the control lines and AD lines, in comparison with their respective untreated neurons, likely due to the smaller amplitude of the calcium peak (Fig. 4g and Supplementary Fig. S26I). When NO was present, the control lines had a significantly larger global calcium response to glutamate, in comparison with the AD lines, with no difference once NO was scavenged (Fig. 4g and Supplementary Fig. S26I).
The proportion of neurons that returned to baseline following a calcium response to NMDA or glutamate was lower in the AD lines in comparison with the control lines, with scavenging of NO having a minimal effect on this trend (Fig. 4h and Supplementary Fig. S27). These results suggest that NO plays a role in modulating calcium signaling in both control and AD neurons, and further supports the hypothesis that under pathogenic conditions, elevated levels of NO contribute to aberrant calcium signaling.
Together, the results from this work suggest that nNOS expression is increased postmortem in brain regions severely affected by LOAD, a phenotype that was recapitulated in iPSC-derived neurons generated from AD donors and was associated with higher levels of nitrite. Functionally, inhibition of nNOS activity or scavenging of NO reduced the proportion of AD neurons with spontaneous transient calcium peaks (Fig. 5 and Supplementary Fig. S28), implicating nNOS activity and NO in dysfunctional calcium signaling. For the neurons in the control lines, the inhibition of nNOS or the scavenging of endogenous NO significantly reduced the maximum amplitude and the global calcium response to both NMDA and glutamate (Fig. 5 and Supplementary Fig. S28). By comparison, for neurons in the AD lines, inhibition of nNOS did not reduce the maximum amplitude or global calcium response to NMDA or glutamate (Fig. 5a and Supplementary Fig. S28A).
However, scavenging of endogenous NO in the AD lines produced the same response to NMDA and glutamate as the controls, resulting in a decreased maximum amplitude and a global calcium response (Fig. 5b and Supplementary Fig. S28B). Thus, the data suggest that the increased nNOS in AD neurons underlies the higher intracellular reserves of NO/nitrite, however, the modulation of glutamatergic calcium signaling by NO during nNOS activity is lost, collectively contributing to the aberrant AD calcium signaling phenotype. When taken together, this indicates that there is a divergent role of NO in modulating calcium signaling in AD neurons when compared with healthy neurons: NO increases the calcium response to glutamate in control neurons, while reducing the calcium response in AD neurons. Furthermore, the AD neurons showed a decreased sensitivity to regulation.
Together this suggests that there may be different mechanisms of action between acutely produced NO during nNOS activity and more broadly persistent NO.
Discussion
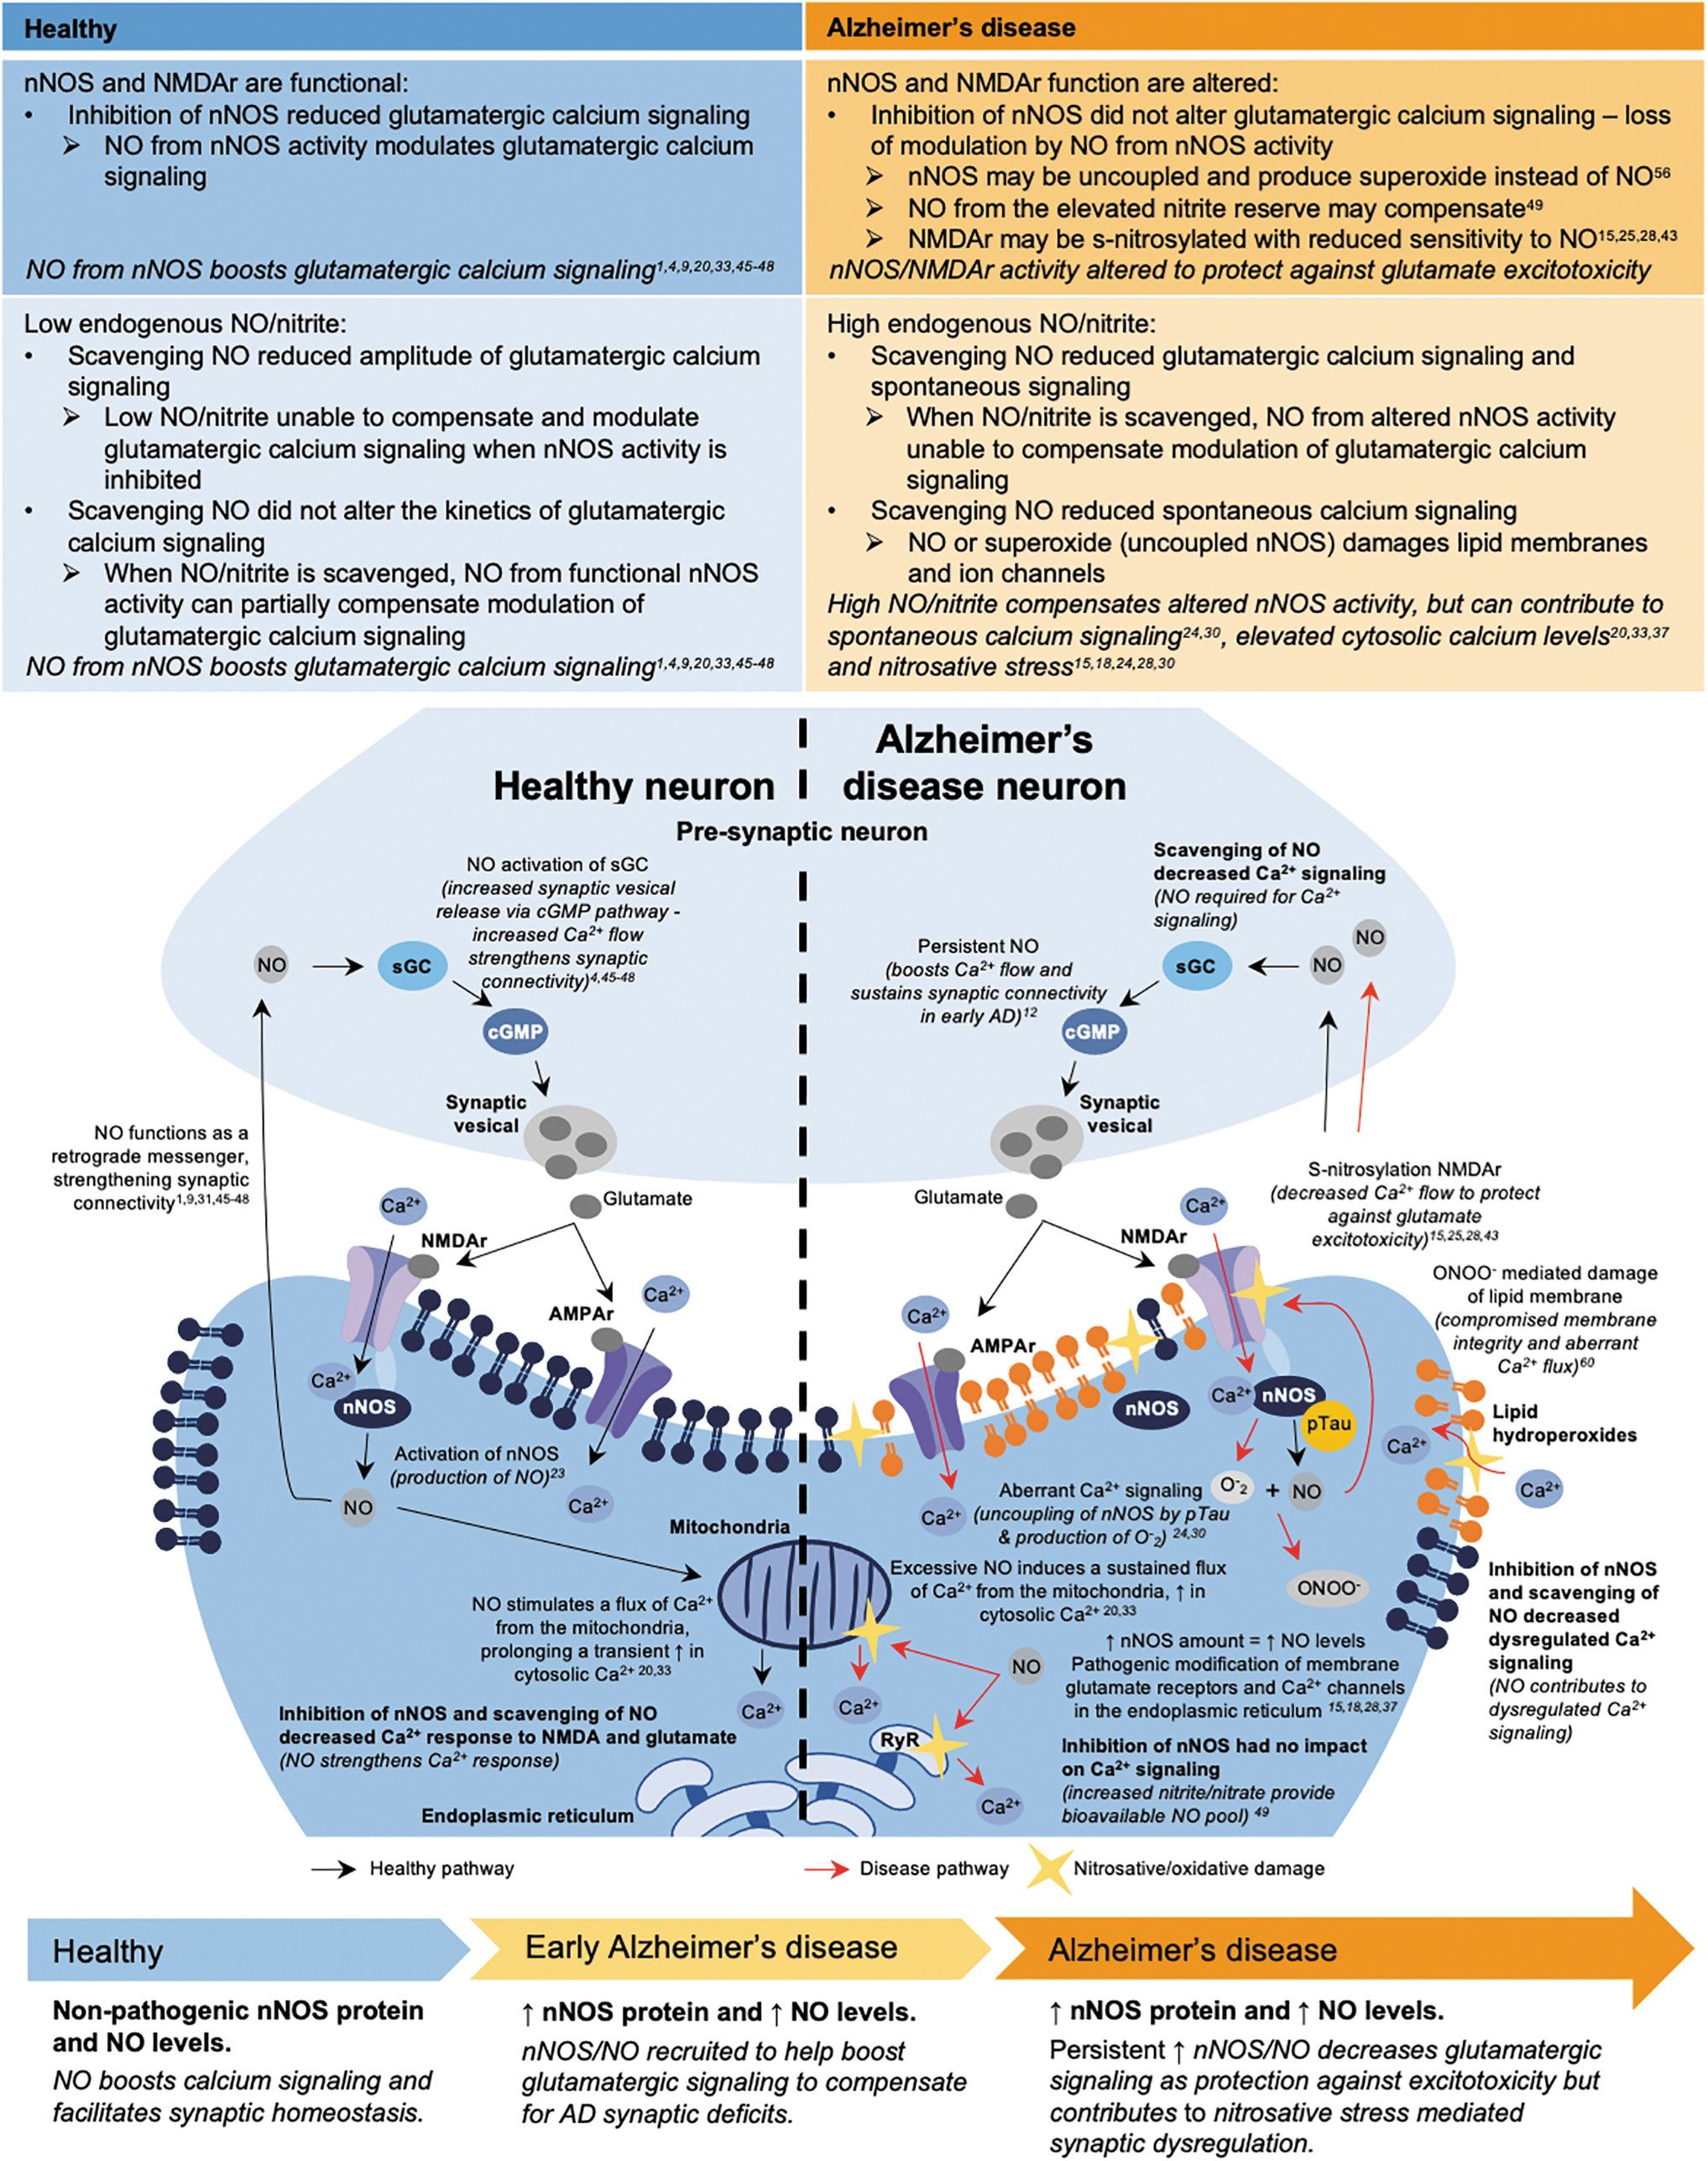
In the present study, we demonstrate that brain regions severely affected by AD have increased nNOS protein levels in human pos mortem tissue and that neurons generated from iPSC-derived AD donors have increased nNOS protein and a higher basal level of nitrite. Functionally, nNOS activity and endogenous NO strengthened the calcium response to glutamatergic agonists in control iPSC-derived neurons, while the increased levels of nNOS and NO dampened and dysregulated the calcium response in the AD neurons, as inhibiting nNOS activity or scavenging endogenous NO partially improved dysregulated calcium signaling.
This divergent modulatory role of NO could suggest that increases in nNOS and NO may initially be a compensatory mechanism to boost and protect calcium signaling homeostasis during early AD. However, when sustained over time, increased NO contributes to the progression of AD, reflective of the proposed dual neuroprotective and neuropathogenic nature of NO (Azargoonjahromi, 2023; Balez and Ooi, 2016; Calabrese et al., 2007; Chakroborty et al., 2015; Granzotto et al., 2022; Hyman et al., 1992).
The reported expression pattern of increased nNOS protein in brain regions that are implicated early in AD pathogenesis [ITG (Paasila et al., 2019) and STG (Youssef et al., 2018)] resolves some of the long-standing controversy in the field, by demonstrating clear region-specific variations in expression and localization of nNOS within the same cohort (Balez and Ooi, 2016; Law et al., 2001). The increase in nNOS has been proposed as an initially protective mechanism against synaptic dysfunction and NMDA-mediated toxicity, with quantification of nNOS-positive neurons in the hippocampus and ITG of LOAD postmortem tissue showing relative sparing from neuronal loss (Hyman et al., 1992), while nNOS-enriched neonatal striatal mouse cultures had reduced vulnerability to NMDA excitotoxicity (Granzotto et al., 2022). However, in the pro-oxidative environment of the LOAD brain, the increased amount of nNOS and NO release could, over time, be a factor underlying nitrosative stress and contribute to the dysregulation of calcium signaling and the loss of surrounding neurons (Hyman et al., 1992; Koppal et al., 1999; Radi et al., 1991; Smith et al., 1997; Zahid et al., 2014).
We show for the first time the endogenous recapitulation of this human LOAD phenotype in iPSC-derived neurons from AD donors. The expression of nNOS with PSD-95 and NMDAr in iPSC-derived neurons specifies the expected localization of nNOS to produce NO (Garthwaite et al., 1989; Kornau et al., 1995; Tomita et al., 2001) and implicates nNOS with NMDA-mediated excitotoxicity (Sattler et al., 1999) and neurotoxicity (Balez and Ooi, 2016; Gunasekar et al., 1995). There is remarkable complexity to NO metabolism, through which a number of cellular factors, such as the redox status of the cell and levels of transition metals, influence the conversion of NO to other reactive downstream products in the NO metabolism pathway, such as nitrate (Ferrer-Sueta et al., 2018), instead of nitrite (Lundberg et al., 2008).
In addition, it should be noted that increased protein levels may not necessarily result in functional enzymes, and thus, direct quantification of NO production should be assessed using fluorescence or chemiluminescence approaches (Goshi et al., 2019).
Although nNOS is a constitutively expressed enzyme, dynamic transcriptional regulation can occur in response to several physiological or pathogenic stimuli, including changes in calcium signaling (Chakroborty et al., 2015; Sasaki et al., 2000), transcription factors (Li et al., 2007), and proinflammatory cytokines (Chesler et al., 2004). Calcium entry through voltage-gated calcium channels, or calcium release through ryanodine receptors in the endoplasmic reticulum, has been reported to increase NOS1 messenger RNA (mRNA) in rat cortical neurons and nNOS protein levels in 3xTg-AD (amyloid precursor protein [APP]swe, TauP301L, and presenilin 1 [PSEN1]M164VKI) mice, respectively, through activation of the transcription factor CREB (Chakroborty et al., 2015; Sasaki et al., 2000). Alternatively, it has been demonstrated in NB41A3 murine neuroblastoma cells that the proinflammatory cytokine interferon-γ increases nNOS protein levels, without influencing NOS1 transcription, rather through increasing mRNA and protein stability (Chesler et al., 2004).
As dysfunctional calcium signaling (AACHW, 2017) and inflammation (Belkhelfa et al., 2014) are considered early and central mechanisms of AD, this may account for the increased nNOS amounts in brain regions implicated early in AD (ITG and STG), in conjunction with dysfunctional calcium signaling, as observed in the iPSC-derived AD neurons. Thus, multiple mechanisms may drive the increase in nNOS protein amount during AD, in turn leading to higher NO levels and nitrosative stress, which we propose further disrupt calcium signaling in a pathogenic feed-forward cycle.
The modulatory role of NO in neuronal calcium signaling is complex and postulated to be both neuroprotective and neurotoxic. The neuroprotective actions include facilitating synaptic plasticity and presynaptic vesicle release (Chakroborty et al., 2015; East and Garthwaite, 1991; Haley et al., 1992; Schuman and Madison, 1991), while minimizing NMDAr excitotoxicity (Ghatak et al., 2021; Granzotto et al., 2022). In contrast, the neurotoxic effects appear to be due to persistent nitrosative stress (Balez and Ooi, 2016; Smith et al., 1997). We hypothesized that increased nNOS and NO levels contribute to the dysregulation of calcium signaling dynamics in the LOAD neurons, which exhibited increased spontaneous transients (Bai et al., 2017; Ghatak et al., 2019; Park et al., 2018) and a higher proportion of nonresponsive neurons, in comparison with the control lines (Busche et al., 2012; Park et al., 2018).
In support of this, it has been reported that peroxynitrite can damage the lipid membrane (Radi et al., 1991). In addition, NO-mediated excessive S-nitrosylation of CDK5, a cyclin-dependent serine/threonine kinase colocalized with nNOS, PSD-95, and NMDAr, can contribute to synaptic damage during AD through multiple mechanisms, including phosphorylation of NMDAr and P/Q-type voltage-gated calcium channels (Liu et al., 2016; Mishiba et al., 2014; Plattner et al., 2014; Qu et al., 2011; Smith et al., 1997). These changes could dysregulate calcium signaling and contribute to the silencing of neurons. As inhibiting nNOS or scavenging NO ameliorated dysregulated calcium signaling, these data suggest that activity of increased nNOS and elevated NO levels could, in part, facilitate this phenotype.
In conjunction with dysregulated calcium signaling, iPSC-derived AD neurons also had a dampened but prolonged response to excitatory glutamatergic agonists and higher basal cytosolic calcium, in comparison with controls (Choi et al., 2000; Li et al., 2009). This dampened calcium response is in line with work in primary mouse neonatal striatal cultures that demonstrated neurons expressing nNOS had significantly decreased NMDAr-mediated calcium peak amplitudes during excitotoxic insult (Granzotto et al., 2022). A proposed mechanism could be S-nitrosylation of NMDAr by NO-related species, which is reported to decrease calcium flux to facilitate feedback inhibition as a protective mechanism against glutamate-induced excitotoxicity in Xenopus laevis oocytes (Choi et al., 2000) and primary murine striatal, granule (Manzoni et al., 1992), and cortical cultures (Jaffrey et al., 2001; Lei et al., 1992).
The higher basal cytosolic calcium and prolonged calcium response to excitatory agonists, even in the presence of nNOS inhibition or NO scavenging, could be due to NO-related species-induced release of calcium from intracellular stores, such as mitochondria or the endoplasmic reticulum (Horn et al., 2002; Kakizawa et al., 2012). Work using embryonic mouse striatal neurons demonstrated that persistent NO production by NMDAr-mediated calcium signaling evoked the irreversible release of calcium from mitochondrial stores, due to the permanent formation of the mitochondrial permeability transition pore, sustaining calcium signals and increasing basal calcium levels (Horn et al., 2002). In addition, it has been reported in Purkinje cells that NO can lead to the S-nitrosylation of ryanodine receptors in the endoplasmic reticulum, inducing a release of calcium into the cytosol although a nonglutamatergic signaling pathway of NO-facilitated burst stimulations (Kakizawa et al., 2012).
Our results, in context with these studies, demonstrate that NO may be altering calcium signaling via multiple distinct mechanisms and support the notion that increased levels of nNOS and NO in AD neurons could prolong calcium responses and increase cytosolic calcium, while dampening the endogenous glutamatergic calcium response, recruited as a protective mechanism against AD-associated excitotoxicity.
Endogenous NO and nNOS activity was potentially neuroprotective in the control lines, as scavenging NO reduced the amplitude of the calcium response through NMDAr and glutamatergic receptors, while inhibiting nNOS activity also markedly augmented the peak kinetics to glutamate, reducing all peak parameters. Several modes of action may be contributing to these differences in calcium signaling dynamics. It has been demonstrated that NO at physiological levels acts as a retrograde messenger at presynaptic terminals by activating soluble guanylyl cyclase to produce cyclic guanosine 3′,5′ monophosphate (cGMP), which sustains glutamate release to strengthen long-term potentiation (East and Garthwaite, 1991; Haley et al., 1992; Pourbagher-Shahri et al., 2021; Schuman and Madison, 1991).
The difference in calcium peak kinetics in the control lines when nNOS was inhibited could be due to inhibition of NO-induced release of intracellular calcium from the endoplasmic reticulum or mitochondrial stores (Horn et al., 2002; Kakizawa et al., 2012). Transient NO produced during NMDAr-mediated calcium signaling in embryonic mouse striatal neurons was shown to evoke the transient release of calcium from mitochondrial stores, as inhibition of nNOS markedly augmented the calcium peak kinetics, attenuating prolonged calcium signals (Horn et al., 2002). In addition, the variation in calcium peak kinetics between the NMDAr signaling and the broader glutamatergic calcium response (including the ionotropic NMDA, AMPA, kainate receptors and metabotropic glutamate receptors) when nNOS was inhibited in the control lines could be due to S-nitrosylation of a broad range of proteins by NO (Yang et al., 2022), including protein kinases.
Posttranslational modification allows NO to modulate a suite of different postsynaptic glutamate receptors and ion channels, including voltage-gated sodium (Hammarström and Gage, 1999), calcium, and potassium channels and calcium-activated potassium channels (Kawano et al., 2009; Shin et al., 1997).
By comparison, inhibition of nNOS activity did not alter the glutamatergic calcium response in AD neurons, suggesting a loss of modulation to calcium signaling by NO during nNOS activity. Our results are consistent with a transgenic mouse study overexpressing mutant tau (rTg4510 [P301L] and PS19 [P301S]), which demonstrated that phosphorylated tau decouples nNOS from PSD-95 and NMDAr, resulting in a decrease in NO production in favor of the superoxide pathway and a loss of regulation of NMDAr function (Park et al., 2020). As the LOAD iPSC-derived neurons exhibit increased levels of phosphorylated tau, nNOS activity during glutamatergic calcium signaling may produce superoxide, and thus, inhibition of the enzyme with L-NNA has less of an effect than scavenging NO with carboxy-PTIO. Such early phenotypes of tau pathology-driven calcium signaling changes are consistent with observations of alterations in neuronal excitability in AD (reviewed in Targa Dias Anastacio et al., 2022).
Alternately, both nitrite and nitrate have been reported to function as bioavailable pools of NO (Lundberg et al., 2008), and thus, the increased levels of endogenous nitrite in the AD lines may be compensating for the inhibition of nNOS function. This concept is supported by the observation that scavenging of NO reduced nitrite levels more than inhibition of nNOS, and that scavenging NO in the AD lines did reduce the calcium response, in line with the controls. When the glutamatergic calcium signaling responses are viewed together, it implies that acutely produced NO through nNOS activity strengthens the calcium responses in the control lines, potentially through the cGMP pathway and transient release of calcium from intracellular stores.
In contrast, higher levels of NO in the AD lines increase basal calcium levels while prolonging and dampening the calcium response, potentially through irreversible opening of mitochondrial permeability transition pores (Horn et al., 2002), release of calcium from the endoplasmic reticulum (Chakroborty et al., 2015; Kakizawa et al., 2012), uncoupling of the enzyme from NMDA by phosphorylated tau (Park et al., 2020), or S-nitrosylation of NMDAr to downregulate excessive activity (Choi et al., 2000; Lipton et al., 1993), with persistent pools of nitrite sustaining this regulatory effect.
The proposed neuroprotective and neuropathogenic role of NO signaling during AD observed in this study broadly aligns with work in 3xTg-AD (APPswe, TauP301L, and PSEN1M164VKI) mice (Chakroborty et al., 2015) and iPSC-derived fAD lines (PSEN1M146V, APPswe, or PSEN1ΔE9) and their corresponding CRISPR-corrected isogenic controls (Ghatak et al., 2021). In presymptomatic 3xTg-AD CA1 neurons, there was a significant increase in nNOS protein and higher basal synaptically evoked calcium responses, partially mediated through intracellular calcium release from the endoplasmic reticulum, which were significantly decreased when nNOS was inhibited (Chakroborty et al., 2015). It was hypothesized that in this primordial disease state, before the observation of signaling deficits, nNOS and NO are recruited to boost synaptic calcium signals to maintain network homeostasis, similar to the signaling modulation observed in the control neurons of this study (Azargoonjahromi, 2023; Chakroborty et al., 2015).
By comparison, in mixed iPSC-derived fAD two-dimensional cultures of excitatory and inhibitory cerebrocortical neurons and three-dimensional organoids, there was also a significant increase in glutamate evoked calcium flux in addition to increased spontaneous calcium transients (Ghatak et al., 2021). Although nNOS protein levels and basal NO were not assessed in Ghatak et al. (2021), treatment with nitrosynapsin, a dual allosteric antagonist that S-nitrosylates NMDAr, was protective against aberrant synaptic signaling, although the impact on glutamatergic signaling was not directly investigated (Ghatak et al., 2021).
In the context of our results and these studies, we propose multifaceted effects of nNOS/NO that first strengthen the calcium response in early AD neurons as a neuroprotective function against AD synaptic deficits (Chakroborty et al., 2015), which, when sustained, triggers a divergent neuroprotective feedback mechanism against glutamate-induced excitotoxicity that dampens calcium flux through NMDAr (Ghatak et al., 2021; Granzotto et al., 2022). However, over time, the increased nNOS/NO contributes to nitrosative stress-mediated damage of proteins and lipids, as well as irreversible release of calcium from intracellular stores, further dysregulating calcium signaling and contributing to neurotoxicity.
Although it was not the focus of this study, it is important to note in the broader context of AD, the contribution of NO produced from other NOS isoforms, such as cytokine-stimulated induction of NO by iNOS in microglia and astrocytes (Aktan, 2004). As inflammation is considered a central component of AD, it is highly likely that iNOS in glial cells is induced to produce NO (Belkhelfa et al., 2014). In addition, increased iNOS has been reported in astrocytes from the frontal, temporal, and entorhinal cortex of human postmortem tissue from AD brains, and was shown to be colocalized with nitrotyrosine, a marker of nitrosative stress (Lüth et al., 2002).
Little work has been done to assess the impact of iNOS-produced NO on neuronal calcium signaling during AD, however, it has been reported using mouse neocortex brain slices that astrocytic iNOS can modulate short-term synapse dynamics in neurons by enhancing synaptic release (Buskila and Amitai, 2010). Determining the contribution of NO produced from iNOS to the modulation of neuronal calcium signaling during AD is necessary and should be the focus of future research.
The results of this study demonstrate increased nNOS and a divergent functional role for NO in modulating neuronal calcium signaling in the context of AD. Further work is necessary to determine the mechanism(s) driving the increase in nNOS protein amount during AD, and to characterize disease-associated changes to proteins implicated in the function of nNOS, such as S-nitrosylation of NMDAr subunits to decrease calcium flux (Lei et al., 1992; Lipton et al., 1993), in iPSC-derived neurons. Future experiments should focus on determining the likely multiple and distinct mechanisms through which NO modulates calcium signaling, for example, by recording NMDAr-mediated current in the presence of an nNOS inhibitor or NO scavenger. In addition, NO modulation of intracellular calcium stores should be evaluated, to elucidate the complex role of NO on altering the kinetics of calcium responses, as observed in this study.
It is likely that multiple receptors and, as such, multiple antagonists will need to be used to evaluate the roles of NMDAr, voltage-gated calcium channels, and metabotropic receptors, in addition to assessing cellular and organelle membrane integrity. Protein and lipid targets of nitrosative stress should be identified, the redox status of individual donor lines assessed, and specific measurements taken of superoxide and peroxynitrite formation and the function of antioxidant enzymes, to determine the complex role that redox biology plays in NO metabolism during AD.
Collectively, the results of our study clarify conflicting data regarding nNOS expression during AD, showing that the phenotype of increased nNOS in LOAD is recapitulated in iPSC-derived neurons from LOAD and fAD donors and importantly, demonstrating that alterations to nNOS activity and increased endogenous NO levels contribute to dysregulated calcium signaling in AD neurons. Together, this data set of both human postmortem tissue and iPSC-derived neurons provides insights into how increases in nNOS protein amount and NO can facilitate glutamatergic calcium signaling under nonpathogenic conditions, meanwhile suppressing, prolonging, and dysregulating glutamatergic calcium signaling under pathogenic conditions (Fig. 6). Functionally, this may underscore how nNOS activity and regulated NO production could be neuroprotective in one context, while persistent NO due to increased levels of nNOS protein and dysregulated calcium signaling could contribute to neurotoxicity.
As the modulation of NMDAr is one of the few available treatments for symptoms in AD, understanding when and how NO regulates NMDAr could provide critical insights into the development and refinement of effective treatments.
Materials and Methods
Electronic laboratory notebook was not used.
Statement of ethics
All research was conducted in accordance with the requirements of the University of Wollongong (13/299, 16/288) and the University of Sydney Human Research Ethics Committee (2018/477).
Human postmortem case selection
To assess nNOS expression and localization in the brains of LOAD donors, a power calculation was performed, and based on the most conservative estimate, expecting a 1.2 ± 0.25 (standard deviation [SD]) fold change, a sample size of minimum 13 was required. For use in this study, postmortem brain tissues from 17 deidentified cognitively healthy (control) donors and 27 clinically diagnosed, pathologically confirmed cases of LOAD were acquired from The New South Wales Brain Banks (NSWBB, Sydney, Australia) following approval by their Scientific Advisory Committee. Details on tissue ascertainment, donor characterization, and pathological examination by the NSWBB have been previously described (Sutherland et al., 2014).
For this study, tissue from the four brain regions; the ITG, STG, Pre, and PVC, of each control and LOAD case was assessed for nNOS expression. These regions were selected as they provide a range of AD severity across each patient's brain, with the ITG representing an early (clinically) and severely affected region (Paasila et al., 2019), the STG a moderately affected region (Youssef et al., 2018), the precuneus a late and mildly affected region (Guennewig et al., 2021), and the PVC a largely unaffected region (Guennewig et al., 2021; Paasila et al., 2019), at postmortem. A full summary of case details can be found in Supplementary Table S1.
Maintenance and differentiation of iPSC-derived neurons
The iPSC line details for the three cognitively healthy nonisogenic controls, three LOAD, and one fAD donor, included as a positive control for disease, used in this study are outlined in Supplementary Table S2. Short tandem-repeat profiling analysis of 18 locations was performed at Molecular Genetics, Garvan Medical Research Institute (Sydney, Australia), to confirm the identity of iPSC lines to their corresponding fibroblast lines. Karyotype analysis was performed at Sullivan Nicolaides Pathology (Brisbane, Australia) before the commencement of experiments, to confirm iPSC chromosomal integrity, with metaphase G-banding in 15 cells assessed at a resolution of 400 bphs.
Culture of iPSC lines was based on an established protocol (Lie et al., 2012). All iPSC cultures were maintained on Matrigel (Corning)-coated 60 mm tissue culture dishes in TeSR-E8 (Stemcell Technologies) medium in a humidified incubator at 37°C and 5% O2. The TeSR-E8 medium was changed daily, and colonies were passaged every 5–7 days with 1 × dispase (Stemcell Technologies). All iPSC lines were regularly tested in-house for mycoplasma.
The iPSC lines were differentiated using growth factors into neuronal cells via neurospheres. Differentiation of iPSCs to neurospheres was performed as per Lie et al. (2012), and to neurons as per Balez et al. (2016). Throughout differentiation, cells were maintained in a humidified incubator at 37°C and 5% O2, with partial media changes with supplements performed every other day until use in experiments.
Immunohistochemistry for nNOS in human postmortem tissue
Paraffin-embedded tissue sections (10 μm) were prepared by the NSWBB. Sections were passed through xylene (Sigma-Aldrich), ethanol baths (100%, 96%, 70%), and MilliQ to rehydrate the tissue. Sections were boiled for 15 min in a citrate antigen retrieval buffer (pH 5.8), cooled for 30 min, and washed with MilliQ. Sections were blocked with 5% hydrogen peroxide (Sigma-Aldrich) in 50% ethanol for 40 min at room temperature and washed with MilliQ and then with Tris-buffered saline with 0.1% (v/v) Tween (TBST). Sections were incubated with goat serum (Life Technologies) diluted in TBST (10% v/v) for 1 h at room temperature and incubated with a primary antibody (rabbit anti-nNOS, 1:50 in TBST; No. ab5586; Abcam) for 1 h at 37°C, washed in TBST, then incubated with a goat anti-rabbit immunoglobulin G (heavy+light) chain [IgG (H+L)] biotinylated secondary antibody (1:200 in TBST; Vector Laboratories) at 37°C for 30 min.
After a TBST wash, the Elite ABC reagent (Vectastain Elite ABC-HRP Kit Standard, 1:500 in TBST; Vector Laboratories) was applied for 30 min at room temperature, washed, and the reaction product visualized by incubating sections in 3′3′-diaminobenzidine tetra hydrochloride (Vector Laboratories) for 20 min at room temperature. The sections were washed in MilliQ, counterstained in Harris hematoxylin (POCD Scientific) for 90 s, and then dehydrated by passing through ethanol and xylene baths. Slides were mounted in Eukitt quick-hardening mounting medium (Sigma-Aldrich) and imaged with a Leica DM750 microscope with Leica ICC50 HD camera and acquired using LAS V4.12 software (Leica Microsystems). Tissue with known pathology was used as positive controls and exclusion of the primary antibody was used as a negative control, with these sections showing no immunoreactivity. Tissue from control and LOAD cases were stained at the same time with identical timings and reagents for each brain region.
An nNOS immunoreactivity scale, as a semiquantitative form of analysis, was developed based on manual observations of immunoreactivity in the ITG. Using this scale, the severity of nNOS immunoreactivity in each tissue slice was ranked as follows: 0 = no nNOS immunoreactivity; 1 = occasional and light nNOS immunoreactivity in cell bodies in the lower cortical layers with no neurite pathology; 2 = dark nNOS immunoreactivity in cell bodies mainly confined to cells in the lower cortical layers with no neurite pathology; 3 = frequent and dark immunoreactivity in cells across the cortical layers with occasional neurite pathology; and 4 = frequent and dark nNOS immunoreactivity in cells and neurites throughout the cortex and white matter.
Images were assigned a ranking on the nNOS immunoreactivity scale while blinded to clinical and pathological data, with the analysis verified independently. Statistical analysis was performed using Pearson's correlation with 95% confidence interval to assess correlation of nNOS immunoreactivity with demographic and clinical indices.
Immunocytochemistry in iPSC-derived neurons
Immunocytochemical staining was performed on iPSC-derived neurons to determine the colocalization of nNOS with the pan-neuronal marker MAP2, postsynaptic marker PSD-95, and the glutamatergic marker NMDAR1, in addition to expression of the astrocytic marker GFAP. For use in immunocytochemical analysis, disassociated iPSC-derived neurospheres were seeded at a density of 20,000 cells/well on 13 mm glass coverslips and cultured for a minimum of 6 weeks. Cells were fixed with 4% (w/v) paraformaldehyde (Sigma-Aldrich) in phosphate-buffered saline (PBS) for 7 min, permeabilized with 0.5% (v/v) TritonX-100 (Sigma-Aldrich) in PBS for 10 min, and blocked in 10% (v/v) goat serum (Life Technologies) in PBS (blocking solution) for 1 h, with all incubations at room temperature. Primary antibodies at specified dilutions (Supplementary Table S3) were incubated overnight at 4°C, followed by secondary antibodies at specified dilutions (Supplementary Table S4) for 1 h at room temperature.
Primary and secondary antibodies were diluted in blocking solution. The nuclei of the iPSC-derived neurons were counterstained with Hoechst 33342 (1:1000; Life Technologies) with secondary antibodies. All coverslips were washed three times with PBS between each step. Coverslips were mounted in Prolong Gold Antifade reagent (Life Technologies) and imaged within 1–2 weeks of staining.
Protein quantification by Western blotting
Frozen tissue samples were cut into 20–40 mg sections on dry ice and homogenized with an IKA T10 basic Ultra-Turrax hand-held homogenizer (IKA) in lysis buffer (1:10; w/v) consisting of 50 mM PBS, 1 × cOmplete protease inhibitor (Sigma-Aldrich), and 1 × PhosphoSTOP phosphatase inhibitor (Roche). The homogenate was sonicated using a Branson 250 digital sonicator (Branson) for 3 s at 30% on, 70% off, and 10% power and then incubated on ice for 15 min. Samples were centrifuged at 11,000 g for 20 min, the supernatant was aspirated, and the tissue lysate stored at −80°C until use.
For use in Western blots, disassociated iPSC-derived neurospheres were seeded at a density of 20,000 cells/well in a 24-well plate and cultured for 3 weeks. Protein from iPSC-derived neurons was harvested in the radioimmunoprecipitation assay (RIPA) buffer (50 mM Tris HCl pH 7.4, 1% sodium deoxycholate, 150 mM NaCl, 1 mM ethylenediaminetetraacetic acid [EDTA], 1% Triton-X, and 0.1% SDS in MilliQ-Q) containing 1 × cOmplete protease inhibitor cocktail and 1 × PhosphoSTOP phosphatase inhibitor. Media were aspirated and cells were washed with PBS and then incubated with 100 μL of RIPA buffer per well of a 24-well plate for 20 min on ice. The cell lysate was aspirated and vortexed for 10 s and then centrifuged at 10,000 g for 5 min. The supernatant was aspirated, and the cell lysate stored at −80°C until use.
Quantification of total protein in tissue or cell lysate samples was performed using the Detergent Compatible (DC) Protein Assay (Bio-Rad) following the manufacturer's instructions. Absorbance was read at 750 nm using a SpectraMax Plus 384 plate reader (Molecular Devices) and background corrected. All measurements were performed in triplicate.
For Western blot analysis, samples were diluted in either lysis buffer (tissue lysate) or RIPA buffer (cell lysate) with Laemmli buffer (Bio-Rad) containing 5% (v/v) 2-mercaptoethanol (Sigma-Aldrich) to a final protein amount of 7.5 μg/well. Samples were incubated at 70°C for 10 min and loaded into a 4%–20% Criterion TGX Stain-Free gel (Bio-Rad). All samples were run in duplicate across separate gels, with a common pooled sample run in triplicate on each gel as an internal standard to normalize against intergel variations, along with the Precision Plus Protein Dual Color (Bio-Rad) molecular weight marker. Proteins were separated by electrophoresis at 160 V for 50 min in SDS buffer and transferred to an Immobilon-P polyvinylidene fluoride (PVDF) membrane (Merck Millipore) at 100 V for 60 min in an ice-cold transfer buffer.
Membrane total protein was imaged using the Criterion Stain Free Imager (Bio-Rad) to determine transfer efficiency, equal sample loading, and normalization of protein of interest to total protein. Membranes were washed 3 × in TBST and blocked in 5% (w/v) skim milk in TBST for 1 h at room temperature. Primary antibodies at specified dilutions (Supplementary Table S5) were incubated overnight at 4°C in a blocking solution, followed by 5 × 5-min washes in TBST. Secondary antibodies at specified dilutions (Supplementary Table S6) were made in 2.5% (w/v) blocking solution and incubated for 1 h at room temperature. Membranes were washed 3 × for 5 min and then incubated for 1 min with Amersham ECL (enhanced chemiluminescent) Prime Western Blotting Detection Reagent (GE Healthcare).
Protein bands were visualized using an Amersham Imager 600RGB (GE Healthcare) gel imaging system. Relative densitometry values for each protein band were quantified using Image Studio (LI-COR Biosciences) with values normalized to respective total protein and mean pool, to account for protein loading and intergel variability, respectively.
Quantification of neurite outgrowth and branch points
Long-term live-cell imaging of neurite outgrowth and branch points of iPSC-derived neurons was performed using the IncuCyte Zoom Imaging System (version 2016A; Essen Bioscience). Power calculations for neurite analysis were made based on pilot data. For neurite length, with the most conservative estimate of a mean ± SD under H0 of 28 ± 7 mm/mm2 neurite length, expecting a 0.25 effect size, a desired level of statistical significance (α) of 0.05, and a desired power (β) of 0.8, a minimum number of 9695 neurites were required for analysis, with a minimum of 10,240 neurites analyzed from each line per independent differentiation.
For neurite branch points, with the most conservative estimate of a mean ± SD under H0 of 500 ± 15 1/mm2 neurite branch points, expecting a 0.30 effect size, a desired level of statistical significance (α) of 0.05, and a desired power (β) of 0.8, a minimum number of 30,913 neurite branch points were required for analysis, with a minimum of 44,800 branch points analyzed from each line per independent differentiation. Phase-contrast images were captured using a 10 × objective, with 16 image fields acquired per well of a 24-well plate, with 8–16 wells analyzed per line per differentiation from three independent differentiations. Neurite length and neurite branch points were quantified using the IncuCyte NeuroTrack Software Module (version 2016; Essen Bioscience).
A set of 36 reference images were used to develop the NeuroTrack Software processing definition to automatically define neurite processes and cell bodies (Supplementary Fig. S8). Total neurite length (in mm) was quantified and presented as the summed length of neurites extending from cell bodies normalized to the image field area (in mm2), with neurite branch points presented as the number of neurite intersections in the image field, normalized to the image field area (in mm2).
Quantification of amyloid Aβ by enzyme-linked immunosorbent assay
The amyloid Aβ peptide Aβ1–40 and Aβ1–42 concentrations were quantified from the conditioned cell culture media of iPSC-derived neurons using enzyme-linked immunosorbent assays (ELISAs; Invitrogen), following the manufacturer's instructions. For use in ELISAs, disassociated iPSC-derived neurospheres were seeded at a density of 20,000 cells/well in a 24-well plate and cultured for 4 weeks. Conditioned media from one well per line across two to three independent differentiations were used in analysis. The appropriate amyloid Aβ standards were prepared fresh and were used to generate a standard curve to calculate conditioned media amyloid Aβ concentration. Absorbance was measured at 450 nm using a SpectraMax Plus 384 plate reader and background corrected. The Aβ1–40 and Aβ1–42 peptide concentrations were determined separately and then used to calculate the Aβ42/40 ratio.
Quantification of nitrite by Griess assay
Due to the short biological half-life of NO (Santos et al., 2012), nitrite (a stable oxidation product of NO) was quantified in conditioned media as an indirect assessment of NO levels in iPSC-derived neuronal cell cultures using the Griess Reagent System (Molecular Probes) following the manufacturer's instructions. For use in Griess assays, disassociated iPSC-derived neurospheres were seeded at a density of 20,000 cells/well in a 24-well plate and cultured for 4 weeks, with conditioned media from three wells per line across three independent differentiations used in analysis.
To complement live-cell calcium imaging analysis, in a subset of experiments, neurons were pretreated with 50 μM L-NNA (Cayman Chemical), an nNOS inhibitor, 30 μM carboxy-PTIO (Cayman Chemical), an NO scavenger, or 0.1% DMSO as a vehicle control for 2 h, before addition of Griess reagent. Absorbance was measured at 540 nm using a SpectraMax Plus 384 plate reader and background corrected. Calculated nitrite levels for each well were normalized to total protein, as determined by DC assay. All measurements were performed in triplicate.
Functional analysis of modulating NO levels on glutamatergic signaling by live-cell calcium imaging
Live-cell calcium imaging was performed as per Balez et al. (2016), with disassociated iPSC-derived neurospheres seeded at a density of 20,000 cells on 13 mm glass coverslips and cultured for a minimum of 7 weeks to increase the functional maturation of neuronal cultures (Sharma et al., 2020). A minimum of one coverslip from a minimum of three independent differentiations per line was imaged for each experiment set. An SBS consisting of 160 mM NaCl, 2.5 mM potassium chloride (KCl), 5 mM CaCl2, 1 mM MgCl2, 10 mM 4-(2-hydroxyethyl)-1-piperazineethanesulfonic acid (HEPES), and 5 mM glucose was used for baseline perfusion of iPSC-derived neurons. A High K+ SBS buffer was used to depolarize neurons and induce a calcium response that could identify neurons postimaging.
A 10 mM EGTA (Sigma-Aldrich) in calcium-free SBS buffer was used to determine the minimum ratio value (Rmin) and identify if spontaneous calcium signaling originated from extracellular calcium. A 1.5 μM ionomycin (Sigma-Aldrich) SBS buffer was used to determine the maximum ratio value (Rmax) and as a positive control for calcium responses, with cells that did not respond to ionomycin excluded from analysis. To induce a calcium response, neurons were perfused with SBS containing either 10 μM NMDA (Tocris) or 20 μM L-glutamic acid (glutamate; Tocris). All perfusion buffers were made fresh and adjusted to a pH of 7.4 and osmolarity between 308 and 312 mOsm, in line with the osmolarity of conditioned cell culture media.
In a subset of experiments, neurons were pretreated with 50 μM L-NNA, an nNOS inhibitor, or 30 μM carboxy-PTIO, an NO scavenger, for 2 h before loading. In addition, as a vehicle control for L-NNA and carboxy-PTIO treatments, one coverslip from each donor line was treated with 0.1% DMSO for 2 h before loading to determine whether DMSO altered neuronal calcium signaling dynamics.
Neurons were loaded with the ratiometric calcium indicator Fura-2 AM (2 μM; Thermo Fisher Scientific) and 0.1% Pluronic F-127 acid (20% w/v in DMSO; Biotium) in SBS for 45 min at 37°C in the dark, washed for 45 min in SBS, and mounted in a Warner Series 20 Chamber (Warner Instruments) and imaging platform (Warner Instruments). All imaging experiments were carried out at 37°C and 5% O2 in the dark. Mounted neurons were perfused with SBS using a MasterFlex C/L peristatic pump (MasterFlex) at a flow rate of 0.625 mL/min for 5 min before recoding, to establish a baseline fluorescence (F0) reading. Neurons were perfused with agonists for 3 min, followed by a 4-min wash with SBS after each agonist phase. Following agonists, neurons were perfused with calcium-free EGTA and ionomycin buffers.
Images were recorded on a DMi8 epifluorescent microscope (Leica Microsystems) using a × 40 objective with apochromatic correction and a dichromatic filter for dual excitation at 340 and 380 nm with an emission band-pass filter at 510 nm. Images were captured on a charge-coupled device (CCD) camera (Hamamatsu) at a rate of 1 image per 5 s with a 180 ms exposure time for each channel. The duration of recordings averaged 25 min.
Postimaging, regions of interest (ROIs) representing the soma of individual neurons were manually selected based on morphology from each imaging experiment, while blinded to disease status and agonist treatment, using the calcium calculator module in Leica LAS-AF software. A range of 10–50 ROIs were selected per experiment based on the number of cells in the field of view, and the ratio change in 340/380 nm fluorescence (F) intensity was calculated over time. Images were automatically corrected for background fluorescence continuously throughout each experiment. The average ratio 340/380 nm fluorescence intensity of Fura-2 AM from all ROIs was calculated for the first 25 s of each imaging experiment to determine the basal ratio fluorescence, representative of resting intracellular calcium levels. For the analysis of the raw ratio fluorescence data for each ROI, we wrote a custom-made MATLAB (version R2019a; MathWorks) script.
First, the signal was normalized by calculating the fold change between the baseline fluorescence (F0) and the fluorescence intensity (ΔF/F0) of each ROI during the first SBS wash (first 50 s) or in presence of an agonist, respectively. Quantification of responses to agonists was split by an agonist phase, with each agonist phase commencing with the agonist wash and ending with the proceeding SBS wash. To characterize the changes of the calcium signals due to an agonist, the maximum amplitude, the time to peak, the peak decay (e.g., decay time between maximum and minimum of the signal), the FWHM, and the area under the curve (AUC) were calculated for each ROI and normalized to the number of time segments for each agonist. The peak decay was only calculated if there was one local maximum present.
The number of responsive, nonresponsive, and spontaneously signaling ROIs was quantified for each experiment as a percentage of the total quantified cell population. An ROI was deemed responsive if there was a single >10% increase in fluorescence intensity during any agonist phase before the calcium-free EGTA phase, with ROIs that had no change in fluorescent intensity during all agonist phases before the calcium-free EGTA phase deemed nonresponsive. Responsive ROIs were confirmed as neurons due to the observed increase in ratio fluorescence intensity following exposure to High K+, representative of calcium influx due to depolarization, allowing for postimaging identification of neurons. The number of ROIs that did not return to baseline following a calcium response to an agonist for each agonist phase was quantified.
An ROI was deemed to spontaneously signal if there was an increase in ratio fluorescence intensity in the absence of an agonist or more than one peak during an agonist phase. The number of spontaneously signaling ROIs during the calcium-free EGTA phase was also quantified.
Statistical analysis
Statistical analysis was performed in Prism 8.1 (GraphPad Software), with data presented as mean ± standard error mean from a minimum of three independent differentiations, unless stated otherwise. All sample sizes (n) and p values are presented in the respective figure legends. Statistical evaluation of differences between means was calculated by a Student's t-test, chi-square test, one-way analysis of variance (ANOVA), or two-way ANOVA for multiple comparisons. The p-value is reported with a p < 0.05 deemed statistically significant. Post hoc testing of differences between means was performed using Tukey's or Šidák's test, where appropriate.
Ethical Approval and Consent to Participate
Consent to participate was obtained and all research was conducted in accordance with the requirements of the University of Wollongong (13/299, 16/288) and the University of Sydney Human Research Ethics Committee (2018/477).
Consent for Publication
Consent for publication was obtained from participants.
Availability of Data and Materials
The data sets and materials used and analyzed during the current study are available from the corresponding author on reasonable request.
Footnotes
Acknowledgment
The authors wish to thank Prof. Perminder S. Sachdev (Centre for Healthy Brain Aging [CheBA], University of New South Wales, Australia) for provision of some of the fibroblast lines that were reprogrammed to iPSCs.
Authors' Contributions
R.B. contributed to the method design, data generation, data analysis, initial article draft, and article review and editing; C.H.S. contributed to the method design, data analysis, and article review and editing; K.L. contributed to the data analysis and article review and editing; S.M. contributed to data generation; K.S. contributed to the resources and article review and editing; G.S. contributed to the supervision and article review and editing; L.O. contributed to project conception, supervision, resources, funding, and article review and editing. All authors read and approved the final article.
Author Disclosure Statement
The authors declare they have no competing interests.
Funding Information
The research was funded by the National Health and Medical Research Council (NHMRC) of Australia Boosting Dementia Research Leadership Fellowship awarded to L.O. (APP1135720) and a Brain Foundation Research Gift awarded to L.O. and G.S. K.L. was funded by the Academy of Finland (decision Nos. 314647, 326452). R.B. was funded by the Australian Government Research Training Program Scholarship.
Supplementary Material
Western Blots
Supplementary Table S1
Supplementary Table S2
Supplementary Table S3
Supplementary Table S4
Supplementary Table S5
Supplementary Table S6
Supplementary Figure S1
Supplementary Figure S2
Supplementary Figure S3
Supplementary Figure S4
Supplementary Figure S5
Supplementary Figure S6
Supplementary Figure S7
Supplementary Figure S8
Supplementary Figure S9
Supplementary Figure S10
Supplementary Figure S11
Supplementary Figure S12
Supplementary Figure S13
Supplementary Figure S14
Supplementary Figure S15
Supplementary Figure S16
Supplementary Figure S17
Supplementary Figure S18
Supplementary Figure S19
Supplementary Figure S20
Supplementary Figure S21
Supplementary Figure S22
Supplementary Figure S23
Supplementary Figure S24
Supplementary Figure S25
Supplementary Figure S26
Supplementary Figure S27
Supplementary Figure S28
Abbreviations Used
References
Supplementary Material
Please find the following supplemental material available below.
For Open Access articles published under a Creative Commons License, all supplemental material carries the same license as the article it is associated with.
For non-Open Access articles published, all supplemental material carries a non-exclusive license, and permission requests for re-use of supplemental material or any part of supplemental material shall be sent directly to the copyright owner as specified in the copyright notice associated with the article.