
Abstract
Aims:
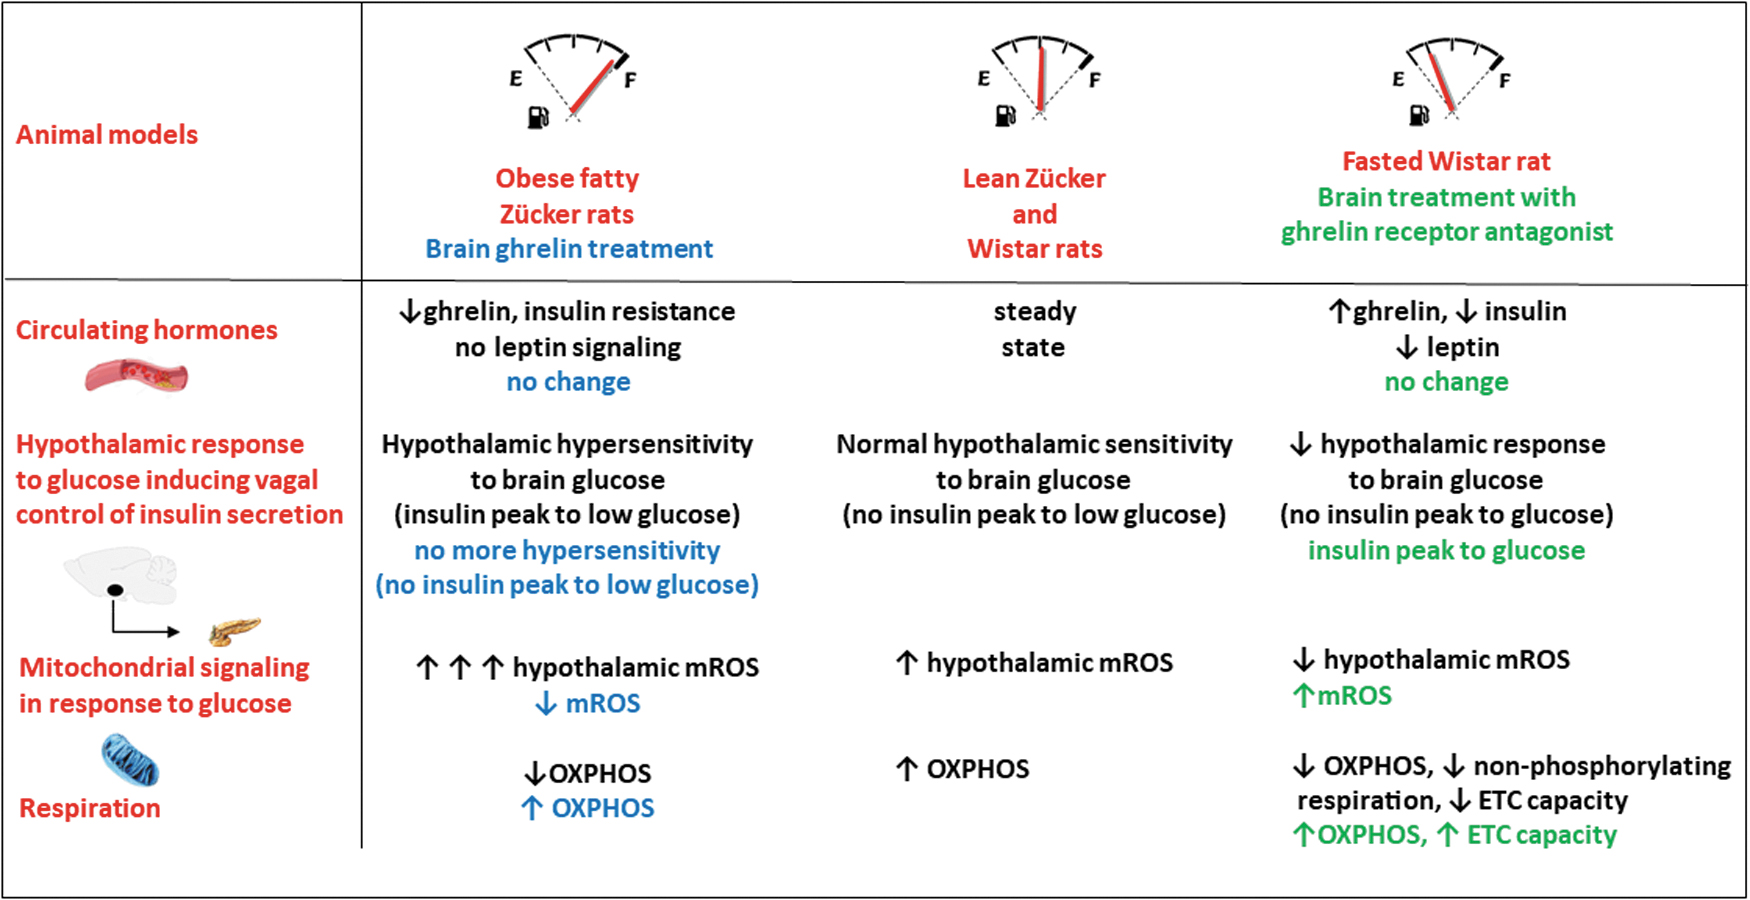
Part of hypothalamic (mediobasal hypothalamus [MBH]) neurons detect changes in blood glucose levels that in turn coordinate the vagal control of insulin secretion. This control cascade requires the production of mitochondrial reactive oxygen species (mROS), which is altered in models of obesity and insulin resistance. Obese, insulin-resistant Zücker rats are characterized by hypothalamic hypersensitivity to glucose. This initiates an abnormal vagus-induced insulin secretion, associated with an overproduction of mROS in response to a low glucose dose. Here, we hypothesized that ghrelin, known to buffer reactive oxygen species (ROS) via mitochondrial function, may be a major component of the hypothalamic glucose hypersensitivity in the hypoghrelinemic obese Zücker rat.
Results:
Hypothalamic glucose hypersensitivity-induced insulin secretion of Zücker obese rats was reversed by ghrelin pretreatment. The overproduction of MBH mROS in response to a low glucose load no longer occurred in obese rats that had previously received the cerebral ghrelin infusion. This decrease in mROS production was accompanied by a normalization of oxidative phosphorylation (OXPHOS). Conversely, blocking the action of ghrelin with a growth hormone secretagogue receptor antagonist in a model of hyperghrelinemia (fasted rats) completely restored hypothalamic glucose sensing-induced insulin secretion that was almost absent in this physiological situation. Accordingly, ROS signaling and mitochondrial activity were increased by the ghrelin receptor antagonist.
Innovation:
These results demonstrate for the first time that ghrelin addressed only to the brain could have a protective effect on the defective control of insulin secretion in the insulin-resistant, hypoghrelinemic obese subject.
Conclusions:
Ghrelin, through its action on OXPHOS, modulates mROS signaling in response to cerebral hyperglycemia and the consequent vagal control of insulin secretion. In insulin-resistant obese states, brain hypoghrelinemia could be responsible for the nervous defect in insulin secretion.
Introduction
Obesity and type II diabetes are associated with a major disruption of energy balance. The mediobasal hypothalamus (MBH), which includes the arcuate nucleus (ARC) and ventromedial nucleus, is essential at maintaining energy homeostasis (Alonge et al, 2021). MBH neurons are at the origin of appropriate physiological and behavioral commands in response to blood-borne signals related to the energy status (reviewed in Li et al, 2020; MacDonald et al, 2021).
In particular, changes in blood glucose levels are detected by some MBH neurons, which in turn coordinate, among others, the activity of the autonomic nervous system that is essential for controlling carbohydrate metabolism (Schneeberger et al, 2014). For example, increased hypothalamic glucose levels stimulate the vagal control of insulin secretion that contributes to the first phase of glucose-induced insulin secretion (Osundiji et al, 2012). These responses are driven by discrete MBH neurons that are sensitive to rise in blood glucose levels at least in the ARC (Chrétien et al, 2017; Colombani et al, 2009; Desmoulins et al, 2019), the identity of which is only partially known due to the lack of a homogenous marker in these neurons.
Innovation
Ghrelin has been regularly considered as an antidiabetes target, due to its effects on peripheral organs and tissues and its ability to stimulate food intake despite the difficulty in interpreting its effects, largely due to its pleiotropic effects. Our work demonstrates here for the first time, in a situation of obesity and insulin resistance or conversely during fasting, its important cerebral role in fine-tuning hypothalamic glucose sensing through the activity of mitochondria, independent of peripheral effects (Fig. 1). Its ability to maintain an adequate brain response to glucose could protect this organ from oxidative stress during the development of insulin resistance, also limiting the impact of cerebral control on hyperinsulinism.
A transient increase in brain glucose levels (without affecting glycemia in vivo) triggers a rapid peak in insulin secretion (1–3 min) driven by the pancreatic nerve branch of the vagus nerve (Alquier et al, 2003). This cascade of events requires the production of mitochondrial reactive oxygen species (mROS) in glucose-responsive neurons. Previous studies have indeed demonstrated that mitochondrial production of superoxide anion, by specifically blocking complex I or III, led to the activation of some ARC neurons and consequently the peak secretion of insulin, as with glucose. In contrast, the use of a mitochondrial uncoupler during stimulation with glucose (decreasing the production of anion superoxide) abolished the responses (Leloup et al, 2006). However, we have shown that the final mediator of this response is hydrogen peroxide (H2O2), generated after dismutation of the superoxide anion. Indeed, catalase, which is specific for the conversion of H2O2 to water, abolished the neural activation of ARC neurons in response to glucose and the subsequent peak in insulin secretion (Leloup et al, 2006). More recently, we have shown that this neuronal response involves the redox channel TRPC3 in ARC gluco-excited neurons, with this response also being inhibited by catalase (Chrétien et al, 2017).
Moreover, this mROS signaling and the firing rate of these neurons in response to increased glucose are altered in models of obesity and insulin resistance. Noteworthily, these responses can be reversed by pharmacology modulation of the mitochondrial mROS signaling (Chrétien et al, 2017; Colombani et al, 2009; Desmoulins et al, 2019).
Other studies have shown that this mROS signaling was crucial to some neurons of the melanocortinergic system, demonstrating how mitochondrial activity was central to the control of body energy status (Drougard et al, 2015; Horvath et al, 2009; Ramírez et al, 2017).
The obese Zücker rats exhibit insulin resistance, hypoghrelinemia, and features of prediabetes at initial stages of development. This model is also characterized by hypothalamic hypersensitivity to glucose, which initiates an abnormal vagus-induced insulin secretion (Colombani et al, 2009). This default results in increased insulin secretion at a low dose of glucose, which does not produce such an effect in lean rats. This hypersensitivity to glucose is due to increased mROS levels, leading to enhanced electrical activity of ARC neurons in response to this low glucose dose.
Among the factors that can influence this mitochondrial signaling, the stomach-derived hormone ghrelin plays a key role. Ghrelin, the only described as orexigenic hormone, directly activates at least neuropeptide Y/agouti-related peptide (NPY/AgRP) neurons via its receptor, the growth hormone secretagogue receptor 1a (GHSR 1a), by buffering reactive oxygen species (ROS) via mitochondrial function (Andrews et al, 2008; Zigman et al, 2016). More broadly, ghrelin plays a neuroprotective role against mitochondrial oxidative stress in other brain areas as well by reducing cellular damage, which would impart a complex role in the brain beyond a simple metabolic signal (Morgan et al, 2018; Wagner et al, 2017).
Some studies suggest that preventing the action of ghrelin might be beneficial against weight gain and the development of glucose intolerance (Barnett et al, 2010; Briggs et al, 2013). However, obesity is characterized by decreased levels of circulating ghrelin at initial stages in both humans and rat models (Beck et al, 2004; Tschöp et al, 2001). This low ghrelin level during the onset of obesity could have important consequences for redox balance in the brain, subsequent inflammation, and functional disturbances.
In this study, we hypothesized that the glucose hypersensitivity that leads to hyperactivity of vagal tone on the pancreatic axis in Zücker rats is due to its hypoghrelinemia. Indeed, this neuroprotective hormone could be an essential element of mitochondrial function and ROS production, and its decrease could partly explain this hypersensitivity.
Finally, to extend the question of ghrelin's function on hypothalamic glucose sensing, we also undertook experiments in a physiological model of hyperghrelinemia, the fasted state. In this model, hypothalamic glucose sensing-induced insulin secretion was reduced, which is a normal physiological response to fasting. By blocking the action of ghrelin with a GHSR antagonist in these fasted animals, we have also tested the effects of ghrelin inhibition on hypothalamic glucose sensing-induced insulin secretion.
Results
Hypothalamic glucose hypersensitivity-induced insulin secretion of obese rats was reversed by ghrelin pretreatment, with no change in glucagon-like peptide-1 release
Obese Zücker rats were hyperinsulinemic (255.4 ± 18.0 vs. 37.0 ± 4.8 μU/mL in lean Zücker rats, p < 0.001) but normoglycemic (89.9 ± 3.0 vs. 85.6 ± 1.4 mg/dL in lean Zücker rats), a feature of their prediabetic status during this acute phase of weight gain (254.3 ± 4.4 vs. 229.1 ± 3.0 g in lean Zücker rats, p < 0.01).
As previously described in the development of obesity in animals or humans (Beck et al, 2004; Tschöp et al, 2001), obese rats exhibited hypogrelinemia (Fig. 2B). To investigate whether reduced ghrelin levels were involved in the hypothalamic glucose hypersensitivity present in obese Zücker rats, a 30 min cerebral ghrelin pretreatment, via the carotid artery, was performed (Fig. 2A). The latter does not modify ghrelinemia, thus excluding a peripheral effect of the hormone (Fig. 2B).
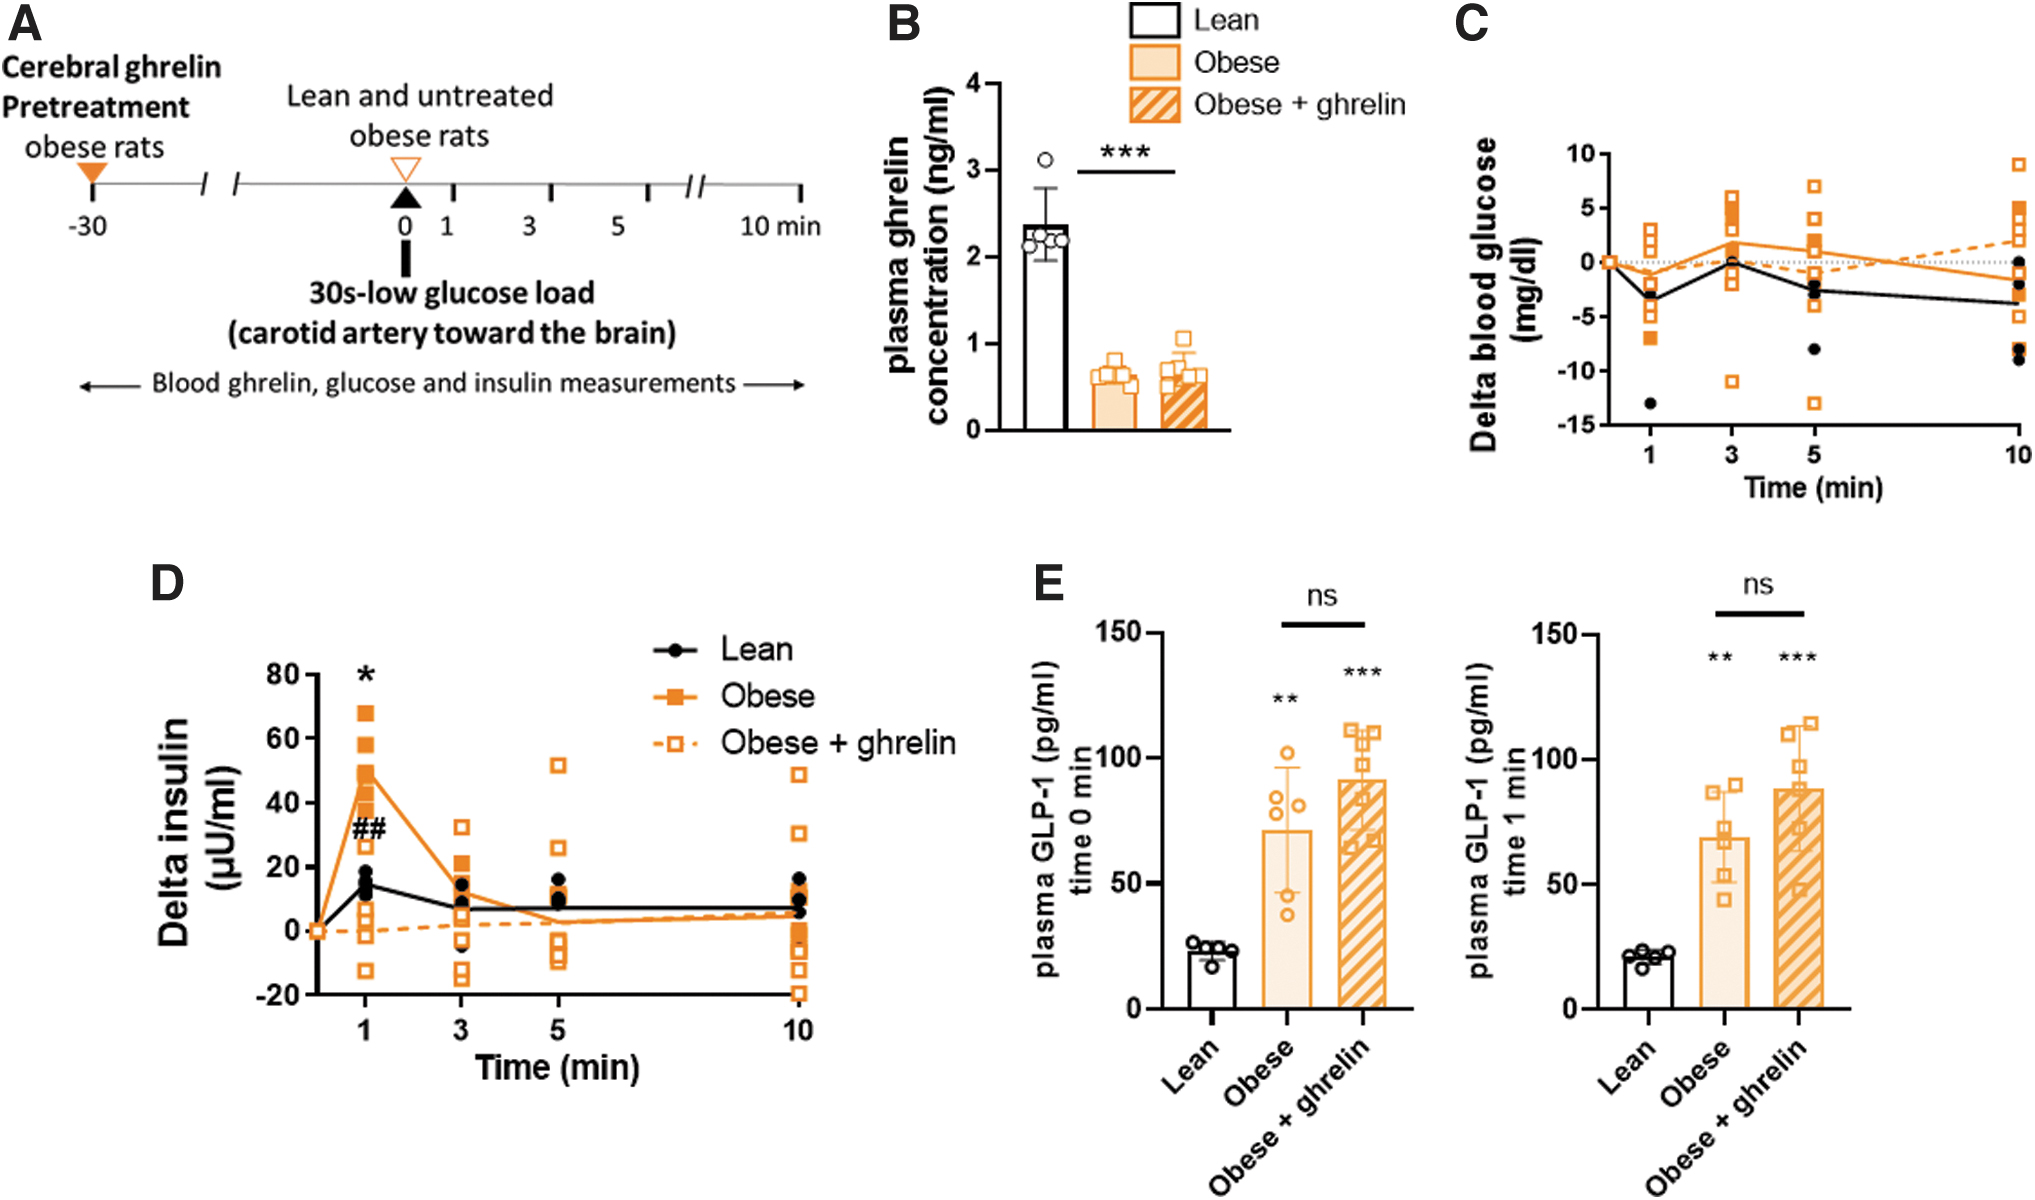
We confirmed the cerebral hypersensitivity exhibited by obese rats in response to glucose. Thus, injection of 3 mg/kg of glucose into the carotid artery toward the brain caused a rapid and transient increase in plasma insulin 1 min after injection in obese rats, whereas this response was absent in lean rats at this dose (Alquier et al, 2003; Colombani et al, 2009).
In contrast, in obese rats pretreated with brain infusion of ghrelin, this insulin peak was reversed (no more significant compared with lean rats and significantly different from obese [p < 0.01]) (Fig. 2D), thereby suggesting that hypersensitivity in obese rats was closely related to their low brain ghrelin levels. In all groups, this intracarotid (i.c.) injection of glucose did not increase systemic glucose levels at any time point (Fig. 2C), so the insulin response could not result from peripheral effects.
Finally, to investigate whether reduced ghrelin level in the obese Zücker rats was involved in the abnormal insulin peak through indirect nervous control of glucagon-like peptide-1 (GLP-1) release, we measured GLP-1 concentration at two time points in the three groups. At time t = 0, that is, just before the glucose load, and at time t = 1 min, just after it (Fig. 2E). There was no significant difference in GLP-1 concentration between obese groups (with and without ghrelin) at these two time points, suggesting that the difference in insulin peak was not due to the impact of central ghrelin or ghrelin plus central glucose on GLP-1 release.
Hypothalamic ROS overproduction in response to low-dose glucose in obese rats and alteration in mitochondrial function were normalized by ghrelin pretreatment, with no change in AMP-activated protein kinase activity
MBH ROS levels were measured 1 min after carotid injection of glucose, when insulin secretion occurred. We first confirmed that the low dose of glucose inducing insulin secretion observed only in obese rats was related to hypothalamic overproduction of ROS (p < 0.01 compared with lean rats) (Colombani et al, 2009). However, this overproduction did not occur in obese rats that had previously received the ghrelin infusion before the glucose carotid load (not significant compared with lean rats and p < 0.05 compared with obese rats without treatment) (Fig. 3A). Thus, this result points out to a putative effect of ghrelin on the mitochondrial respiratory function in the MBH.
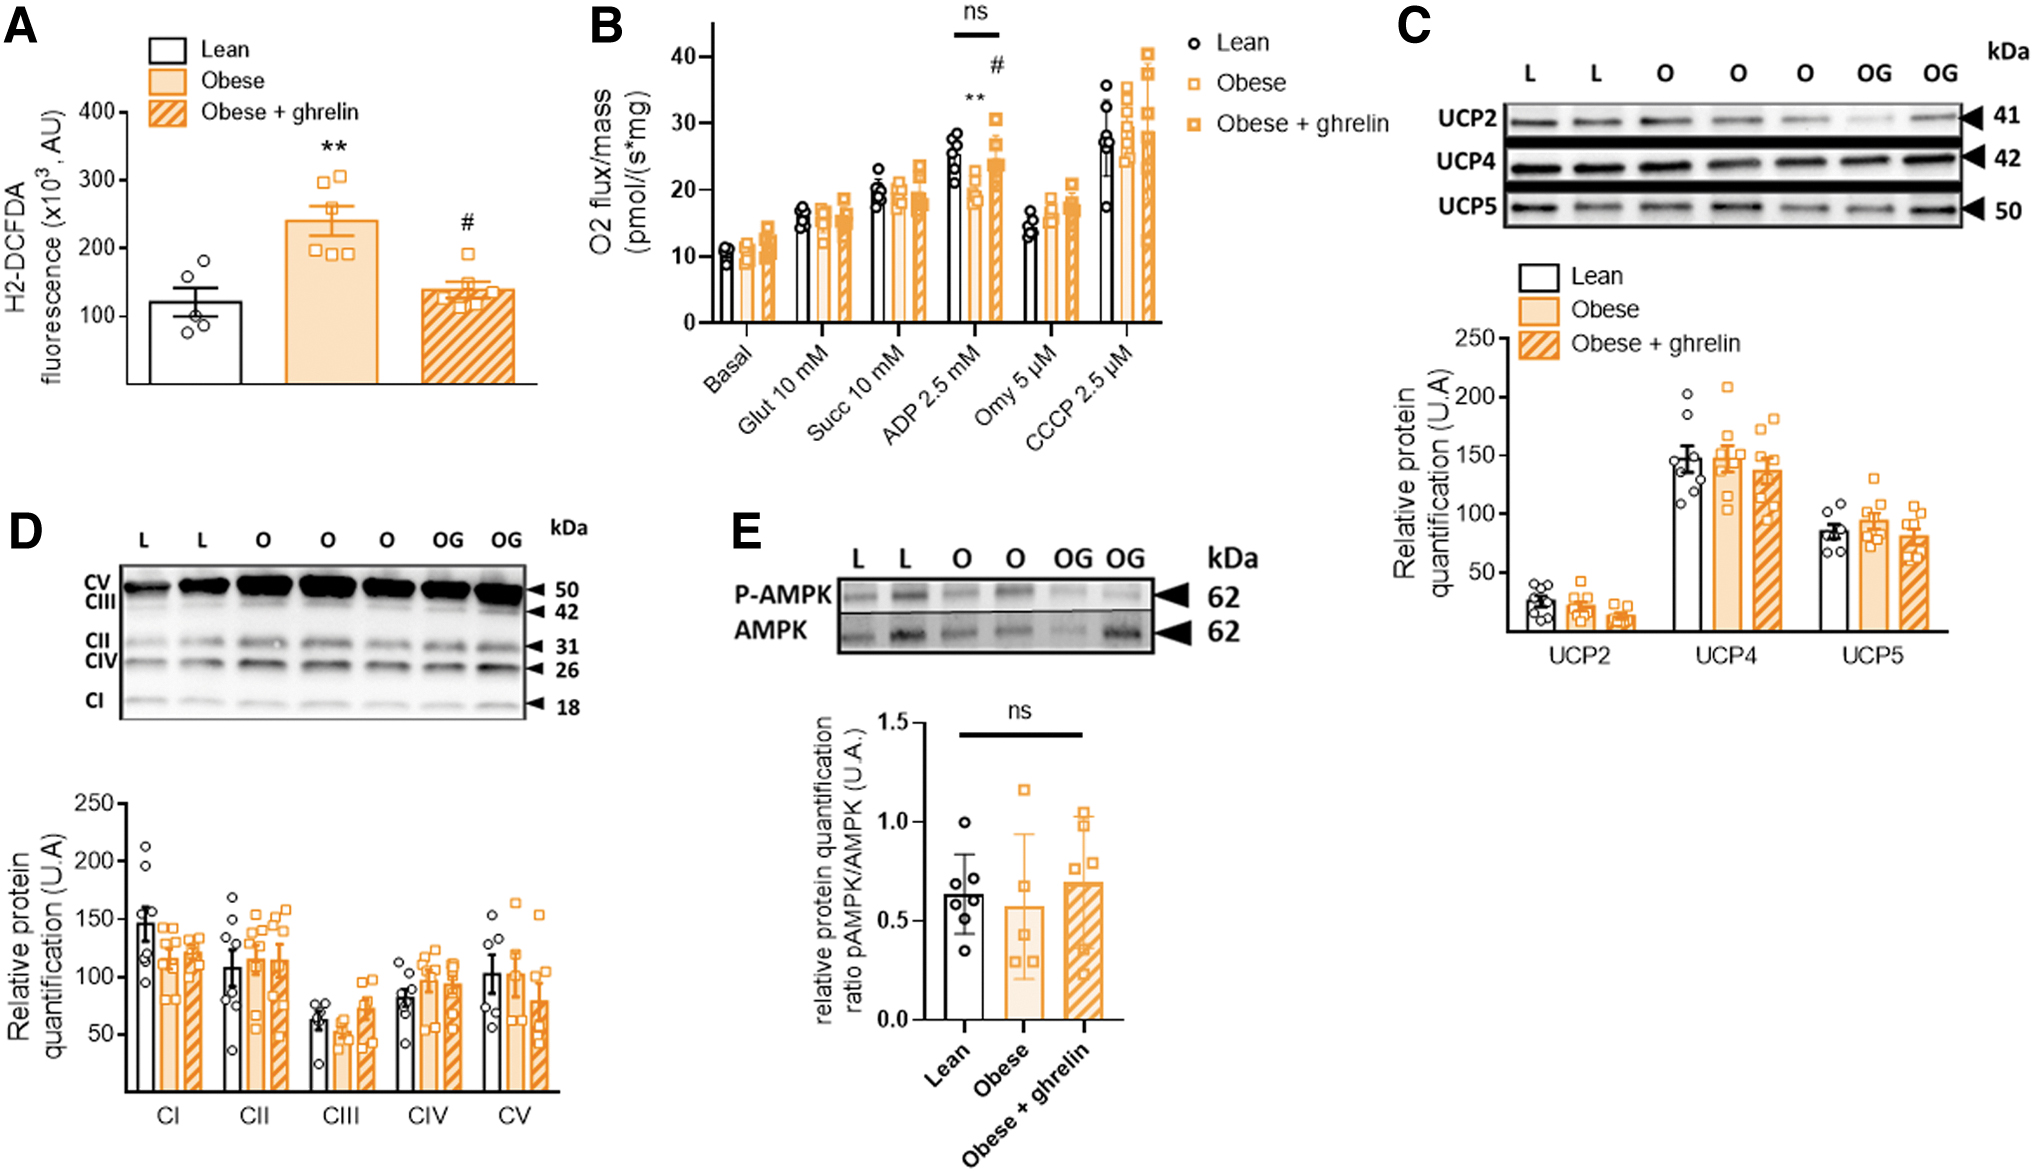
To test whether ghrelin pretreatment in obese rats was responsible for this decrease in ROS production, we then conducted mitochondrial respiration experiments on the MBH of the three groups by oxygraphy. No difference in the basal oxygen consumption between groups occurred (Fig. 3B), showing a normal mitochondrial respiration in the resting state in the MBH of rats. Substrate-driven respiration (state 2 respiration), measured by sequentially adding glutamate to stimulate complex I and succinate to stimulate complex II, did not reveal any differences between groups. However, a decrease of stimulated oxygen consumption in the MBH of obese rats was observed in state 3 respiration, when adding ADP to stimulate complex V (p < 0.05 compared with lean rats).
In contrast, this decreased consumption did not occur in obese rats that had previously received the ghrelin infusion (not significant compared with lean rats; p < 0.05 compared with obese nontreated rats) (Fig. 3B). Thus, these results highlighted a decrease in the oxidative phosphorylation (OXPHOS) activity, when complex V was strongly coupled to ADP phosphorylation in the MBH of obese nontreated rats. These results indicate that the presence of a sufficiently high level of brain ghrelin is necessary to maintain the phosphorylating coupling efficiency.
To test nonphosphorylating respiration, oligomycin (Omy) was added to block complex V. This resulted in a decrease in respiration, but differences in respiration were no longer present between groups. This result suggests that the coupling between nonphosphorylating respiration and electron transfer chain (ETC) is not involved. Finally, we tested the maximal capacity of ETC by adding the carbonylcyanure m-chlorophénylhydrazone (CCCP) uncoupler. As expected, CCCP increased respiration, with no differences between groups. These experiments suggest that proton leak through the uncoupling proteins (UCPs) pathway was not changed between groups. The respiratory defect in the untreated obese group would thus be related to the defect in the activity of complex V alone.
To determine whether AMP-activated protein kinase (AMPK) was involved in these mitochondrial changes in relation to ghrelin levels, we measured the ratio of phosphorylated AMPK to AMPK in MBH from the different groups. There was no significant difference in this ratio between the groups (Fig. 3E). This result suggests that AMPK was not involved in the mitochondrial changes induced by hypogrelinemia in obese Zücker rats or in the ghrelin-treated obese rats.
Finally, the MBH protein levels of the five mitochondrial complexes and the major brain UCPs UCP2, UCP4, and UCP5 were quantified. No difference was found between the three groups (Fig. 3C, D). These results showed that the lean versus obese genotype, as well as the 30 min treatment with ghrelin in the treated obese group, had no impact on the amount of these mitochondrial proteins.
Characteristics of hyperghrelinemic fasted and fasted-JMV treated rats compared with normoghrelinemic ad libitum-fed rats
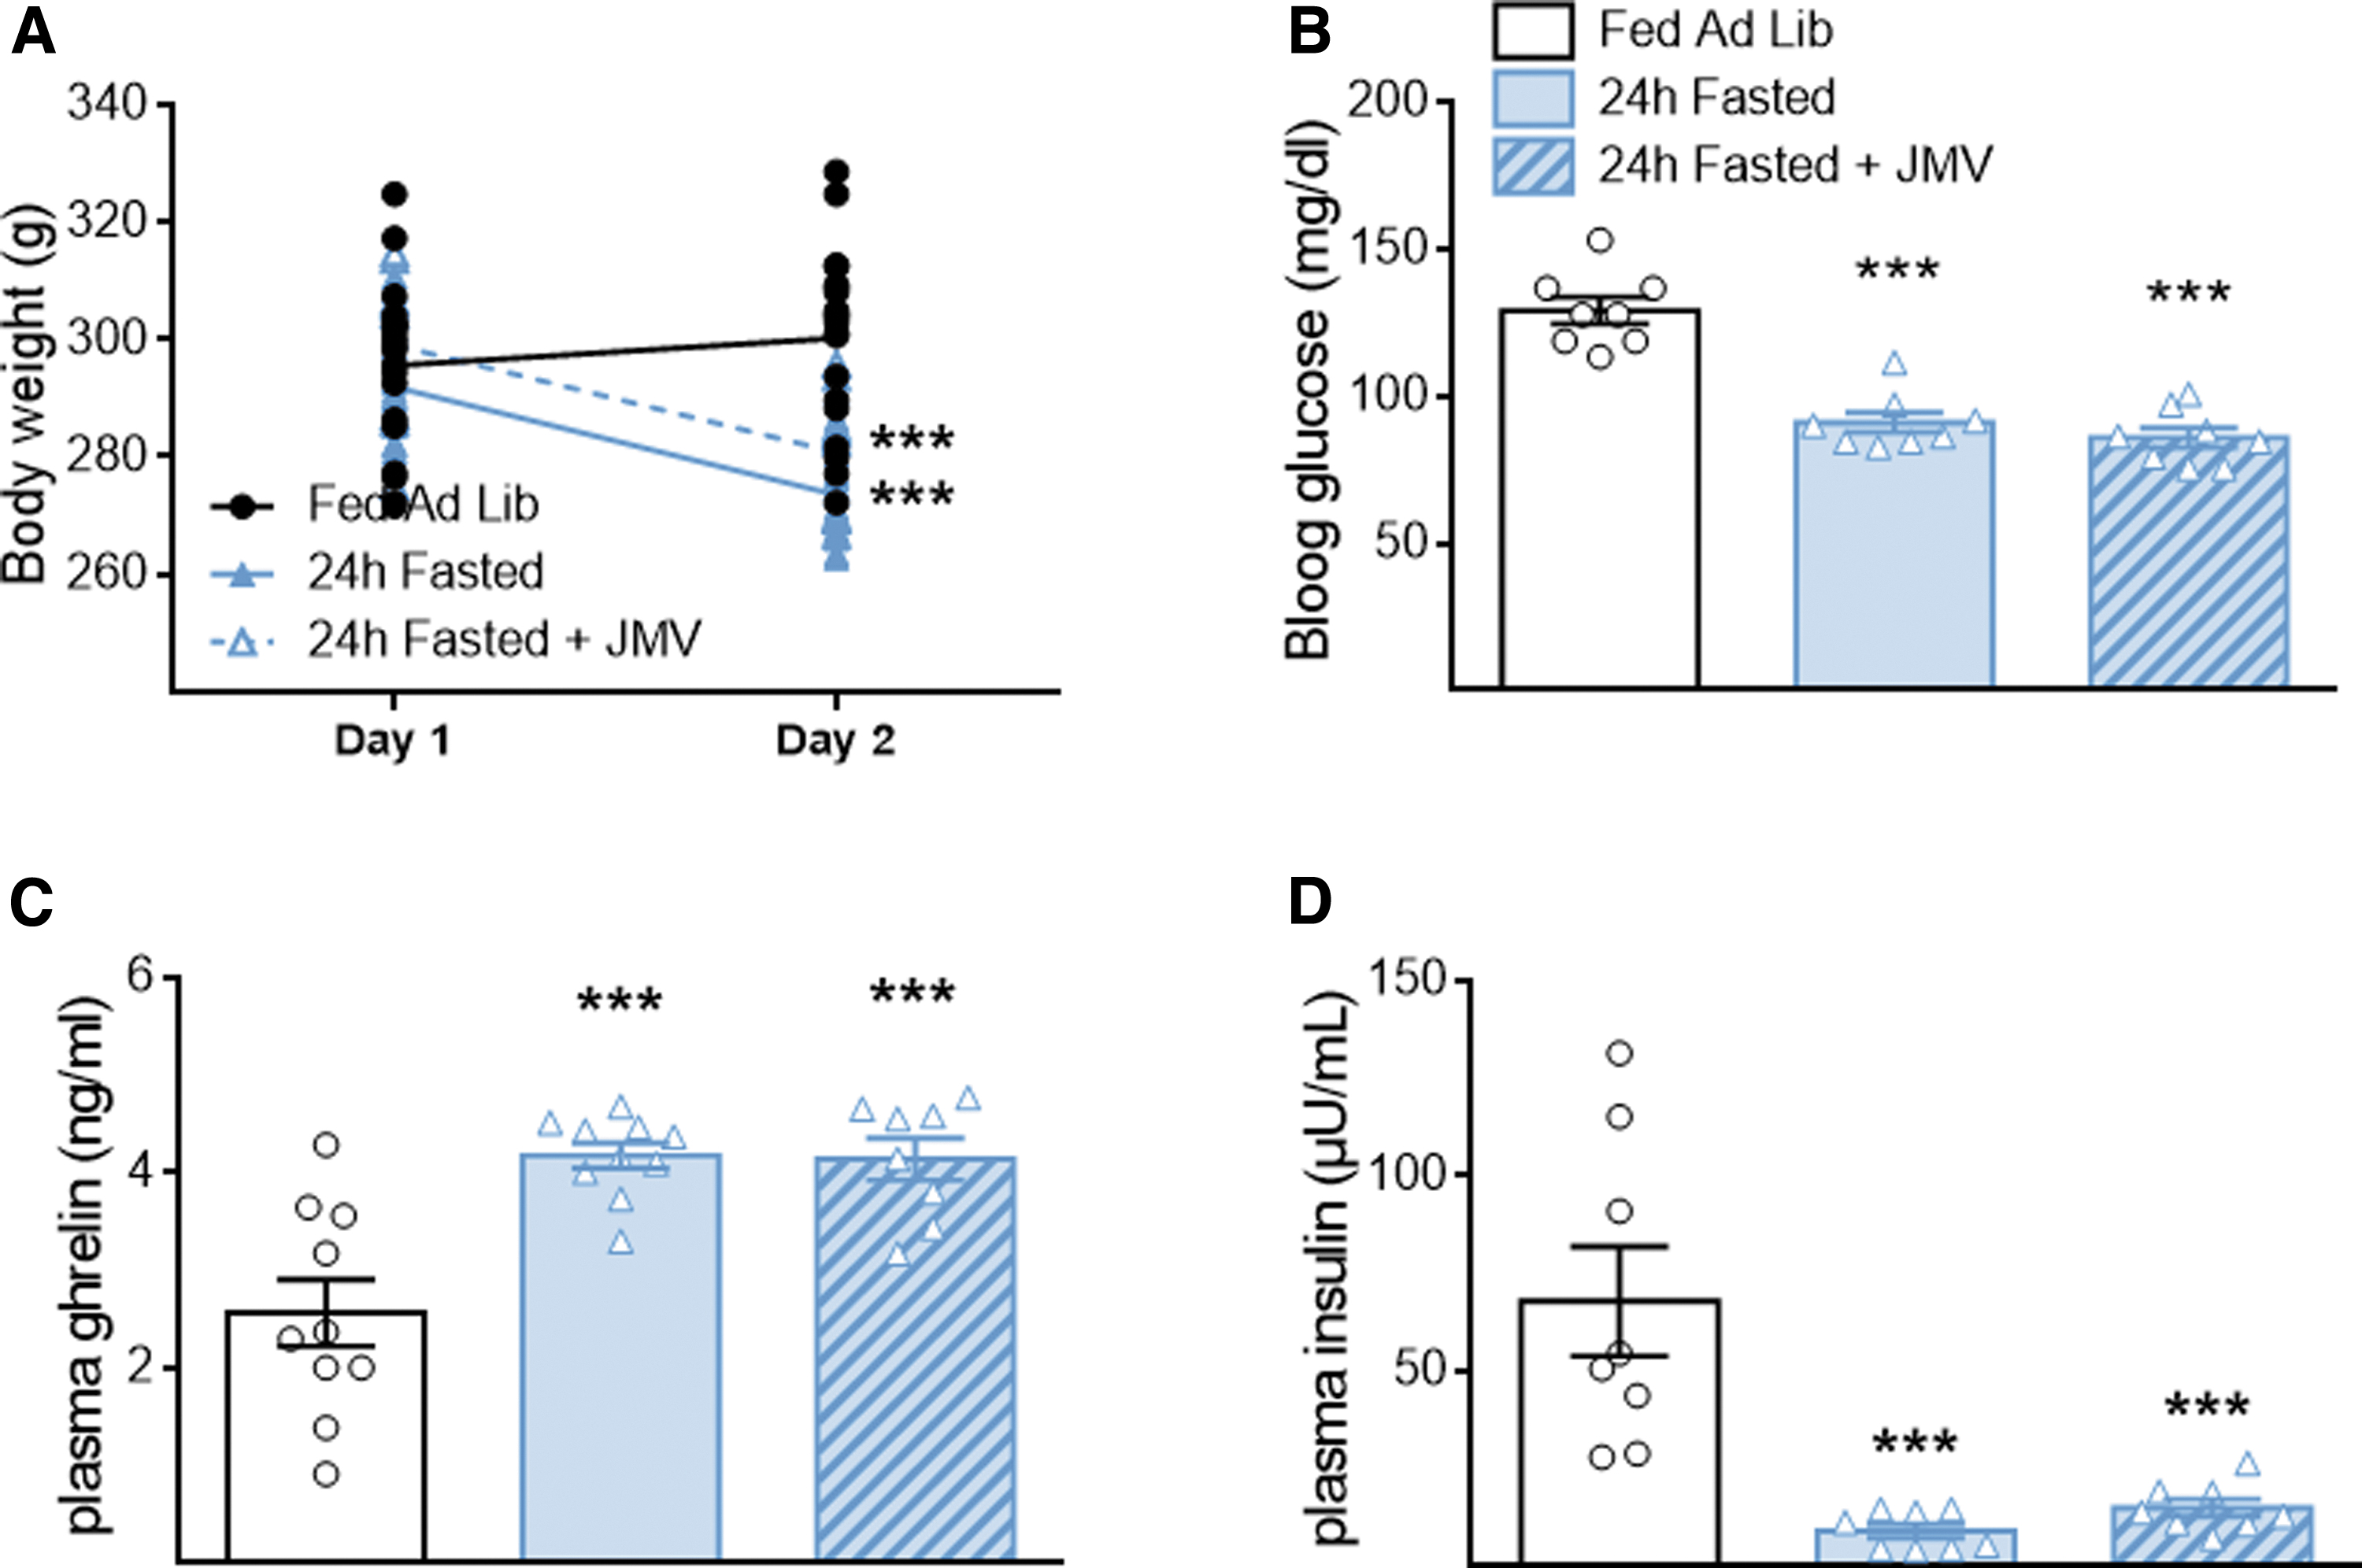
To further evaluate the effect of ghrelin on hypothalamic glucose sensing in a healthy model, we chose the 24 h fasted rats. These rats displayed hyperghrelinemia, the effects of which can be counteracted by the GHSR antagonist JMV 3002. A fed group was taken as reference for its normoghrelinemia. As expected, after 24 h of fasting, the animals body weight, blood glucose, and insulin dropped, while their acylated ghrelinemia equally increased whether they were treated with JMV or not (Fig. 4A–D). Thus, the major metabolic parameters were identical between fasting rats treated or not with the JMV antagonist, a necessary condition to be able to appreciate its effects.
Blocking ghrelin receptors counterbalanced the loss of hypothalamic glucose-induced insulin secretion, decreased glucose-induced hypothalamic mROS and mitochondrial OXPHOS
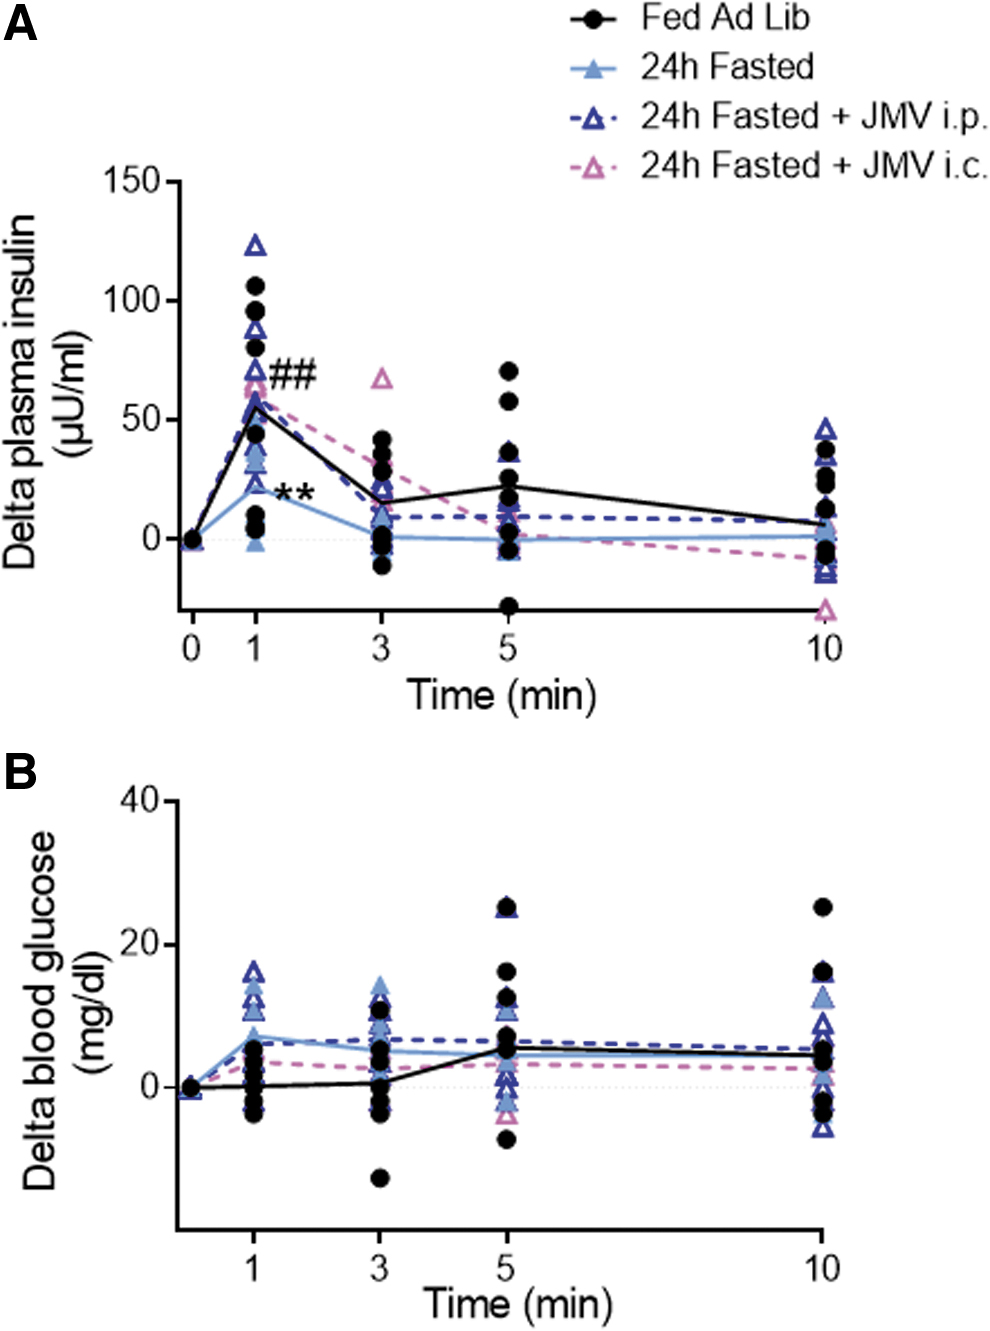
As previously shown (Carneiro et al, 2012; Colombani et al, 2009; Desmoulins et al, 2019), a 30 s glucose load (9 mg/kg) into the carotid artery toward the brain caused a rapid peak of plasma insulin 1 min after the carotid injection in ad libitum-fed rats (T0 vs. T1 min = +55.3 ± 12.7 μU/mL; p < 0.01), whereas blood glucose levels remained unchanged. However, this peak was not observed in fasted rats (T0 min vs. T1 min = +22.2 ± 6.6 μU/mL; p = 0.262).
In contrast, fasting rats treated with either intraperitoneal (i.p.) or i.c. JMV had an insulin peak that was restored at 1 min (T0 vs. T1 min = +61.2 ± 11.6 and +59.6 ± 6 μU/mL i.p. and i.c., respectively; p < 0.01). In fact, these animals exhibited an insulin peak similar to fed rats and significantly different from fasted rats (p < 0.01) (Fig. 5A, B). These results suggest that blocking the GHSR1a is sufficient to restore the hypothalamic response to glucose, despite the difference in energy status between fed and fasted rats.
To study whether the alteration in hypothalamic glucose sensing in fasted rats was linked to a defect in mROS signaling, MBH ROS levels were measured 1 min after the intracarotid injection of glucose, when insulin secretion occurred. Fasted rats exhibited a significant decrease in hypothalamic ROS production in response to the glucose load (p < 0.01). However, this lower production did not occur in fasted JMV-treated rats that displayed a similar production to fed rats (Fig. 6A). This result suggests that the antagonist effect was present at the level of either mitochondrial activity or antioxidant defenses.
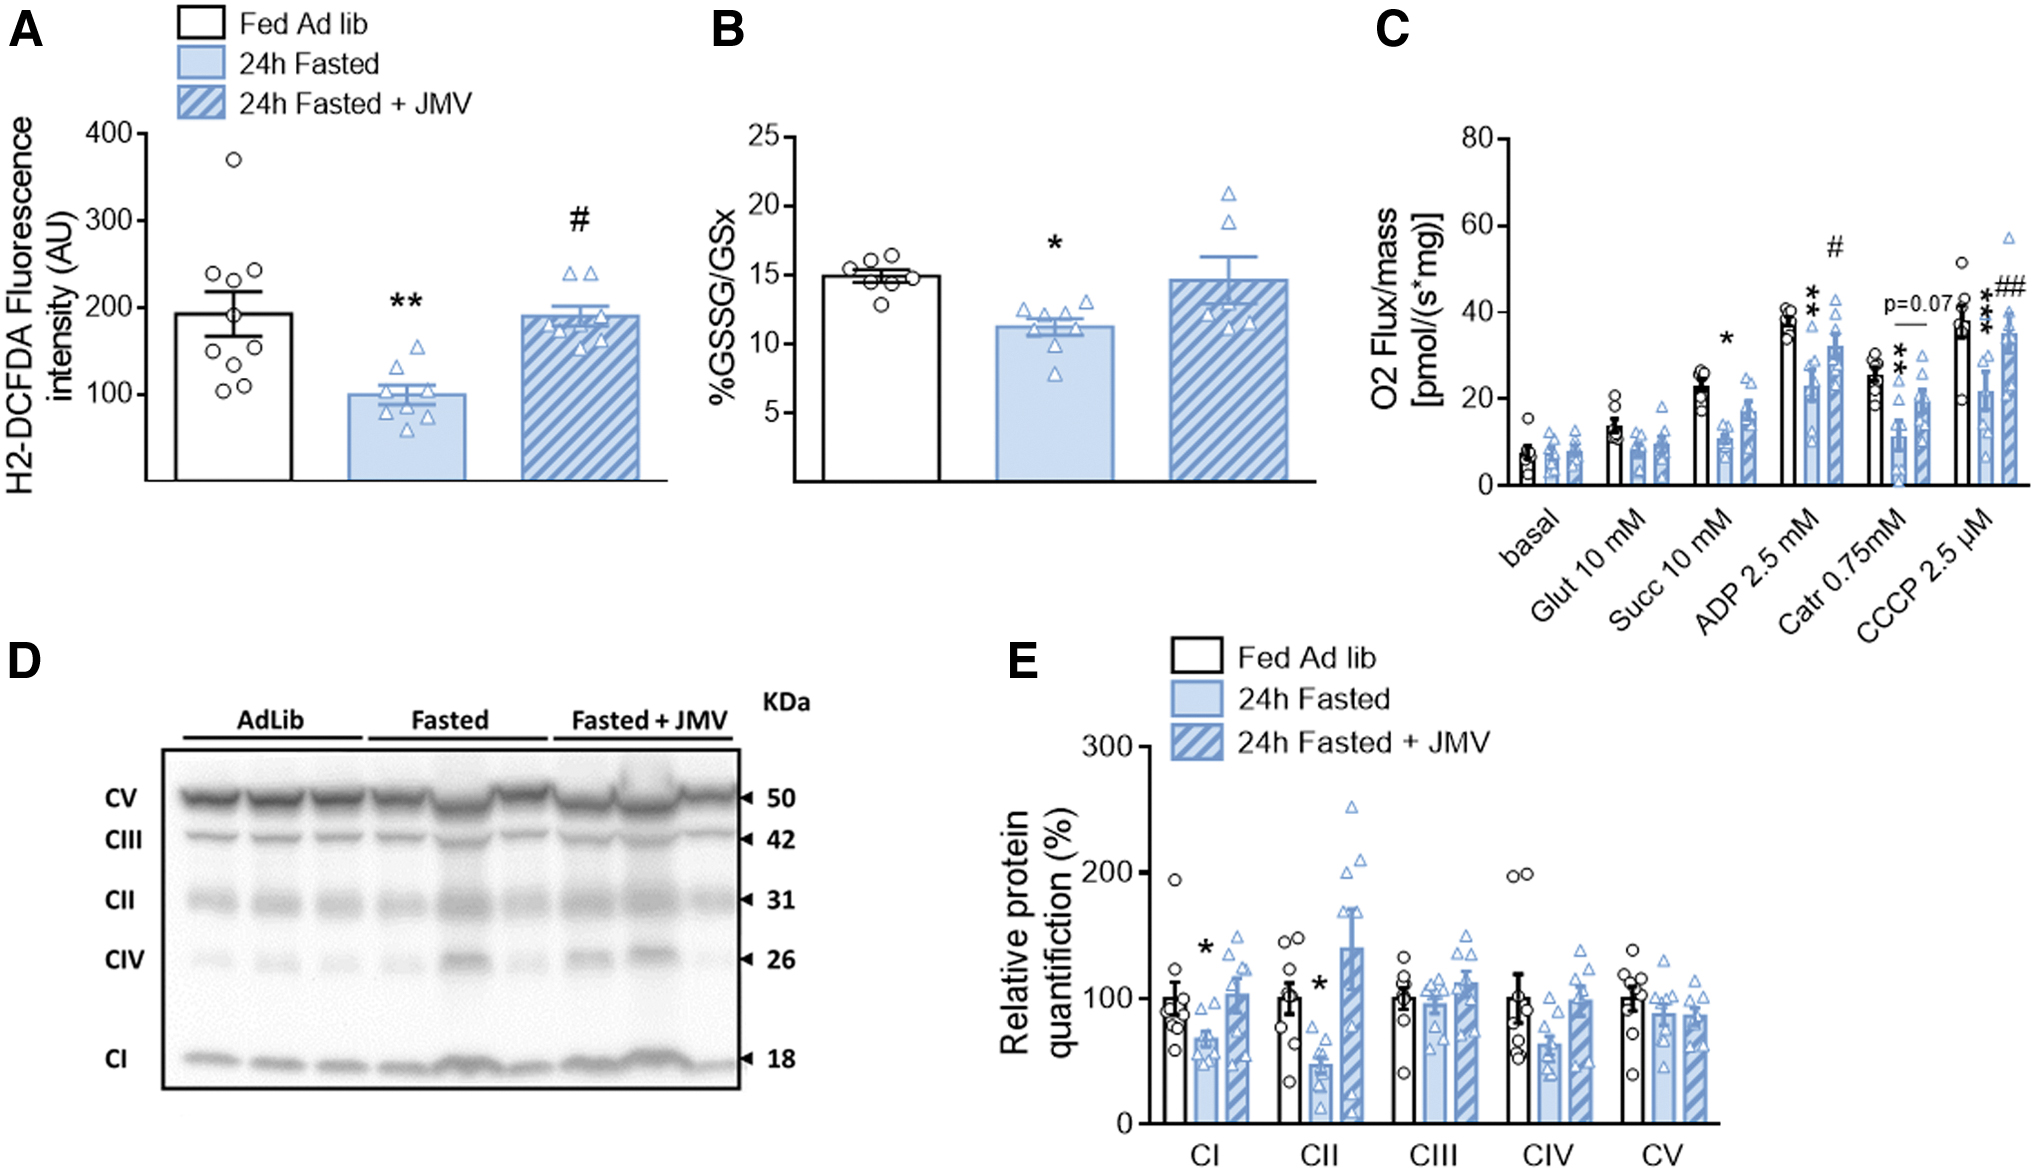
To verify this point, the primary cellular antioxidant that reflects the redox state, glutathione, was evaluated. The GSSG (oxidized glutathione) to GSx (total form of glutathione) ratio showed a higher reduced antioxidant status in fasted rats than in fed rats (p < 0.05). In addition, this difference was no longer present when these rats received the JMV treatment (Fig. 6B).
We then explored MBH mitochondrial respiration by oxygraphy. No difference in the basal oxygen consumption between groups occurred (Fig. 6C), showing normal mitochondrial respiration in the resting state in the MBH of the three groups. However, the substrate-driven respiration (state 2 respiration), measured by sequentially adding glutamate to stimulate complex I and succinate to stimulate complex II, revealed a decreased stimulation with the addition of succinate in the fasted group compared with the ad libitum-fed rats (p < 0.05).
Furthermore, this decrease was no longer present in JMV-treated animals. Decreased stimulated oxygen consumption in the MBH of fasted rats remained in state 3 respiration upon addition of a saturating concentration of ADP to stimulate complex V (p < 0.05). However, this decrease was restored by treatment with JMV (p < 0.05 compared with fasted rats), although only partially (p < 0.05 compared with ad libitum-fed rats) (Fig. 6C). Then, C-atractyloside was added to block complex V and test nonphosphorylating respiration. Oxygen consumption was decreased in groups, but the differences between them were preserved (p < 0.01 between ad libitum-fed rats and fasted rats, only a tendency toward significance between the fasted group and the JMV-treated fasted group, p = 0.07) (Fig. 6C).
Finally, we tested the maximal capacity of the ETC by adding CCCP. It increased respiration with significant differences between groups being preserved (p < 0.001 between ad libitum-fed rats and fasted rats, p < 0.01 between the fasted group and the JMV-treated fasted group) (Fig. 6C). These experiments suggest that the difference observed in the hyperghrelinemic fasted group was more due to decrease in substrate-driven respiration and in proton leak, which appears to be confirmed by the decrease in the maximal capacity of the ETC, whereas treatment with JMV improved this function.
In addition, MBH protein levels of the five mitochondrial complexes were quantified in all three groups, revealing a decrease in the relative amounts of complexes I and II in fasting rats. This decrease was no longer observed with JMV treatment (Fig. 6D, E). Thus, changes in mitochondrial respiration rates could also be partially due to fewer complexes.
Discussion
To study the role of ghrelin in hypothalamic glucose-sensing hypersensitivity that induces abnormal insulin secretion (vagal control) in obesity and insulin-resistant states, we first pretreated fatty Zücker rats with an acylated ghrelin infusion toward the brain, which did not modify their peripheral hypoghrelinemia. Brain ghrelin infusion was effective to restore normal sensitivity to hypothalamic glucose in this model; that is, a return to no significant insulin secretion in response to a low glucose load, as present in lean Zücker rats.
Moreover, this effect on the nervous control of insulin secretion was independent of an indirect control by GLP-1 release. This hypothalamic impairment in insulin-resistant status was concomitant with increased mROS signaling. These results confirm previous results showing that the hypothalamic pretreatment with an antioxidant restored a normal signaling and glucose sensitivity in obese Zücker rats (Colombani et al, 2009). Here we further demonstrated that this abnormal mROS production to a low glucose load was due to a defect in mitochondrial OXPHOS at complex V, since no change in the coupling state between nonphosphorylating respiration and ETC was measured, suggesting that proton leak through the UCPs pathway is not involved.
In addition, we showed that a normal mROS production was restored by brain pretreatment with ghrelin. In fact, ghrelin pretreatment normalized mROS signaling to the level observed in the hypothalamus of normoghrelinemic lean rats. Furthermore, the ghrelin effect was independent of brain mitochondrial complexes and UCPs content, suggesting the effect might result from their sole activity. This effect of ghrelin also appeared to be independent of AMPK signaling, whose activity was not altered in the different groups of Zücker rats.
To confirm the role of ghrelin in this hypothalamic control, we performed a mirror experiment, using hyperghrelinemic fasted animals with or without an antagonist of the GHS-R1a. Hypothalamic glucose-sensing–induced insulin secretion was then compared with normoghrelinemic animals. Hyperghrelinemic animals did not show an insulin peak in response to a carotid injection of glucose as did normoghrelinemic animals.
In contrast, ghrelin receptor blockade in these animals restored a hypothalamic response similar to the response of normoghrelinemic rats. This result demonstrated the direct relationship between ghrelin action and hypothalamic glucose-induced insulin secretion. The inverse relationship between glucose-induced ROS production, increased mitochondrial activity, and ghrelin action was also present.
However, in this physiological situation of fasting, the changes in mitochondrial respiration do not seem to involve the same mechanism. Indeed, nonphosphorylating respiration was decreased, as well as the maximal electron transfer capacity of the respiratory chain, which suggests less proton leakage by the UCPs. The observed slowdown would be more due to a lack of substrates to activate OXPHOS. In addition, we observed post-transcriptional effects on mitochondrial substrate-utilizing complexes and redox status related to treatment with the ghrelin receptor antagonist for 24 h.
To our knowledge, such studies to evaluate the effect of ghrelin, hypothalamic glucose sensing, and the consequent vagal control on insulin secretion have never been conducted before. Only studies conducted in the periphery have examined the link between glucose sensing and the action of ghrelin on insulin secretion. The effects of ghrelin on direct glucose-stimulated insulin secretion (GSIS) have been extensively studied. Notably, ghrelin decreased GSIS in insulin-producing cells, mouse, and rat islets (DiGruccio et al, 2016; Doi et al, 2006; Reimer et al, 2003; Wierup et al, 2002), while islets from ghrelin-knockout (KO) mice have increased insulin secretion in response to glucose stimulus (Dezaki et al, 2006).
Recently, acyl-ghrelin has been shown to affect the ATP-sensitive K+ (KATP) channels. Acyl-ghrelin hyperpolarized the membrane potential, and decreased cytoplasmic calcium concentration and GSIS; these effects being abolished in β-cells from sulfonylurea 1 (SUR1)- KO mice. Acyl-ghrelin increased KATP current, which can be prevented by dibutyryl cyclic-cAMP, indicating that acyl-ghrelin indirectly opens KATP channels (Kaiser et al, 2021).
The effects of ghrelin on GSIS are therefore correlated to those we observed on brain glucose sensing induced an insulin peak in healthy rats. However, to our knowledge, the question of threshold in response to glucose as a function of ghrelinemia in an obese, insulin-resistant model has never been addressed by considering the pancreas independently of the brain. Mice with a total ghrelin KO crossed with leptin-deficient (ob/ob) mice, a model approaching the leptin receptor KO as is the case with the fatty Zücker rat used here, showed improved glucose tolerance with increased insulin secretion in a glucose tolerance test compared with ob/ob mice (Sun et al, 2006). However, GHS-R1a KO mice crossed with the same ob/ob mice have an opposite phenotype (Ma et al, 2012), therefore making it difficult to interpret the role of acyl-ghrelin via its receptor in vivo.
The use of KO mice for ghrelin fed on a high fat diet has also led to controversial results on these parameters (Sun et al, 2008; Wortley et al, 2005). It therefore seems necessary to dissociate the different sites of action to understand the effects of ghrelin during a rise in blood glucose. Nevertheless, mitochondrial functions have never been investigated on GSIS in β-cells according to ghrelin treatment. Only mitochondrial effects of ghrelin at the hypothalamic level have been studied, but without considering glucose sensing.
Several hypotheses of mechanisms can be considered in hypothalamic glucose sensing, including pro-opiomelanocortin (POMC) neurons. These neurons are key glucose sensors where the classical role of KATP has also been described by various authors (Claret et al, 2007; Ibrahim et al, 2003; Parton et al, 2007; Santoro et al, 2017). In addition, mROS activate POMC neurons, promoting satiety and energy expenditure (Diano et al, 2011). More recently, the work of Claret's group has highlighted that defective mitochondrial fusion through mitofusin 1 (MFN1) in POMC neurons impaired glucose sensing (Ramírez et al, 2017). This study revealed that POMC neurons were involved in the altered insulin secretion through the autonomous nervous system.
In addition, they showed that elevated ROS played a causal role, but in an opposite relationship to what we had previously observed while inhibiting transiently mitochondrial fission (Carneiro et al, 2012; Desmoulins et al, 2019). These opposite responses could be explained by our approach (in opposite to the specific cell population genetic strategy), where all potentially glucose-responsive neurons could be affected. Those interconnections remain to be clarified for the moment.
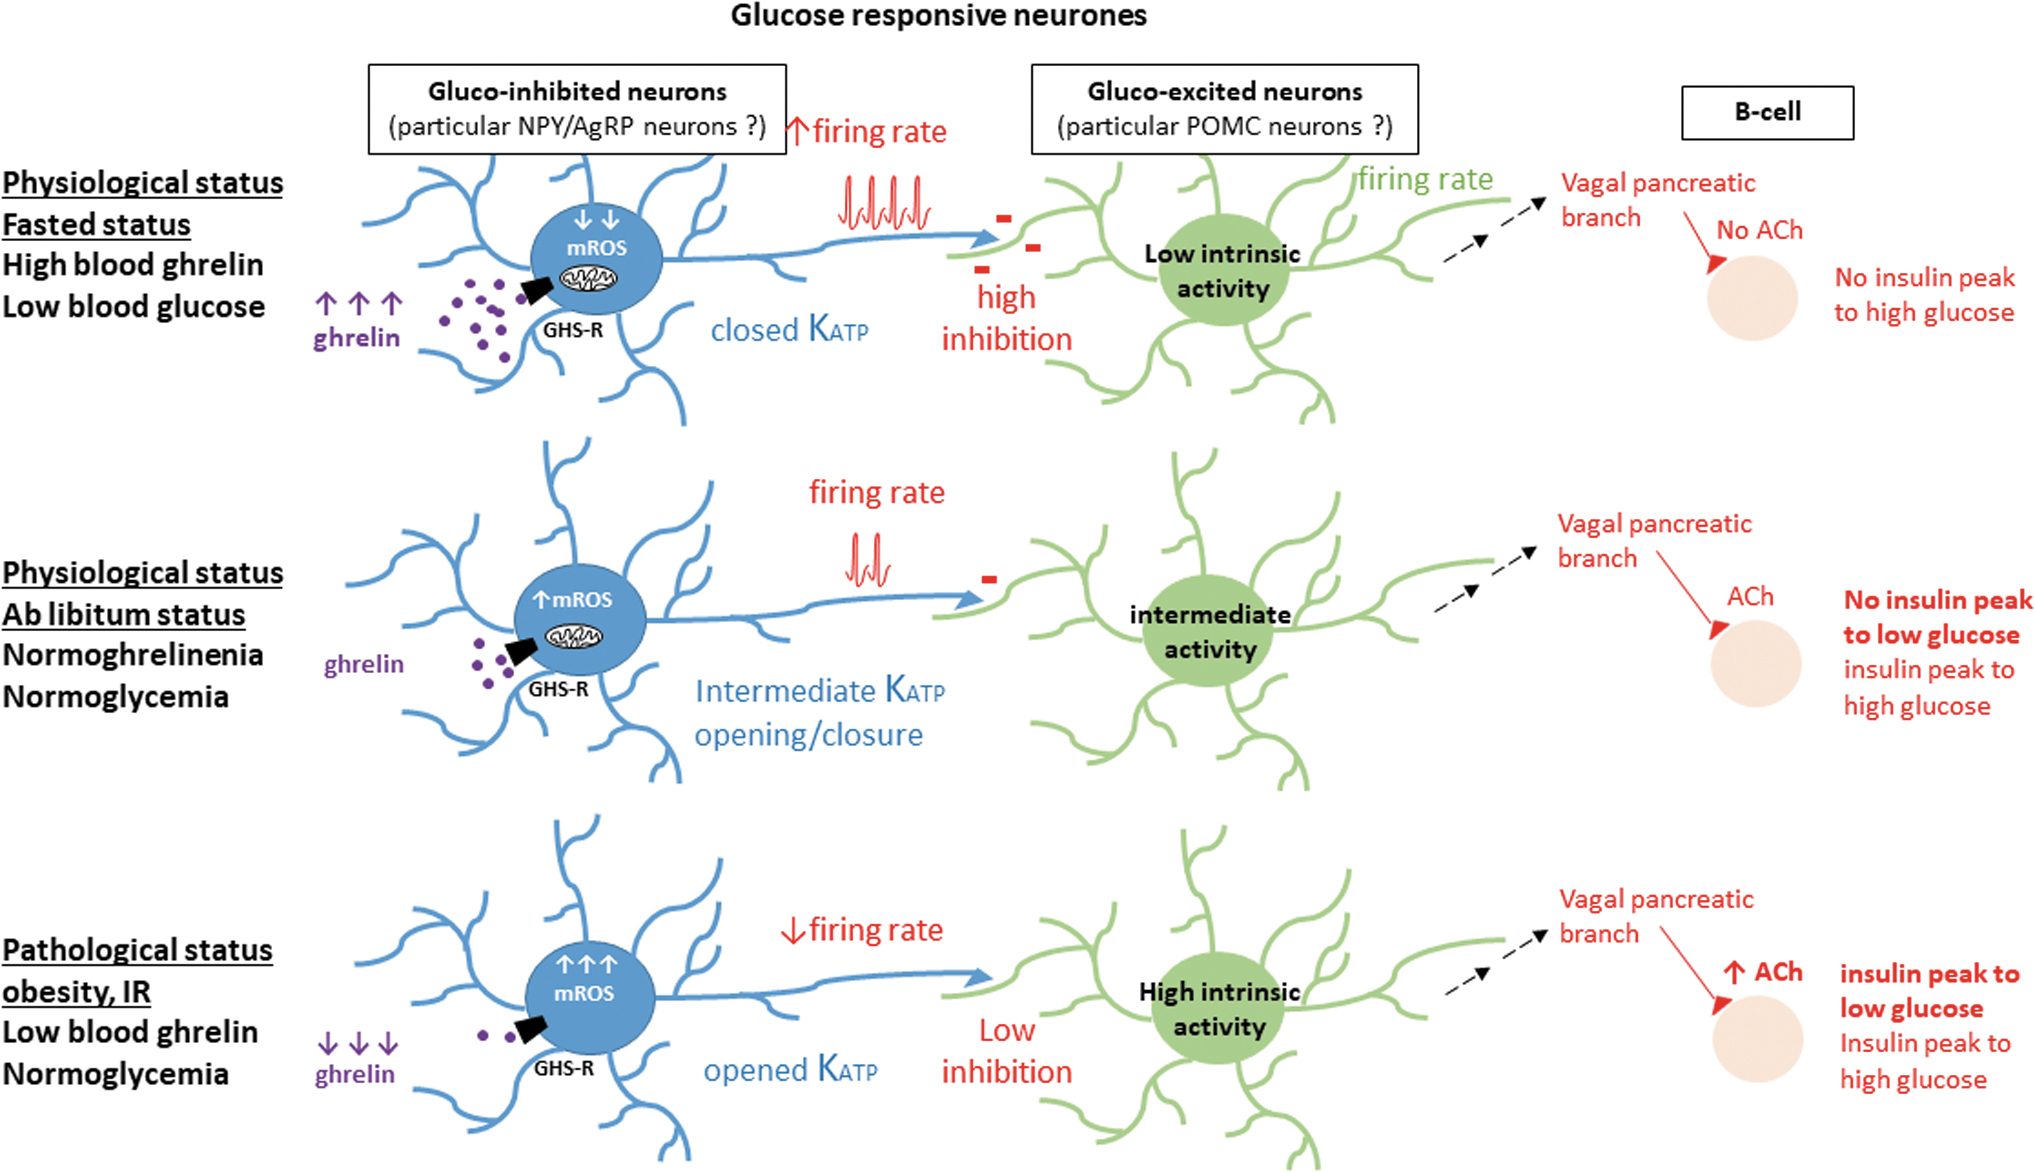
Another explanation could be related to the inhibitory control exerted by NPY/AgRP neurons on POMC neurons. The GHSR is highly expressed in NPY/AgRP neurons (unlike POMC neurons, <8%) (Willesen et al, 1999). In the fasting state, blood glucose is maintained at basal levels while ghrelinemia is elevated. This ensures an optimal mitochondrial coupling where a reduced amount of ROS is produced in response to a transient and low glucose load: NPY/AgRP neurons could then activate and inhibit the gluco-excited POMC neurons, preventing nervous control of insulin secretion.
On the contrary, in the insulin-resistant obese status, hypoghrelinemia does not allow the correct OXPHOS of mitochondria. In the face of even a small increase in glucose levels, electrons are more congested in the respiratory chain, which could lead to mROS signaling. In this case, the NPY/AgRP neurons would be inhibited by ROS and would no longer exert their inhibitory control on the POMC neurons, leading to inappropriate insulin secretion. This hypothesis would explain why ghrelinemia levels lead to the insulin-secretory effects in response to cerebral glucose that we observed. These potential modes of action are shown in Figure 7.
In any case, while proposal to treat insulinoresistance with ghrelin is still a debated strategy in the literature, its effects on glucose sensing in the hypothalamus rather demonstrate a neuroprotective effect in response to increased glucose by decreasing excessive ROS production and improving mitochondrial OXPHOS coupling, and finally by fine-tuning the nervous control of insulin secretion.
Materials and Methods
Animals: diet and experimental procedures
Male Wistar rats and genetically obese (fa/fa) and lean (Fa/?) Zücker rats (7–8 weeks old; Charles River) were housed in a controlled environment (12-h light/dark cycle, lights on at 7:00 a.m., 22°C) and fed ad libitum (No. A04; Safe), except for fasting groups whose food was removed 24 h before the experiments. Surgeries and experiments were performed under alfaxalone anesthesia (Alfaxan, 80 mg/kg; Centravet) and analgesia (buprenorphine 0.05 mg/kg; Buprecare). In these studies, to reach the brain, perfusion through the carotid artery was chosen as the most physiological route (i.e., by which blood ghrelin and glucose reach the brain); our previous studies having already demonstrated the involvement of ARC neurons in the vagal control studied here, using this mode of perfusion through the carotid (Colombani et al, 2009; Leloup et al, 2006).
For the Zücker rat studies, a group of obese rats was pretreated with a carotid infusion of rat octanoyl-ghrelin (5 ng/mL, 10 μL/min; PolyPeptide Group) for 30 min before carotid injection of glucose. For studies involving 24-h fasting in Wistar rats and to counteract ghrelin effects, one group received two i.p. injections of the ghrelin receptor antagonist JMV3002 (Interchim) at 10 h intervals at 80 μg/kg, 14 and 4 h before the experiments (Bresciani et al, 2008; Moulin et al, 2008), and another group received a single infusion of the antagonist toward the brain (through the carotid artery, 10 nM [Salomé et al, 2009], flow rate: 1 μL/min, 30 min), before testing hypothalamic glucose-induced insulin secretion.
All procedures involving rats were conducted in accordance with the European Directive (2010/63/EU), and approved by our local ethic committee of the University of Burgundy (C2EA Grand Campus Dijon No. 105) and French Ministry of Research (agreement No. 20564-2019050909448465).
In particular, and in accordance with the ethics of respecting animals and reducing their use, control animals with infusion of solvent (NaCl, 0.9%) were not included, because these groups have already been performed in previous studies, and we have already shown that they did not impact the major actors studied in this work (cerebral glucose sensing, ROS production, or mitochondrial respiration) (Carneiro et al, 2012; Colombani et al, 2009; Desmoulins et al, 2019).
Intracarotid glucose perfusion-induced insulin secretion
Experiments were performed as previously described (Carneiro et al, 2012; Colombani et al, 2009; Desmoulins et al, 2019; Leloup et al, 2006). Animals were injected over 30 s with a 3 mg/kg (lean and obese Zücker rats) or 9 mg/kg (Wistar rats) glucose load (100 μL) toward the brain through the carotid artery. The 3 mg/kg glucose load stimulates insulin secretion only in obese, glucose-hypersensitive rats but is ineffective in nonobese rats (Alquier et al, 2003; Colombani et al, 2009), where only the 9 mg/kg dose provides this vagal control.
Blood was collected at the rat tail vein to measure blood glucose and plasma insulin before and 1 (peak insulin), 3, 5, and 10 min after the load. At the end of experiments, brains were quickly removed, the MBH dissected and frozen in liquid nitrogen, stored at −80°C until assayed, as well as plasma. Otherwise, they were immediately used for mitochondrial respiration or ROS determination (at time 1 min).
Blood parameters determination
Blood samples were collected from the tail vein for measurements of blood glucose levels at the indicated times. Blood glucose concentration was measured using the glucose analyzer Performa AccuChek (Roche Diagnostics). Plasma insulin, GLP-1, and acylated ghrelin concentrations were determined using enzyme-linked immunosorbent assay (ELISA) kits according to the manufacturer's recommendations (Eurobio, Invitrogen and Millipore, respectively).
ROS level measurement
One minute after the beginning of the carotid glucose injection, rats were decapitated, brains quickly removed on ice, and the MBH dissected. For ROS determination (Szabados et al, 1999), MBH was homogenized in ice using a dounce homogenizer in 1 mL of buffer containing 150 mM KCl, 20 mM Tris, 0.5 mM EDTA, 1 mM MgCl2, 5 mM glucose, and 0.5 mM octanoic acid, pH 7.4. Then, the homogenate was centrifuged (800 g, 10 min, 4°C), the supernatant recovered, and ROS assessed by adding 4 μM of the fluorescent probe dichlorodihydro-fluorescein diacetate (H2-DCFDA; Molecular Probes) that primarily detects H2O2 levels, and incubated at 37°C for 30 min.
The reaction was stopped by adding an equal volume of ice-cold 70% ethanol containing 0.1 M HCl. Two hundred microliters of the fluorescent dye in the supernatants was measured at 535 nm, under excitation at 490 nm, using a microplate reader (Perkin Elmer). Proteins were quantified, and fluorescence intensity was expressed in arbitrary units per milligram of protein.
Mitochondrial oxygen consumption measurement on MBH tissues
Oxygen consumption was measured using a respirometer (Oxygraph-2k; Oroboros Instruments). Half of a freshly dissected MBH was transferred into mitochondrial respiration medium (MiR05) containing saponin for permeabilization, according to the protocol developed for these oxygraphic studies in the hypothalamus (Benani et al, 2009). Then, MBH tissue was transferred into the glass chamber of the respirometer. Mitochondrial state 2 respiration was stimulated by the successive addition of substrates: 10 mM glutamate to stimulate complex I and 10 mM succinate to stimulate complex II. Then, state 3 respiration was achieved by adding 2.5 mM ADP to measure oxygen consumption when ATP synthesis rate was maximal.
Nonphosphorylating respiration was achieved by adding 5 μM Omy (Zücker rat study) or 0.75 mM C-atractyloside (Wistar rat study). The sequence ended with the addition of 2.5 μM CCCP, an uncoupler to evaluate the maximal capacity of the ETC in the uncoupled state. Finally, oxygen consumption was calculated using Data-Graph software. All chemicals were purchased from the Sigma-Aldrich Company. Media were prepared according to the guide provided by Oroboros Instruments, with technical sheets available on the company website at www.oroboros.at
Western blot analyses
MBH was dissected out and lysed in RIPA buffer with protease inhibitor cocktail proteins (complete; Roche Diagnostics). Protein concentration was determined using Bio-Rad DC assay. Before loading on a Bio-Rad 4%–15% TGX stain free gel, samples (20 μg protein) were denatured by heating (except for OXPHOS analysis) in Laemli/TCEP buffer. Proteins were semidry, transferred onto PVDF membranes (Bio-Rad Transblot).
Immunodetection was carried out using the following antibodies: UCP2 (TA302628; 1:1000), UCP4 (TA333972; 1:1000), UCP5 (TA333986; 1:800) from Origene, AMPKa (1:1000, No. 2532S), and phospho-AMPKa-(Thr172) (1:100, No. 2531S) from Cell Signaling, Ozyme, total OXPHOS rodent antibody cocktail (ab110413; 1:1000, from Abcam, these antibodies recognize NDUFB8 [18 kDa] for complex I, SDHB [31 kDa] for CII, UQCRC2 [42 kDa] for CIII, COX2 [26 kDa] for CIV, and ATP5A [50 kDa] for CV), followed by HRP-coupled secondary antibodies. Revelation used Bio-Rad Clarity (UCP2, UCP4, OXPHOS) and Clarity Max (UCP5) chemiluminescent substrates.
Signal was acquired with the ChemiDoc XRS+ system, and densitometry analysis was performed using the associated ImageLab software (Bio-Rad). Quantification was carried out with loading normalization to total protein lane densitometry. In addition, for each target protein, when samples were loaded across several membranes, their signals were normalized for comparison between membranes using that from identical calibrator samples loaded onto each gel (2 per gel).
Hypothalamic red/ox glutathione determination after JMV treatment
Reduced glutathione (GSH) and GSSG were quantified using the Detect X Glutathione Kit according to the manufacturer's protocol (Eurobio). In brief, GSH is first quantified, and total glutathione is secondarily measured by addition of a reaction mixture that converts all the GSSG into reduced GSH, which then reacts with the excess reagent to yield the signal related to total glutathione content (GSx). We then calculated the red/ox state of glutathione per milligram of protein as (GSSG/GSx) × 100.
Statistical analysis
Data are presented as mean ± standard error of the mean. Statistical analysis was performed using Prism 6.0 (GraphPad software). Both Bartlett's and Shapiro–Wilk's tests were applied to check equality in variance and normality of distribution, respectively. For studies with the Zücker rat model, a two-way analysis of variance (ANOVA) was applied first to detect interactions between genotype and treatment. When genotype did not produce any significant effect, one- or two-way ANOVA was then applied; otherwise, groups were analyzed independently using Student's or Mann–Whitney U tests when appropriate. After ANOVA, multiple comparisons of means were further computed with the Newman-Keuls test.
For some parameters, nonparametric Kruskal–Wallis and Mann–Whitney U tests were used when appropriate; that is, heterogeneity of variances. For single comparison, that is, lean versus obese, nonpaired Student's t test was applied. For studies with the Wistar rats, normality was tested with the Kolmogorov–Smirnov test. According to the experiment, one-way ANOVAs or two-way ANOVAs (followed by the Bonferroni post hoc test) were performed. Asterisks (*) or sharp (#) signs indicate significant differences between groups according to the statistical analysis performed: * or # indicate p < 0.05; ** or ## indicate p < 0.01; *** or ### indicate p < 0.001.
Electronic laboratory notebook was not used.
Footnotes
Acknowledgments
We are indebted to A. Lefranc and V. Cadiou (CSGA, UMR Université de Bourgogne, 6265 CNRS, 1324 INRAE, Dijon, France) for assistance with the rats.
Authors' Contributions
According to the CRediT Taxonomy guidelines: L.C. contributed to formal analysis (lead), investigation (lead), methodology (equal), validation (lead), visualization (equal), supervision (equal), and writing original draft (equal). C.F. assisted with formal analysis (equal), investigation (equal), methodology (equal), validation (equal), visualization (equal), and supervision (equal). F.L. conducted investigation (equal), resources (equal), and validation (equal). S.G. performed investigation (equal), resources (lead), validation (equal), and supervision (equal). B.A., J.H., and R.P. conducted investigation (equal) and validation (equal). C.A., L.D., and X.F. performed investigation (equal), validation (equal), visualization (equal), and writing—review and editing (equal). M.-C.B., T.M., L.B., L.P., and A.J.-P. contributed to writing—review and editing (equal). C.L. assisted with conceptualization (lead), formal analysis (lead), funding acquisition (lead), investigation (equal), methodology (equal), project administration (lead), supervision (lead), validation (lead), visualization (lead), writing—original draft (lead), review and editing (lead).
Author Disclosure Statement
No competing financial interests exist.
Funding Information
J.H. has a fellowship from the Ministère de la Recherche. C.L. has a grant from Agence Nationale de la Recherche (ANR-19-CE21-0003-05) and a grant from Benjamin Delessert's Institute (Prize 2017).
Supplementary Material
Western blots