
Abstract
Aims:
Genetically encoded green fluorescent protein (GFP)-based redox biosensors are widely used to monitor specific and dynamic redox processes in living cells. Over the last few years, various biosensors for a variety of applications were engineered and enhanced to match the organism and cellular environments, which should be investigated. In this context, the unicellular intraerythrocytic parasite Plasmodium, the causative agent of malaria, represents a challenge, as the small size of the organism results in weak fluorescence signals that complicate precise measurements, especially for cell compartment-specific observations. To address this, we have functionally and structurally characterized an enhanced redox biosensor superfolder roGFP2 (sfroGFP2).
Results:
SfroGFP2 retains roGFP2-like behavior, yet with improved fluorescence intensity (FI) in cellulo. SfroGFP2-based redox biosensors are pH insensitive in a physiological pH range and show midpoint potentials comparable with roGFP2-based redox biosensors. Using crystallography and rigidity theory, we identified the superfolding mutations as being responsible for improved structural stability of the biosensor in a redox-sensitive environment, thus explaining the improved FI in cellulo.
Innovation:
This work provides insight into the structure and function of GFP-based redox biosensors. It describes an improved redox biosensor (sfroGFP2) suitable for measuring oxidizing effects within small cells where applicability of other redox sensor variants is limited.
Conclusion:
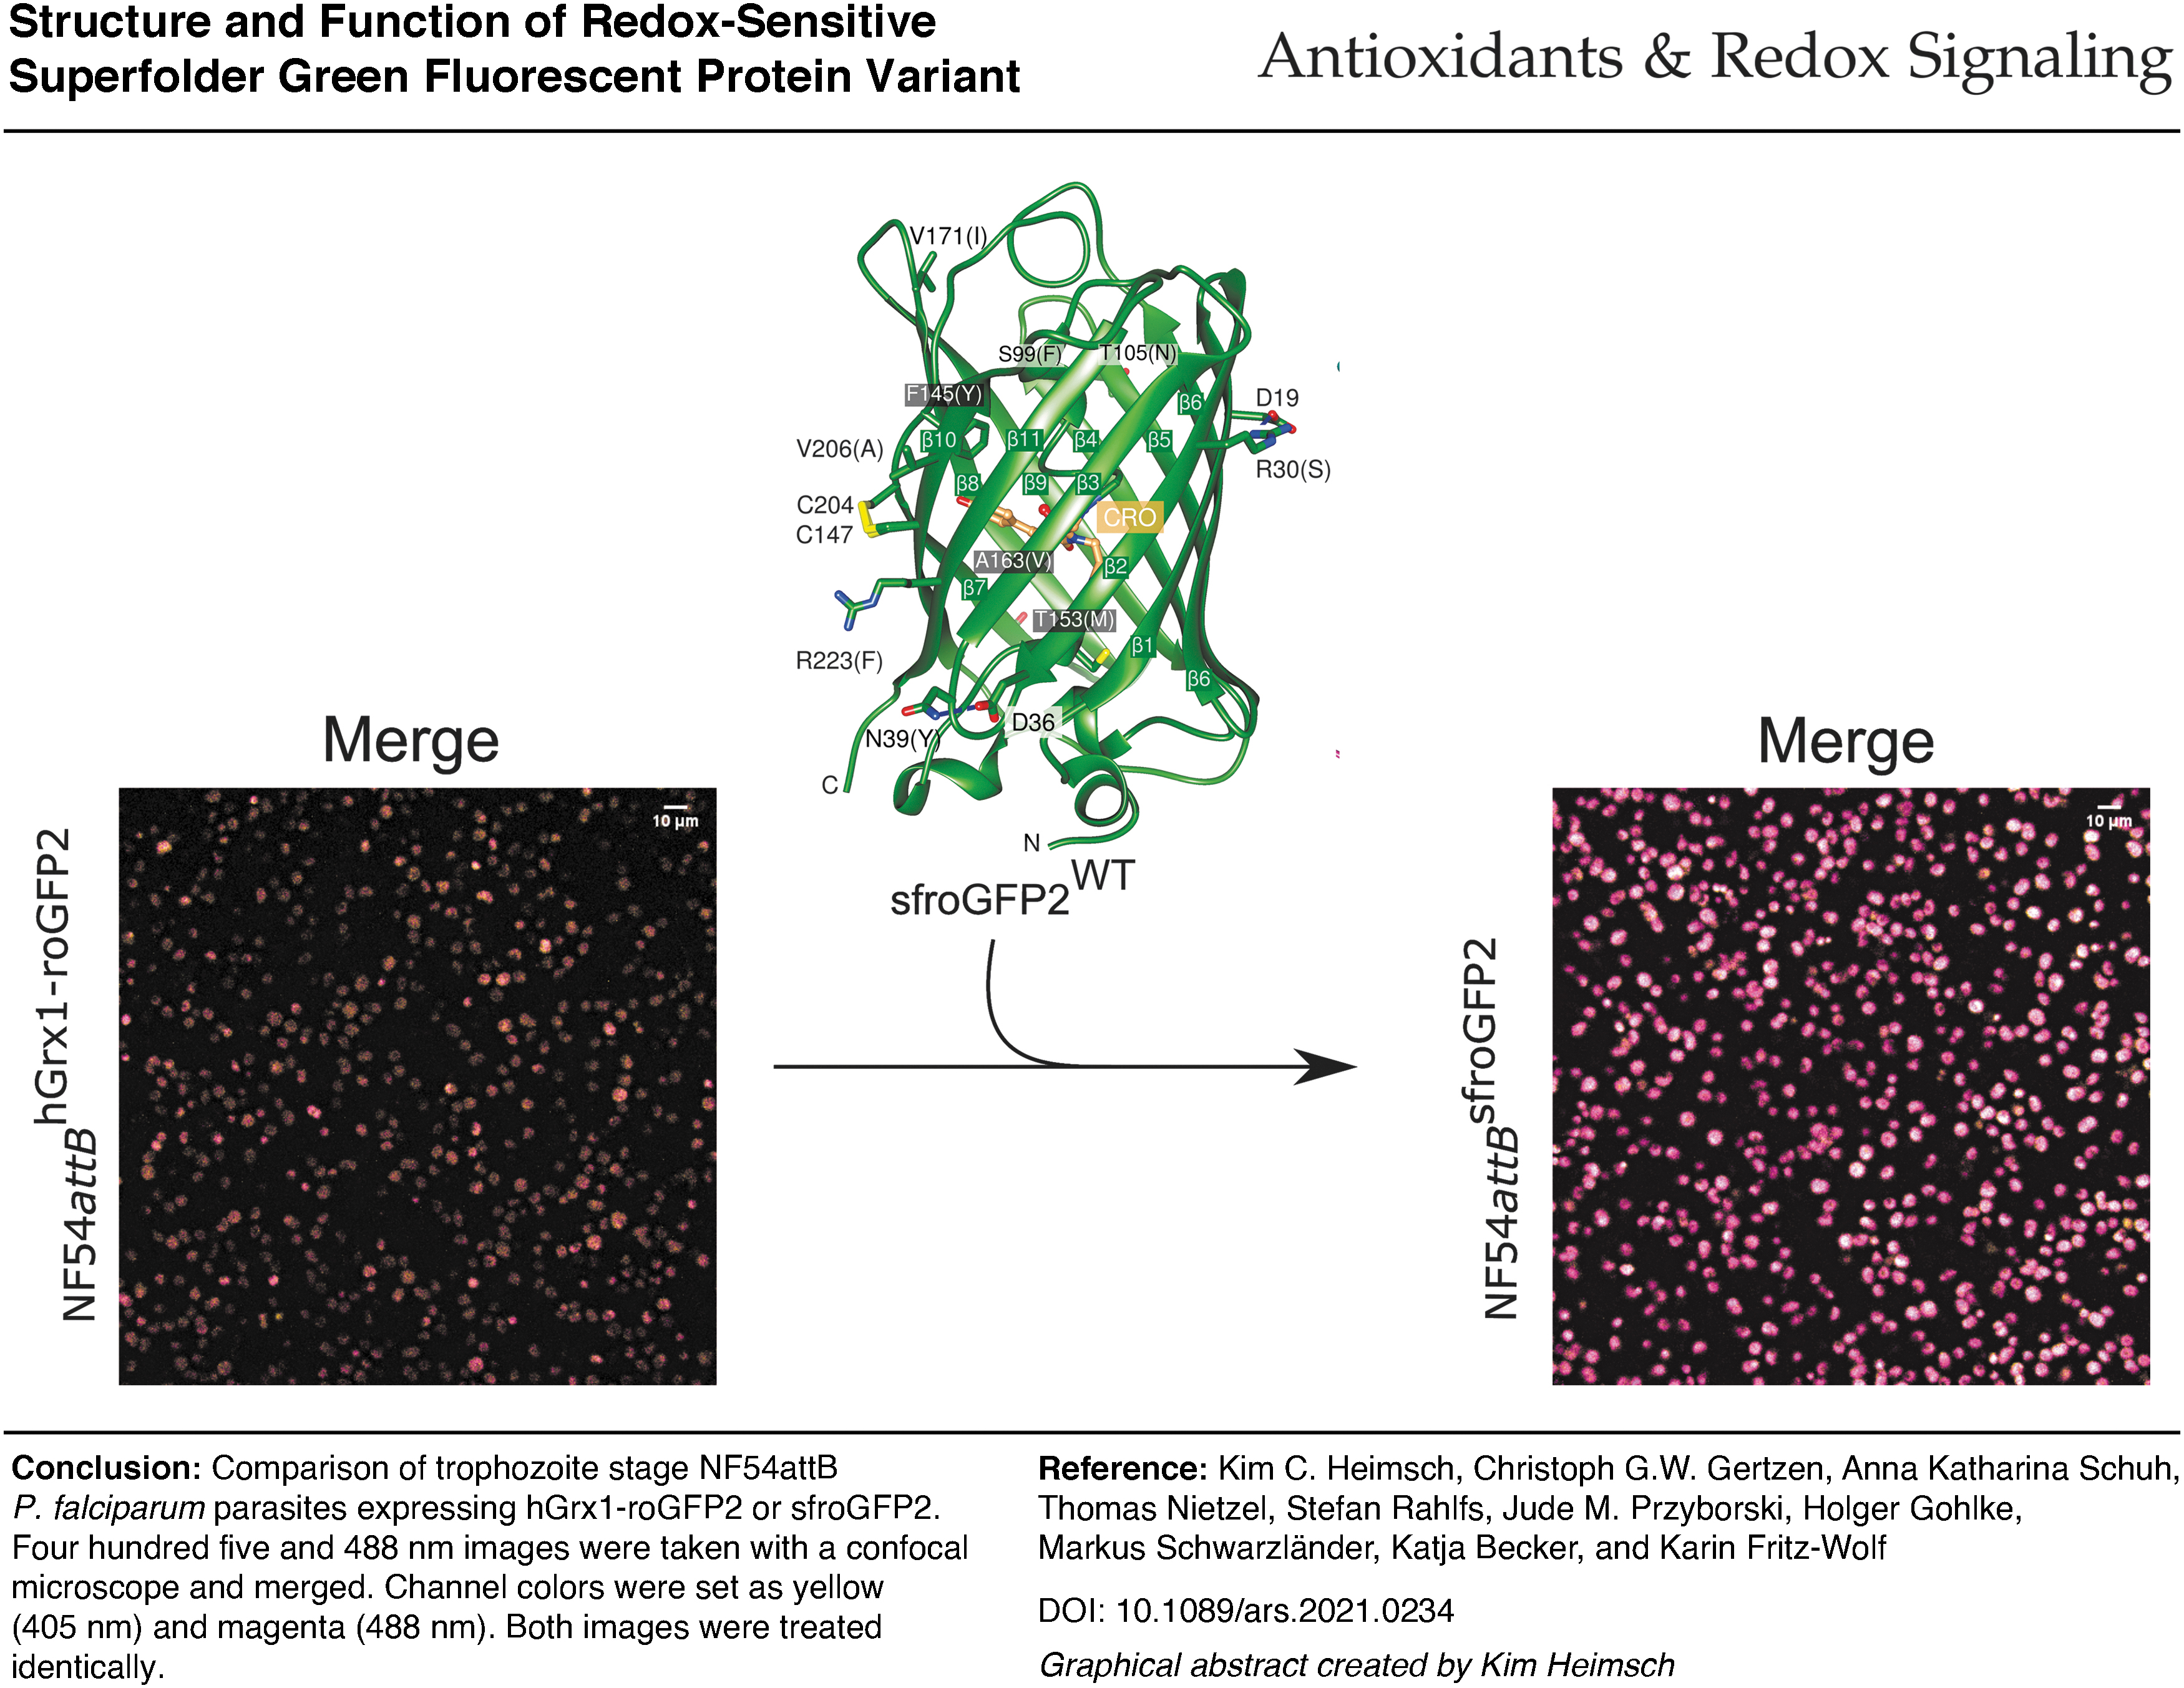
Improved structural stability of sfroGFP2 gives rise to increased FI in cellulo. Fusion to hGrx1 (human glutaredoxin-1) provides the hitherto most suitable biosensor for measuring oxidizing effects in Plasmodium. This sensor is of major interest for studying glutathione redox changes in small cells, as well as subcellular compartments in general. Antioxid. Redox Signal. 37, 1–18.
Innovation
The small size of Plasmodium parasites and their lifestyle, including their presence in highly pigmented erythrocytes, makes fluorescence-based measurement difficult. This is further complicated when measurements in subcellular compartments are to be performed. Generating a redox biosensor that shows improved fluorescence intensity in cellulo considerably enhances the quality of the measurement method (graphical abstract). The deep structural and functional insight into the sensor properties gained by this study suggests that specific mutations can significantly improve the stability of a biosensor and thereby its in cellulo performance. This study provides a blueprint for rational optimization of biosensors to match specific biological requirements.
Introduction
The green fluorescent protein (GFP) from the jellyfish Aequorea victoria (51, 67) possesses a p-hydroxybenzylidene-imidazolidinone chromophore, which is formed upon internal cyclization and oxidation of the three amino acids (AAs) Ser, Tyr, and Gly (19, 41). Dependent on the protonation/ionization state of the chromophore, GFP has two excitation maxima, at 395 and 475 nm, both giving rise to emission with a maximum at 508 nm (3, 67). Due to the β-barrel structure of GFP, the chromophore is largely shielded from the surrounding solvents (3). Over the years, the spectral properties of the original wild-type (WT) avGFP (Aequorea victoria GFP) have been optimized through protein engineering. In nature, WT avGFP associates aequorin, involving hydrophobic interaction of the protein surfaces; absence of aequorin can cause aggregation.
The so-called cycle three mutations (F99S, M153T, and V163A) result in more hydrophilic residues, reduce aggregation, and improve chromophore activation (8). Including these resulted in a GFP version with the generation of a stronger fluorescence signal; however, excitation maxima remained unchanged (8). Additional mutations (F64L, S65T) in combination lead to an increase in fluorescence intensity (FI) compared with WT avGFP (7, 70). Pédelacq et al. added further mutations (S30R, Y39N, N105T, Y145F, I171V, and A206V) to generate superfolder (sf) GFP. Those mutations lead to improved thermodynamic stability, faster folding, and decreased folding interference (45).
Besides using GFP as a fluorescence reporter in a wide range of cell biological applications, it has been utilized to generate a redox-sensitive biosensor that allows ratiometric, real-time measurements in living cells. By inserting cysteine pairs into juxtaposed β-strands of the GFP barrel surface, spectral changes of the chromophore are dependent on alterations in redox potential of redox couples that are able to react and equilibrate with the thiol/disulfide redox switch (18). The two excitation maxima of roGFP (reduction/oxidation-sensitive green fluorescent protein) are shifted to ∼400 and 490 nm (18).
We have previously used GFP-based redox biosensors to study oxidizing effects within Plasmodium falciparum parasites (32, 64), which replicate within mature human red blood cells. Malaria parasites encounter oxidative challenge, for example, due to the parasite's high metabolic rate, from products of red blood cell hemoglobin digestion during the intraerythrocytic life cycle and the immune responses of the host (28). Furthermore, it is known that some antimalarials mediate their effect at least partially by increasing the production rates of reactive oxygen species and of other free radicals (33). Therefore, studying changes in the redox metabolism of Plasmodium parasites is of considerable interest to understand the mode of action of new antimalarials, as well as resistance mechanisms.
The small size of Plasmodium parasites (2–5 μm in the asexual erythrocytic stages usually studied) has been technically challenging for fluorimetry and imaging approaches, as well as the high background pigmentation of the host cell. Membrane-bound subcompartments of the parasites (apicoplast, mitochondrion, parasitophorous vacuole) are even smaller, further complicating precise measurement of cellular parameters. Fluorescence signals of commonly used redox biosensors regularly result in comparatively worse signal-to-noise ratios, further complicating the situation. This is even more the case for measurements in subcellular compartments with small volume such as the mitochondrial matrix.
In previous work, the two cysteines S147C and Q204C, as well as the F223R mutation from roTurbo (13), were included in sfGFP, resulting in sfroGFP2 (superfolder reduction/oxidation-sensitive GFP2, sfroGFP2WT), which showed strongly increased FI in cellulo (graphical abstract) (64).
In this study, we characterized sfroGFP2 to assess its functionality in Plasmodium parasites. We presented a X-ray crystal structure resolved to 1.1 Å and used this as a basis to examine the structural stability of the protein further. Structural stability can be probed by modeling the structures as constraint networks, where atoms as nodes are connected by constraints due to covalent and noncovalent bonds, and via subsequent analysis based on a rigidity theory (24, 49, 50, 57). We tested the hypothesis that the improved fluorescence and robustness of sfroGFP2WT may be related to a higher structural stability of this variant (46).
To gain empirical insights into the relative contribution of specific residues to the modified structural and functional properties of sfroGFP2WT, we removed specific superfolding mutations, namely S30R, Y39N, and F223R. Based on the crystal structure of sfroGFP2WT, it is very unlikely that both sf mutations Y147F and I171V influence the structure to any major extent. Furthermore, as already stated by Pédelacq et al., the N105T side chain does not affect the orientation of the adjacent residue side chains. In sfGFP, the mutation A206V comes into close contact with the phenyl group of F223 (45). However, since the AA at position 223 points toward the solvent phase, we did not assume an impact to the structural stability. We have therefore focused our examinations on both sf mutations S30R and Y39N, and did not focus on any of the other sf mutations, since we did not assume major effects to the structure of the sensor.
Gutscher et al. fused roGFP to human glutaredoxin-1 (hGrx1), thereby generating a proximity-based biosensor that specifically equilibrates with the glutathione couple, thus overcoming uncertainties about the in vivo specificity of the free roGFP biosensor, as well as slow responsiveness (17, 18). Taking our lead from this, we have here fused sfroGFP2WT to hGrx1, combining the advantages of a specific and fast responding biosensor resulting from hGrx1-fusion with the increased FI of sfroGFP2WT.
Results
The improved redox biosensor sfroGFP2WT shares 94% sequence identity with avGFP. It contains all roGFP2 substitutions plus the sf mutations (45) (Fig. 1A), as well as F223R (13). This sensor was recently published by our research group and showed favorable properties as compared with the commonly used roGFP2 variant when used in cellulo (64).
To determine whether the two specific sf mutations S30R and Y39N are involved in increasing the stability of sfroGFP2WT compared with roGFP2, we reversed these two mutations, as well as F223R, one at a time. We investigated the three reversion mutants (mutants are called throughout the article as follows: sfroGFP2R30S, sfroGFP2N39Y, and sfroGFP2R223F), as well as sfroGFP2WT and the fusion sensor hGrx1-sfroGFP2, in comparison with roGFP2 and hGrx1-roGFP2, by using a set of complementary methods, we (i) determined and analyzed the crystal structures of sfroGFP2WT, sfroGFP2R30S, and sfroGFP2N39Y; (ii) performed rigidity analysis for sfroGFP2WT and a set of different models based on it; and (iii) assessed the spectral and functional properties of all roGFP2- and sfroGFP2WT-based biosensors.
Crystal structure analysis
We obtained orthorhombic and monoclinic crystals of sfroGFP2WT. The sfroGFP2WT protein crystallizes in space group P212121 and contains one monomer in the asymmetric unit. SfroGFP2R30S and sfroGFP2N39Y obey P21 symmetry, with two or four monomers in the asymmetric unit, respectively. The sfroGFP2WT crystal diffracted to a resolution of 1.1 Å, and the mutants sfroGFP2R30S and sfroGFP2N39Y to 1.4 Å and 2.0 Å, respectively. All structures were solved via molecular replacement. Data collection and refinement statistics of all datasets are summarized in Table 1.
Crystallographic Statistics
Statistics for the high-resolution shell are shown in parentheses.
Rmerge = ∑ hkl ∑ i |Ii (hkl) [I(hkl)]|/∑ hkl ∑ i I i (hkl), where I i (hkl) is the ith measurement of reflection hkl and [I(hkl)] is the weighted mean of all measurements.
Rpim = ∑ hkl [1/(N 1)] 1/2 ∑ i |I i (hkl) [I(hkl)]|/∑ hkl ∑ i I i (hkl), where N is the redundancy for the hkl reflection.
Rwork/Rfree = ∑ hkl | F o F c|/∑ hkl |F o|, where F c is the calculated and F o is the observed structure-factor amplitude of reflection hkl for the working/free (5%) set, respectively.
ASU, asymmetric unit; PDB, Protein Data Bank; RMSZ, root mean square of all zscores of the bond lengths (or angles).
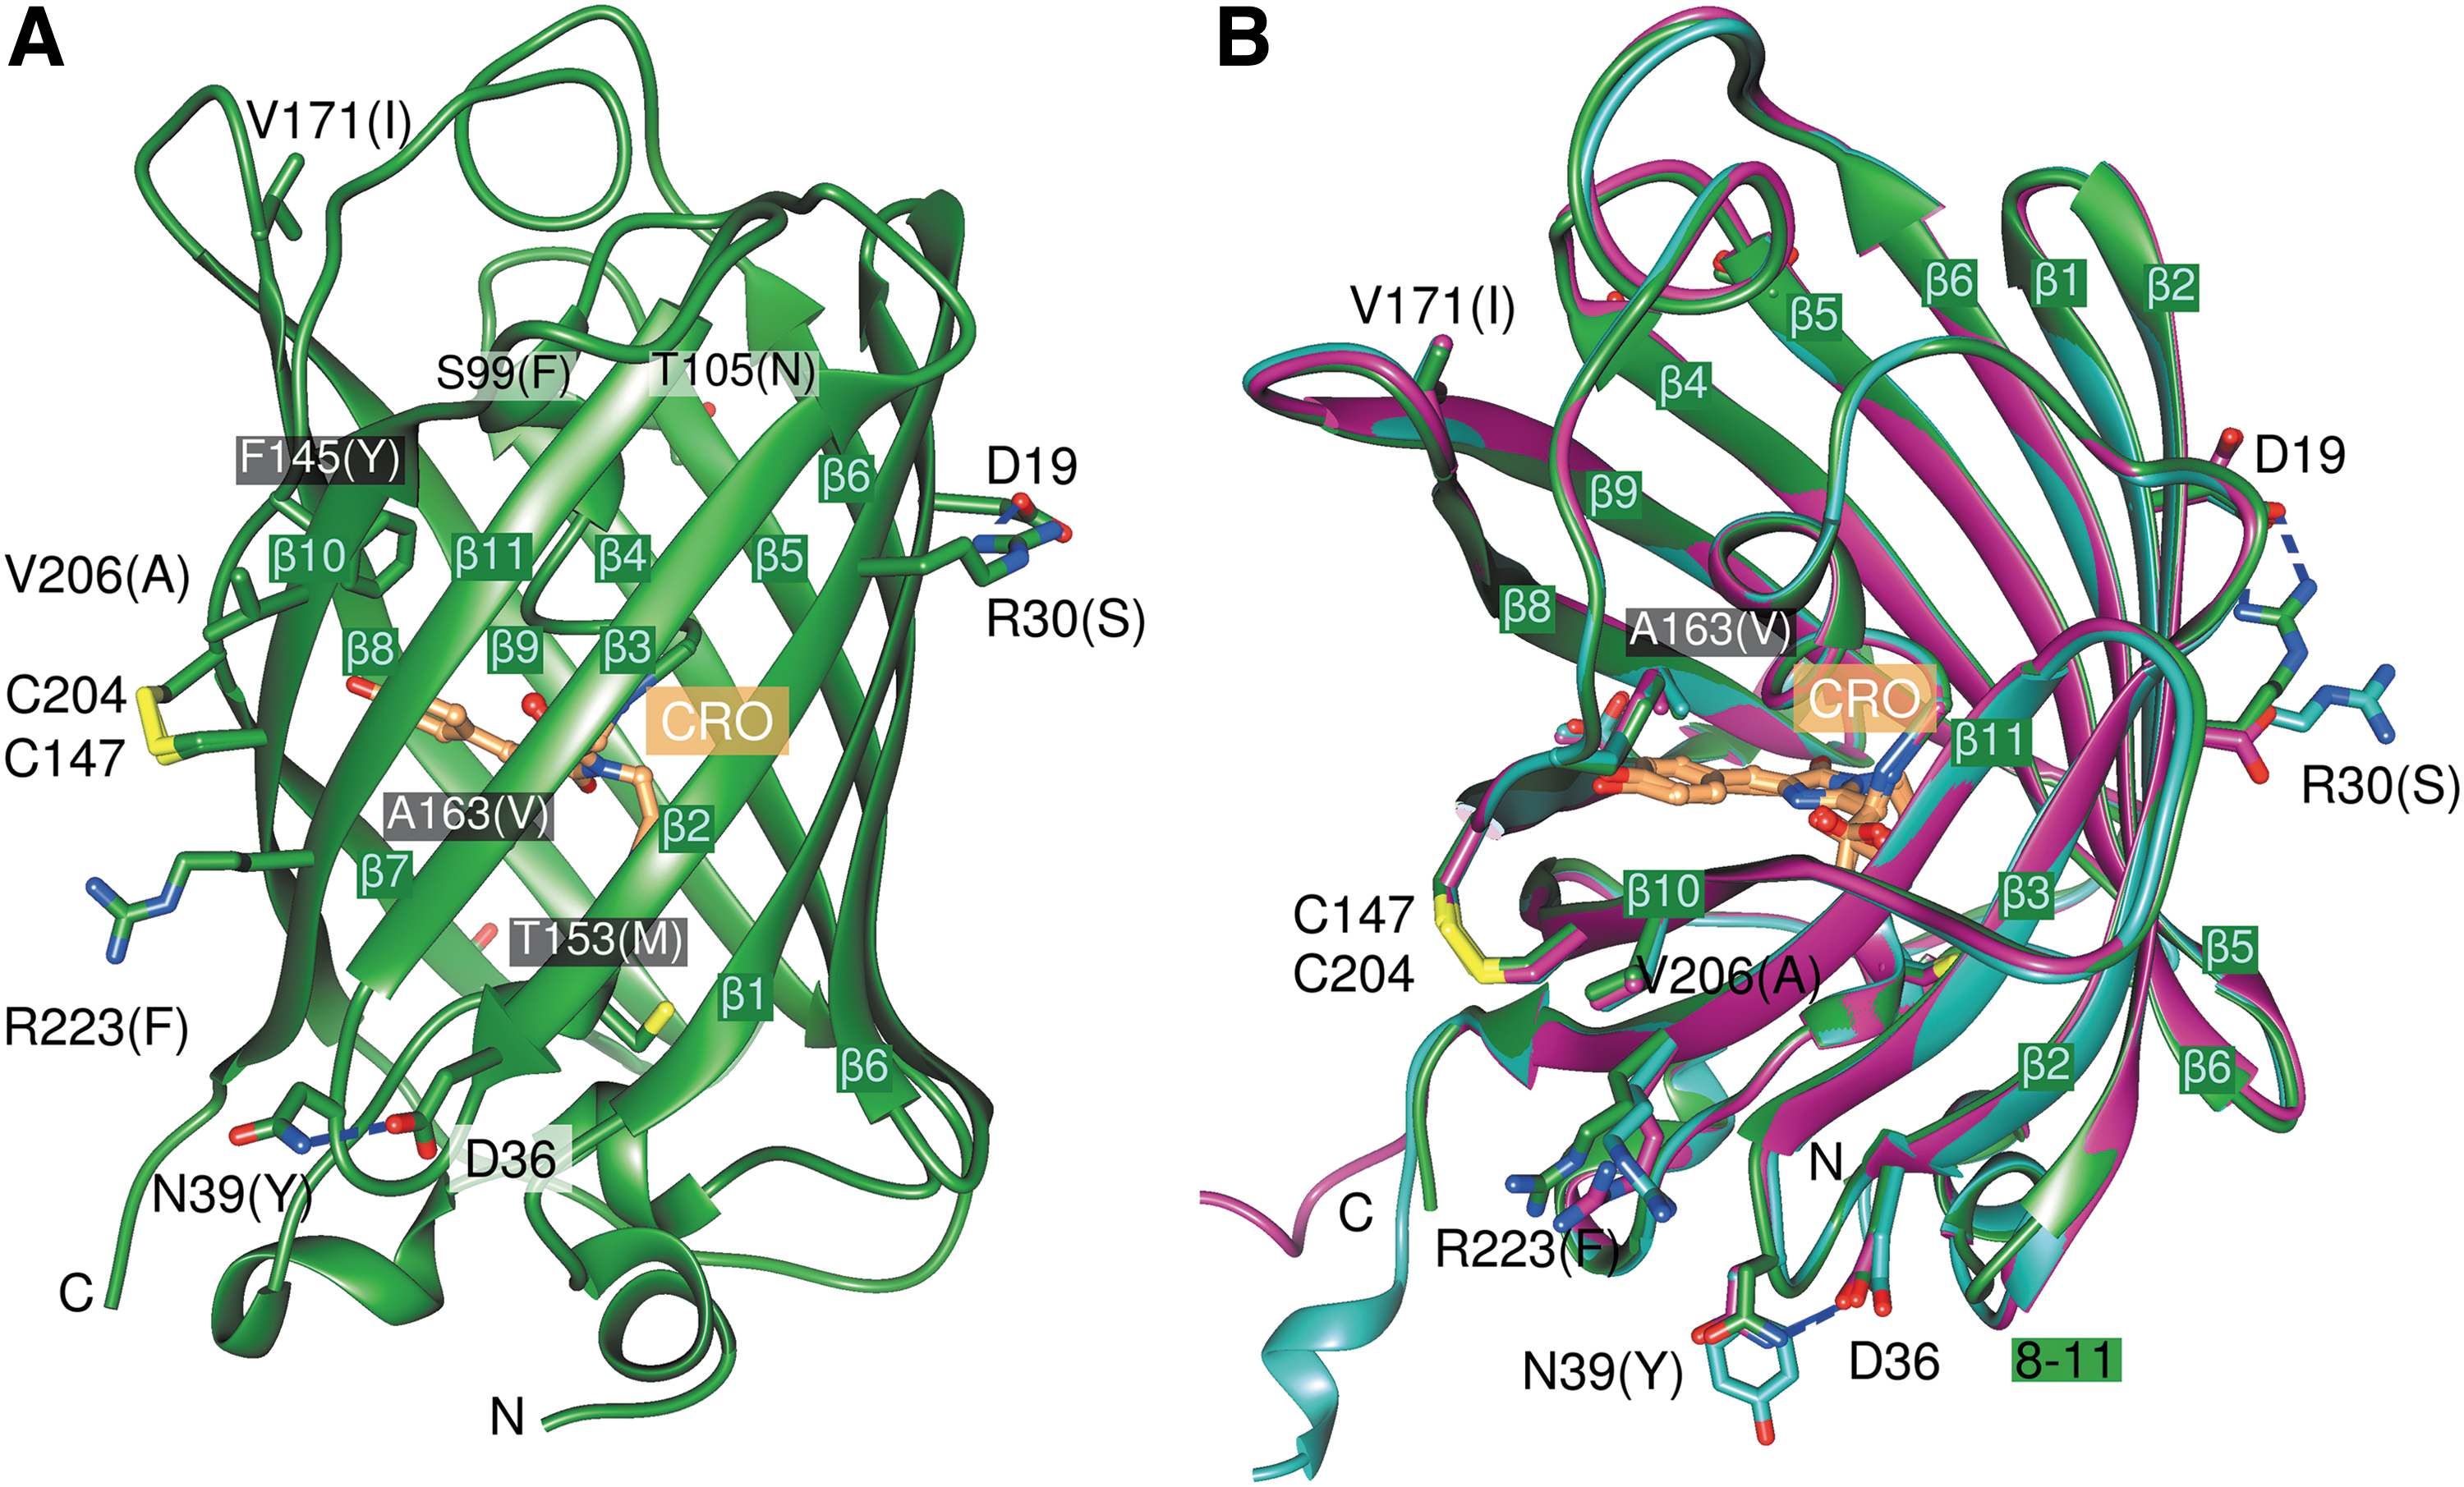
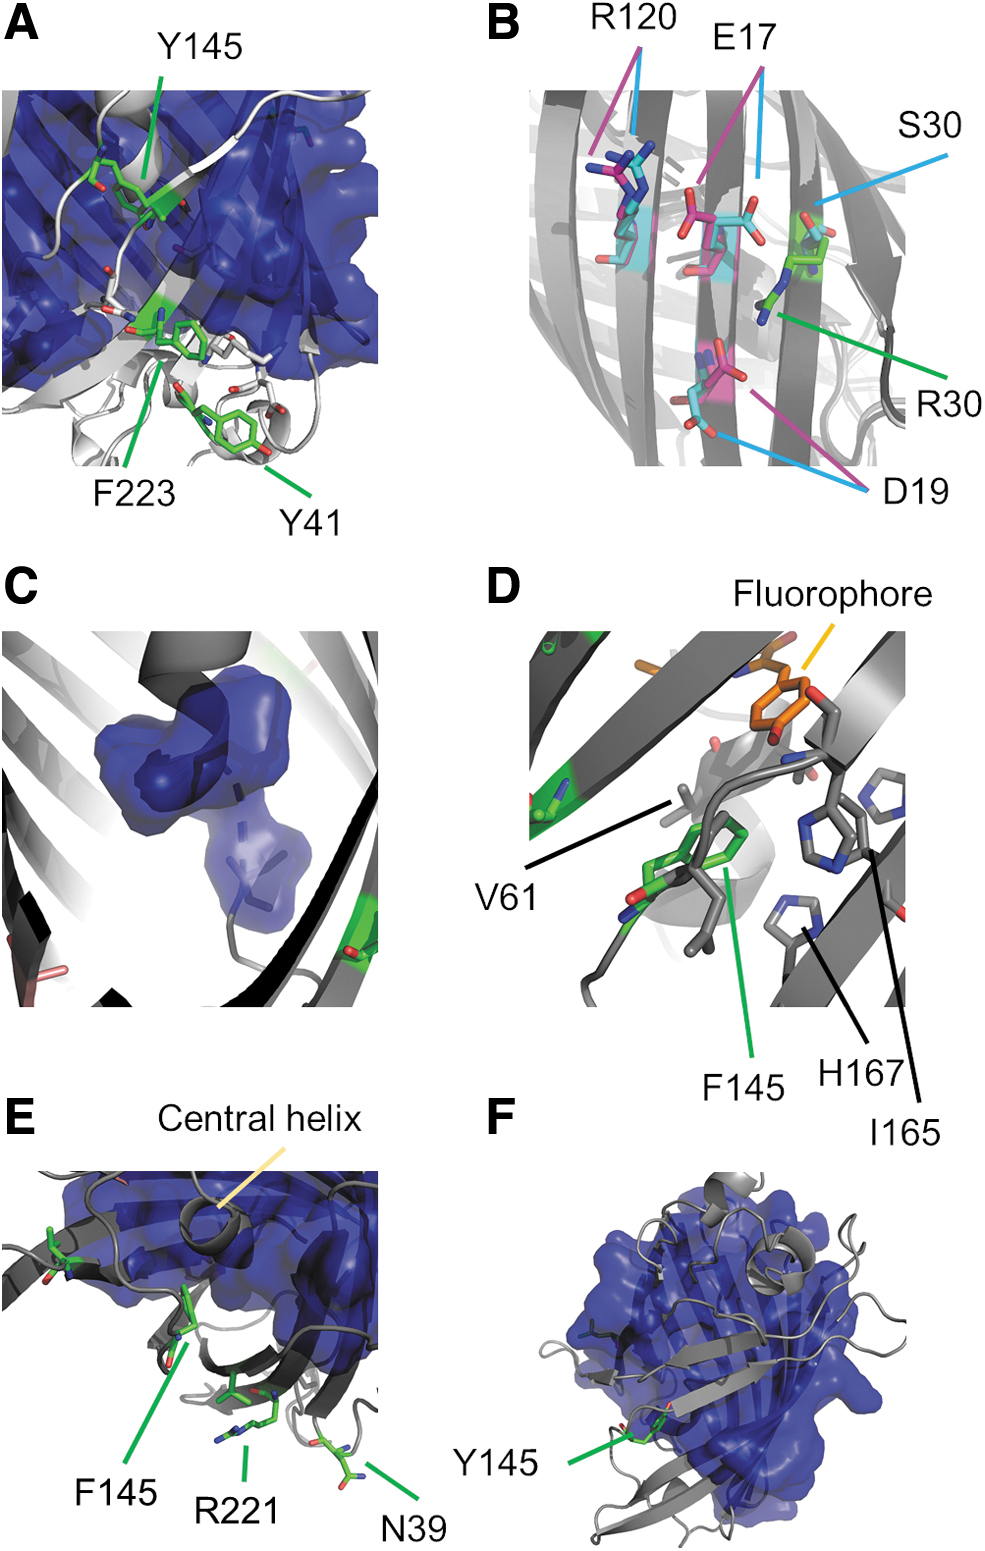
The sfroGFP2WT monomer (238 AA) adopts the canonical GFP fold, which comprises an 11-stranded β-barrel with an inner α-helix, containing the covalently bound chromophore 4-(p-hydroxybenzylidene)imidazolidine-5-one (Fig. 1A). In our structures, the two cysteines C147 and C204, which are able to respond to the ambient redox environments and fundamental for the use of roGFP variants as redox sensors, form a disulfide bridge.
All sf mutations are located on the surface of the barrel. Two of the sf mutations (S30R, Y39N) are of particular interest because they give rise to novel interactions between neighboring β-strands. In sfroGFP2WT, residues R30 and N39 form hydrogen bonds to D19 and D36, respectively (Fig. 1A); these interactions do not occur in roGFP2. For the F223R mutation, we did not expect any effect on the X-ray structure because R223 points toward the solvent phase (Fig. 1A) and is unlikely to interact with other AA. For this reason, we focused our efforts on the sfroGFP2R30S and sfroGFP2N39Y variants.
As mentioned above, the sfroGFP2WT, sfroGFP2R30S, and sfroGFP2N39Y structures contain one, two, and four monomers of sfroGFP2 in the asymmetric unit, respectively. The 7 monomers are similar, with root-mean-square deviation values of 0.3 Å to 0.8 Å with 228 Cα atoms. Differences occur at the N-terminus and in the location of a surface loop (8 –11) (Fig. 1B). However, this region is involved in monomer–monomer interactions of the mutants and seems unlikely to be relevant for the stability properties of sfroGFP2WT.
In the sfroGFP2WT structure, there is an ion pair network in the vicinity of R30 that involves four neighboring strands of the β-barrel. R30, located centrally on a β-strand (β2 Fig. 2), interacts with D19 from the adjacent strand (β1). The next strand (β6) is connected to β1 by a bond between E17 (β1) and R122 (β6). Moreover, R122 forms a salt bridge to E115 (β5). Furthermore, E111 (β5) and K113 (β5) are connected by a bond. Therefore, the strands β1, β2, β5, and β6 are connected via a network of ionic interactions.
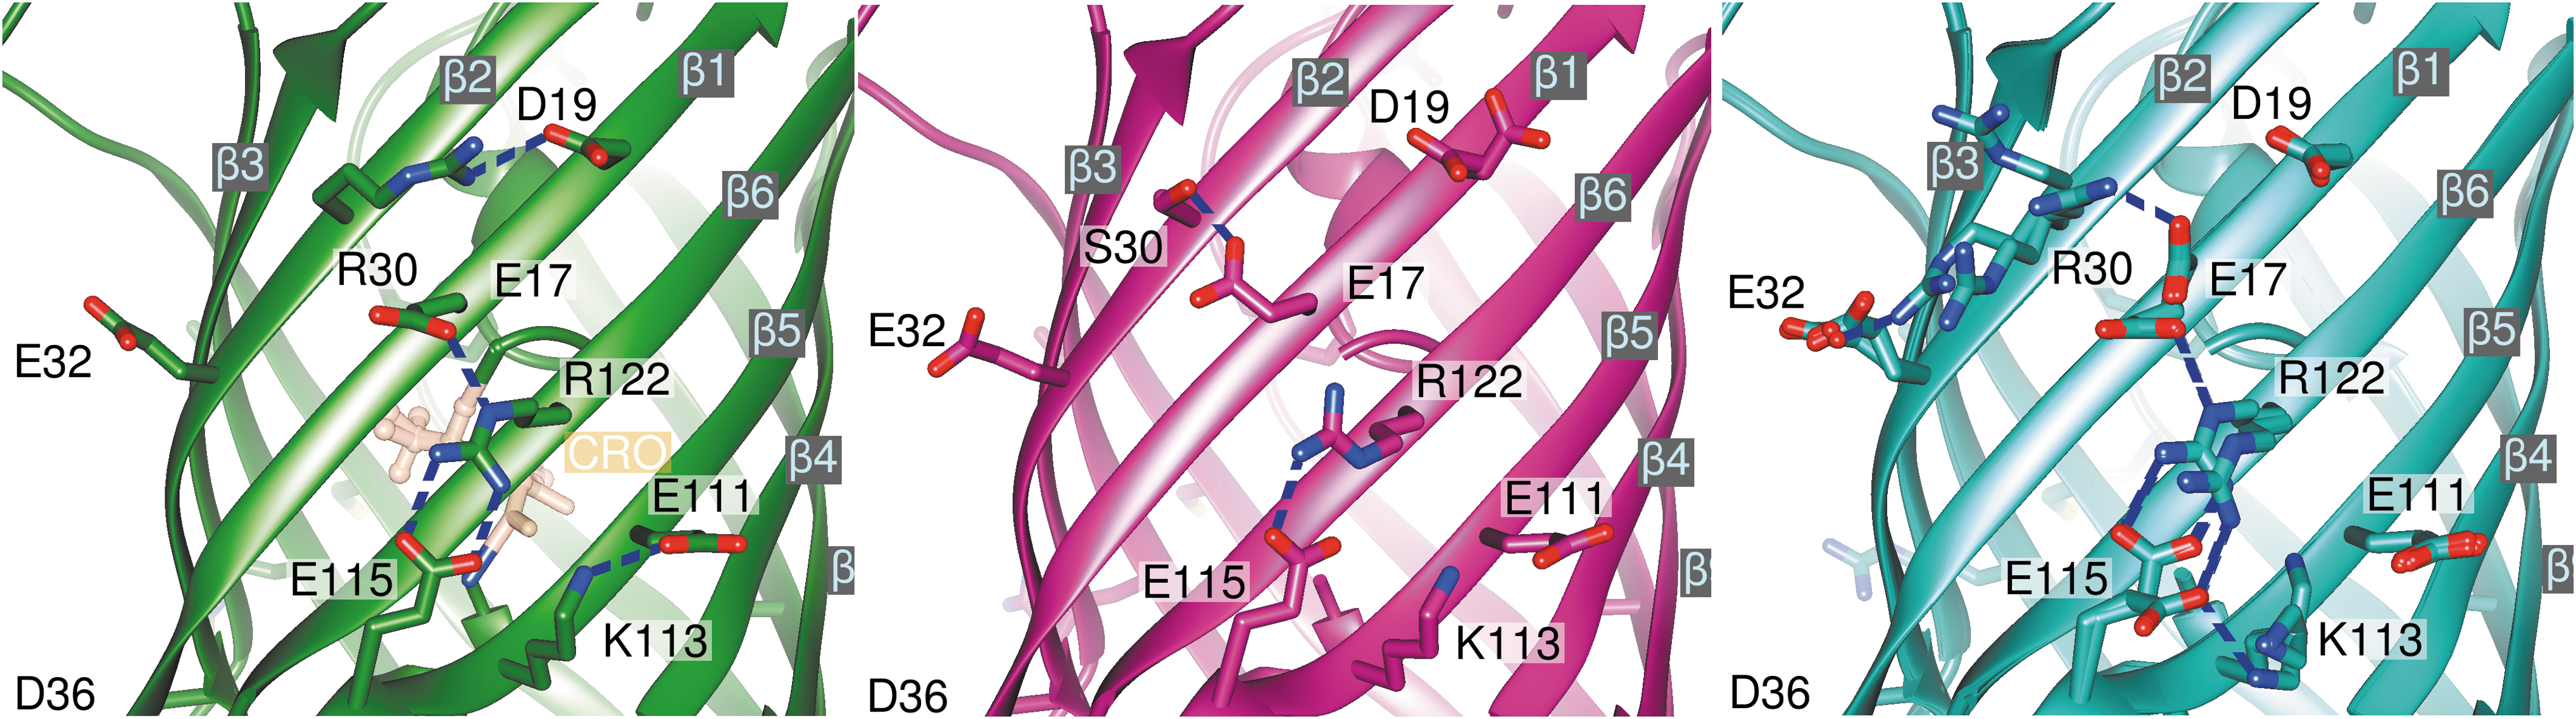
Superimposition of the four monomers from the sfroGFP2N39Y structure reveals that the side chain of R30 (β2) adopts different conformations in the subunits, thereby interacting with E32 (β2) or E17 (β1). The interaction between R122 (β6) and E115 (β5) is present in all four subunits, but only in two sfroGFP2N39Y monomers (A, B) does R122 (β6) interact with E17 (β1). K113 also adopts several conformations, but only in one subunit (D) does it interact with another residue (E115, β5) (Fig. 2).
Due to the reversed R30S (β2) mutation in sfroGFP2R30S, the much smaller side chain of S30 is not able to interact with residues D19 (β1) or E32 (β2) instead, S30 interacts with E17 (β1) through a hydrogen bond. Due to the high strength of this interaction, the E17 side chain adopts a completely different conformation from that seen in the sfroGFP2WT—or the four sfroGFP2N39Y—structures. Consequently, R122 (β6) is no longer able to connect strands β1 and β6 (Fig. 2).
In the sfroGFP2WT structure, N39 interacts with D36 through a hydrogen bond (Fig. 1A); in the sfroGFP2N39Y structure, Y39 points into the solvent (Fig. 1B). Of interest is the small apparent shift of the chromophore within the barrel by ∼0.2 Å in the sfroGFP2R30S and 0.3 Å in the sfroGFP2N39Y structures. However, since the coordinate errors are almost as large, the shift cannot be resolved with any certainty.
Larger differences are seen in the network of ionic interactions within the three variants. The most complex ion network is formed in the sfroGFP2WT, which therefore presumably contributes to a higher structural stability of the protein.
Rigidity analysis
To obtain structural stability information as a direct link to the functional properties of the protein, we next used the X-ray crystal structure of sfroGFP2WT as a template to perform rigidity analysis. We inserted the relevant substitutions to create structural models of GFP (GFPsfroGFP2) and roGFP2 (roGFP2sfroGFP2) to explore differences in stability between these variants. Furthermore, the structural models R30SsfroGFP2, N39YsfroGFP2, and R223FsfroGFP2 were generated based on the sfroGFP2WT template to investigate residue-specific effects.
We hypothesized that the higher FI of sfroGFP2WT in an in cellulo environment is associated with the higher structural stability of sfroGPF2WT compared with GFP. To test this hypothesis, we analyzed the different structures with respect to their mechanical stability. We applied principles from rigidity theory. Details about these computations are provided in the Supplementary Methods section.
The computations predict that the major phase transition of sfroGFP2WT (Ecut = −4.01 kcal mol−1) occurs at an energy Ecut 0.13 kcal mol−1 lower than that of GFPsfroGFP2 (Ecut = −3.88 kcal mol−1) (Supplementary Fig. S1 and Table 2; p = 0.13; two-sided t-test, n = 5), with both variants showing one major phase transition (Supplementary Fig. S2A, C). The result clearly indicates a higher structural stability of sfroGFP2WT than GFP.
Energies of Major Phase Transitions of the Investigated Variants
Values are averaged over all snapshots of N = 5 replicas with N = 5000 snapshots each.
In kcal mol−1.
Standard error of the mean across five replicas.
To obtain insights at the local, residue-wise level, the averaged constraint dilution trajectory of GFPsfroGFP2 (Fig. 3A) was visually inspected, revealing that—except for residue 30—all residues that are exchanged via sf mutations in sfroGFP2WT segregate from the giant rigid cluster right before the major phase transition (Fig. 4A). Hence, these residues are structural weak spots that, when appropriately substituted, should increase the structural stability by shifting the phase transition to lower Ecut values. Indeed, in sfroGFP2WT, the substituted residues segregate at a later point in the constraint dilution trajectory (Fig. 3B).
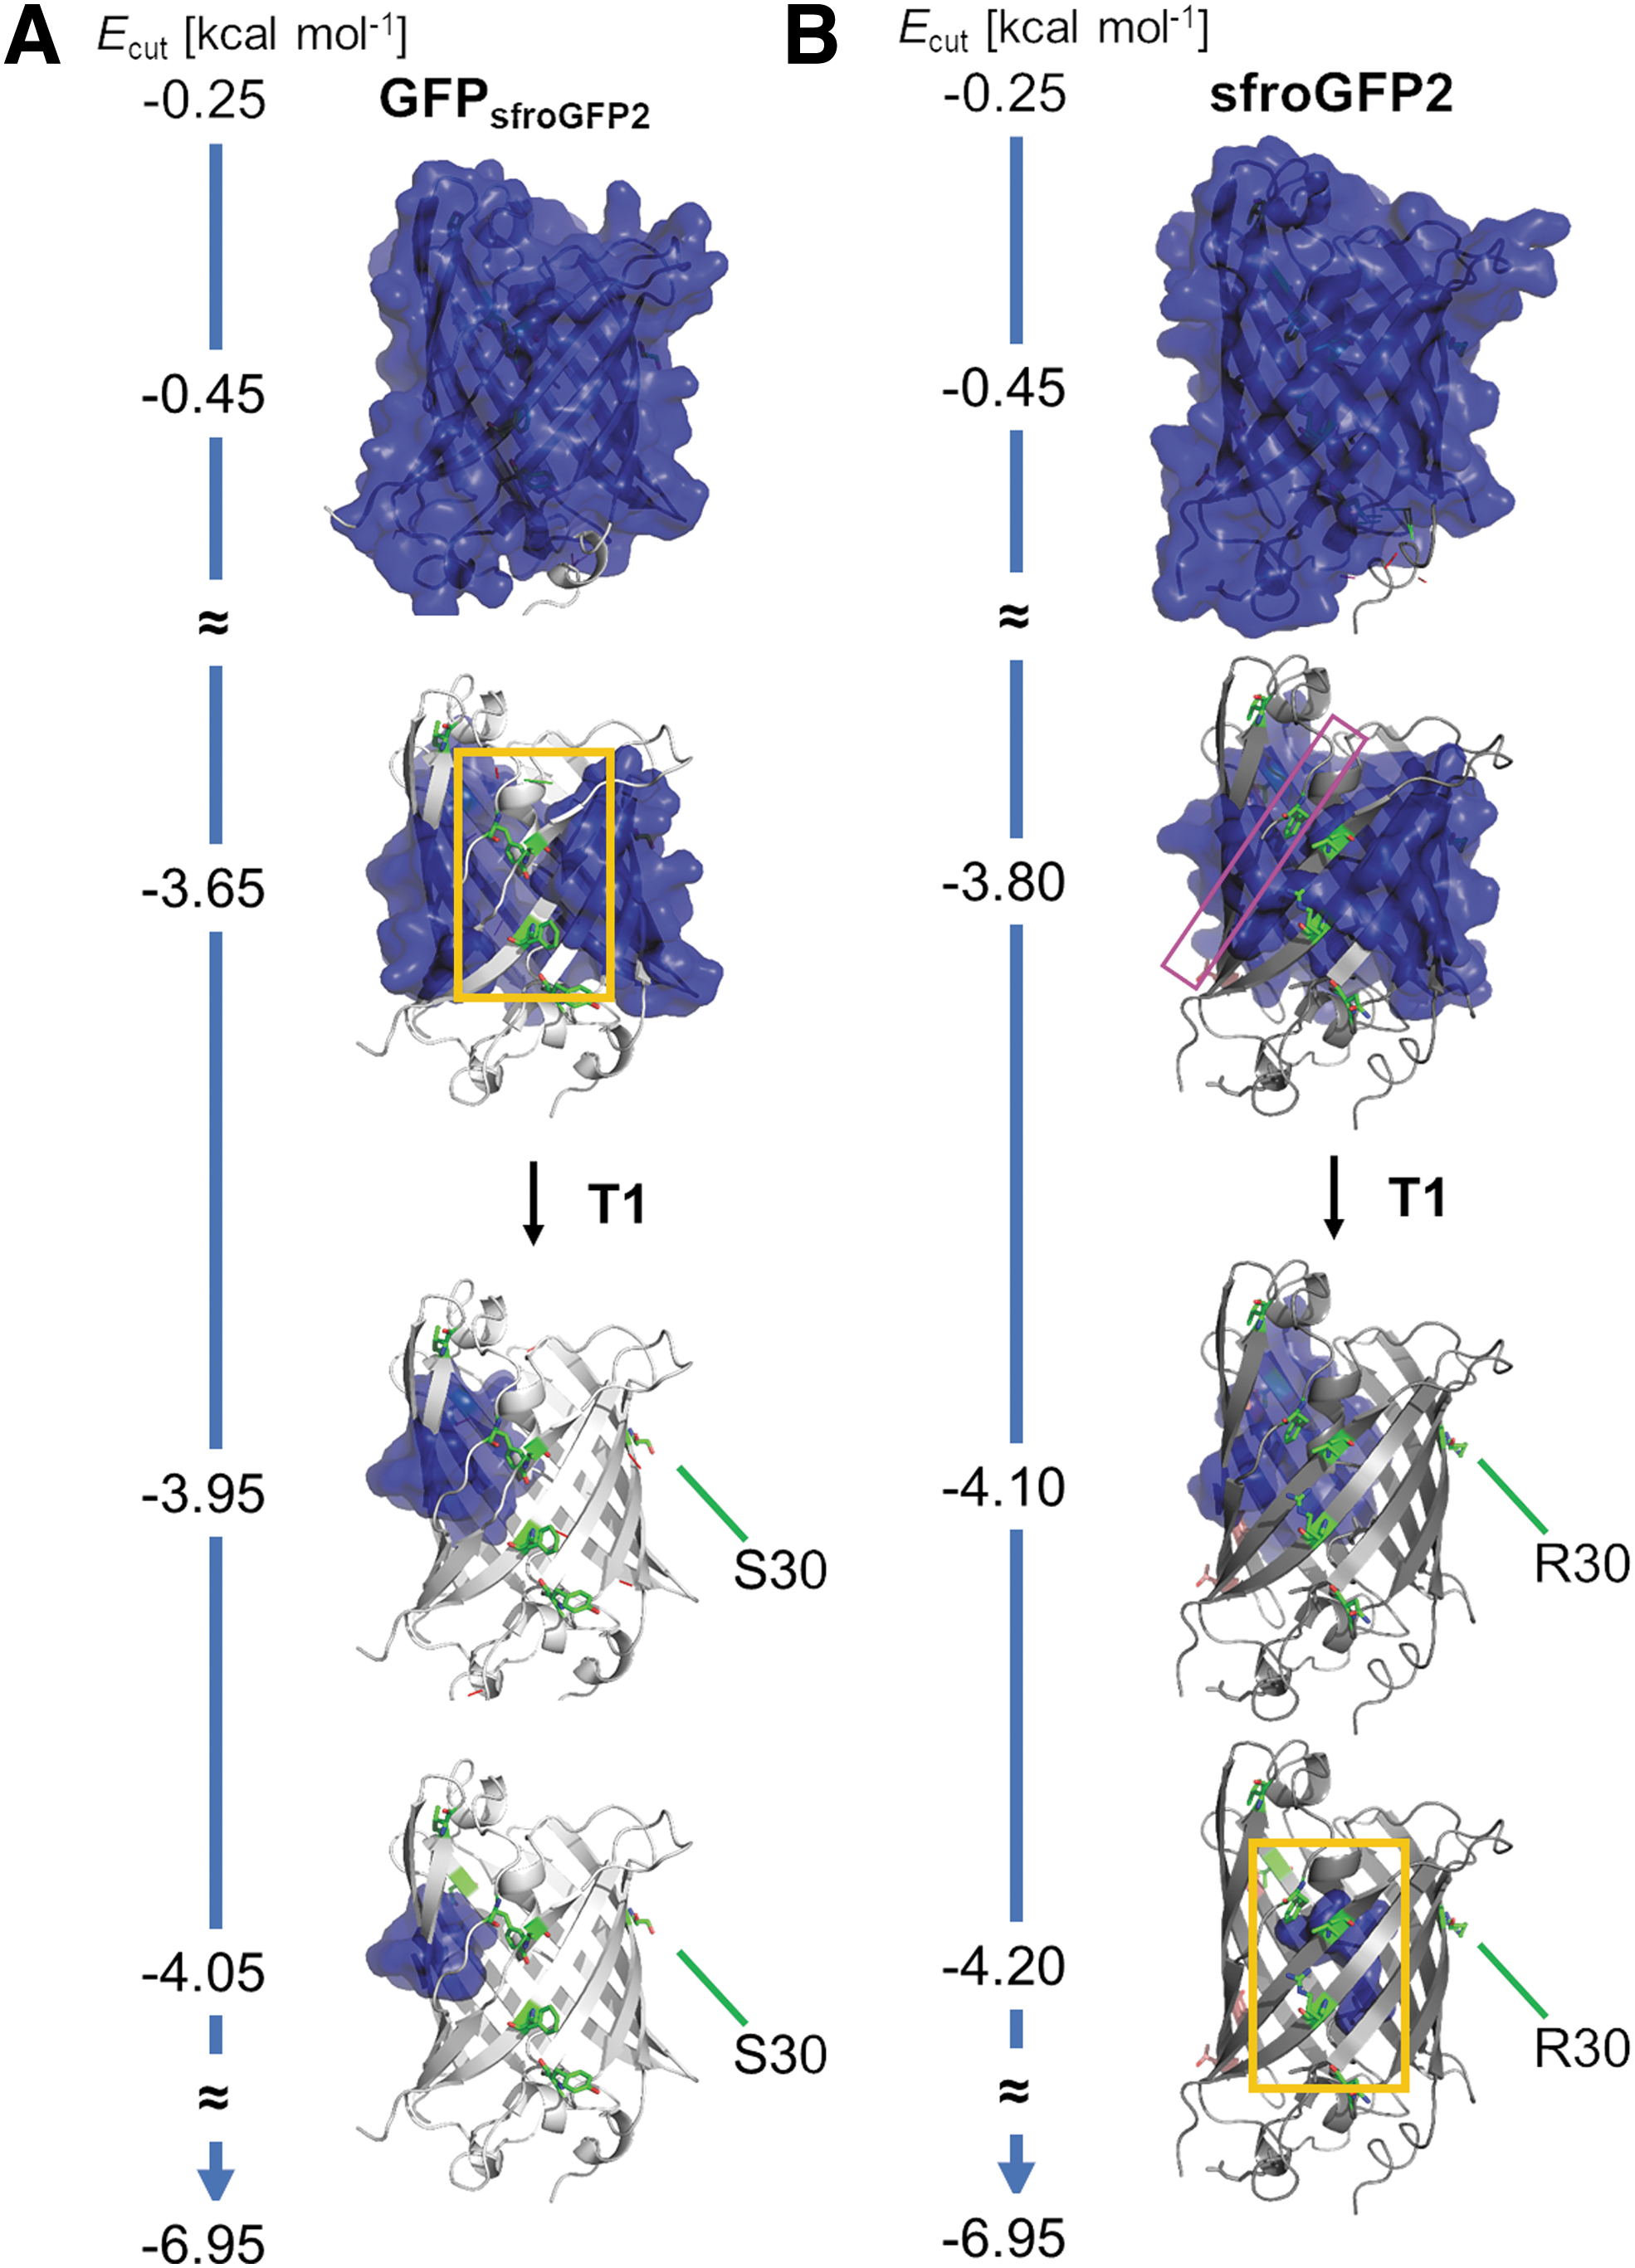
The sf mutation S30R in sfroGFP2WT, which forms a hydrogen bond with D19 in the neighboring β-strand, segregates from the largest rigid cluster during the major phase transition (Fig. 4B). Hence, this interaction is particularly important for the structural integrity of sfroGFP2WT. The importance of R30 in sfroGFP2WT is corroborated, in that the phase transition of R30SsfroGFP2 is at an Ecut value 0.11 kcal mol−1 higher than that of sfroGFP2WT (Supplementary Fig. S1 and Table 2, p = 0.10) and on a par with that of GFP (Supplementary Fig. S1 and Table 2). Accordingly, reversing this substitution abolishes most of the gain in the structural stability of sfroGFP2WT over GFP. The particular effect of residue 30 is dependent on the residue composition of sfroGFP2WT, however (Fig. 4B). roGFP2sfroGFP2, which contains S30 from GFP and none of the other sf mutations, is yet similarly resistant to oxidation-like sfroGFP2WT, the major phase transition occurs at almost the same Ecut as in sfroGFP2WT (Supplementary Fig. S1 and Table 2).
Apparently, the roGFP2 mutations have a different long-range effect based on the changing interactions of the residues in the presence or absence of the sf mutations. In turn, the interactions formed by the sf mutations in sfroGFP2WT alter the constraint network due to interaction partners changing conformation to accommodate the mutations (Fig. 4B). By contrast, N39YsfroGFP2 and R223FsfroGFP2 behave similarly to sfroGFP2WT (Supplementary Fig. S1 and Table 2).
The rigidity percolation behavior of protein networks is usually complex, and multiple phase transitions can be observed (44, 55). In line with this, besides a shift of the major phase transition point, substitutions in sfroGFP2WT impact later transitions in the constraint dilution trajectory. In GFPsfroGFP2, the last rigid part of the protein is part of the β-barrel and comprises residues T95–F97, F163, K164, and D178–Y180 (Fig. 3A); by contrast, in sfroGFP2WT, the last rigid part of the protein is the fluorophore (Fig. 4C).
These analyses of structural stability reveal a later rigid-to-flexible phase transition during constraint dilution simulations in sfroGFP2WT than in GFP, pinpoint the particular role of the S30R substitution, and suggest that sf mutations increase not only the structural stability of the β-barrel but also of the fluorophore region. To examine the effects of the sf mutations on the biosensors’ properties, we performed functional characterization.
Functional properties
Spectral excitation scans were recorded using recombinant sfroGFP2WT, the three reverse mutants sfroGFP2R30S, sfroGFP2N39Y, and sfroGFP2R223F, as well as roGFP2, which served as a reference (Fig. 5A). Fluorescence spectra of roGFP2 (Fig. 5A) were consistent with previously published spectral scans (18, 65). As shown in Figure 5A, the different sf mutations did not affect the dual excitation behavior. For oxidized protein, excitation peaks at 405 and 485 nm are seen. However, the excitation peak at 485 nm is stronger for reduced protein. Therefore, the commonly used excitation maxima for roGFP-based redox measurements can be used identically for sfroGFP2WT- and sfroGFP2-based redox biosensors. Furthermore, the emission scans for all investigated biosensors showed the same emission pattern with maxima at 510 nm (data not shown). These results confirm that the sf mutations do not affect the excitation and emission pattern of the sensors.
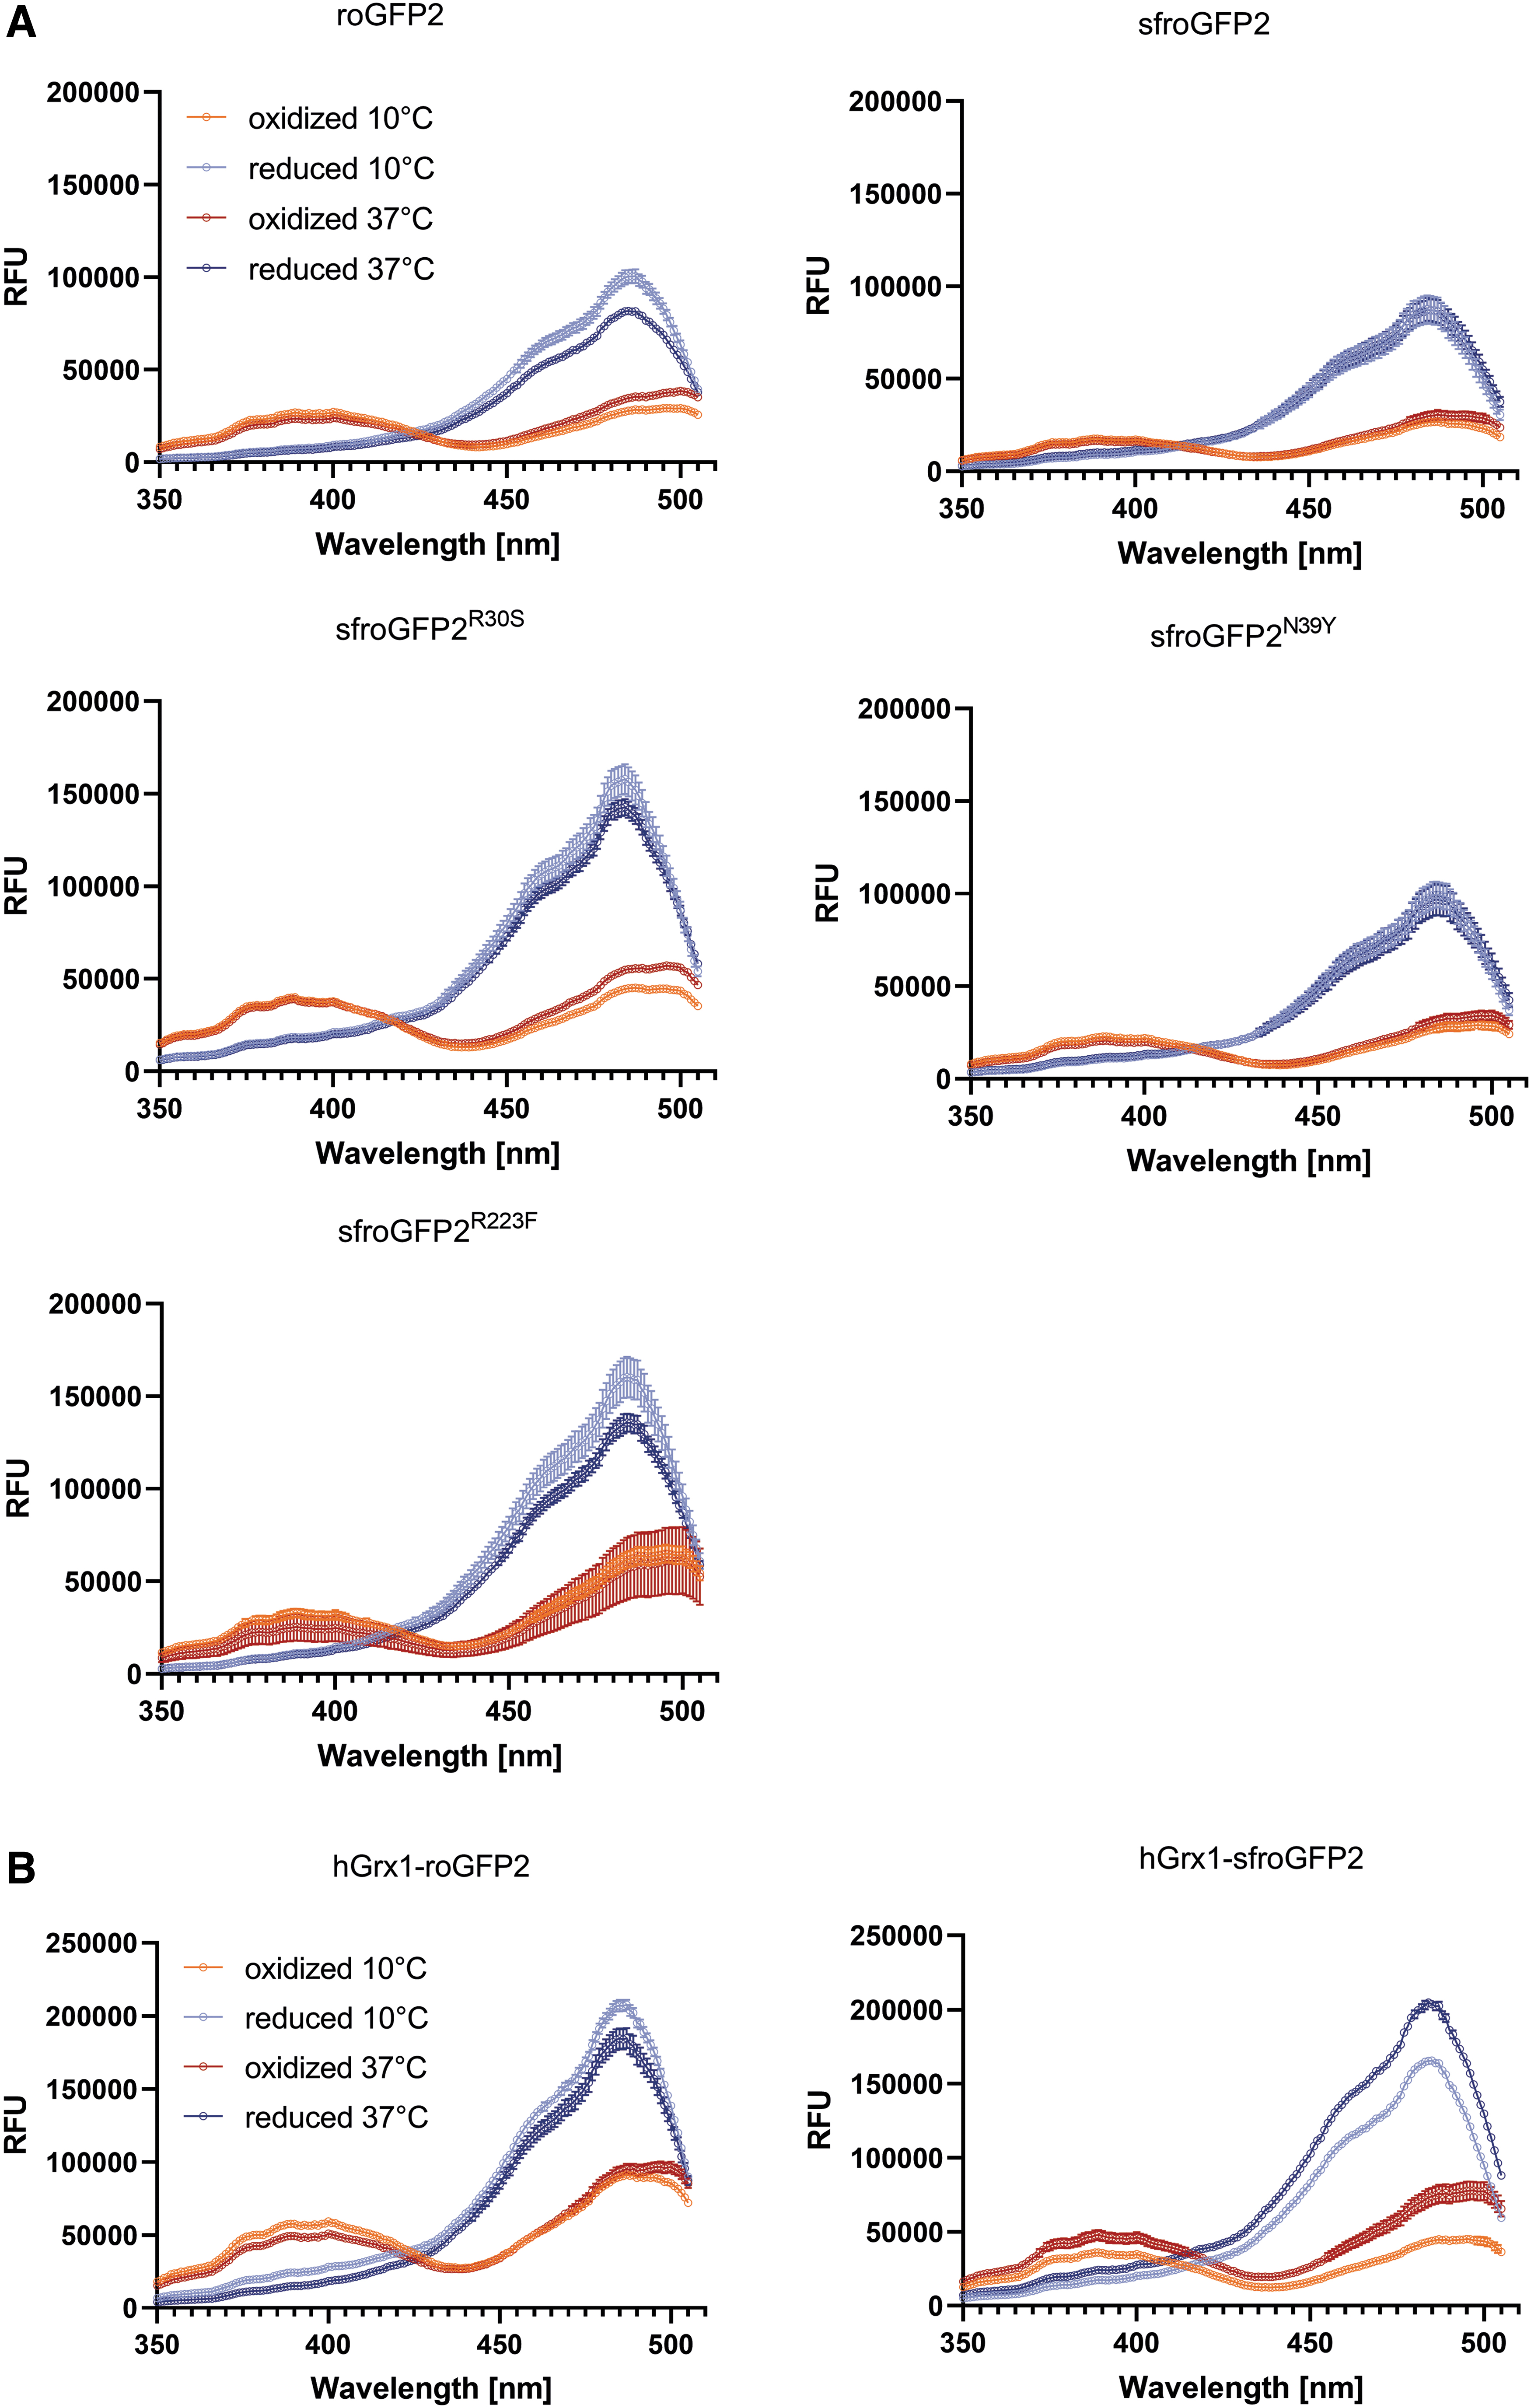
In vitro spectral excitation scans using standard potassium phosphate buffer show slightly more intense FI for roGFP2 (FIox405 = 25,000 RFU; FIred485 = 100,000 RFU) than for sfroGFP2WT (FIox405 = 16,000 RFU; FIred485 = 87,000 RFU) (Fig. 4A, light red and light blue spectra). Moreover, the FI of emission at 510 nm after excitation at 405 and 485 nm was slightly stronger for roGFP2 than for sfroGFP2WT (roGFP2: FI510ox = 17,000 RFU, FI510red = 22,000 RFU; sfroGFP2WT FI510ox = 11,000 RFU, FI510red = 19,000 RFU).
Spectral excitation and emission scans of the reverse mutants sfroGFP2R30S, sfroGFP2N39Y, and sfroGFP2R223F showed the same overall pattern as sfroGFP2WT. All sfroGFP2 variants showed higher FI than sfroGFP2WT in vitro for both excitation wavelengths, as well as for emission at 510 nm after excitation at 405 nm and 485 nm. In addition, sfroGFP2R30S and sfroGFP2R223F showed higher FI than roGFP2 (Fig. 5A).
Furthermore, spectral scans were recorded at physiological temperature (37°C) to mimic the conditions for in cellulo measurements in P. falciparum, where structural stability may be particularly relevant to withstand increased thermal challenge (Fig. 5A, dark red and dark blue spectra). With higher temperatures, the FI of roGFP2 and sfroGFP2WT decreased. However, the reduction in FI was not as pronounced for sfroGFP2WT as for roGFP2. Changes in FI of sfroGFP2R30S, sfroGFP2N39Y, and sfroGFP2R223F were in a comparable range. The sharpest decline in FI405ox was seen for sfroGFP2R223F. The strongest decrease in FI485red, was seen for sfroGFP2R30S.
Following the rationale of proximity-based redox sensor specificity introduced by Gutscher et al., sfroGFP2WT was fused to hGrx1 to generate a proximity-based sensor that allows specific and fast equilibration between sfroGFP2WT and the glutathione redox couple (17). The fusion sensor hGrx1-sfroGFP2 was characterized in comparison with hGrx1-roGFP2. Spectral excitation and emission scans with recombinant biosensors were recorded at 10°C (Fig. 5B, light red and light blue spectra). Here, hGrx1-roGFP2 showed higher FI than hGrx1-sfroGFP2. In addition, spectral scans were performed at physiological temperature (37°C) (Fig. 5B, dark red and dark blue spectra). Here, the FI of hGrx1-roGFP2 decreased, whereas it increased for hGrx1-sfroGFP2. In general, FI were higher for both hGrx1-fusion sensors; that is, roGFP2 and sfroGFP2WT.
To study the spectral response of the sensor variants to oxidation and reduction, as well as the reversibility of the reaction, ratio changes with recombinant roGFP2, hGrx1-roGFP2, sfroGFP2WT, and hGrx1-sfroGFP2 were measured. As shown in Supplementary Figure S3, all biosensors responded rapidly to oxidation with diamide (DIA). The ratio of the fully oxidized biosensors was stable but could be fully reversed via reduction with dithiothreitol. No difference in the responsiveness to oxidizing and reducing agents was identified between the individual biosensor variants tested.
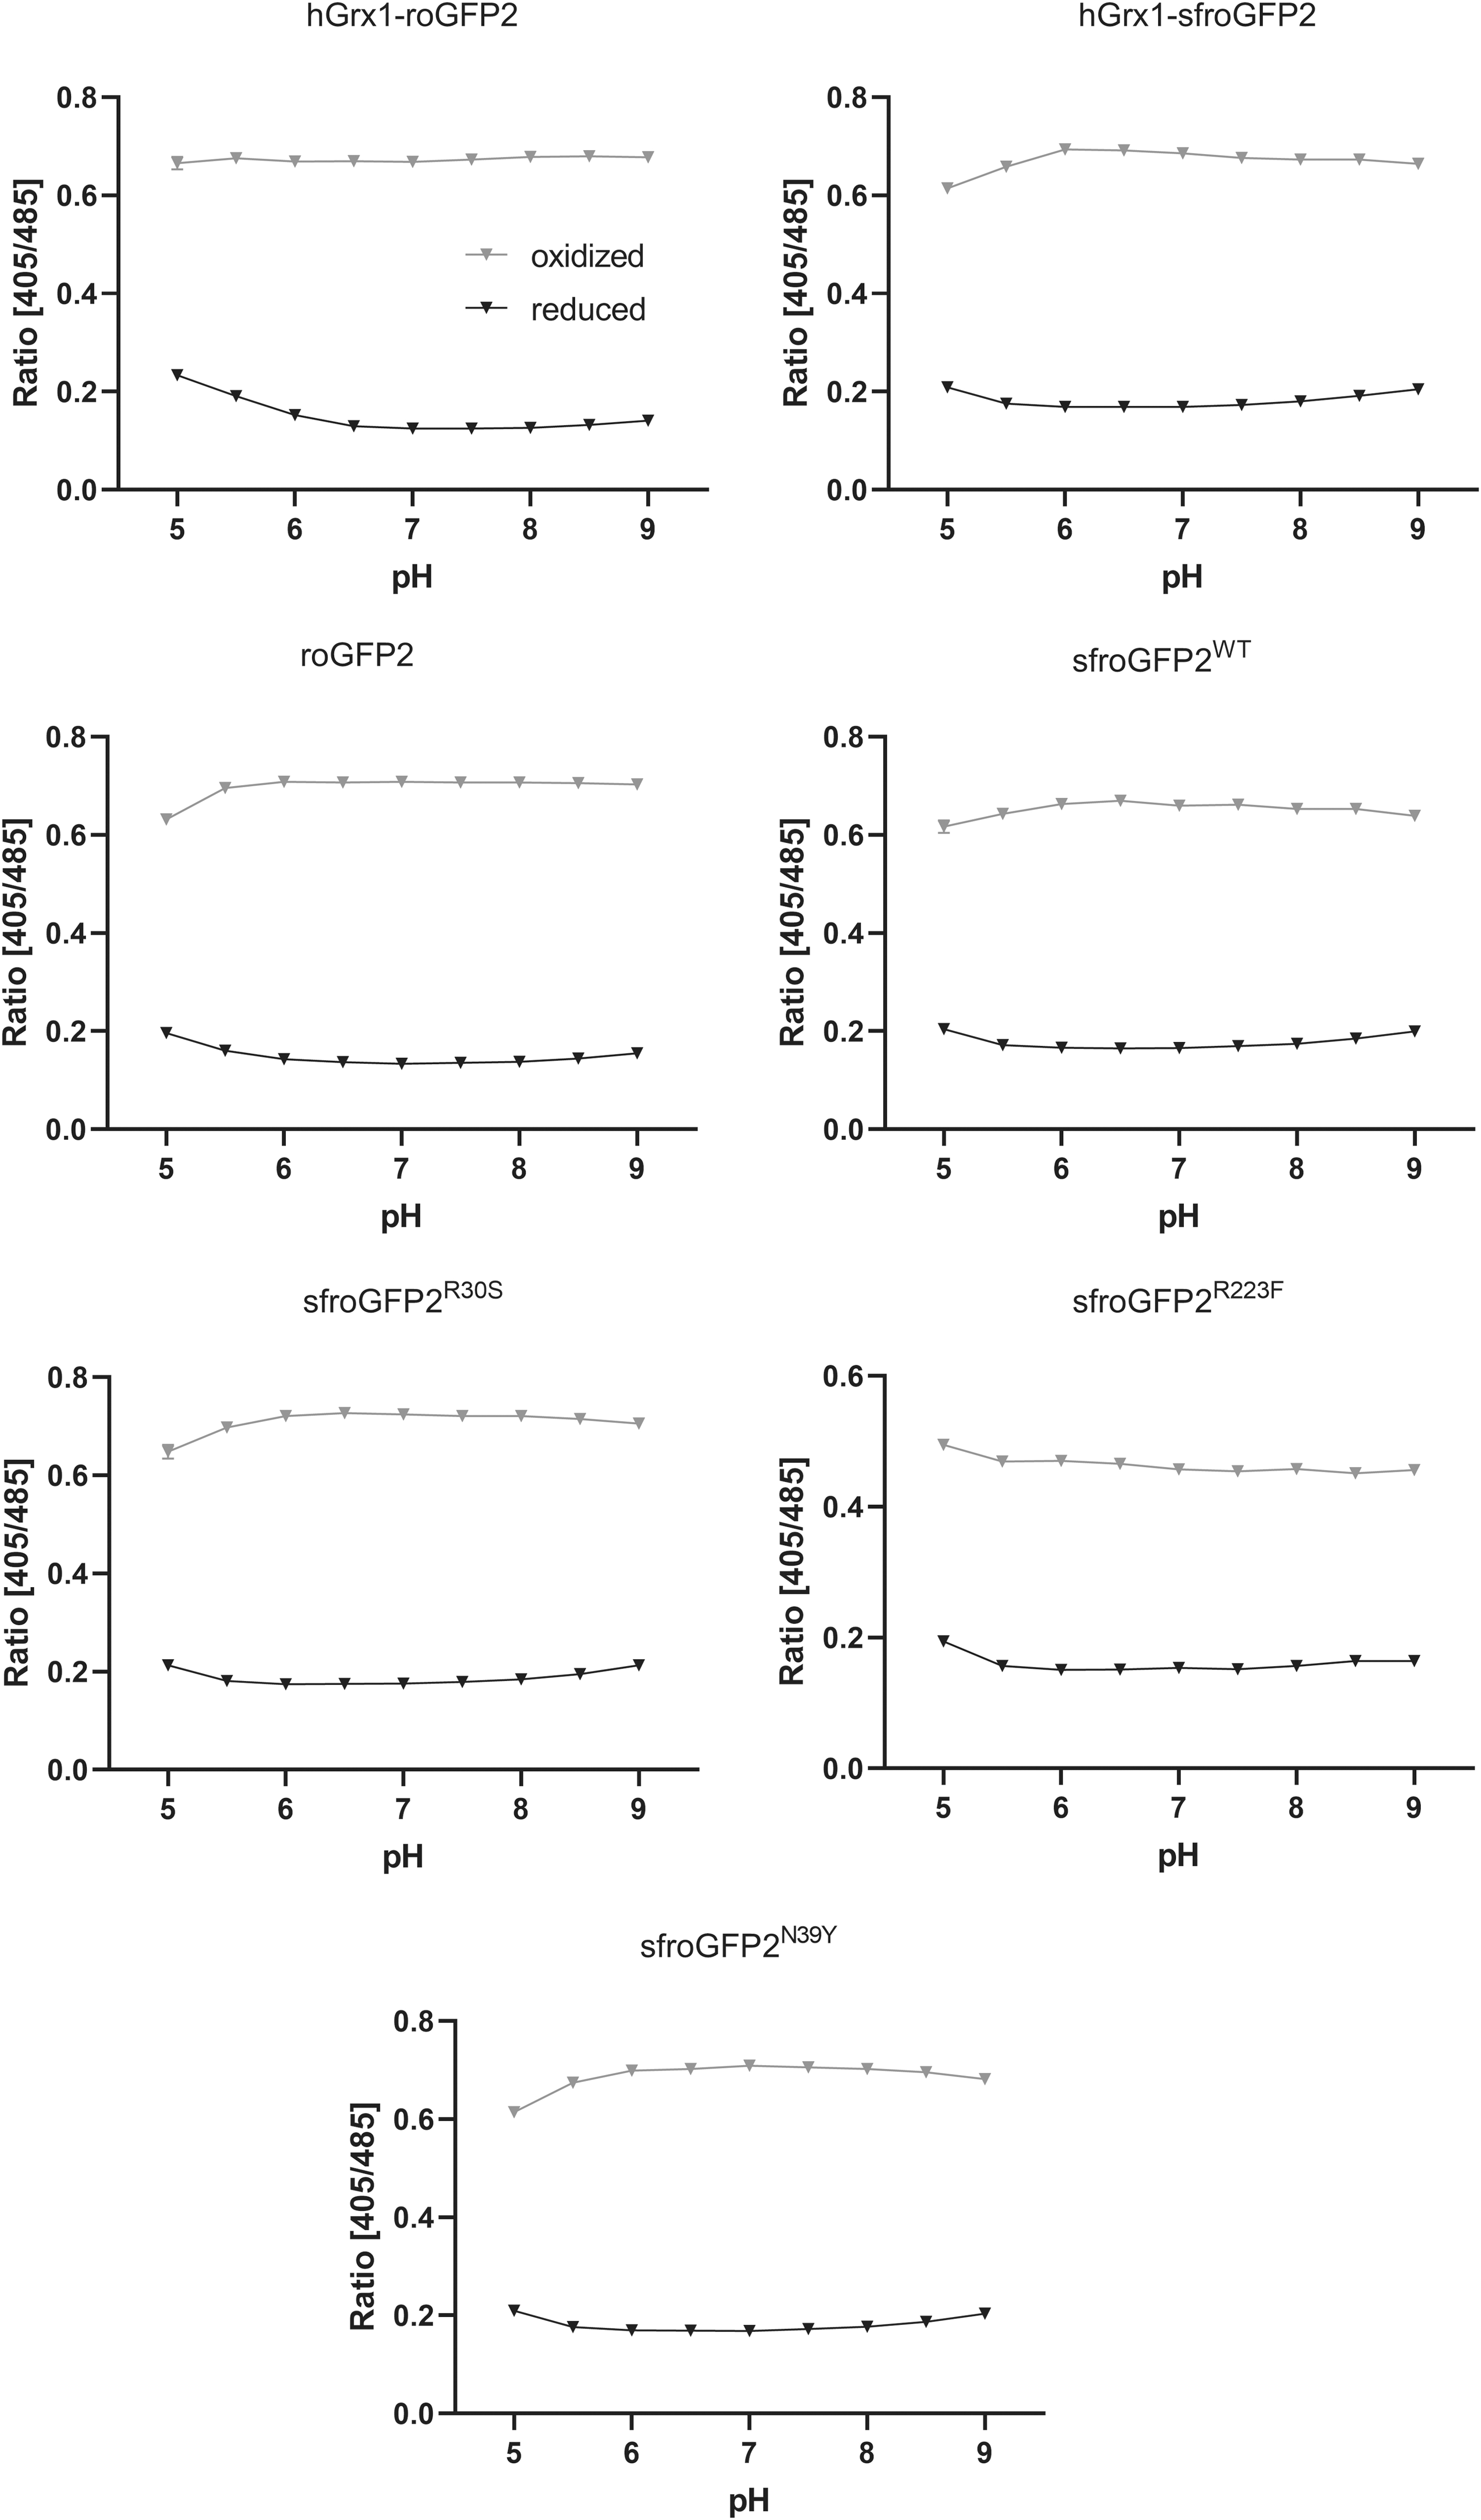
We examined the pH responsiveness for all redox biosensors. These responses were monitored over a pH range from 5.0 to 9.0 to cover physiologically meaningful conditions. The ratios of all biosensors were unaffected by pH across the range from 6.0 to 8.0; only a minor impact started to become apparent at acidic pH values <6.0 (Fig. 6). These data confirm that pH insensitivity, as a major advantage of roGFP-based redox sensors, is retained in the sensor variants.
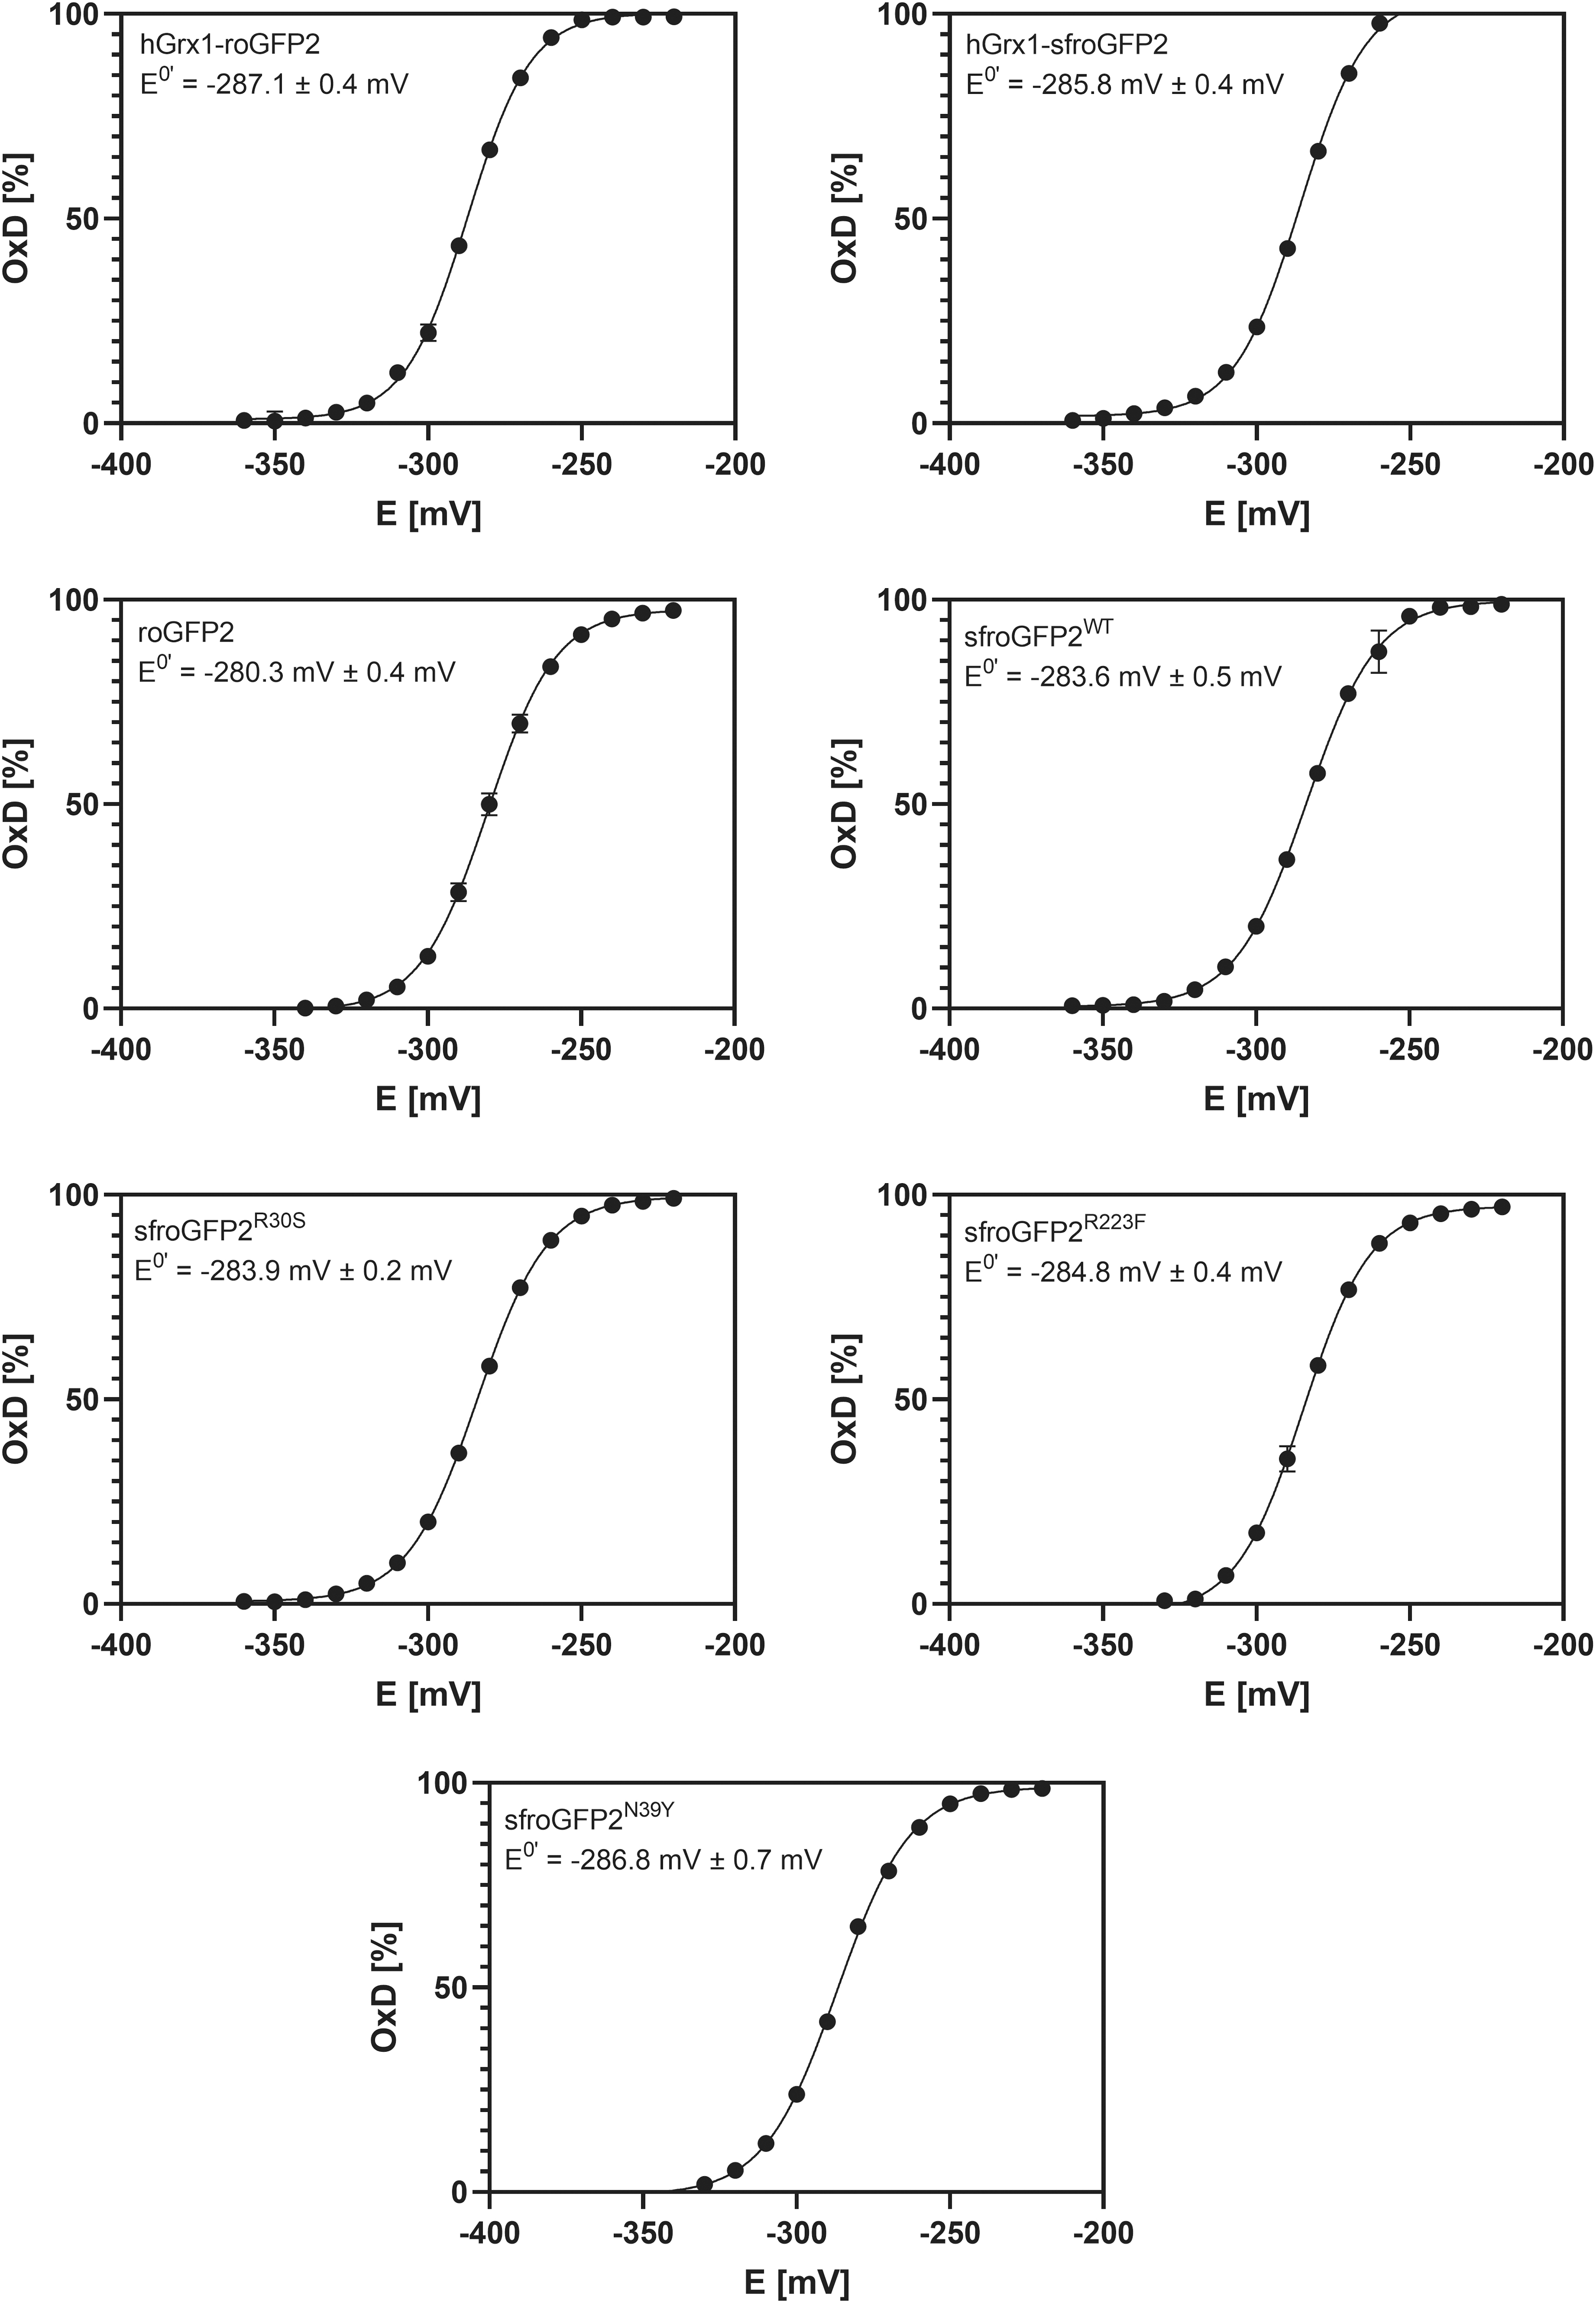
Redox titrations were performed for all redox biosensors, using the dithiothreitol (DTT)/dithian system, to determine the midpoint potentials (Fig. 7). Midpoint potentials for roGFP2 have been empirically determined and vary somewhat depending on the specific protocol used (−272 mV vs. −284 mV). Therefore, a consensus midpoint potential of roGFP2 was defined at −280 mV (12, 18, 39). Our results are in accordance with this as the midpoint potential of roGFP2 within our measurements was −280.3 ± 0.4 mV. Moreover, we found that the different sf mutations did not change the midpoint potential of the sensor to any major extent as the midpoint potential of sfroGFP2WT is −283.6 ± 0.5 mV. The midpoint potentials of hGrx1 fusion and the other sensor variants are also largely retained, and are only slightly more negative; with −287.1 ± 0.4 mV for hGrx1-roGFP2, −285.8 ± 0.4 mV for hGrx1-sfroGFP2, −283.9 ± 0.2 mV for sfroGFP2R30S, −286.8 ± 0.7 mV for sfroGFP2N39Y, and −284.8 ± 0.4 mV for sfroGFP2R223F.
In cellulo use of redox biosensors
SfroGFP2WT was stably integrated into the genome of NF54attB Plasmodium falciparum clone (P. falciparum) through integrase-mediated homologous recombination between the parasite's attB site and the plasmid's attP site (43) as previously described by Schuh et al. (64). Spectral excitation scans of NF54attB sfroGFP2 showed normal roGFP2 behavior with strong FI and an improved signal-to-noise ratio (Supplementary Fig. S4). These results are in agreement with earlier published data (64). Furthermore, we stably integrated the fusion sensor hGrx1-sfroGFP2 into the genome of NF54attB P. falciparum parasites because it was shown that the equilibration between sfroGFP2 with the glutathione couple is faster in different cellular contexts, and the kinetics is standardized when the sensor is fused to glutaredoxin (17, 64).
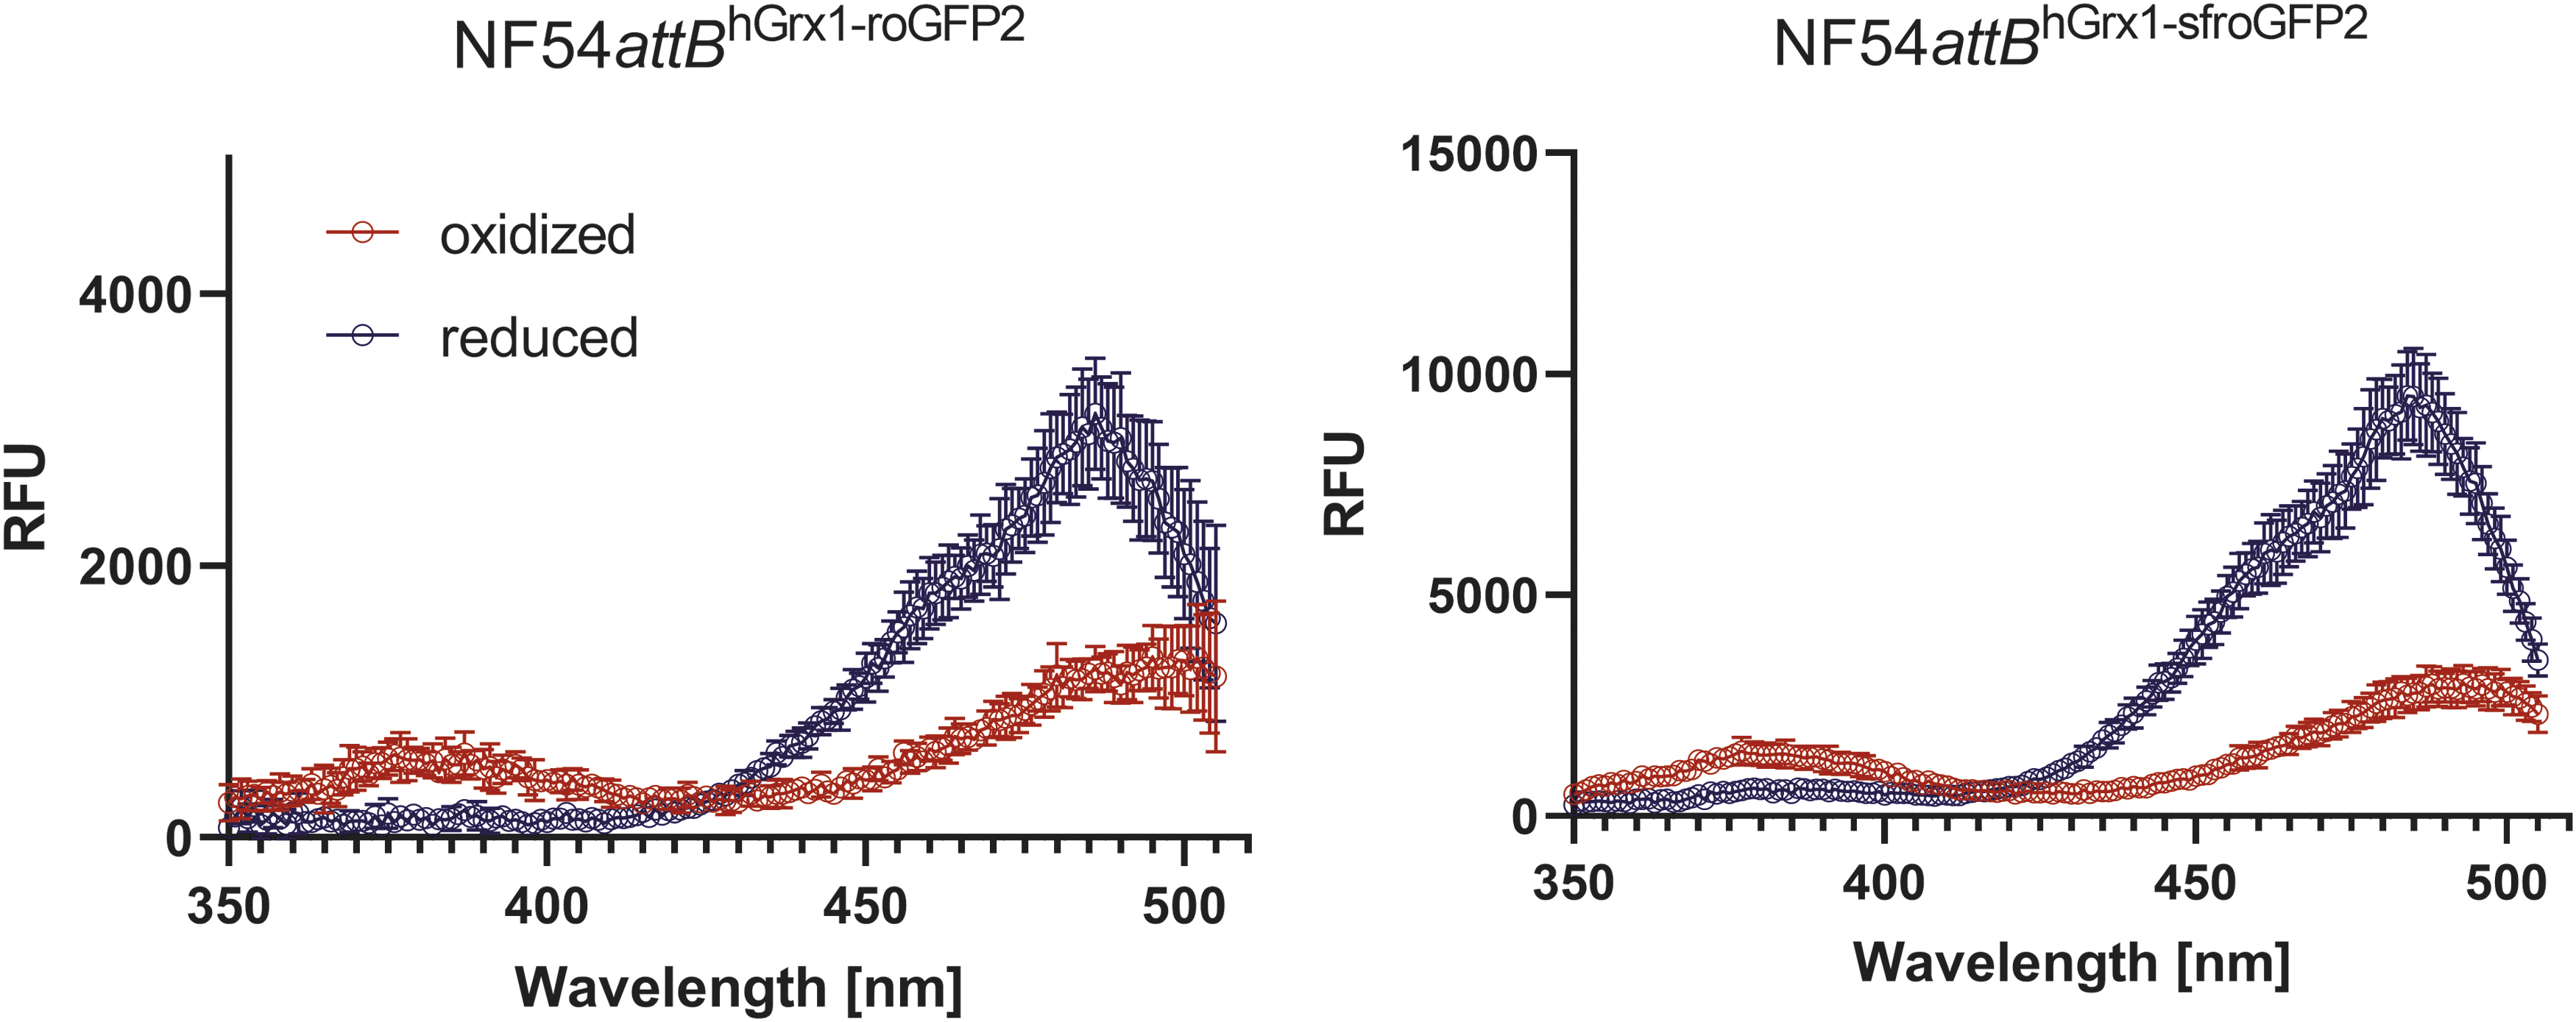
For comparison, we used an NF54attB parasite line stably expressing hGrx1-roGFP2 (64). Lines are referred to as NF54attB hGrx1-sfroGFP2 and NF54attB hGrx1-roGFP2 throughout the article. All parasite lines used in this study expressed the sensors cytosolic. As shown in Figure 8, FI for NF54attB hGrx1-sfroGFP2 was strongly increased when compared with NF54attB hGrx1-roGFP2. WT NF54attB parasites were used to adjust the FI by subtracting the background fluorescence of the parasites and the surrounding red blood cell. A difference in FI between in vitro and in cellulo measurements is clearly visible here. While the spectral properties of the recombinant sfroGFP2WT do not seem to be better, the measurements with parasites show a clearly improved FI. These data show an improved signal-to-noise ratio and an enhanced FI of sfroGFP2-based biosensors over roGFP2-based biosensors in cellulo.
Since the FI of both hGrx1-sfroGFP2 and sfroGFP2WT was ∼3x higher than that of hGrx1-roGFP2 in cellulo (Fig. 7 and Supplementary Fig. S4), while both sensor proteins showed similar FI in vitro (Fig. 5), we hypothesized that more mature and functional sf sensor protein was present due to enhanced expression, proportion of maturation, or stability. To test this hypothesis, Western blot analysis was performed to examine the expression levels of the different sensors. NF54attB hGrx1-roGFP2, NF54attB sfroGFP2, and NF54attB hGrx1-sfroGFP2 parasites were examined.
All investigated proteins of interest were detected in full length. All samples showed a GFP signal with the expected size (Supplementary Fig. S5). Band intensity between the samples NF54attB hGrx1-roGFP2 and NF54attB sfroGFP2 differed by −2.3% ± 11.2%. The difference in band intensity between the samples NF54attB hGrx1-roGFP2 and NF54attB hGrx1-sfroGFP2 was −28.7% ± 20.8%. Anti-PfHSP70 antibody (AB) was used as a loading control (Supplementary Fig. S5). This analysis showed that expression levels between the sensors only differed slightly, with NF54attB hGrx1-roGFP2 showing the highest expression level. Thus, degree of maturation and/or stability of folding, as indicated by the rigidity analysis of sensor structure, appear to be responsible for the improved in cellulo performance rather than protein abundance.
Discussion
In this work, we aimed to identify the molecular basis for the improved fluorescence properties of sfroGFP2WT as this knowledge provides important insights for future sensor developments. To achieve this goal, we characterized different redox biosensor variants in vitro and in cellulo.
In previous studies in which we described the redox biosensor sfroGFP2WT, we demonstrated an improved FI in cellulo (64), which could be confirmed in this study. P. falciparum parasites stably expressing sfroGFP2WT or hGrx1-sfroGFP2 showed improved FI compared with parasites expressing hGrx1-roGFP2. Enhanced expression levels of (hGrx1)-sfroGFP2 could be excluded as a cause of the improved FI via Western blot analysis as the expression levels of all sensor proteins investigated here were comparable. Subsequently, further in vitro investigations were carried out.
During the development of sfroGFP2WT, we aimed to improve the FI of the redox biosensor, but without affecting other sensor properties. We therefore investigated the pH responsiveness of the different sensor variants and determined their midpoint potential. All redox biosensor variants are pH insensitive at physiologically meaningful pH values between 6.0 and 8.0, and show midpoint potentials similar to roGFP2-based biosensors, making them suitable sensors for measuring oxidizing effects within the cytosol and most of the subcellular compartments of Plasmodium parasites. In cellulo, the use of sfroGFP2WT fused to hGrx1 seems to be wiser, since it allows reactions with GSH and GSSG to proceed much more effectively (64).
Unexpectedly, in vitro spectral scans showed a diminished FI for recombinant (hGrx1)-sfroGFP2WT compared with recombinant (hGrx1)-roGFP2 using standard conditions. We investigated this effect in more detail and performed spectral scans at different temperatures. We observed a more stable FI for sfroGFP2-based biosensors at higher temperatures (37°C), which are required for in cellulo measurements with Plasmodium parasites. In general, the FI of both hGrx1-fusion sensors were higher. We therefore hypothesize a potentially stabilizing effect of hGrx1, improving the FI of the actual sensor. Stabilizing effects of Trx—which features Grx fold—have already been described (36). These advantageous properties are used for protein expression and purification. Here, Trx is used as a fusion protein to prevent protein aggregation and to increase the folding behavior of the protein of interest (36).
Protein–protein interactions occurring within the parasites could be excluded to be the only responsible factor for the differences in in vitro and in cellulo experiments. This was studied on the basis of spectral scans using recombinant protein equilibrated in buffer or parasite cell extract (data not shown). Nevertheless, the environment within an intact parasite differs strongly from standard buffer or lysed parasites. The concentration of different molecules as well as their interaction with each other or with membranes cannot be fully remodeled in vitro. As discussed by Minton and colleagues, molecular crowding can lead to large differences between in vitro and in vivo measurements (40, 59). However, not only the surrounding cellular milieu can differ; furthermore, different host cells used for expression can influence protein stability and their properties (11, 42). Therefore, findings from in vivo or in cellulo measurements cannot always be explained with in vitro examinations.
For fluorescent proteins, the structural stability of the fluorophore is especially important to maintain the conjugated π-electron system and the dipole moment, which are important for fluorescence (35). Therefore, we examined differences in structural stability between roGFP2 and sfroGFP2WT using X-ray crystal structure analysis and rigidity analysis.
Our results, based on rigidity analysis, demonstrate that both roGFP2 and sfroGFP2WT show an improved structural stability over GFP. However, the sf mutations in sfroGFP2WT lead to a different conformation of residues than in roGFP2, resulting in disparate interaction networks between the two variants. Pédelacq et al. have already suggested that among all sf mutations, S30R and Y39N have the greatest impact on folding stability (45). We have studied the effects of these specific sf mutations on protein stability in more detail by reversing them in the crystal structures of sfroGFP2R30S and sfroGFP2N39Y, as well as their models R30SsfroGFP2 and N39YsfroGFP2, for rigidity analysis.
We focused our efforts on these specific mutations and their impact on the protein stability. However, one has to mention that for roGFP-biosensors the H-bond involving E222 has also a major impact on the chromophore. Due to the S65T mutation, which is present in all redox biosensors derived from enhanced GFP, the H-bond network that stabilizes the neutral chromophore is disrupted, leading to a shift in equilibrium toward the anionic from. In roClover, a redox biosensor variant that includes the sf mutations as well, the conformation of E222 differs slightly. However this is not because of the sf mutations. Moreover, both the mutations T65G and T203H present in roClover—but not roGFP2 or sfroGFP2WT—are rather responsible therefore. However, these specific mutations have the same effect as S65T that is present in both roGFP2 and sfroGFP2WT (4).
We therefore focused on the sf mutations S30R and Y39N. Our crystal structures of sfroGFP2WT show that the barrel and the chromophore are at most marginally shifted in their position, but an ion network between the strands is formed by inclusion of the sf mutation S30R, which probably increases the stability of sfroGFP2WT. Even though both sf mutations cause an interaction between AA of adjacent strands, probably improving the stability of the barrel, we assume that the influence of the substitution at position 30 is much more critical than that at position 39 due to the more complex network in the surrounding of residue 30.
Our sfroGFP2R30S and sfroGFP2N39Y structures confirm these findings; in particular, reversing the sf mutation S30R in the crystal structure of sfroGFP2R30S disrupts the ion pair network between adjacent strands. Even though we only saw slight structural differences between our crystal structures of sfroGFP2WT and sfroGFP2R30S, by using rigidity analysis, we were able to confirm that the sf mutation S30R is important for the stability of sfroGFP2WT. Reversing the sf mutation S30R in the structural model R30SsfroGFP2 has a major impact on the overall stability of the protein, reducing the stability close to the level of GFP.
Besides stabilizing the β-barrel structure, the sf mutations in sfroGFP2WT exert a long-range effect on the barrel center, such that the fluorophore remains structurally stable until the end of the constraint dilution simulations, whereas in GFP the fluorophore becomes unstable.
Taken together, our data confirm the hypothesis that variants with a higher resilience against oxidative alterations have a more stable structure under the experimental conditions chosen. The constraint dilution simulations explain this higher structural stability of roGFP2 and sfroGFP2WT over GFP on a per residue level, including the fluorophore in sfroGFP2WT, and thus can rationalize the higher stability and FI of these variants in changing redox conditions. These findings were in line with other studies showing a higher resilience of more structurally stable proteins (16, 23, 38, 44, 46), although this relation is not undebated (31).
The knowledge generated in this study about the molecular basis underlying the improved FI of sfroGFP2WT-based redox biosensors in cellulo compared with roGFP2-based biosensors can be applied to other sensors, and can thus enrich the field of sensor development.
Materials and Methods
Drugs and chemicals
All chemicals used were of the highest available purity and were obtained from Thermo Fisher Scientific (Dreieich, Germany), Roth (Karlsruhe, Germany), Sigma-Aldrich (Steinheim, Germany), or Merck (Darmstadt, Germany). RPMI 1640 medium was purchased from Gibco (Paisley, United Kingdom) and SYBR Green I from Thermo Fisher Scientific.
Engineering sfroGFP2 mutants
To generate sfroGFP2R30S, sfroGFP2N39Y, and sfroGFP2R223F, site-directed mutagenesis PCR was performed using pQE30-[sfroGFP2WT] as a template, AccuPrime™ Pfx DNA polymerase (Thermo Fisher Scientific, Waltham, MA), and specific primer pairs (Supplementary Table S1). Template plasmids were digested using DpnI (Thermo Fisher Scientific). Correctness of mutants was verified by sequencing (LGC genomics).
Expression and purification of recombinant redox biosensors
The different redox biosensors were heterologously overexpressed using Escherichia coli (E. coli) cells. RoGFP2 was expressed in lysogeny broth (LB) medium using E. coli M15 [pREP4] cells (kanamycin resistance, KanR), which were transformed with roGFP2 in pQE30 (carbenicillin resistance, CnR), at 37°C for 4 h. HGrx1-roGFP2 was produced as described by Kasozi et al. (32) SfroGFP2WT and hGrx1-sfroGFP2 were produced according to Schuh et al. (64). For heterologous overexpression of the sfroGFP2 mutants, E. coli M15 [pREP4] cells (KanR) were transformed with either pQE30-[sfroGFP2R30S], pQE30-[sfroGFP2R223F], or pQE30-[sfroGFP2N39Y] (CnR, respectively).
SfroGFP2R30S and sfroGFP2R223F were expressed in LB medium at 37°C or room temperature (RT) for 4 h. SfroGFP2N39Y was expressed in terrific broth medium at 37°C for 2 h. Pellets were harvested via centrifugation and stored at −20°C. Frozen pellets were thawed, resuspended in HEPES buffer (50 mM HEPES, 300 mM NaCl, pH 7.5), and mixed with protease inhibitors (150 nM pepstatin, 40 nM cystatin, 100 μM phenylmethylsulfonyl fluoride). After lysis using lysozyme, DNase, and sonication, supernatants were obtained via centrifugation (18,000 rpm, 30 min, 4°C). After purification of all proteins via hexahistidyl affinity chromatography on Ni-NTA and fast protein liquid chromatography, they were concentrated using 10 or 30 kDa Vivaspin columns (Sarotius, Göttingen, Germany) and stored at 4°C.
Crystallization, data collection, and processing of recombinant redox biosensors
SfroGFP2WT, sfroGFP2R30S, and sfroGFP2N39Y crystals were grown in white light at 22°C in sitting drops with the vapor diffusion technique, using a Honeybee 961 crystallization robot. For crystallization of sfroGFP2WT, the protein was concentrated in 300 mM NaCl and 0.05 M Hepes (pH 7.5) to 30 mg/mL. In the drop, 0.2 μL of protein solution was mixed with 0.2 μL reservoir solution (46% v/v EtOH, 0.25% v/v dichloromethane). Crystals appeared after 1 day at RT. Before data collection, crystals were soaked in mother liquor with a final concentration of 15% glycerol. Diffraction data for all crystals were collected at X10SA (detector: Pilatus) from the Swiss Light Source in Villigen, Switzerland.
Diffraction data were collected at 100K and processed with XDS (30). The orthorhombic crystals diffracted up to 1.1 Å resolution and obeyed P212121 space group symmetry with one monomer in the asymmetric unit. SfroGFP2R30S was crystallized using 0.2 μL of 30 mg/mL protein and 0.2 μL of 10% polyethylene glycol (PEG) 6000, 30% ethanol and 100 mM sodium acetate. After 1 day, crystals appeared at RT. The X-ray structure was solved with a resolution of 1.35 Å. For sfroGFP2N39Y, 0.2 μL of 30 mg/mL protein was mixed with 0.2 μL 30% PEG 4000. Crystals appeared after 5 days. The structure was solved with a resolution of 2.0 Å.
Structure determination
The structure was solved via molecular replacement. The search model was generated via homology modeling with SWISS-MODEL (72). As a template for modeling, we used the structure of A. victoria GFP (Protein Data Bank code 1qyo), which shares a sequence identity of 94% with sfroGFP2WT. The first refinement of the molecular replacement solution revealed an Rfree of 25%. During refinement, 6% of all reflections were omitted and used for calculating an Rfree value. We improved the models in cycles of manual building and refinement, with a final Rfree of 16.2%. Data collection and refinement statistics are shown in Table 1. The PHENIX program suite (1) was used for reflection phasing and structure refinement. The interactive graphics program Coot (14) was used for model building. Molecular graphics images were produced using the UCSF Chimera package (47).
Rigidity analysis
Generation of structural models
The X-ray crystal structure of sfroGFP2WT was used to generate structural models of R30SsfroGFP2, N39YsfroGFP2, R223FsfroGFP2, roGFP2sfroGFP2, and GFPsfroGFP2. The respective structural models were generated based on one template structure and with the same structural modeling technique to minimize these influences on the outcome of subsequent computations (49, 58). This modeling was performed with Maestro as described below.
Molecular dynamics simulations
In all cases, Maestro (Schrödinger, LLC, New York, 2017) was used for introducing substitutions, and protonation states were assigned with PROPKA (2) at pH 7.4. Using tleap from the Amber18 package of molecular simulation software (5), the systems were neutralized by adding counter ions and solvated in an octahedral box of TIP3P water (27) with a minimal water shell of 12 Å around the protein.
Molecular dynamics (MD) simulations were performed with Amber18 (5). The ff14SB force field (37) was used to parameterize the protein, Joung and Chetham parameters (29) were used for the counter ions, and TIP3P (27) for the water. The fluorophore was parameterized using antechamber (71), prepgen, and parmchk2, which are part of Amber18, following the procedure described here:
At the beginning, 17,500 steps of steepest descent and conjugate gradient minimization were performed; during 2500, 10,000, and 5000 steps, positional harmonic restraints with force constants of 25 kcal/(mol·Å2), 5 kcal/(mol·Å2), and 0, respectively, were applied to the solute atoms. Thereafter, 50 ps of NVT (constant number of particles, volume, and temperature) MD simulations were conducted to heat up the system to 100 K, followed by 300 ps of NPT (constant number of particles, pressure, and temperature) MD simulations to adjust the density of the simulation box to a pressure of 1 atm and to heat the system to 300 K.
During these steps, a harmonic potential with a force constant of 10 kcal/(mol·Å2) was applied to the solute atoms. As the final step in thermalization, 300 ps of NVT-MD simulations were performed, while gradually reducing the restraint forces on the solute atoms to zero within the first 100 ps of this step. Afterward, five independent production runs of NVT-MD simulations with 2 μs length each were performed. For this, the starting temperatures of the MD simulations at the beginning of the thermalization were varied by a fraction of a Kelvin.
Structures were extracted from the trajectories every 2 ns using cpptraj (60, 61).
Constrained network analysis
The extracted structures were postprocessed using Constraint Network Analysis (CNA) (48) as described in Nutschel et al. (44). In short, for analyzing the rigid cluster decomposition of all GFP variants, a constraint dilution simulation was performed using CNA on an ensemble of network topologies generated from an MD trajectory (ENTMD). The ensemble-based CNA was pursued to increase the robustness of the rigidity analyses (48, 58). Subsequently, the unfolding trajectory was visually inspected using VisualCNA (57) for identifying secondary structure elements that segregate from the largest rigid cluster at each major phase transition. VisualCNA is an easy-to-use PyMOL plugin that allows setting up CNA runs and analyzing CNA results, linking data plots with molecular graphic representations (57). See Supplementary Information for more details.
Functional properties
Fluorescence spectra
Spectral scans were performed using a plate reader (CLARIOstar; BMG Labtech, Ortenberg, Germany). Redox biosensor variants were diluted to 1 μM protein concentration in potassium phosphate buffer (100 mM potassium phosphate, 100 mM NaCl, 0.5 mM Na2-EDTA, pH 7.0). Sensor surface Cys were driven to full reduction using 10 mM DTT or to full oxidation using 1 mM 2,2-dithiopyridylsulfide (DPS). Excitation scans were recorded at 530 ± 10 nm emission, and emission scans after excitation at 405 ± 10 and 485 ± 10 nm, respectively. For measurements at 10°C, precooled buffer, recombinant proteins, and DTT/DPS stock solutions were used. For measurements at 37°C, the buffer and plate reader were preheated. Four technical replicates were performed.
Dynamic change of ratio
The different redox biosensor proteins (roGFP2, hGrx1-roGFP2, sfroGFP2WT, and hGrx1-sfroGFP2) were prereduced using 10 mM DTT and desalted using Bio-Gel P-6 gel (Bio-Rad, Feldkirchen, Germany) resuspended in potassium phosphate buffer (100 mM potassium phosphate, 100 mM NaCl, 0.5 mM Na2-EDTA, pH 7.0). Redox biosensors were diluted to a final concentration of 1 μM protein in potassium phosphate buffer. Buffer and plate reader were preheated to 37°C. Redox biosensors were excited sequentially at 400 ± 10 and 482 ± 16 nm with emission at 530 ± 40 nm in a plate reader (CLARIOstar; BMG Labtech). FI were measured every 20 s for 240 s. After 80 s at baseline measurement with prereduced sensor protein, 1 mM DIA was added, and oxidation was monitored for 80 s before reduction by adding 10 mM DTT. Ratios were plotted against time using GraphPadPrism8. Three independent repetitions were performed using sensor protein from three different batches.
pH response
The different redox biosensors were equilibrated in buffers adjusted to pH values ranging from 5.0 to 9.0 (pH 5.0 to pH 6.5, 10 mM MES-KOH, 100 mM NaCl, 5 mM EDTA; pH 7.0 to pH 8.0, 100 mM Hepes-KOH, 100 mM NaCl, 5 mM EDTA; pH 8.5 to pH 9.5, 100 mM Tris-HCL, 100 mM NaCl, 5 mM EDTA). Redox biosensor variants were excited sequentially at 400 ± 5 and 482 ± 8 nm in a plate reader (CLARIOstar; BMG Labtech). All pH points were measured for oxidized (1 mM DPS) and reduced (10 mM DTT) sensor proteins using four technical replicates each.
Redox titration
To determine the midpoint potentials, redox sensors were equilibrated (1 h) with DTT buffers (reduced form 1,4-dithiothreitol, DTTred; oxidized form 1,3-dithiane, DTTox). DTTred/DTTox was used in a total concentration of 10 mM in degassed HEPES buffer (100 mM Hepes, 100 mM NaCl, 0.5 mM Na2-EDTA, pH 7.0). The relation of DTTred and DTTox to set a certain redox potential was calculated with the Nernst equation based on the standard reduction potential of DTT (E0′
DTT), −330 mV [Eq. (1)]:
R is the gas constant [8.315 J/(K·mol)]; T is the absolute temperature (310.45K); z is the number of transferred electrons (2); F is the Faraday's constant (96,485°C mol−1).
Redox potentials ranging from −220 to −360 mV were adjusted. In addition, redox sensors were fully reduced (10 mM DTT) and fully oxidized (1 mM DPS). Redox sensors were excited sequentially at 400 ± 5 and 482 ± 8 nm in a plate reader (CLARIOstar; BMG Labtech). The degree of oxidation (OxD) was determined according to Equation (2):
R represents the ratio of the FI measured at 405 and 485 nm
To determine the midpoint potential E0′ for the different roGFP2 variants, OxDroGFP2 was plotted against the calculated redox potential, which was adjusted with DTTred/DTTox. Using GraphPadPrim8, all data points were fitted to a sigmoidal dose–response curve.
In cellulo characterization of redox biosensor variants
Spectral scan in cellulo
Spectral scans were performed using NF54attB parasites stably expressing hGrx1-roGFP2, sfroGFP2WT, or hGrx1-sfroGFP2. Parasites were cultured (69) and prior to measurement synchronized with 5% sorbitol. Trophozoite stage parasites were magnetically enriched and diluted in Ringer's solution (122.5 mM NaCl, 5.4 mM KCl, 1.2 mM CaCl2, 0.8 mM MgCl2, 11 mM
Western blot analysis
NF54attB hGrx1-roGFP2, NF54attB sfroGFP2, and NF54attB hGrx1-sfroGFP2 parasites were synchronized using sorbitol. Trophozoite stage parasites were harvested via saponin lysis. After washing three times with phosphate-buffered saline, parasites were lysed using M-PER™ buffer (Thermo Fisher Scientific). Parasite supernatants were mixed with 4 × sample buffer with DTT and incubated for 5 min at 95°C. Samples were separated using SDS-PAGE (sodium dodecyl sulfate–polyacrylamide gel electrophoresis) and blotted to a nitrocellulose membrane. After blocking with 5% milk, the membrane was incubated with an anti-GFP AB (1:500 in 5% milk); an antimouse AB conjugated with horseradish peroxidase (HRP) was used as a secondary AB (1:10,000 in 5% milk). After the reaction with luminol, chemiluminescence was detected using an iNTAS ECL Chemostar. Then, the membrane was stripped using the restore™ PLUS Western blot stripping buffer (Thermo Fisher Scientific).
After blocking with 5% milk overnight, the membrane was incubated with an anti-HSP70 AB (1:500 in 5% milk) as a loading control. Antirabbit AB (1:2000 in 5% milk) conjugated with HRP was used as a secondary AB. Chemiluminescence was detected as described above (Supplementary Fig. S6). Two biological replicates in two technical replicates were performed. Background subtraction using the rolling ball algorithm was performed with Fiji (63). Band intensities were measured using Fiji. GFP signal was normalized by the associated PfHSP70 loading control. Fold change of band intensity and the percentage change of the expression level between NF54attB hGrx1-roGFP2 and NF54attB sfroGFP2, as well as NF54attB hGrx1-roGFP2 and NF54attB hGrx1-sfroGFP2, were calculated.
Confocal laser scanning microscopy imaging
To record confocal laser scanning microscopy images, parasites were prepared as described by Schuh et al. (64). In brief, trophozoite stage parasites were magnetically enriched and washed with prewarmed (37°C) Ringer's solution. Parasites were seeded on poly-
Samples were excited with a sequential scan at 405 and 488 nm; emission was detected at 500–550 nm. Scanning was performed at 400 Hz frequency and at a 512 × 512 pixel resolution. The argon laser power was set to 20%; smart gain and smart offset were 950 V and −0.9%, respectively. Images were processed using Fiji. The background was subtracted using the rolling ball algorithm, and contrast was enhanced by 0.01%. To improve the recognizability, colors from the green and red channels were set to yellow and magenta and merged.
Footnotes
Acknowledgments
The authors gratefully acknowledge Michaela Stumpf, Marie Sorg, and Norma Schulz for their technical assistance. Furthermore, they thank Ilme Schlichting and Miroslaw Tarnawski for their thoughtfully arranged data collection. Diffraction data were collected at beamline X10SA, Swiss Light Source, Paul Scherrer Institute, Villigen, Switzerland, and they thank the beamline staff for the excellent setup. They are grateful for computational support and infrastructure provided by the Zentrum für Informations- und Medientechnologie (ZIM) at the Heinrich Heine University Düsseldorf and the computing time provided by the John von Neumann Institute for Computing (NIC) to HG on the supercomputer JUWELS at Jülich Supercomputing Centre (JSC) (User ID: HKF7, VSK33).
Authors’ Contributions
K.F.W., K.B., M.S., H.G., and J.P. directed the overall research program; K.C.H., C.G., A.K.S., and T.N. conducted the experiments; K.F.W., K.C.H., and C.G. analyzed the data and prepared figures; all authors contributed to experimental design, and wrote and edited the article.
Author Disclosure Statement
No competing financial interests exist.
Funding Information
The German Research Foundation (SPP1710; to Katja Becker, Markus Schwarzländer, Stefan Rahlfs, and Holger Gohlke) and LOEWE Center DRUID (Project E3 to Katja Becker and Stefan Rahlfs) supported this study. The German Research Foundation funds the Center for Structural Studies (DFG Grant No. 417919780).
Supplementary Material
Supplementary Information
Supplementary Figure S1
Supplementary Figure S2
Supplementary Figure S3
Supplementary Figure S4
Supplementary Figure S5
Supplementary Figure S6
Supplementary Table S1
Abbreviations Used
References
Supplementary Material
Please find the following supplemental material available below.
For Open Access articles published under a Creative Commons License, all supplemental material carries the same license as the article it is associated with.
For non-Open Access articles published, all supplemental material carries a non-exclusive license, and permission requests for re-use of supplemental material or any part of supplemental material shall be sent directly to the copyright owner as specified in the copyright notice associated with the article.