
Abstract
Significance:
Mitochondria determine glucose-stimulated insulin secretion (GSIS) in pancreatic β-cells by elevating ATP synthesis. As the metabolic and redox hub, mitochondria provide numerous links to the plasma membrane channels, insulin granule vesicles (IGVs), cell redox, NADH, NADPH, and Ca2+ homeostasis, all affecting insulin secretion.
Recent Advances:
Mitochondrial redox signaling was implicated in several modes of insulin secretion (branched-chain ketoacid [BCKA]-, fatty acid [FA]-stimulated). Mitochondrial Ca2+ influx was found to enhance GSIS, reflecting cytosolic Ca2+ oscillations induced by action potential spikes (intermittent opening of voltage-dependent Ca2+ and K+ channels) or the superimposed Ca2+ release from the endoplasmic reticulum (ER). The ATPase inhibitory factor 1 (IF1) was reported to tune the glucose sensitivity range for GSIS. Mitochondrial protein kinase A was implicated in preventing the IF1-mediated inhibition of the ATP synthase.
Critical Issues:
It is unknown how the redox signal spreads up to the plasma membrane and what its targets are, what the differences in metabolic, redox, NADH/NADPH, and Ca2+ signaling, and homeostasis are between the first and second GSIS phase, and whether mitochondria can replace ER in the amplification of IGV exocytosis.
Future Directions:
Metabolomics studies performed to distinguish between the mitochondrial matrix and cytosolic metabolites will elucidate further details. Identifying the targets of cell signaling into mitochondria and of mitochondrial retrograde metabolic and redox signals to the cell will uncover further molecular mechanisms for insulin secretion stimulated by glucose, BCKAs, and FAs, and the amplification of secretion by glucagon-like peptide (GLP-1) and metabotropic receptors. They will identify the distinction between the hub β-cells and their followers in intact and diabetic states. Antioxid. Redox Signal. 36, 920–952.
Introduction
Mitochondria as metabolic and redox hub
Mitochondria have been recognized for seven decades as the metabolic and redox hub, not only providing cells with ATP but also with a plethora of metabolites and signaling mechanisms. Mitochondria cannot be ignored in the majority of studies working toward understanding physiological and pathological mechanisms at the subcellular level. For pancreatic β-cells, the ultimate physiological role of mitochondria lies in the notoriously known elevation of ATP synthesis upon glucose-stimulated insulin secretion (GSIS). However, mitochondrial redox signaling is one of its recently discovered roles (104, 194), as well as the transport of Ca2+ across the inner mitochondrial membrane (IMM), synchronized with Ca2+ oscillations evoked by action potential firing, which are caused by the predominantly intermittent opening of voltage-dependent Ca2+ channels (CaV); in rodents, these are mostly L-type channels (CaL) (31, 91, 210, 212, 213).
The additional Ca2+ release is superimposed onto the primary Ca2+ oscillations incoming from the endoplasmic reticulum (ER) (49, 280) and other Ca2+ stores, such as insulin granule vesicles (IGVs) or lysosomes. By stimulating matrix dehydrogenases and adenylyl cyclase, the elevated matrix Ca2+ plays an important amplifying role during the first and second GSIS phase and during amplification mechanisms of insulin secretion, notably in incretin- (glucagon-like peptide [GLP-1]- and gastric inhibitory peptide [GIP]-) and metabotropic receptor signaling (71, 218).
We found that insulin secretion stimulated by branched-chain ketoacids (BCKAs) (194) and partly by fatty acids (FAs) (98, 103) essentially relies on mitochondrial retrograde redox signaling. Due to the relatively low content of cytosolic glutathione (17, 135 –137, 270), the redox milieu of pancreatic β-cells promotes the signal spreading from mitochondria up to the targets within the plasma membrane, which can further switch-on CaV opening and action potential firing, followed by IGV exocytosis. It is unknown whether the redox signal spreading is enabled by a H2O2 diffusion or by a redox relay, for example, via peroxiredoxins, thioredoxins, or glutaredoxins, abundant in pancreatic β-cells (97, 204). In any case, β-cells appear to be a perfect redox system, ideally suited for redox signal conduction (105, 274). Nevertheless, the redox state is highly compartmentalized (17, 208).
Also, the specific metabolism of β-cells under fasting and fed conditions contributes via changes and the concomitant effects of NADH/NADPH homeostasis, as well as via the transport of various specific metabolites, for example, coenzyme A-esters (CoA-esters) of FAs, malonyl-CoA, and long-chain acyl-CoA as stimulating insulin secretion (196), formed from the matrix acetoacetate exported to the cytosol (52).
ATP-sensitive K+ channel as prerequisite for triggering of GSIS
Recently, we reported that GSIS essentially relies on the physiological cytosolic redox signaling provided by H2O2 produced by NADPH oxidase 4 (NOX4) upon glucose intake, followed by the branching of the glucose-6-phosphate (G6P) flux toward the pentose phosphate pathway (PPP) (Fig. 1) (194). The two PPP enzymes produce NADPH, and the elevation of their activities causes an instant elevation of H2O2 formation by NOX4. This new paradigm of the requirement of increased ATP plus increased H2O2 for insulin secretion in response to glucose was concluded from experiments in which NOX4-knockout mice (NOX4KO) or mice with NOX4, ablated specifically in pancreatic β-cells (NOX4βKO mice), exhibited a completely suppressed first GSIS phase, whereas the second phase was only moderately attenuated (194).
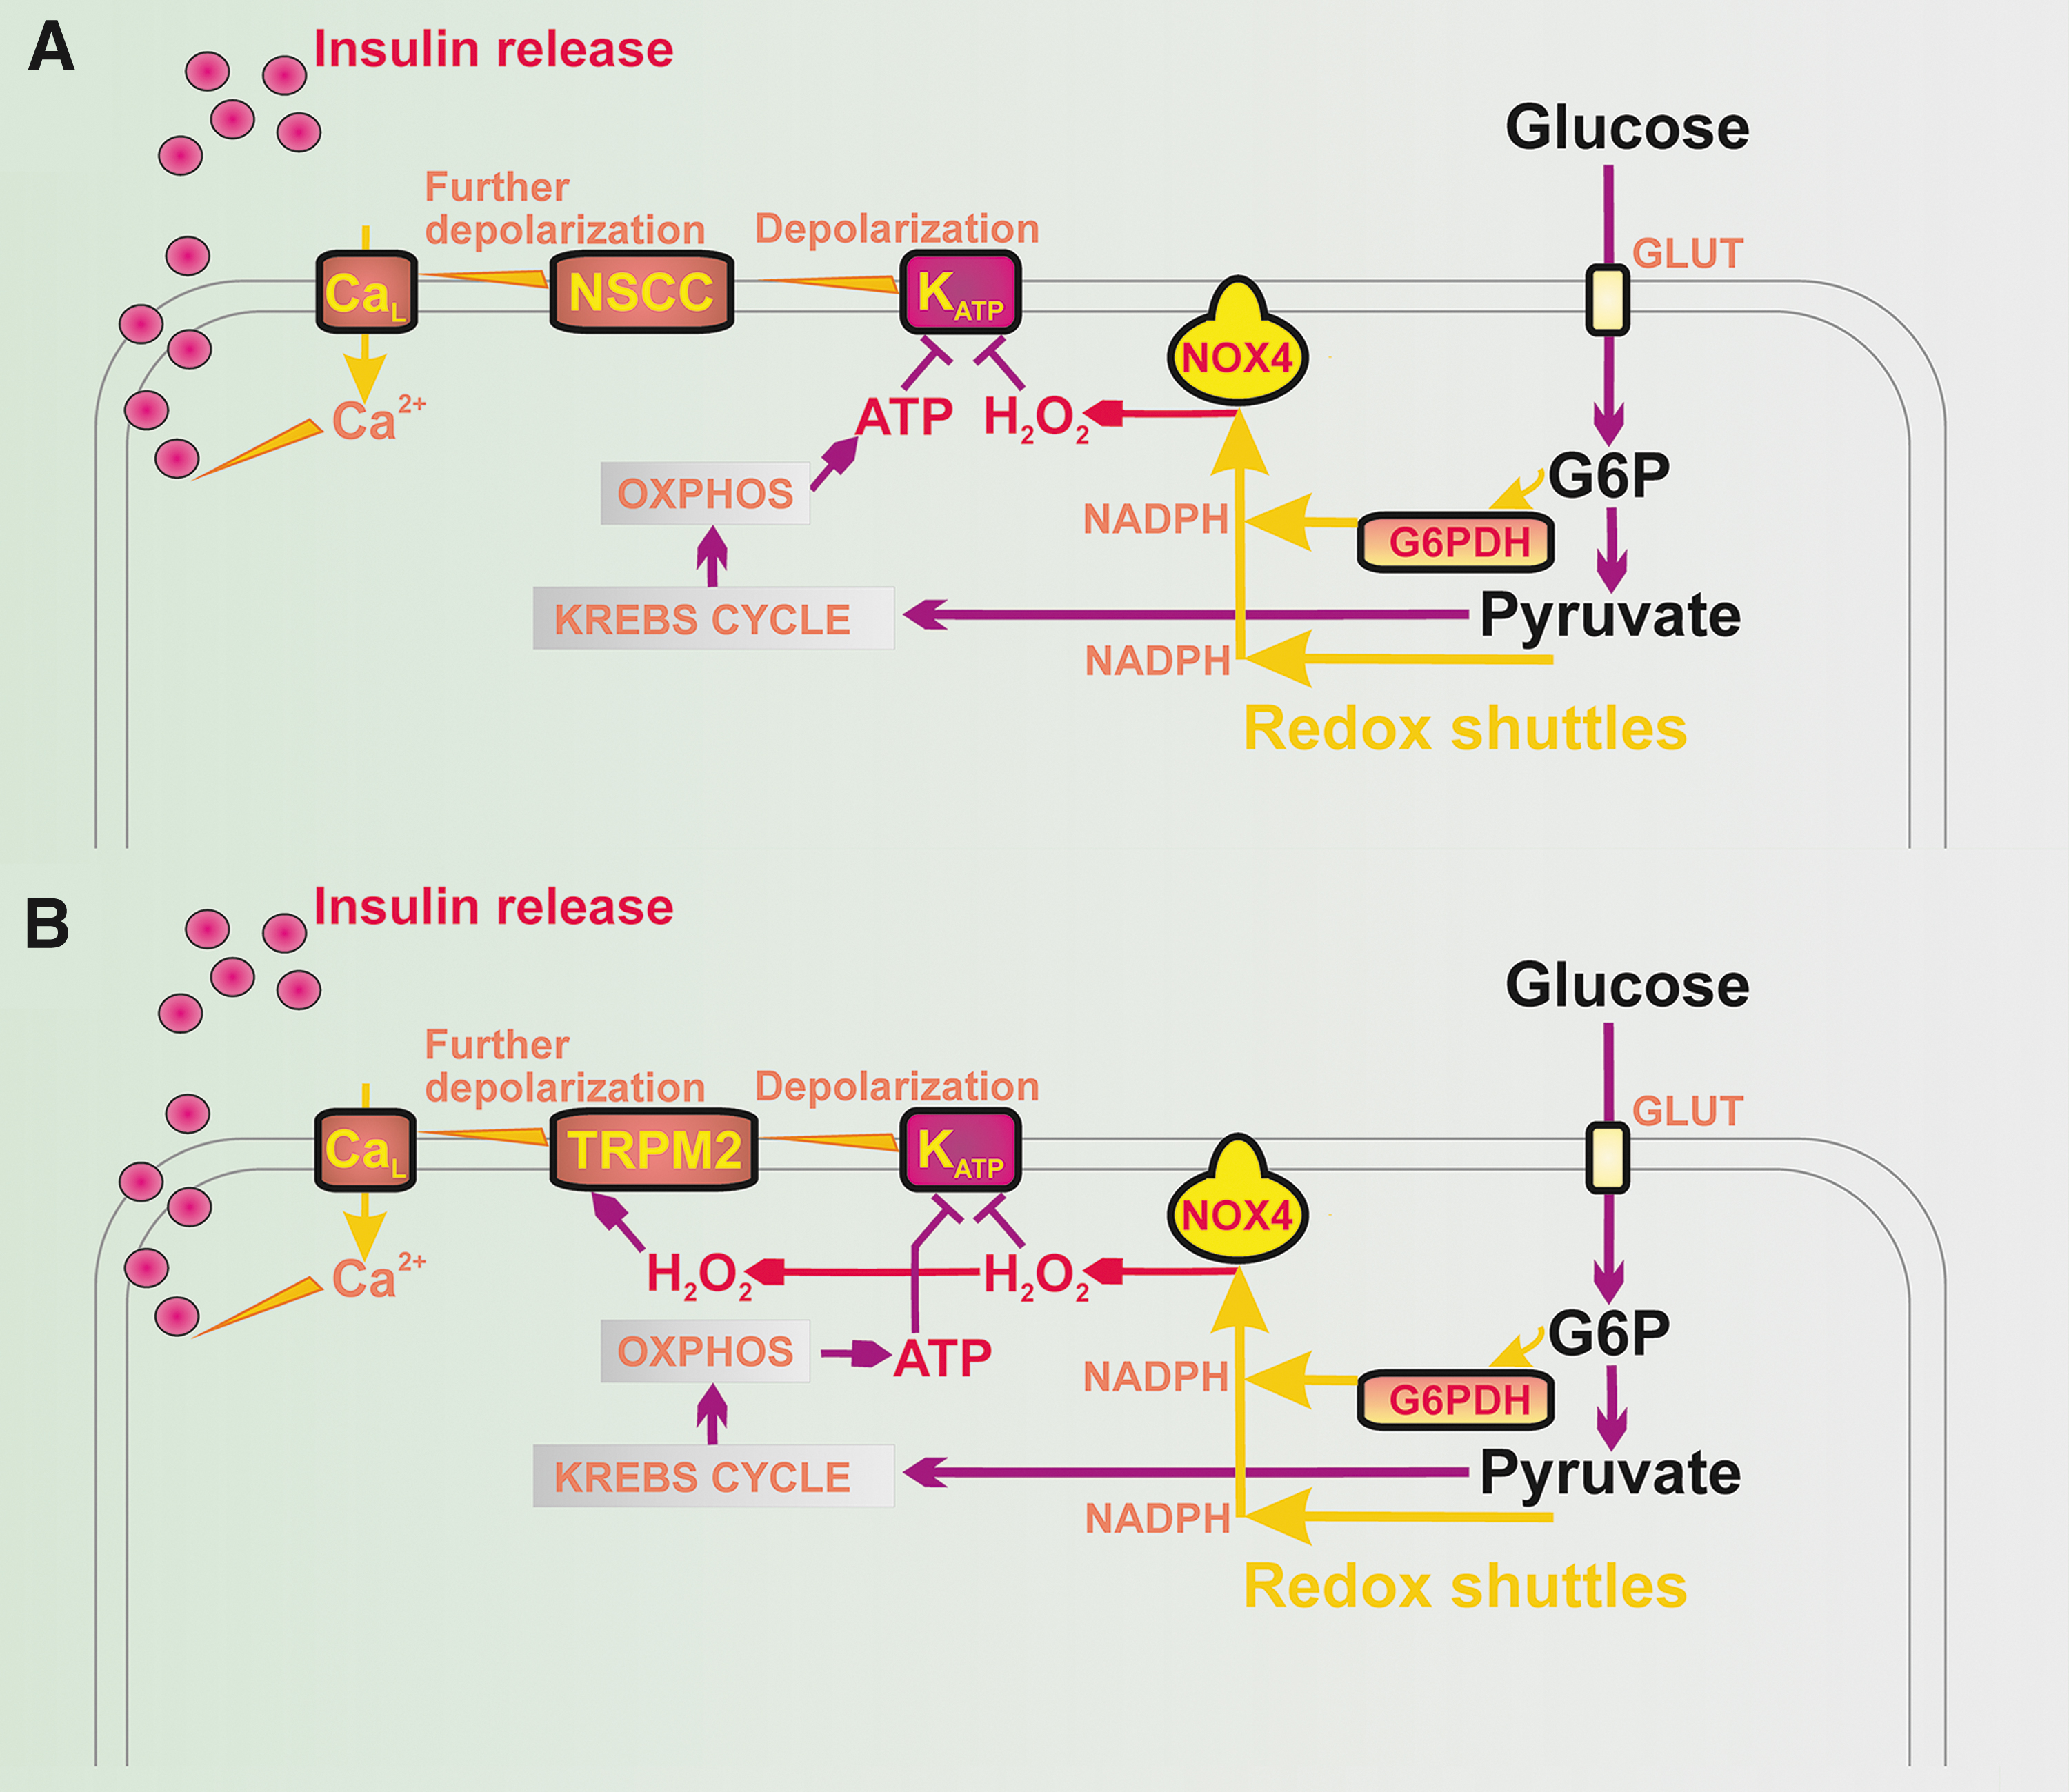
The first phase was rescued by NOX4 overexpression in pancreatic islets (PIs) isolated from NOX4βKO mice or by H2O2 addition (194). Moreover, the ATP-sensitive K+ channel (KATP) (8) could not be closed after the glucose addition to the patch-clamped INS-1E cells silenced for NOX4 (194). In contrast, INS-1E cells having vestigial ATP synthase lacking DAPIT and thus having crippled ATP synthesis still maintained GSIS (134).
The textbook paradigm stressed the key role of glucose triggering of the first GSIS phase [reviewed, e.g., in Refs. (104, 210)]. Glycolysis followed by the oxidative phosphorylation (OXPHOS) and elevated synthesis of ATP has been considered to be the only required condition, similar to the exclusive role of KATP. In The Synergy of Membrane Channels section, we will discuss that even 100% closure of the ensemble of KATP is not enough for GSIS triggering. In contrast, certain forms of the maturity-onset diabetes of the young (MODY), that is, of monogenic type of diabetes mellitus, are exemplar cases supporting the important role of KATP.
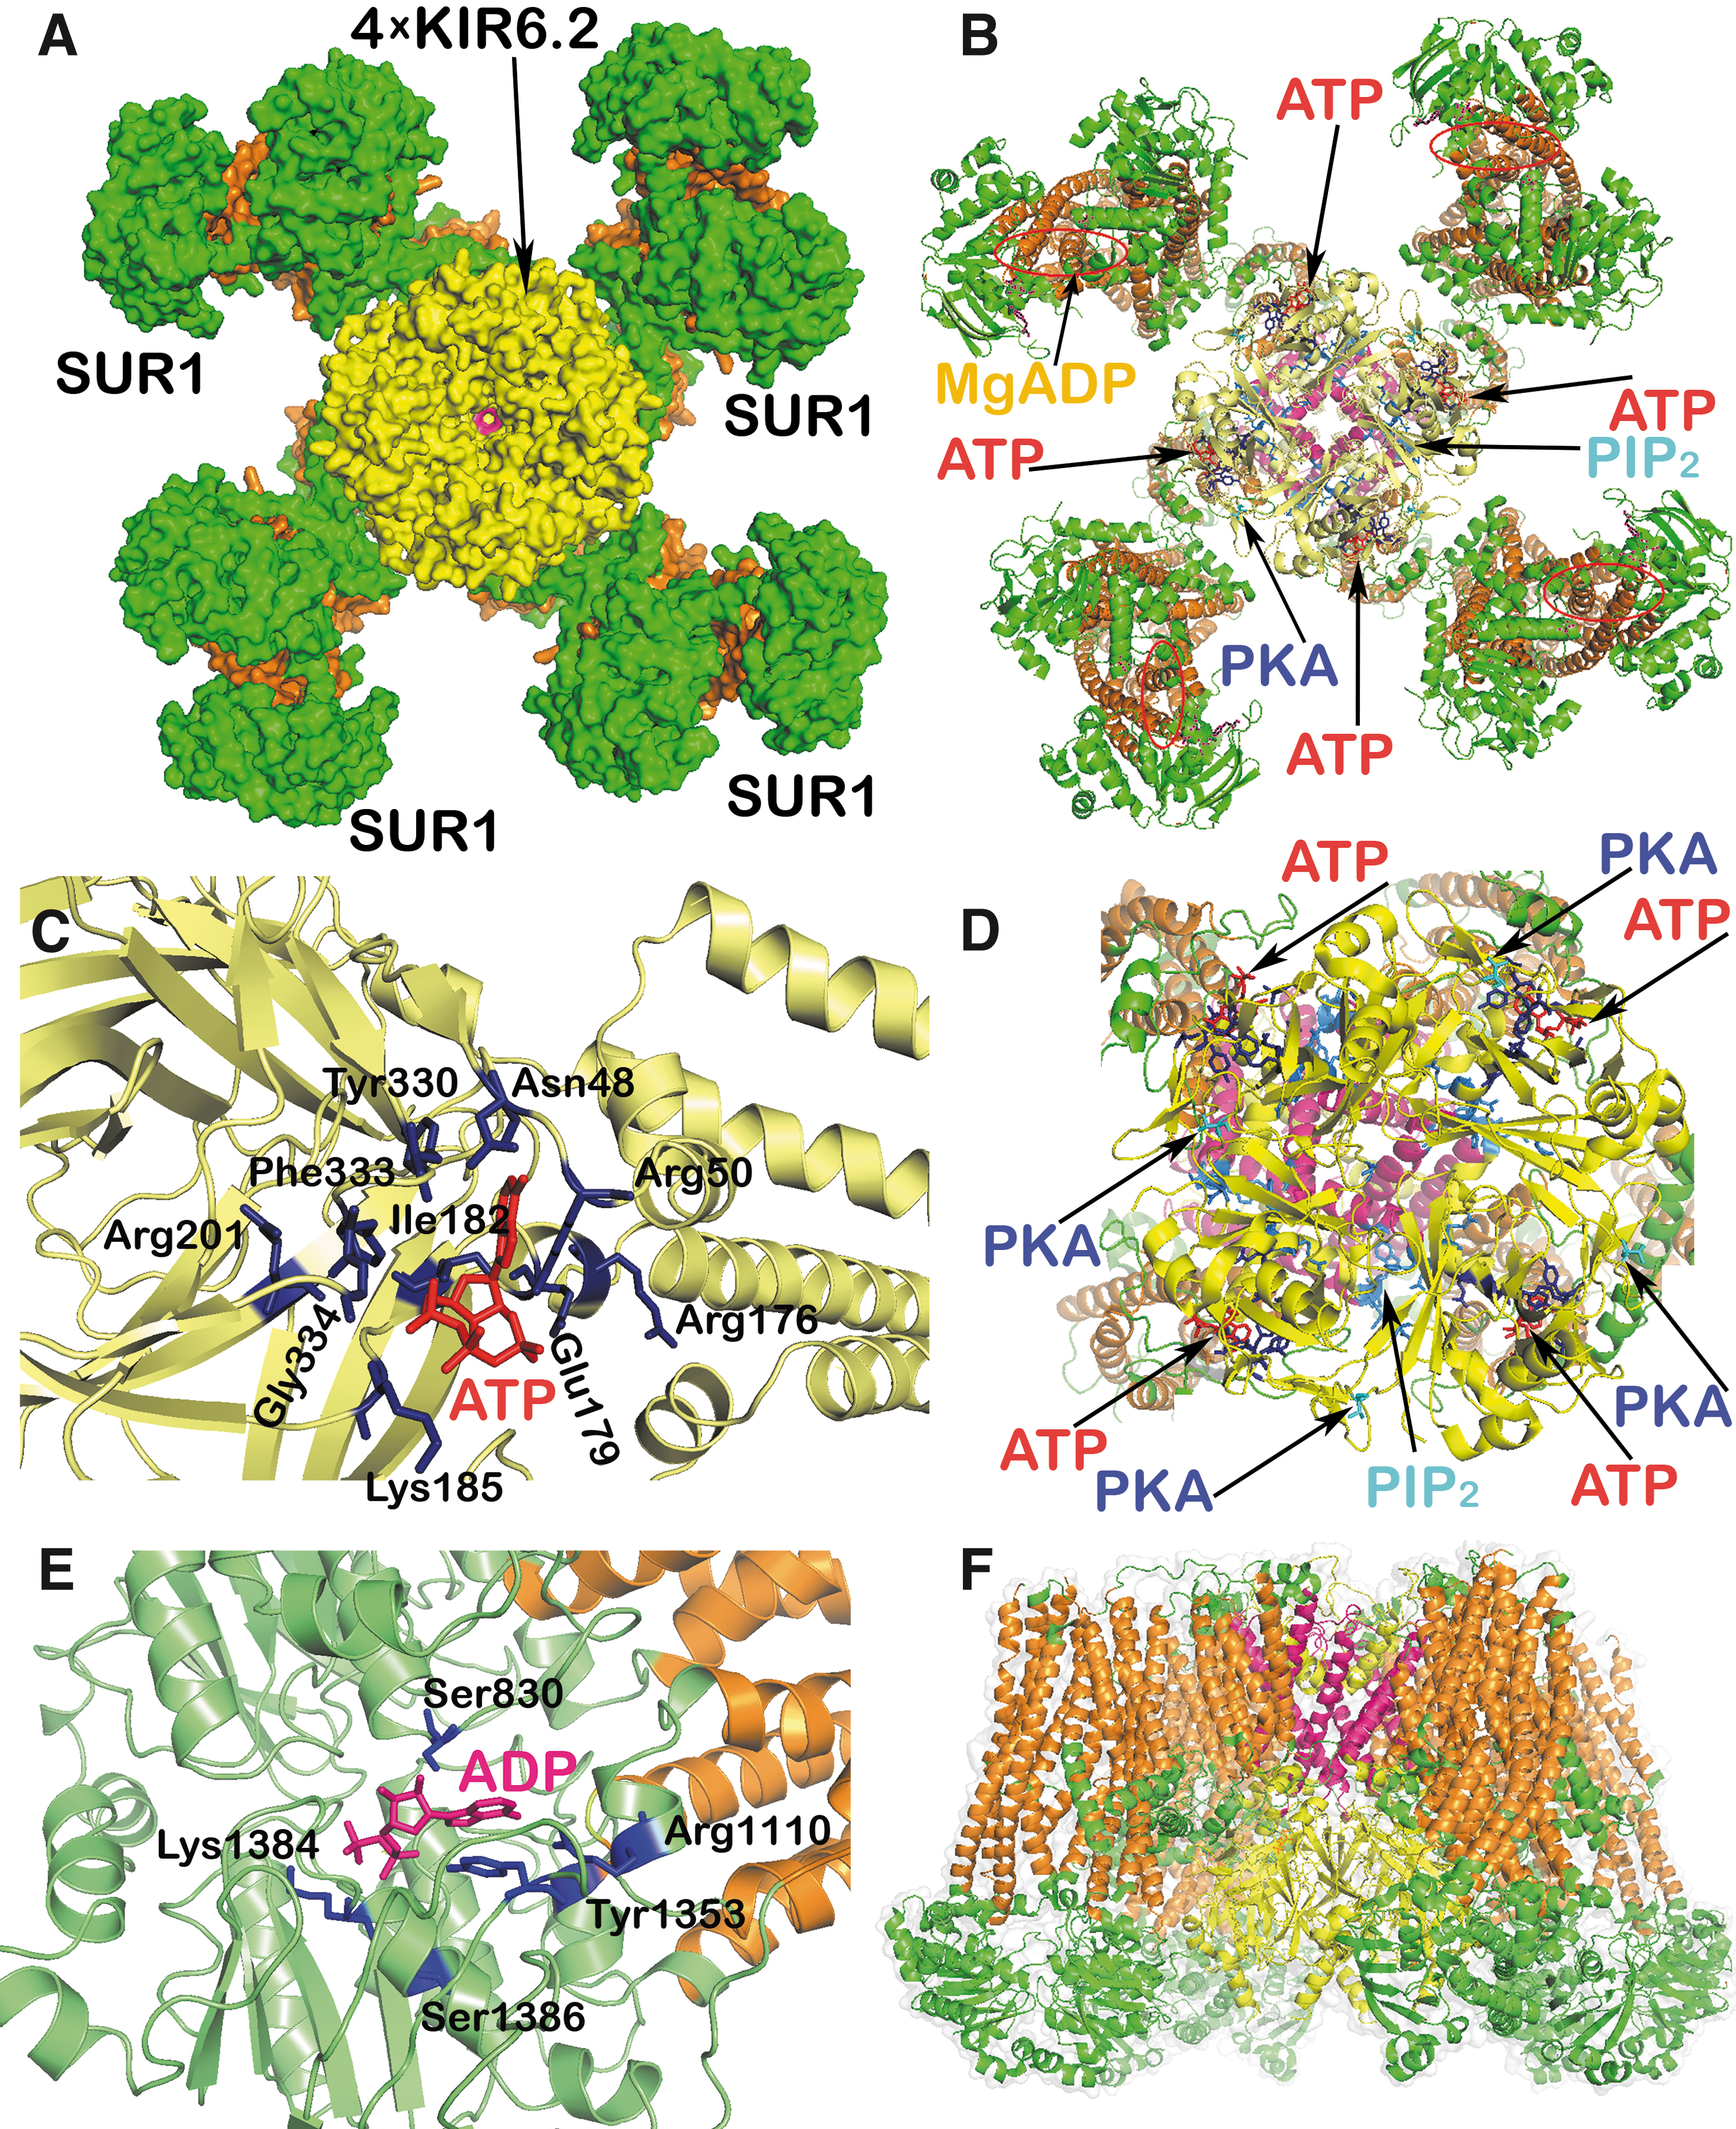
Thus, homogeneous mutations in Kcnj11 (a gene encoding the KIR6.2 subunit of KATP, when the KIR6.2 tetramer forms the physical channel) and more heterogeneous mutations in the Abcc8 gene (encoding the regulatory subunits sulfonylurea receptor 1 [SUR1]) reduce the ability of ATP to cause channel closure (9). These mutations impair ATP binding at KIR6.2 or how ATP binding translates into the pore closure, respectively (128, 161, 232). They may enhance MgADP activation of SUR1 by increasing the affinity of the nucleotide-binding domains for nucleotides (185). Both mutations can increase the unliganded channel open probability, which leads to a decrease in both ATP and possible sulfonylurea block (11, 199). However, note also that in different MODY types different gene mutations occur (e.g., glucokinase gene GCK or genes encoding transcription factors HNF1α/4α, PDX), all affecting insulin secretion.
In this review, all the above-described aspects of the mitochondrial physiology of pancreatic β-cells will be discussed, including the “logical summation” principle of metabolic plus redox stimulation for the mitochondrial source of H2O2, which besides GSIS plays an essential role in insulin secretion stimulated by BCKAs (194) and partially by FAs (103). Without detailed knowledge of the redox system of pancreatic β-cells and their sensing of glucose or other secretagogues, the health issues that develop due to type 2 diabetes (107, 248) cannot be understood. Hence, we collected up-to-date knowledge on mitochondria as key players in the physiology of pancreatic β-cells and the pathology of diabetes.
Mechanisms of Insulin Secretion
Plasma membrane depolarization in pancreatic β-cells
The synergy of membrane channels
Quite recently, an explanation was suggested as to why a 100% closed KATP population is still insufficient to induce the threshold depolarization (−50 mV) of plasma membrane potential (Vp), required for CaV opening and thus for switching on action potential firing (119, 221). Vp should be shifted far more than enabled by the 100% KATP closure alone. This additional Vp shift can be facilitated by numerous “synergic” channels (210), namely by the opening of nonspecific calcium channels (NSCCs), such as transient receptor potential melastin (TRPM) channel-2 (TRPM2) (79, 123, 210, 285), or by the concerted action of chloride channels (45). Moreover, TRPM2 channels are activated by H2O2 (79, 84, 123, 223), hence they could theoretically also contribute to the “logical sum” of the redox plus metabolic (ATP) signal.
These “synergic” channels provide a small background inward current that cannot depolarize with an open KATP, but it is able to do so with a predominantly closed KATP ensemble since the NSCC conductance is then comparable to the small conductance provided by the remaining open KATP channels (KATP properties, Figs. 1 and 2). Also, the indirect inhibition of KATP by H2O2 was observed in smooth muscle cells (283).
The plasma membrane of β-cells possesses up to 60 channels belonging to 16 ion channel families (210, 280), with a distinct pattern in humans (101). Since the ∼130 mM [K+]in concentration inside the β-cell is much greater than outside ([K+]out ∼5 mM), there would be an equilibrium resting Vpequi of −82 mV, if only there was a K+-channel conductance. The actual VpResting is −75 mV (49); hence, NSCCs and other channels should provide this shift since NSCCs conduct any Na+, Ca2+, and K+. Evidence came from the observed depolarization reversal after the withdrawal of Ca2+ and Na+ at a 10 mM concentration of glucose ([glucose]) in mouse β-cells (213). Without this NSCC conductance, the established Vp would only be equal to Vpequi and the shift to −50 mV, required for CaV opening (212), would not take place, despite the 100% closed KATP ensemble (19, 119, 221, 239, 249, 280).
Besides there being a redox-activated TRPM2 channel (79, 123, 223), there are also the Ca2+- and cAMP-activated TRPM4 and TRPM5 channels in rodent β-cells (119), plus the heat-activated transient receptor potential vanilloid 1 (TRPV1, capsaicin receptor), TRPV2, TRPV4, or transient receptor potential canonical 1 and 3 (TRPC1, TRPC3) channels. TRPC3 provides an additional shift upon G-protein-coupled receptor (GPR) 40 receptor activation by FAs (276). Similarly, Cl− channels (SLC12A, SLC4A, SlC26A, GABAA, GABAB, and glycine receptor Cl−-channel) (45) and others (210) were implicated in Vp shifts, particularly volume-regulated anion channels (VRACs; e.g., the leucine-rich repeat containing 8-isoform A; LRRC8A) (45, 246). TRPM2 is also activated by nicotinic acid dinucleotide phosphate (NAADP) (247), elevated upon GSIS (160, 285). Interestingly, TRPM2 was also reported to interact with peroxiredoxin 2, from which it can receive a redox signal (168, 186).
Action potential firing begins at [glucose] > 6 mM in mouse β-cells (49), stimulated by reaching a depolarization of up to −50 mV. Above −50 mV, CaV opening [predominantly CaL with minor contribution of R-, N-, and P/Q-type Ca2+ channels (228)] is intermittent with the opening of the voltage-dependent K+ channels (KV) in mice (150) or calcium-dependent K+ channels (KCa) in humans (49) since KV (KCa) opening terminates Ca2+ entry, but their time-dependent deactivation allows a new 30–40 ms spike (210). Also, Na+ channels participate in upstrokes in a 30% β-cell population (289). Spikes return to a plateau Vp of −50 to −40 mV, the level of which is also adjusted by the two-pore K+ channels TASK-1 and TALK-1 (50, 264). At 10 mM [glucose], periods of a high and low frequency of action potential spikes exist, including burst and silent interburst phases (210).
The latter is explained by a transient ATP consumption by sarco/ER-Ca2+-ATPase (SERCA) and plasma membrane Ca2+-ATPase (PMCA), that is, ATPases removing Ca2+ (252, 253). At >20 mM glucose, ATP synthesis is thought to overcome its consumption, leading to a permanent action potential firing (49), upon which 100% of KATP channels close (210). The amplitude becomes reduced by 15 mV after ∼3 min.
The resulting pulsatile Ca2+ entry elevates the cytosolic Ca2+ concentration [Ca2+]c. The accumulated Ca2+ pool acts simultaneously on the protein exocytotic machinery and thus stimulates the pulsatile Ca2+-dependent exocytosis of IGVs (213, 214, 260). In human PIs, the threshold is −60 mV, the frequency of action potential spikes is higher, whereas 5 ms spikes are grouped into shorter ∼2 s groups and their termination upon lowering glucose is slow (211). As for the [glucose] dependence in mice, 50% of KATP closing was already reported at 3 mM, keeping Vp constant; while at 5 mM 93% and at 10 mM 97% of KATP channels were closed (251). Thus, Vp depolarization is due to the closure of remaining ∼7% KATP in mouse PIs when [glucose] is increased above 5 mM (235).
In mouse β-cells, CaV isoforms CaV1.2 and CaV1.3 are responsible for 50%, CaV2.1 for 15%, and CaV2.3 for 25% of the whole-cell Ca2+ current, which is activated at −50 mV (228). Interestingly, R-type CaV2.3 channels were reported to open exclusively during the second phase of GSIS (109). The protein kinase A (PKA) phosphorylation of CaV1.2 and CaV1.3 enhances their activity (122). Note that different groups of channels, not only CaV, are involved in action potential spikes in different species, cultured cells or even within individual cells of PIs (210), which is outside the scope of this review.
The deactivation of CaV is switched predominantly by the opening of KV2.1 in rodents (150, 213) or KV2.2 and KCa1.1 channels (BK channels) in humans (49, 101). A delayed rectifier K+ current is induced at positive Vp down to −30 mV (215). The opening of KV2.1 channels repolarizes Vp and thus closes CaV channels. The ablation of KV2.1 reduced Kv currents by ∼80% and prolonged the duration of the action potential, secreting more insulin. Mice with ablated KV2.1 exhibited lower fasting glycemia, but elevated insulin, and improved GSIS (100). Interestingly, glucose, glyceraldehydes, and 2-ketoisocaproate (KIC) were reported to increase Kv currents (284).
Ca2+ oscillations
Besides synergy with other channels, CaV opening intermittent with KV opening leads to Vp oscillations (action potential firing) (91), which induce primary oscillations in [Ca2+]c (210). The latter is further modulated by a Ca2+ efflux from the ER (49, 280), lysosomes, IGVs, or mitochondria (see the Mitochondrial Ca2+ Signaling in Pancreatic β-Cells section). However, the ER Ca2+ efflux cannot be initiated without the preceding primary CaV-mediated Ca2+ influx. The two components are superimposed, that is, fast cytosolic Ca2+ oscillations with 2–60 s periods and slow Ca2+ oscillations with periods reaching up to several minutes (15, 73). The resulting complex Ca2+ oscillations finally induce pulsatile insulin secretion. One can predict more IGVs to be secreted with a higher time-integrated cytosolic Ca2+concentration.
Basic mitochondrial contribution to insulin secretion
ATP supply and its regulation in pancreatic β-cells
Undoubtedly, increasing ATP synthesis by OXPHOS with increasing [glucose] is the first prerequisite for GSIS (152, 156). OXPHOS respiration is determined as the oxygen consumption rate (OCR). The OCR of cultured β-cells or PIs, incubated with low (insulin nonstimulating) [glucose], increases after further glucose elevation (193). Simultaneously, mitochondrial IMM potential ΔΨ m also increases, indicating that the OCR increase is not due to uncoupling (protonophoric action), but stems from faster ATP synthesis, while the respiratory proton pumps are fully coupled via the protonmotive force (Δp = ΔΨm + ΔpH) to the H+ backflow through the ATP synthase.
OXPHOS can be semiquantified, when accounting for the ratio (R r) of OCR to OCROligo. OCROligo values of nonphosphorylating respiration are set by oligomycin, blocking the ATP synthase, hence driven by the H+ leak. For rat INS-1E cells, the ratio R r exhibits a sharp increase between 3 and 8 mM [glucose] with AC50 at ∼3.5 mM and saturation at >8 mM [glucose] in INS-1E cells (193). This AC50 roughly corresponds to the half-maxima of the surplus in the total cell ATP and in the insulin secretion rate (116). For human healthy and diabetic PIs, AC50 of 4.4 and 5.5 mM were found, respectively (47).
The parameter A r, where A r = (OCR − OCROligo)/OCRFCCP, follows a very similar relationship to AC50 (193), reflecting the fraction of the maximum respiration (OCRFCCP) capacity used for ATP synthesis. The extent of this sharp increase in R r or A r perfectly correlates with the [glucose] range for which 50%–100% closure of the KATP ensemble proceeds, despite different ranges for rat versus mice versus human PIs (see The Synergy of Membrane Channels section). With oligomycin, the closure of the KATP ensemble in INS-1E cells is incomplete (194).
When a major fraction of ATP synthase molecules are incapable of synthesizing ATP in INS-1E cells, such as upon silencing of the subunit DAPIT, GSIS is virtually unchanged, although elevations of ATP were only ∼10% of those in nontransgenic cells (134). This interpretation stems from the reasoning that the second leg required for GSIS (i.e., redox signaling) was preserved, and the established lower ATP was able, together with H2O2, to close KATP (or simultaneously open TRPM2).
With isolated rat PIs, elevations from resting 2 mM up to insulin-stimulating 4 mM [ATP] (at 10 mM [glucose]) were found (43), while AC50 at ∼3 mM was reported for the total ATP rise and 50% KATP closure in mouse PIs, not correlating with AC50 of ∼12 mM for GSIS (210). Perhaps specific AC50 for the first phase should be considered. In α-toxin-permeabilized PIs, the 84% KATP closure occurred already at 1 mM ATP (251). The perifusion of human PIs with up to 7.5 mM [glucose] leads to ∼30% of maximum GSIS (267), with insulin release observed beginning at 3 mM (89). In humans, blood glycemia of 7.5 mM stimulates a fivefold increase in insulin (266). Note that there is no sudden increase in glucose after a meal in humans, instead glycemia increases over ∼30 min from ∼5 to 8 mM (61).
Description of the diabetic phenotype is out of scope in this review [but cf. Refs. (5, 17, 107, 248)]. Type 2 diabetes etiology originates not only from the impaired molecular mechanisms of insulin secretion but also from low-grade inflammation causing insulin resistance and promoting β-cell oxidative stress, ER stress, and cell death. Pancreatic β-cells first attempt to compensate the glucotoxic metabolic demand by enhancing their mass, which also elevates insulin production. Still, their exhaustion induces further pathogenesis, impaired β-cell biogenesis, leading to dedifferentiation and dysfunction (20). This further deteriorates insulin secretion. During the β-cell mass expansion phase of the type 2 diabetes development, the first GSIS phase is often missing, whereas the second phase is enhanced and prolonged, so higher time-integrated insulin release exists. This was therefore termed hyperinsulinemia (117).
Regulations of ATP synthase by ATPase inhibitory factor 1
Searching for factors that adjust the [glucose] range to the sensing one (3–8 mM in INS-1E cells), we found ATPase inhibitory factor 1 (IF1) to be a key element (115, 116) (Fig. 3). This regulation adds to well-known settings of the sensing [glucose] range due to other factors, including the proper Km of rodent glucose transporter GLUT2/SLC2A2 (human GLUT1/SLC2A1), Km, and the lack of product inhibition for glucokinase, existing smooth fluxes of glycolysis that supply the Krebs cycle, followed by the efficient supply of substrates (NADH, succinate) for the respiratory chain and OXPHOS (227, 290). Note that glucokinase is considered a glucose sensor. This notion is supported by its importance since inactivation of both glucokinase alleles leads to the maturity-onset diabetes of the young type 2 (MODY-2). Nevertheless, this causes defective KATP regulation (205).
IF1 was thought to be able to only inhibit the reverse mode of the ATP synthase, in which H+ ions are pumped into the intracristal space (ICS) across the c-subunit-ring of the membrane FO moiety, whereas the energy is supplied by ATP hydrolysis to ADP ongoing at the F1 moiety. This is unlikely in primary cells; in cancer cells, this mode is mixed with the regular ATP synthesis (269).
However, evidence was found for the inhibition of ATP synthesis by IF1 in vivo (115, 116). A mild partial inhibition of a fraction of the ATP synthase (Fig. 3) may just set the proper glucose-sensing range in pancreatic β-cells. With silenced IF1 in INS-1E cells, the insulin secretion dependence on [glucose] was shifted far left with AC50 ∼1 mM (115). A similar shift with increasing [glucose] was observed for the glucose-induced surplus in total cell ATP, which was always higher in IF1-silenced cells (fivefold higher at 1 mM; about twice at 7 mM [glucose]), reflecting a mild inhibition of ATP synthesis in control cells. In contrast, the IF1 overexpression in INS-1E cells inhibited GSIS, so that the maximum saturated insulin release was about half, whereas AC50 was slightly right-shifted to 4.5 mM (116). A more profound shift to ∼7 mM was observed for the [glucose] dependence of cell surplus ATP levels, which were about halved at 1 mM and ∼25% at 7 mM glucose (116). These results reflected the ATP synthase inhibition in vivo by the excessive (overexpressed) IF1.
Structural aspects of IF1 interaction with ATP synthase versus cristae morphology
ATP synthase dimers are organized in arrays or rows along the crista rims (Fig. 3C), while actually determining the morphology of cristae. If we can approximate the two neighboring dimers by the revealed structure of the tetrameric porcine ATP synthase (80), we can also speculate on the actual IF1 localization in vivo.
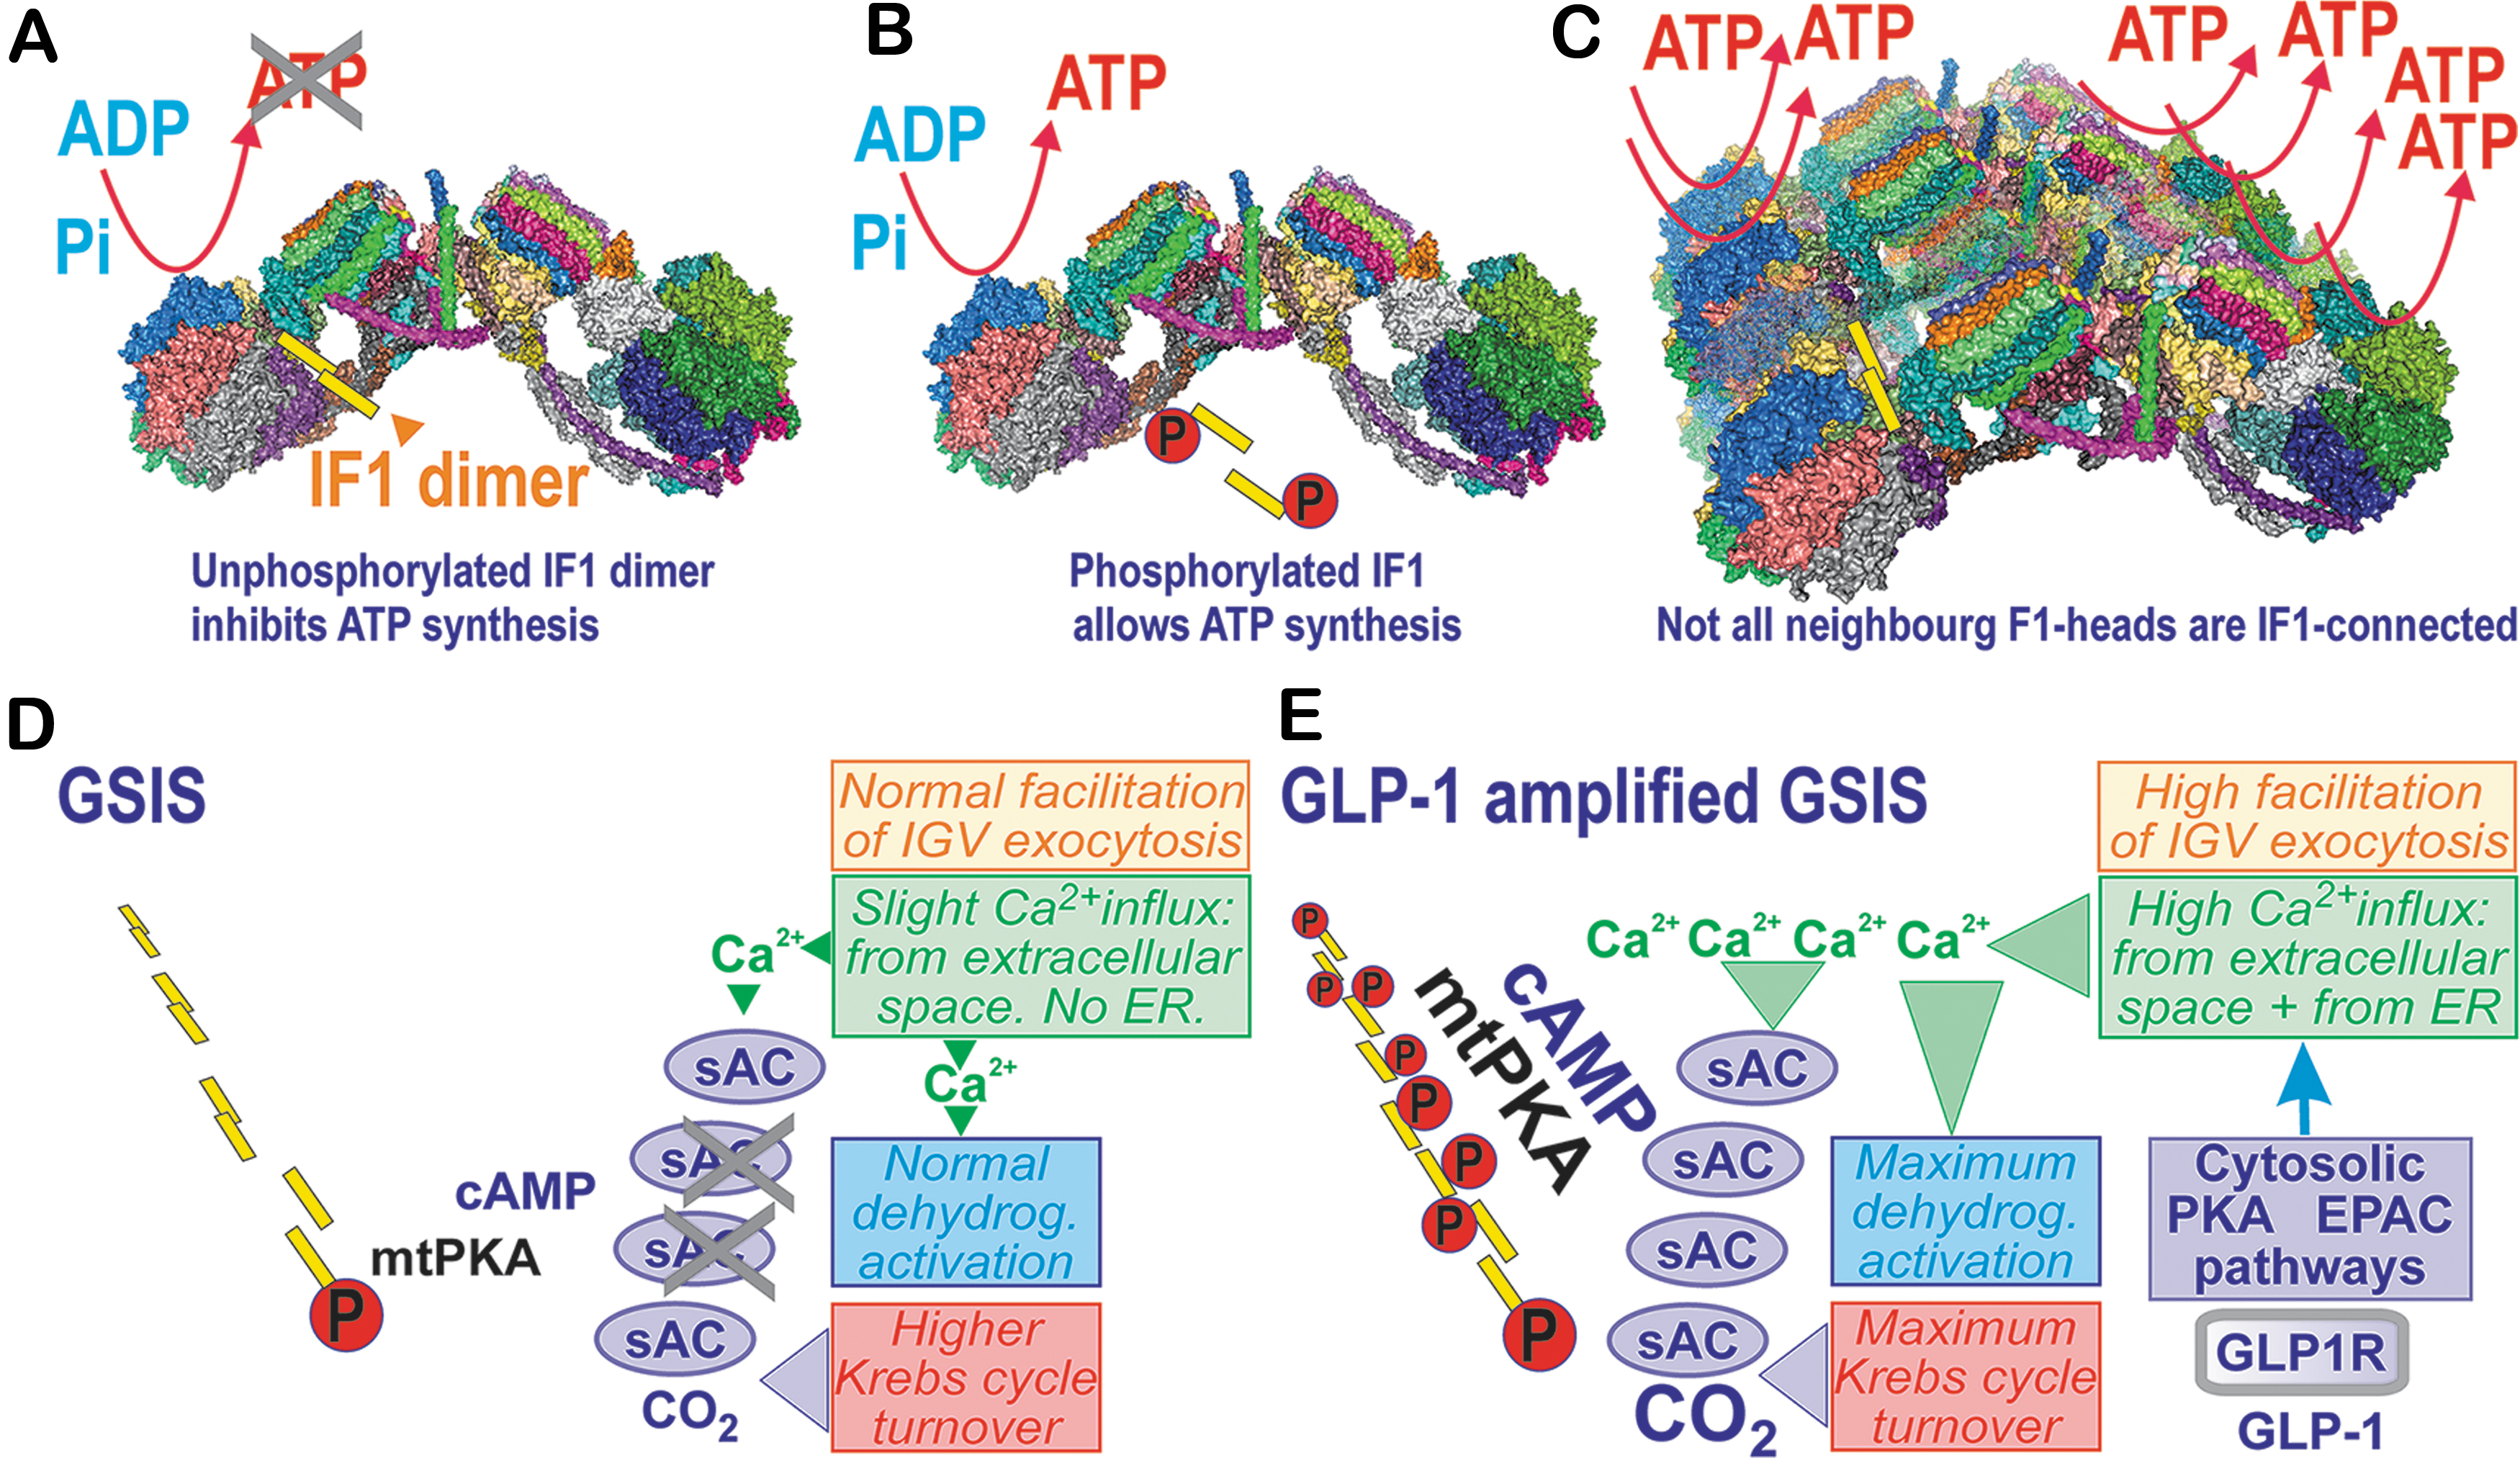
The IF1 dimers bridge the two F1 moieties, however, not those within a single ATP synthase dimer, but between two neighboring dimers (Fig. 3A–C) (80). These connections (bridges) via the dimeric IF1 are lifted above the membrane of the crista edge. The membrane at this edge is bent into a sharp rim purely due to the single FO-dimer structure. IF1 is attached to the bottom of the interface between the α- and β-subunit, where it meets with the γ-subunit of the F1 moiety (74, 80). Speculatively, one may assume that both the F1 moieties bridged with the IF1 dimer cannot synthesize ATP. In this instance, not all dimers along the ATP synthase row of dimers could be connected by the IF1-IF1 bridges since if this was the case, no ATP synthesis could exist; all F1 moieties would be inhibited.
Moreover, the IF1 dimerization is prevented when IF1 is phosphorylated on Ser39 by PKA (68, 69). Also, fast degradation via the factor IEX1 was reported (230). Therefore, not only the regulation of IF1 expression versus degradation (53) but also PKA signaling provides fine-tuning of ATP synthesis. We hypothesize that the multifaceted natural regulation of IF1 and/or all ATP synthase subunits (including mtDNA-encoded) sets the proper activity within the ensemble of ATP synthases, which provides the properly adjusted rate of ATP synthesis in pancreatic β-cells. This complex regulation predetermines the glucose sensing that starts between 3 and 4 mM (strictly dependent on the elevated NOX4-redox signal) in INS-1E cells or isolated mouse PIs.
When the fraction of phosphorylated IF1 increases within the matrix, an even higher rate of ATP synthesis can be achieved, as simulated by IF1 silencing or additions of dibutyryl-cAMP, which increased cytosolic ATP levels (115). Also, GSIS was upregulated after the dibutyryl-cAMP treatment, but the upregulation ceased in IF1-knockdown cells, indicating that the IF1 phosphorylation enabling higher ATP synthesis was the important component of this mechanism. The dibutyryl-cAMP treatment also compensated the suppressing effect of IF1 on the cytosolic ATP and on the total released insulin amount (116).
Mitochondrial PKA pathways in pancreatic β-cells
PKA either phosphorylates suitable protein residues exposed to the cytosolic face of the outer mitochondrial membrane (OMM; PKAOMM) or even proteins of the mitochondrial matrix (mtPKA) (78, 292). The latter implies the existence of sensors leading to cAMP signaling in the matrix (187, 287). Thus, adenylyl cyclase mt-sAC (soluble adenylyl cyclase), phosphodiesterase mtPDE2A2 (2), and also mtPKA (286), were identified to be localized in the matrix. Indeed, the GPR receptor activator forskolin induced the phosphorylation of matrix proteins, such as IF1 (68, 69). cAMP cannot freely diffuse into the matrix, and no cAMP carrier is known (2); hence, the matrix cAMP pool is independent of the cytosolic one (44, 46). The ICS-localized or peripheral intermembrane space-localized PKAIMS might phosphorylate the Complex IV COXIV-1 subunit, which prevents its inhibition by ATP and hence enhances respiration and OXPHOS (39). For PKAIMS, one could expect the cytosolic cAMP to penetrate at least to the peripheral intermembrane space.
Matrix mt-sACs are hypothetically activated by elevated matrix Ca2+, while experiments reported mt-sAC activation by bicarbonate, which increased matrix cAMP (34, 132). Nevertheless, no mtPKA activation under these conditions was found (132). Since CO2 is increasingly released when the Krebs cycle turnover is elevated, mt-sAC activation could occur upon the metabolic stimulation of insulin secretion. Similarly, increasing responses of matrix [Ca2+]m to cytosolic Ca2+ oscillations and Ca2+ efflux from the ER (Fig. 3D, E) may activate the matrix mtPKA (3), the existence of which was found in Drosophila (286). Thus, OXPHOS is facilitated in the mitochondria of numerous tissues due to the Hsp70-mediated import of the NDUFS4 subunit of Complex I, initiated by phosphorylation, as well as by the phosphorylation of IF1 (69, 115, 116). The observed release of the PKA catalytic subunits by the increased ROS is also noteworthy (216, 243).
Mitochondrial Ca2+ Signaling in Pancreatic β-Cells
Contribution of mitochondrial Ca2+ to insulin secretion
Stimulation of matrix dehydrogenases and OXPHOS machinery by mitochondrial Ca2+
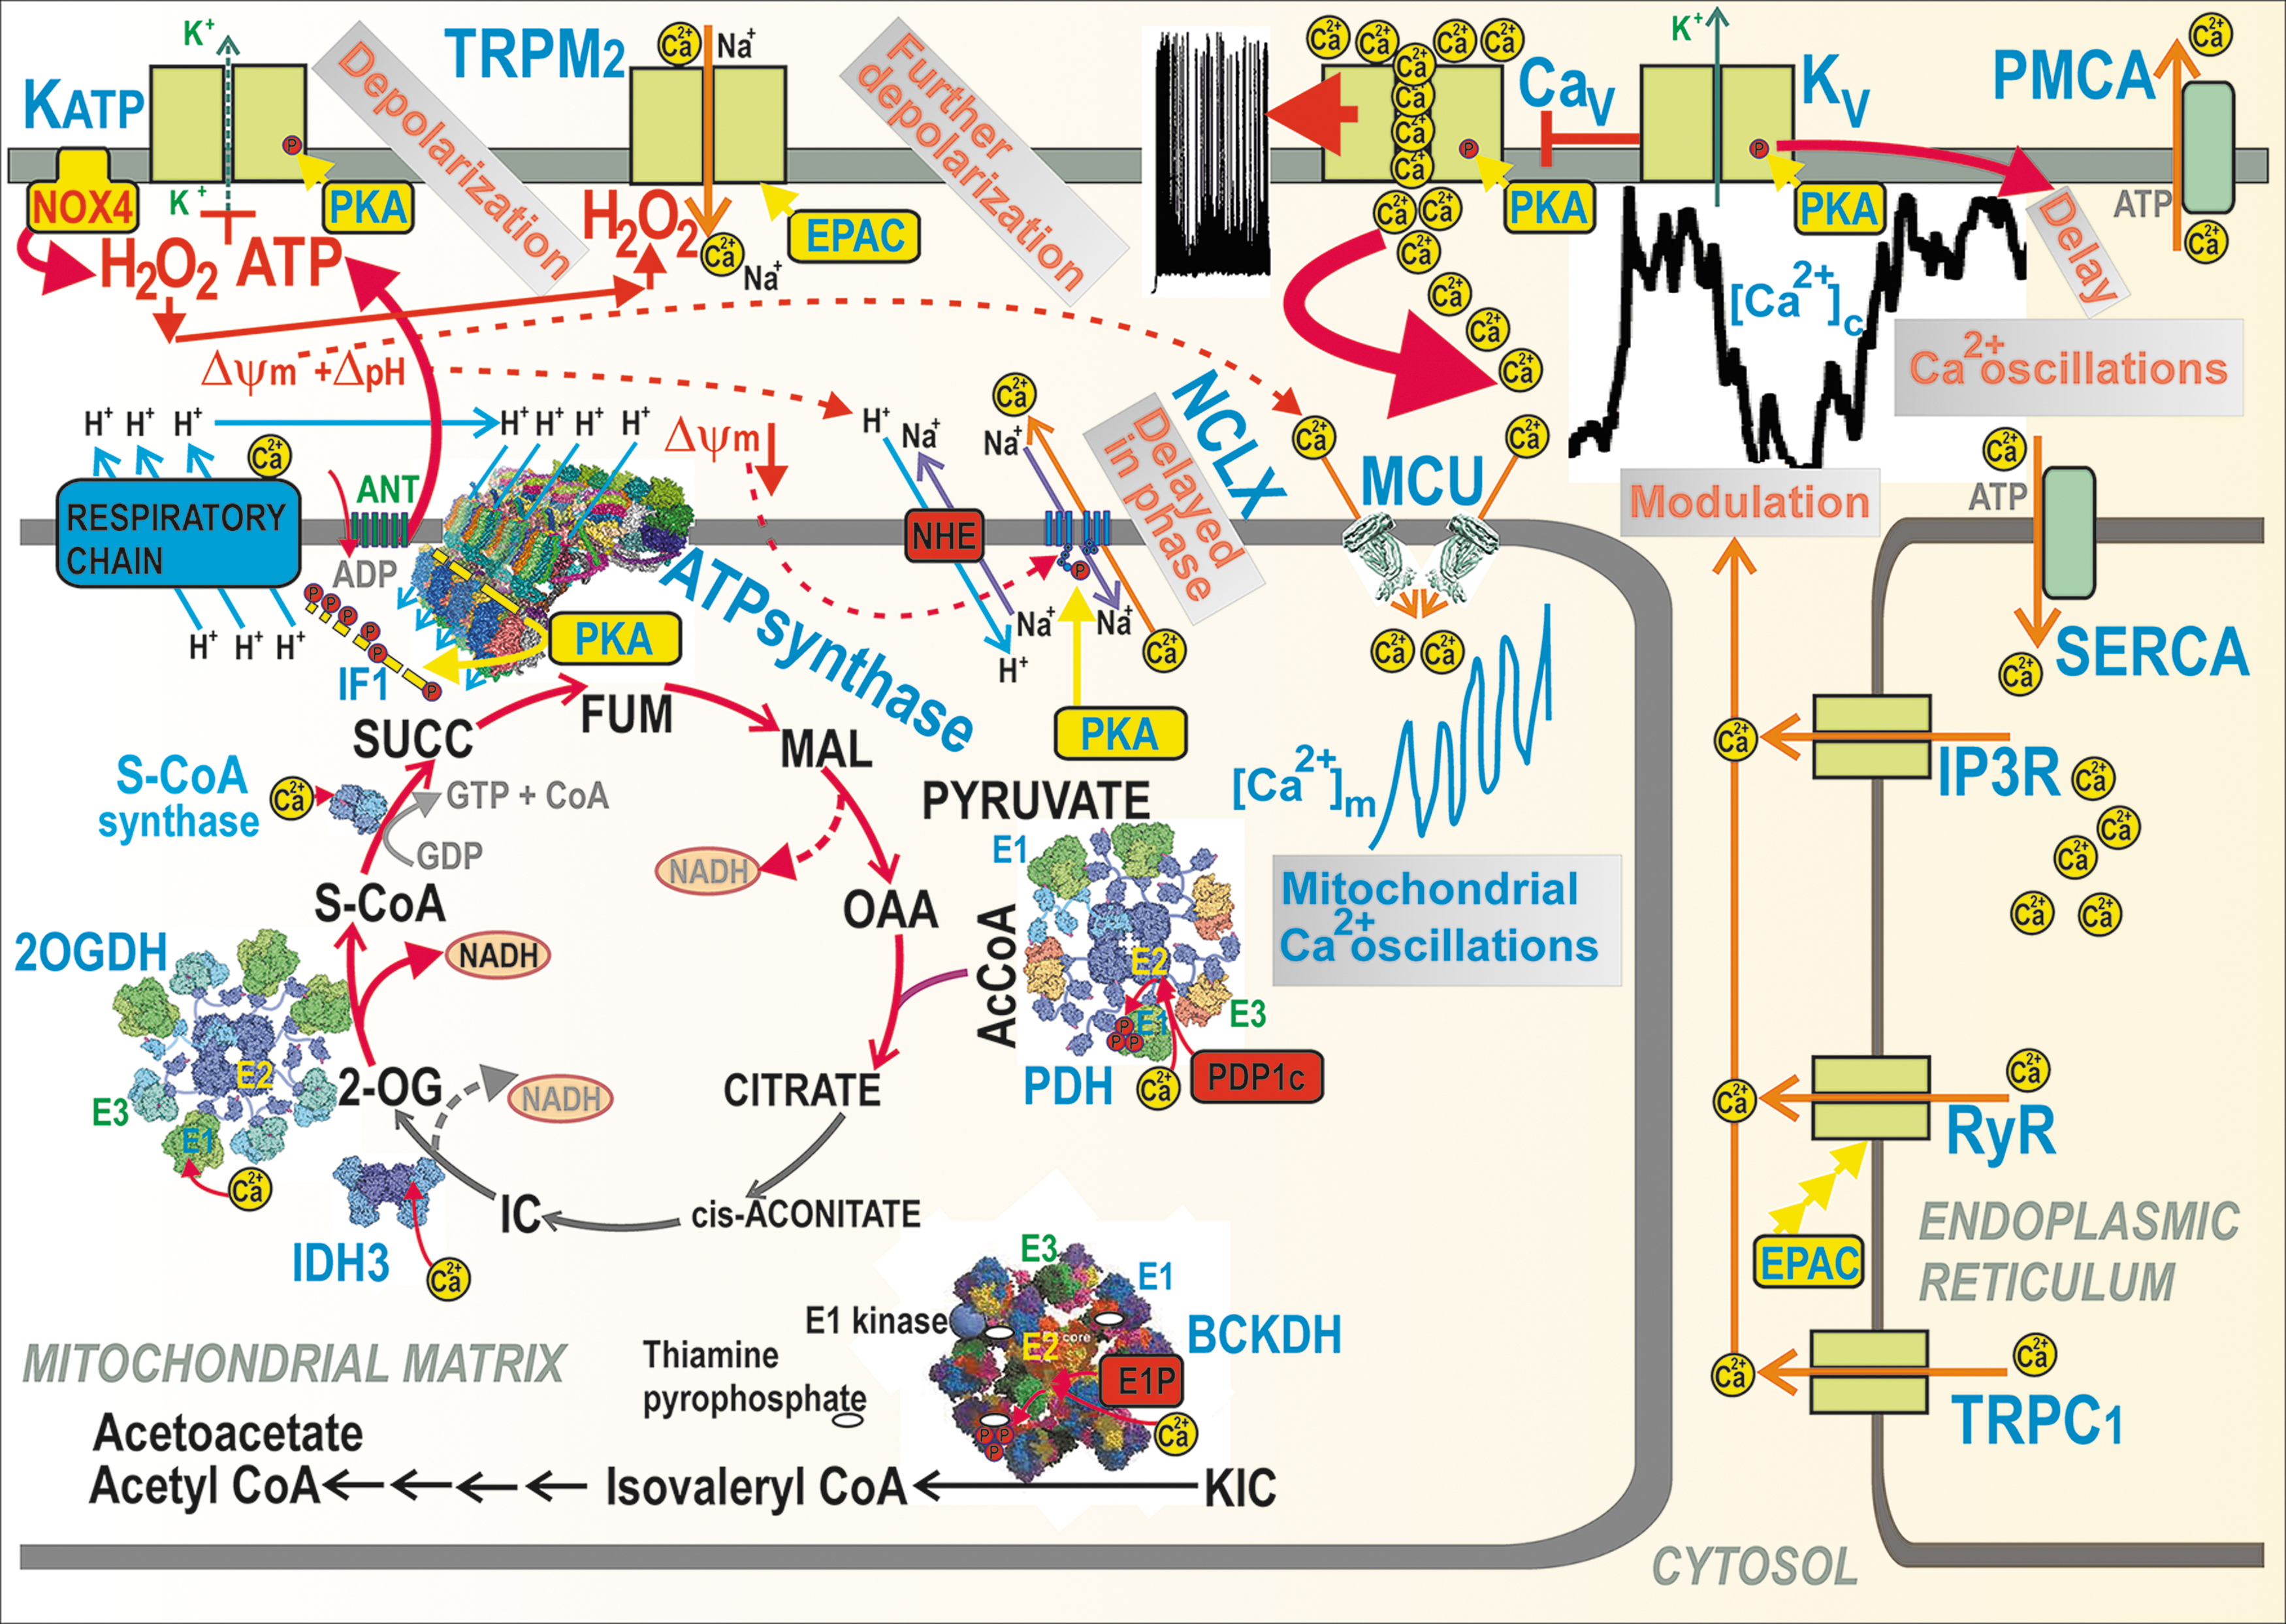
The stimulation of matrix dehydrogenases upon GSIS is one of the most plausible benefits provided by the Ca2+ influx into the matrix via the mitochondrial calcium uniporter (MCU) complex (41, 70, 71) (Fig. 4). The FAD-glycerol-3-phosphate dehydrogenase, localized on the outer IMM surface, is then instead influenced by the cytosolic Ca2+ penetrating into the intramembrane space or ICS (4, 165, 219, 252). Ca2+ activation was also reported for mt-sAC (34, 44, 46), which hypothetically leads to the phosphorylation of IF1 (69, 115, 116) by a putative matrix mtPKA (3, 132). mtPKA releases the IF1-mediated inhibition of the ATP synthase, thus enhancing ATP synthesis (69). A link to Ca2+ was suggested for the observation of 50% GSIS suppression upon ablation of the GTP-providing succinyl-CoA (S-CoA) synthetase, whereas the ablation of its ATP-providing form accelerated GSIS (126). We conclude that the mitochondrial Ca2+ transport represents a key factor of GSIS dependence on mitochondria.
Mitochondrial Ca2+ transport upon GSIS
The mitochondrial matrix content of bound Ca2+ and the free Ca2+ concentration [Ca2+]m (124) are finely regulated by the ΔΨ m-driven Ca2+ influx via the MCU complex (41), which is balanced by the Ca2+ influx, conducted by the Ca2+/2Na+ antiporter (mitochondrial sodium calcium exchanger [NCLX]) (38). The latter is driven by ΔpH via the Na+/H+ antiporter (plausibly NHE6/SLC9A6). Hypothetically, LETM1 may also ensure Ca2+/2H+ antiport, thus extruding Ca2+ from the matrix (202).
Mitochondrial Ca2+ participates in the first GSIS phase (70) and in GSIS potentiation by GLP-1 (71, 218). A sudden [glucose] elevation in primary β-cells induces the concomitant CaV-dependent [Ca2+]c oscillations, which are relayed to delayed steady-state increases in mitochondrial [Ca2+]m up to saturation (252, 253). The observed [Ca2+]m oscillations, superimposed onto the linearly increased [Ca2+]m, are roughly in phase with [Ca2+]c oscillations. The higher the frequency of the action potential spike within a burst, the higher [Ca2+]m amplitude was reached (252). These changes induced a biphasic increase in the ATP/ADP ratio with its second phase after 5 min (124, 252, 253).
The mechanism behind this is probably enabled by slightly retarded NCLX responses, in which Ca2+ influx exceeds the Ca2+ efflux during these transients and during the entire nearly linear [Ca2+]m increase up to saturation. The major effect of such integrally elevated [Ca2+]m is in the well-known Ca2+ activation of mitochondrial dehydrogenases (4, 164, 165, 219, 252) [doubted in Drews et al. (48)] (Fig. 4).
One cannot identify the above-described second phase in the ATP/ADP increase with the second GSIS phase, nevertheless in MCU-deficient β-cells, such a second-phase-ATP/ADP-increase was missing (252, 253). The [Ca2+]m responses were slightly shifted up upon NCLX silencing (253). Insulin release from primary β-cells, monitored using Zn2+ as a surrogate, was stimulated either by high [glucose] independent of MCU deficiency (which led to delayed responses) or by KATP closing with tolbutamide, which ceased upon MCU deficiency (252). Hence, the activation of dehydrogenases was also delayed and was probably responsible for the observed second-phase ATP/ADP increase.
The overexpression of the Ca2+-binding protein S100G in the matrix of INS-1E cells prevented [Ca2+]m increases responding to [Ca2+]c, blocked the glucose stimulation of respiration and ATP, thus reflecting the prevention of OXPHOS upon impaired [Ca2+]m responses (271). Typical [Ca2+]m elevations up to 880 nM dropped to 530 nM. In primary β-cells, S100G overexpression specifically attenuated the second GSIS phase, while the first phase did not decrease (271). This reflects a delay required for the full-extent activation of matrix dehydrogenases. In a more exaggerated way, this effect is also manifested during GSIS amplification by GLP-1 (90, 258).
Experiments suggested the essential requirement of MCU for GSIS in mice with an ablated MCU-pore, specifically in pancreatic β-cells (70). The insulin release was suppressed the first 5 min following the glucose administration, but after that, the time-integrated insulin release was equal to controls. Thus, in-phase MCU-mediated increases in [Ca2+]m concomitant with [Ca2+]c oscillations upon GSIS or GLP-1 amplification of GSIS (see the Mitochondrial Ca2+ Homeostasis upon Receptor-Augmented Insulin Secretion section) are among the precise mitochondrial machinery, which is required for optimum ATP synthesis.
The MCU complex is composed of the regulatory scaffolds MCU regulator 1 (MCUR1), the essential MCU regulator element (EMRE), and three isoforms of Ca2+-channel/sensors, termed mitochondrial calcium uptake proteins 1, 2, and 3 (MICU1,2,3) (127, 191). Mitochondrial Ca2+ transporters are well known to respond to Ca2+ released from the ER. This is reflected by the silencing of either MCU or MICU1, which reduced [Ca2+]c oscillations and respiration rates and also decreased ATP production and GSIS (4). MCU was found to be activated by kaempferol (22).
A higher ΔΨ m allosterically blocks NCLX, hence Ca2+ efflux, and thus increases [Ca2+]m (129). Mechanistically, this requires the interaction of Ser258 with positively charged residues of NCLX, which is disrupted by PKA phosphorylation, hence NCLX becomes insensitive to ΔΨ m, and thus active. For pancreatic β-cells, this regulation implies a low NCLX activity at low [glucose] but high activity upon insulin-stimulating [glucose] (129). Speculatively, this allosteric effect may be behind the oscillation of [Ca2+]m since each cycle of MCU-mediated Ca2+ influx may transiently or locally decrease ΔΨ m, whereas the concomitant fraction of imported Ca2+ partially upregulates OXPHOS, hence adds to ΔΨ m, which in turn would activate NCLX. The regulation of OXPHOS by cytosolic Ca2+ penetrating into the ICS probably occurs via the Ca2+-induced activation of Complex IV subunit Cox4.1, which disrupts its feedback inhibition by ATP (39, 114, 203). The impact on GSIS is yet to be studied.
Synchronization of cytosolic and mitochondrial Ca2+ upon GSIS
Within rodent islets, cooperation between β-cells exists. Synchronization of the electrical activity of the plasma membrane potential within the ensemble of cells in the islet results in synchronization of their cytosolic Ca2+ oscillations and other events (99, 111, 218). A few percent of pacemaker-like β-cells provides such synchronization. These cells were termed hub cells. Since it has been recognized that the second GSIS phase exists in PIs, but not in the β-cells isolated from islets, this cell cooperation was considered to substantiate the second phase. But, the delayed kinetics of the insulin granules (104) plus intercellular synchronization act in parallel.
Of course, major synchronization takes place within the individual β-cells. At first, the initial rise in ATP plus H2O2 upon elevating glucose sets the triggering event for CaV channels by closing KATP, whereas H2O2 can hypothetically also activate TRPM2 channels. With other NSCCs or other synergic channels, depolarization reaches up to the −50 mV threshold of Vp, ultimately activating action potential firing due to the intermittent opening of CaV channels and KV channels.
Second, the pulsatile Ca2+ influx from the exterior causes cytosolic Ca2+ oscillations. Specifically at intermediate [glucose], such as ∼10 mM, Ca2+ oscillations might be terminated because of the transient exhaustion of cytosolic ATP by PMCA and SERCA (252, 253), thus creating silent interburst phases (210) [see the lag between burst [Ca2+]c phases in Fig. 4—part of the records published in Plecita-Hlavata et al. (194)]. Moreover, under the activation of receptors, such as GPR (inositol-1,4,5-triphosphate receptor-diacylglycerol [IP3-DAG] signaling) or GLP-1 receptor (PKA and EPAC2 pathways), an additional amplifying Ca2+ efflux, is induced from the ER, via Ca2+ channels of TRPC1, ryanodine receptor (RyR), or IP3 receptor (IP3R). This ER Ca2+ efflux modulates and superimposes onto the existing cytosolic Ca2+ oscillations.
Third, cytosolic Ca2+ oscillations are relayed to the matrix, causing oscillations in [Ca2+]m superimposed onto the steady-state increasing [Ca2+]m levels (252, 253). This is hypothetically allowed by the in-phase delayed Ca2+ efflux mediated by the NCLX Ca2+/Na+ antiporter, behind the instantly acting MCU. NCLX is inhibited by a higher ΔΨ m, but due to higher ATP synthesis and concomitant H+ backflow via the ATP synthase c-ring, ΔΨ m is partially diminished, leading to NCLX activation (129). The Ca2+ uniport via MCU is driven by the ΔΨ m component of the protonmotive force Δp, whereas the electroneutral Ca2+/2Na+ antiport by NCLX is driven by the Na+-gradient, established by the Na+/H+ antiporter (NHE6), which is then driven by the ΔpH component of Δp.
Fourth, besides the matrix mt-sAC, the resulting [Ca2+]m elevation activates matrix dehydrogenases (42, 164, 218) in the set pace, specifically: (i) the 8-MDa multienzyme complex of pyruvate dehydrogenase (PDH), in which Ca2+ binds to heterodimers of the E2 PDH subunit and the catalytic subunit of pyruvate dehydrogenase phosphatase (PDP1c) within the core of the complex, which leads to the PDP1-mediated dephosphorylation of E1 subunits. The PDH-complex contains a hollow core of numerous dihydrolipoate acetyltransferase subunits (E2), plus 12 E3-binding subunits (E3BP). E3BP attaches subunits of pyruvate decarboxylase (E1) and dihydrolipoate dehydrogenase (E3). Since the phosphorylated E1 causes the inhibition of the overall PDH reaction, the Ca2+-activated dephosphorylation is therefore the key event for the PDH activation (42).
(ii) BCKA-dehydrogenase (BCKDH) complex is activated by mechanism similar to (i), in which Ca2+ activation of the E1P-phosphatase occurs, which dephosphorylates the E1 subunit, which is otherwise inhibited by the phosphorylation enabled by the BCKDH-E1-kinase, and this is in turn inhibited by the cofactor thiaminepyrophosphate. Since the thiaminepyrophosphate-mediated kinase inhibition is strengthened by Ca2+, hence Ca2+ activates BCKDH (180). Moreover, there is a direct Ca2+-induced activation for (iii) Ca2+ binding to the E1 subunit of the 2-oxoglutarate dehydrogenase (2OGDH) multienzyme complex; (iv) Ca2+ binding to βγ-subunit interfaces of the hetero-octameric NAD+-dependent isocitrate dehydrogenase 3 (IDH3) (42), and (v) Ca2+ activates the GTP-producing S-CoA synthase by as yet unknown mechanism (126).
Mitochondrial Ca2+ homeostasis upon receptor-augmented insulin secretion
Signaling by GLP-1 receptor for the amplification of GSIS
Produced in intestinal L-enterocytes, GLP-1 from the bloodstream activates its receptor (GLP1R) on the plasma membrane of pancreatic β-cells (170). GLP1R activation preferentially stimulates G-proteins Gαs, but also Gαq or Gα11 (Fig. 10), and recruits β-arrestin, depending on a biased agonism differently to different agonists, such as exendin-4 and oxyntomodulin (238, 275).
A scaffold protein β-arrestin promotes signaling via Gαs to cAMP, but also to CREB (238), extracellular regulated kinase ERK1,2 (169), and insulin receptor substrate 2 (IRS-2). This activates β-cell growth, differentiation, and β-cell identity maintenance (238). The major Gαs stimulation spreads signals via enhanced cAMP (65, 133, 177) and the initiation of PKA (143), plus the enhanced signaling via exchange proteins directly activated by cAMP 2A-isoform (EPAC2A) pathways (120). However, a putative cAMP-independent pathway may also exist at physiological 1–10 pM [GLP-1] (231). Prolonged cAMP production could even be induced by internalized GLP1R, which partly potentiates GSIS (255). Ex vivo, GLP-1 was found to act at a low range of stimulating [glucose] 6–7.5 mM (5–6 mM in isolated β-cells) (65, 133, 177, 231), which paradoxically is equivalent to fasting glycemia in mice.
The PKA pathway activation leads to a surplus [Ca2+]c above that of the net GSIS (i.e., without any receptor stimulation) (151). This is achieved by the phosphorylation of KV channels, leading to their deactivation. This prolongs the overall Ca2+-stimulation signals and induces somewhat lower frequencies of Ca2+ oscillations, but with each spike lasting longer (231, 265). Also, the second phase of GSIS might be potentiated by such mechanisms. Speculatively, the PKA-pathway evoked [Ca2+]c surplus may activate Cox4.1 in the ICS if the concentration therein would reflect [Ca2+]c. PKA also phosphorylates snapin, a protein of the exocytotic machinery. This promotes soluble N-ethylmaleimide-sensitive factor (NSF) attachment protein receptor (SNARE)-complex formation by the interaction of synaptosomal nerve-associated protein 25 (SNAP-25) with synaptogamins of IGVs. Thus, exocytosis is facilitated within the first GSIS phase (236, 237).
A parallel EPAC2A pathway activation by the GLP1R signaling stimulates TRPM2 channels (285), providing the essential shift in depolarization in synergy with KATP and thus triggers the action potential firing. EPAC2A also enhances KATP closing (40, 75, 121). The EPAC2A pathway also promotes the docking and priming of IGVs by allowing Rab3A interaction with Rim2α (282); and a hypothetical interaction of EPAC2-Rim2α-Picollo trimers with Rab3A, again facilitating IGV exocytosis (254). Also, Ca2+-release is activated from the ER via the RyR-, which depends on CaV opening (120). A biased GLP1R stimulation via Gαq/11 may also stimulate Ca2+ release from the ER now via IP3R (23) and via TRPM4 and TRPM5 activation due to phosphorylation by protein kinase C (PKC) (231).
Experiments using simultaneous electrophysiological and Ca2+ oscillation monitoring (with Ca2+ fluorescent probes) found that at 2 mM glucose, but with 200 μM tolbutamide blocking KATP (265), the GLP-1 analog liraglutide decreased the frequency of action potential spikes, which became individually wider. This reflects the PKA-mediated inactivation of Kv2.1 channels. With or without liraglutide, each action potential spike matched the triangular peak of the cytosolic Ca2+ rise. Its time-width increased from 2 s to about 5 s with liraglutide (265). The relative duration versus the active phase of Ca2+ spikes was ∼10% at 4 mM, ∼50% at 7 mM, and ∼80% at 9 mM glucose (59). Earlier experiments at 7.7 mM glucose and with GLP-1(7 -36)amide (preproglucagon78-107) also reported an increased duration of active and silent electrical activity (58).
Importantly, the observed delayed decay of Ca2+-responses is not only determined by the prolonged action potential spikes but is also affected by Ca2+, released from the intracellular stores, especially the ER, but also from mitochondria. The relay of these complex Ca2+-responses onto the in-phase intermittent responses of proteins of the exocytotic machinery (formation of SNARE complexes) and the resulting pulsatile IGV exocytosis were also monitored by surveying the ATP-activated currents conducted by the artificially overexpressed P2X2 cation channels (145). This was possible due to IGVs containing a high ATP concentration.
Mitochondrial Metabolism of Pancreatic β-Cells
Redox shuttles provided by several mitochondrial anion carriers
Redox shuttles
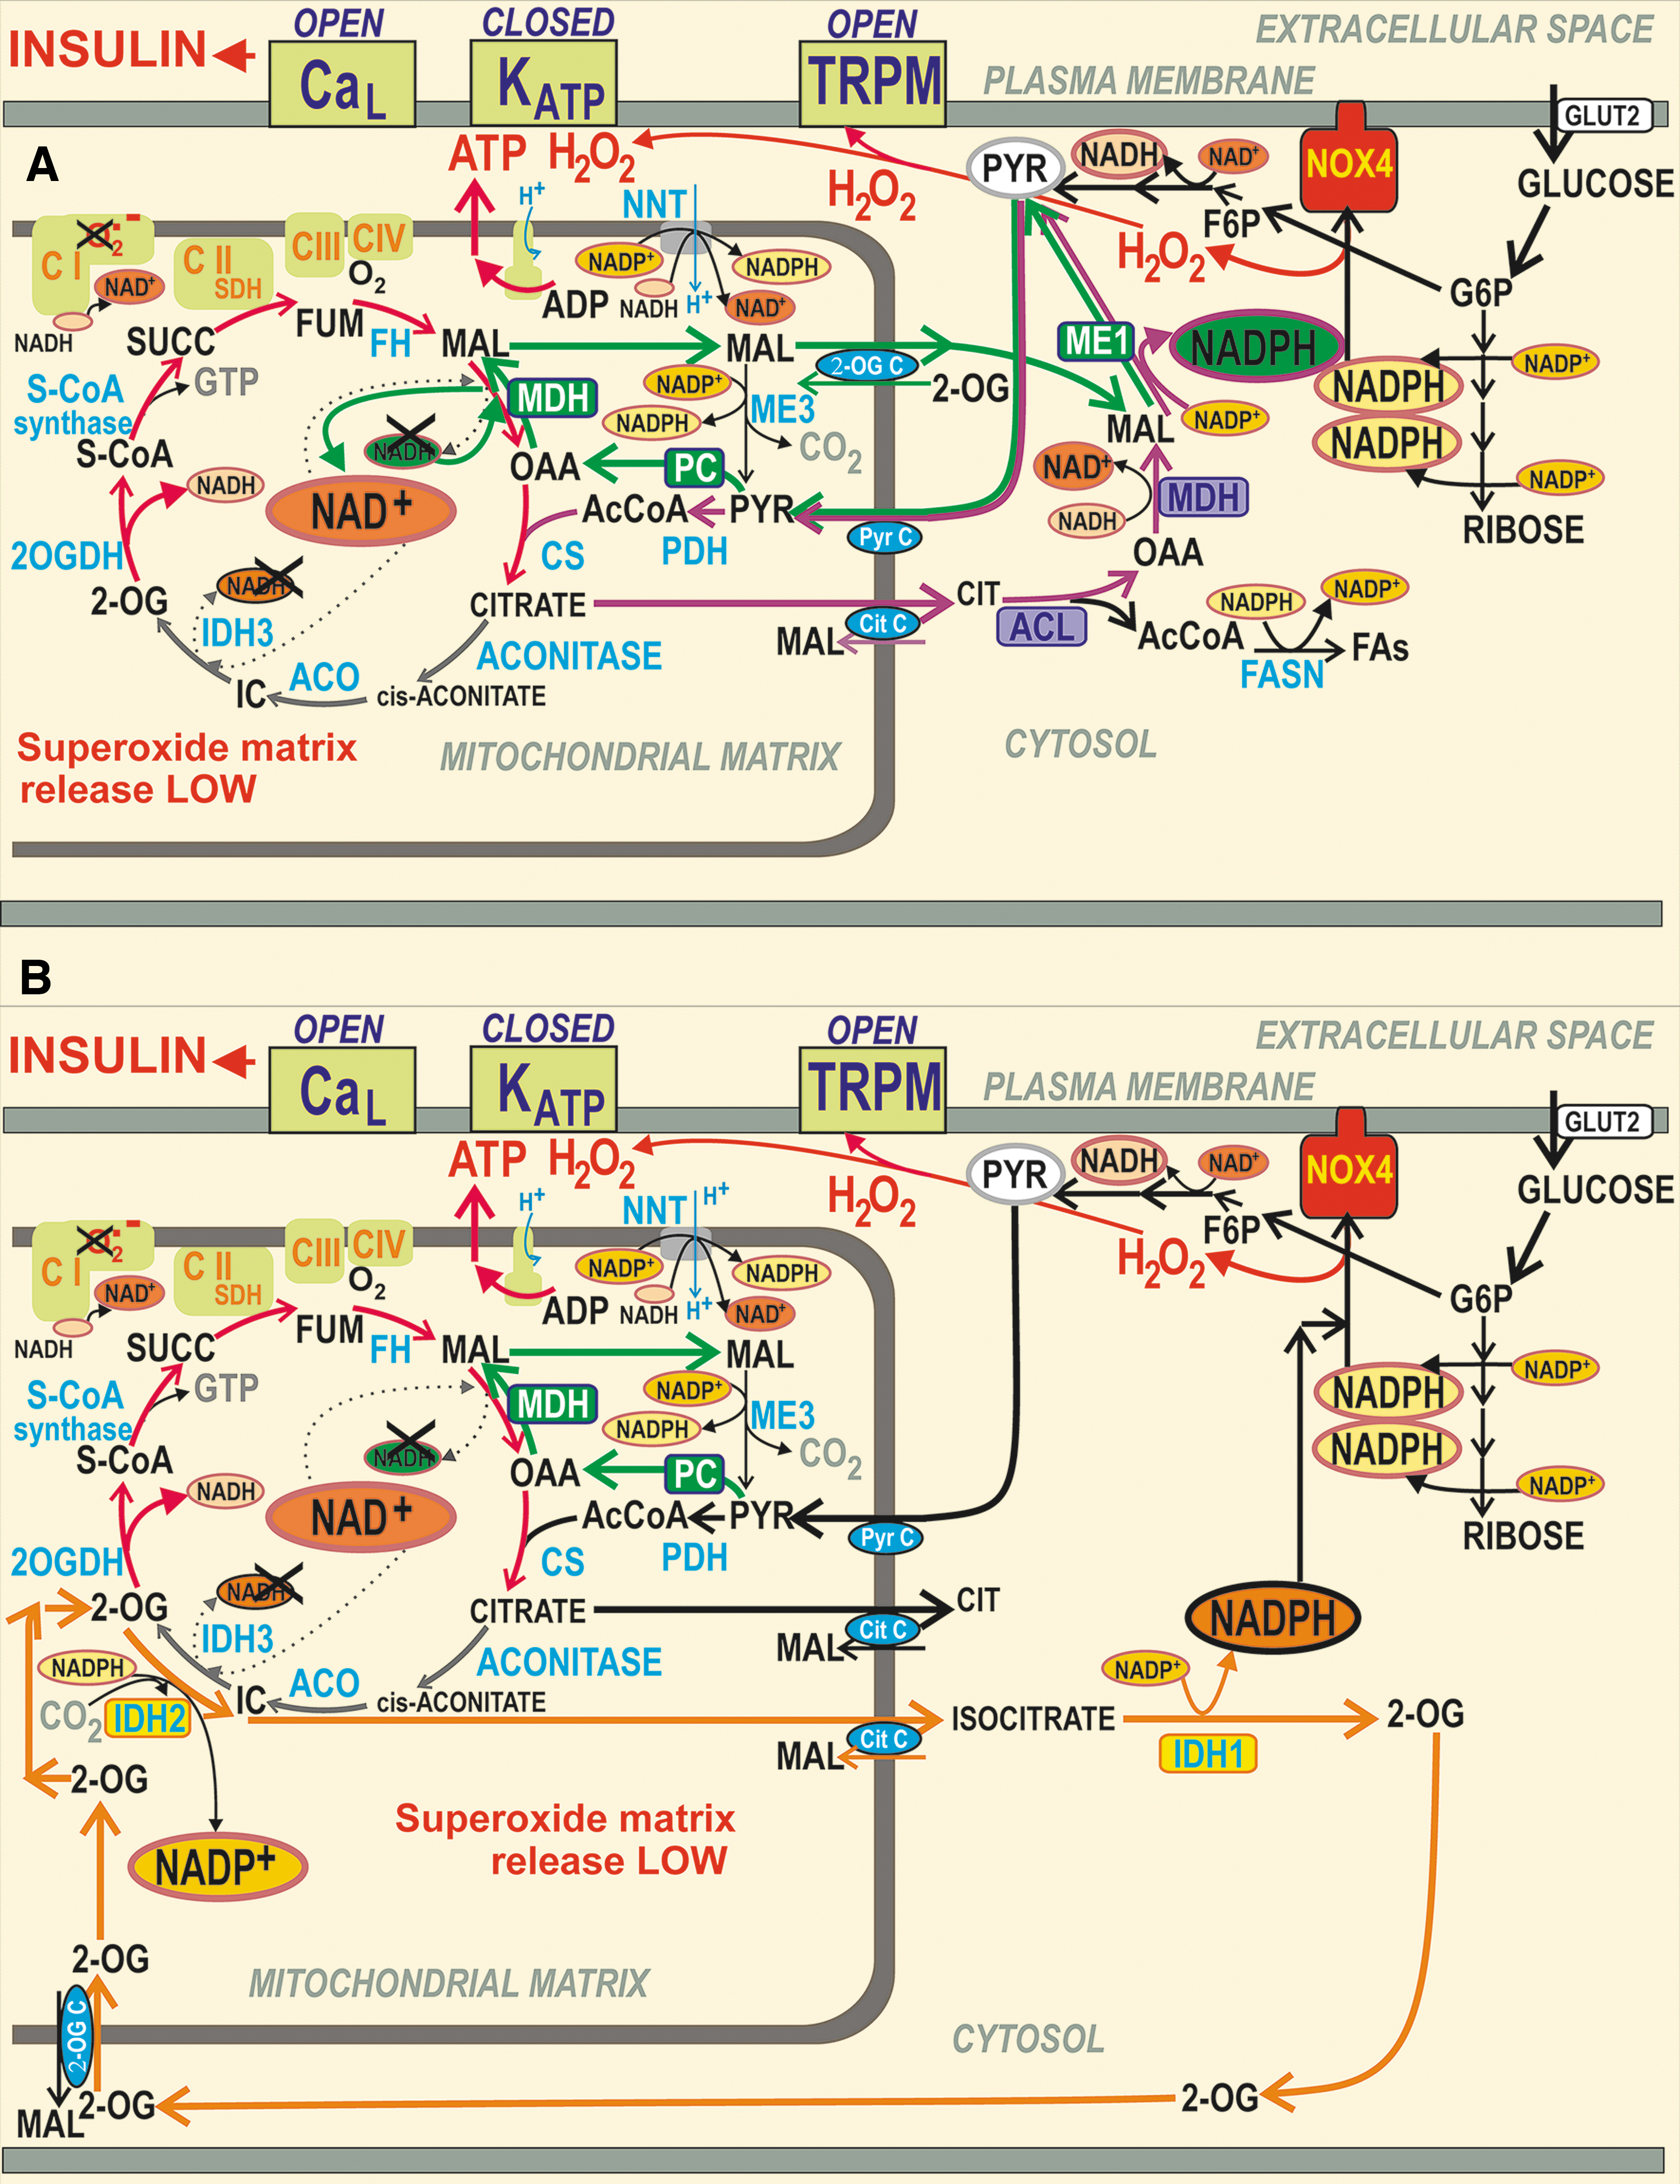
NADPH has long been considered to be a facilitator of GSIS (107, 110, 112, 183, 193, 209). However, the NADPH increase was not known to activate NOX4 upon GSIS, and PPP was thought to be inactive due to the product-inhibition of G6P-dehydrogenase (227, 290). Later, metabolomics confirmed a significant diversion of G6P flux to PPP upon GSIS (147, 240). Besides the two PPP enzymes, G6P-dehydrogenase and 6-phosphogluconate dehydrogenase, there is a contribution of three metabolic redox shuttles to the increasing [NADPH]c upon GSIS (110), complying with the high pyruvate influx into the matrix (147). We recognize the pyruvate/malate, pyruvate/citrate, and pyruvate/isocitrate shuttle (Fig. 5).
Note also that metabolic pathways including metabolic shuttles are plastic, specifically when the key members are altered in their expression, such as identified upon glucotoxicity, lipotoxicity, and glucolipotoxicity in isolated human PIs (108). Therefore, the description below concerns with the most frequent schemes before and after glucose intake into intact pancreatic β-cells.
NADPH and NADH homeostasis in the cytosol and mitochondrial matrix upon GSIS
The redox shuttles, activated upon GSIS, do not allow maximum NADH to be produced in the mitochondrial matrix, but instead more NADPH is produced in the cell cytosol, representing a transfer of redox equivalents from the matrix to the cell cytosol (Fig. 5A, B). The shuttles concomitantly provide an independent, although minor NADPH source, supplying NOX4 to initiate redox signaling that enables insulin secretion upon elevated ATP. Mitochondrial malate dehydrogenase 2 (MDH2) produces less NADH, when compared with the situation of the 100% forward reaction, which proceeds at low [glucose].
Also, less NADH is produced, if isocitrate is not converted by the isocitrate dehydrogenase IDH3 to produce NADH due to the truncated Krebs cycle owing to the citrate export from the matrix, or when the concurrent reaction direction exists so that isocitrate dehydrogenase 2, mitochondrial NADP+ dependent (IDH2) is switched to the inverse (reductive carboxylation) reaction. The exported isocitrate promotes NADPH formation by the cytosolic isocitrate dehydrogenase 1, cytosolic NADP+ dependent (IDH1). Thus again, instead of one NADH molecule produced in the matrix, one NADPH molecule is formed in the cytosol.
Decreasing matrix NADH ([NADH]m) at high- versus low glucose conditions has one interesting consequence, a diminished matrix NADH/NAD+ ratio, which causes decreased superoxide formation, probably at the IF flavin-site of Complex I (193). As a result, upon GSIS, we do have a dichotomic redox situation in the β-cell cytosol versus mitochondrial matrix. Whereas the cytosolic H2O2 elevation occurs due to NOX4 function, the matrix superoxide formation decreases (likewise H2O2 produced by superoxide dismutase MnSOD). Moreover, typical [NAD+]m, estimated, for example, in HeLa cells, is up to two orders of magnitude higher than [NADH]m. Values of 800 μM [NAD+]m and 5 μM [NADH]m were reported (33). During fast respiration upon GSIS, this difference actually leads to a situation in which each NADH molecule formed by the respective matrix dehydrogenases is instantly consumed by Complex I.
As for the matrix NADPH ([NADPH]m), we found that it decreases with increasing glucose. Specifically, the operation of the pyruvate/isocitrate shuttle and reductive carboxylation by IDH2 consumes NADPH significantly in INS-1E cells (193), and this is not balanced by the increased NADPH formation by the matrix malic enzyme 3 (ME3) nor by the increasing forward (Δp-consuming) mode of nicotinamide nucleotide transhydrogenase (NNT). The matrix ME3 forms pyruvate and NADPH from malate and NADP+ (85). The acute [NADPH]m decrease could lead to a decrease in the reduced glutathione in the matrix, representing a resource sacrificed in exchange for the transfer of redox equivalents, ensuring elevations in cytosolic NADPH.
Other regulators of redox homeostasis
Nicotinamide nucleotide translocase in pancreatic β-cells
Contradictory findings were reported for the mitochondrial NNT in PIs (Fig. 6). This IMM enzyme exposes its active site to the mitochondrial matrix. In a thermodynamically favored forward mode upon GSIS, NNT consumes Δp (Fig. 6B) by allowing H+ import into the matrix, tightly coupled with the conversion of NADP+ to NADPH and with the simultaneous NADH conversion to NAD+ (220). In this forward mode, NNT contributes to the matrix [NADPH]m pool. Since NNT acts downstream of the redox shuttles, it cannot alter or affect them. Nevertheless, if all these shuttles operate, than IDH2 consumes NADPH and since ME3 cannot balance this consumption, matrix NADPH decreases upon GSIS (193).
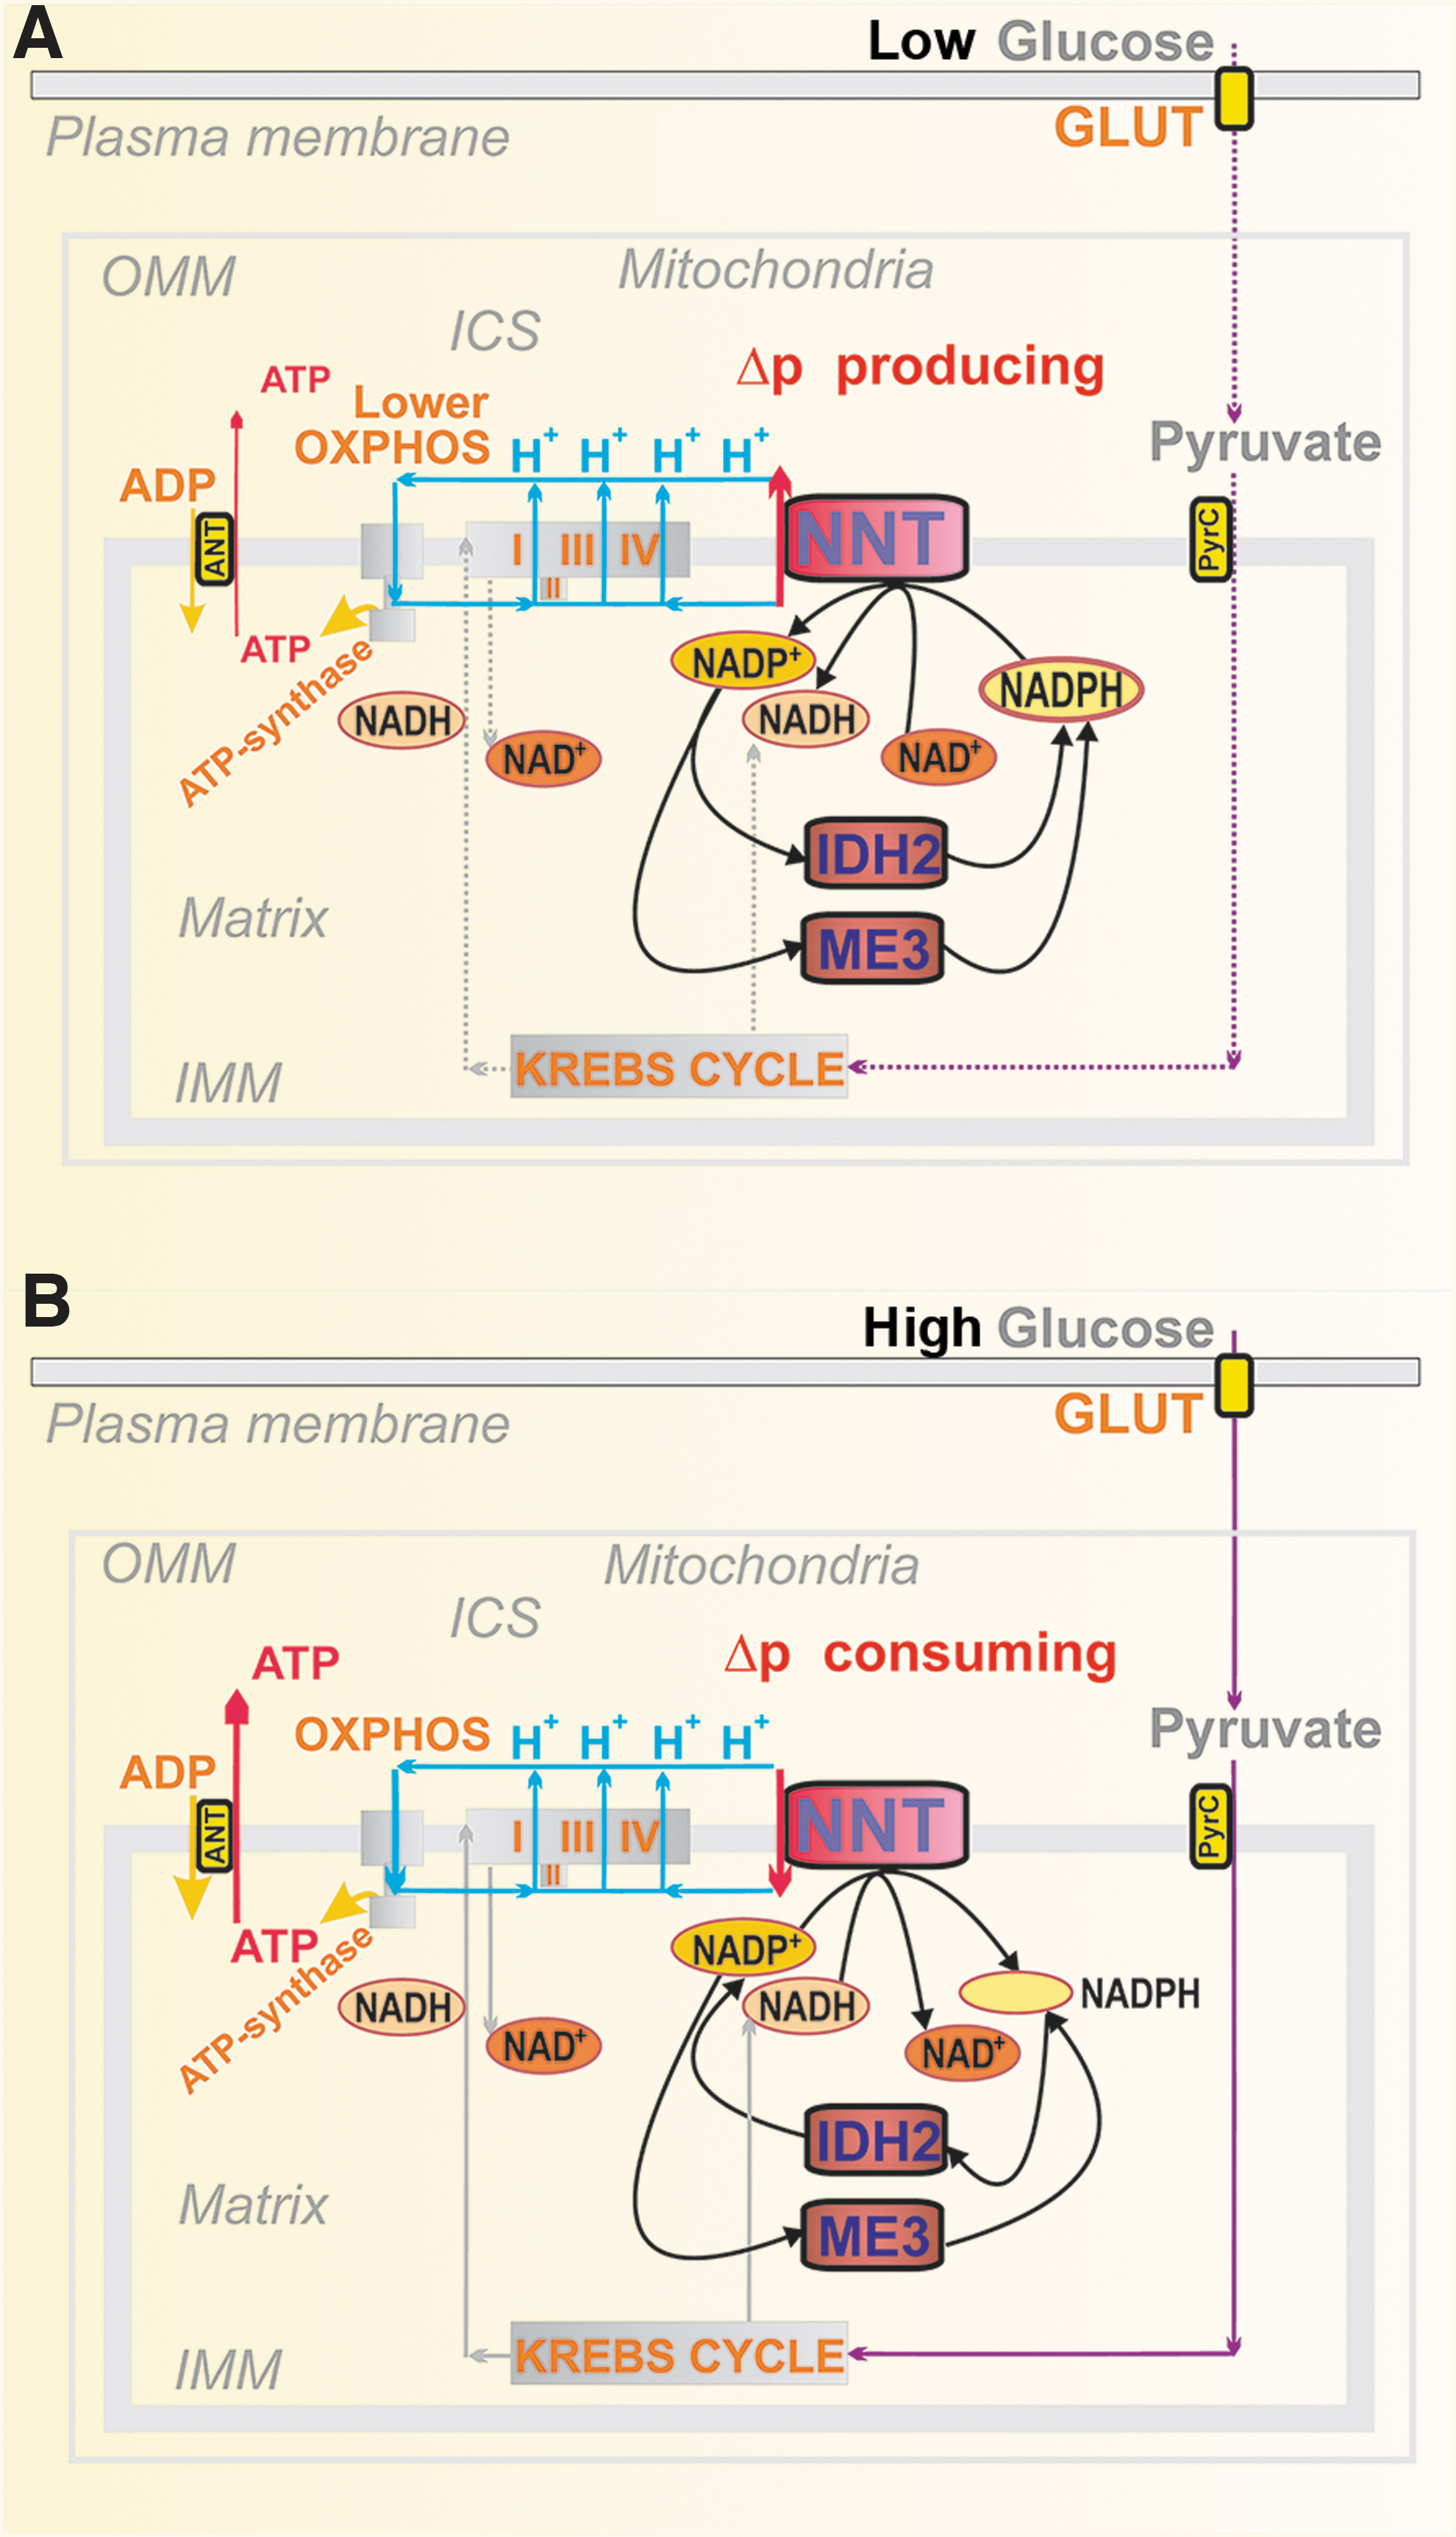
Despite we could not indicate the reverse mode at low [glucose] (193), NNT was reported to function in the reverse mode (225), in which it pumps protons and thus provides a Δp surplus. This should be coupled with the consumption of NADPH and NAD+, yielding NADP+ and NADH. Such a mode would be possible, since at low [glucose] respiration and ATP synthesis exhibit somewhat slower rates, establishing a lower Δp, than with high [glucose]. The H+ pumping against an intermediate Δp would be possible at rather high NADPH/NADP+ ratio. In contrast, at high [glucose], NNT acts against the higher Δp. However, no direct observation of the actual H+ flux direction was conducted (225). By comparing ΔΨ m, monitored using fluorescent probes, we demonstrated ΔΨ m-increases in NNT-silenced INS-1E cells, supporting the existence of the forward NNT mode, which produces NADPH (193).
Neither experiments relying on the comparison of C57BL/6J versus C57BL6/N mice were conclusive. They reported that an in-frame five-exon deletion in the Nnt gene spontaneously occurred in C57BL/6J mice, thus removing exons 7–11, causing a complete absence of NNT protein (62, 63, 257). The C57BL6/J mouse strain was claimed to have a highly suppressed GSIS. However, other studies normally used knockouts backcrossed into the C57BL6/J-mice background as controls for GSIS and it exhibited high insulin secretion rates [e.g., Plecita-Hlavata et al. (194) and Wong et al. (273)]. The discrepancy originates from the fact that initially only the quantitative trait loci were identified. Thus, a mere correlation with deletions in the Nnt gene was assumed, and verifications using the artificial Nnt expression can be regarded as inconclusive, since the Nnt expression per se could enhance insulin secretion. This could be subsequently interpreted as an apparent GSIS suppression in C57BL6/J mice (273).
Malate/aspartate shuttle in low and high glucose conditions
The malate/aspartate shuttle (MAS) was assumed to play a significant role in pancreatic β-cells (147, 240). However, interpretation of the relevant metabolomics data must be provided with caution since they mostly do not resolve metabolites of the mitochondrial matrix versus those from the cytosolic compartment (which is typically greater). One must consider that the metabolite transport direction within the active MAS is the opposite of the pyruvate redox shuttles (193) (Fig. 7). Their existence documented by numerous experiments over the last two decades (107, 110, 112, 183, 193, 209) thus excludes metabolite fluxes required for MAS operation at high [glucose].
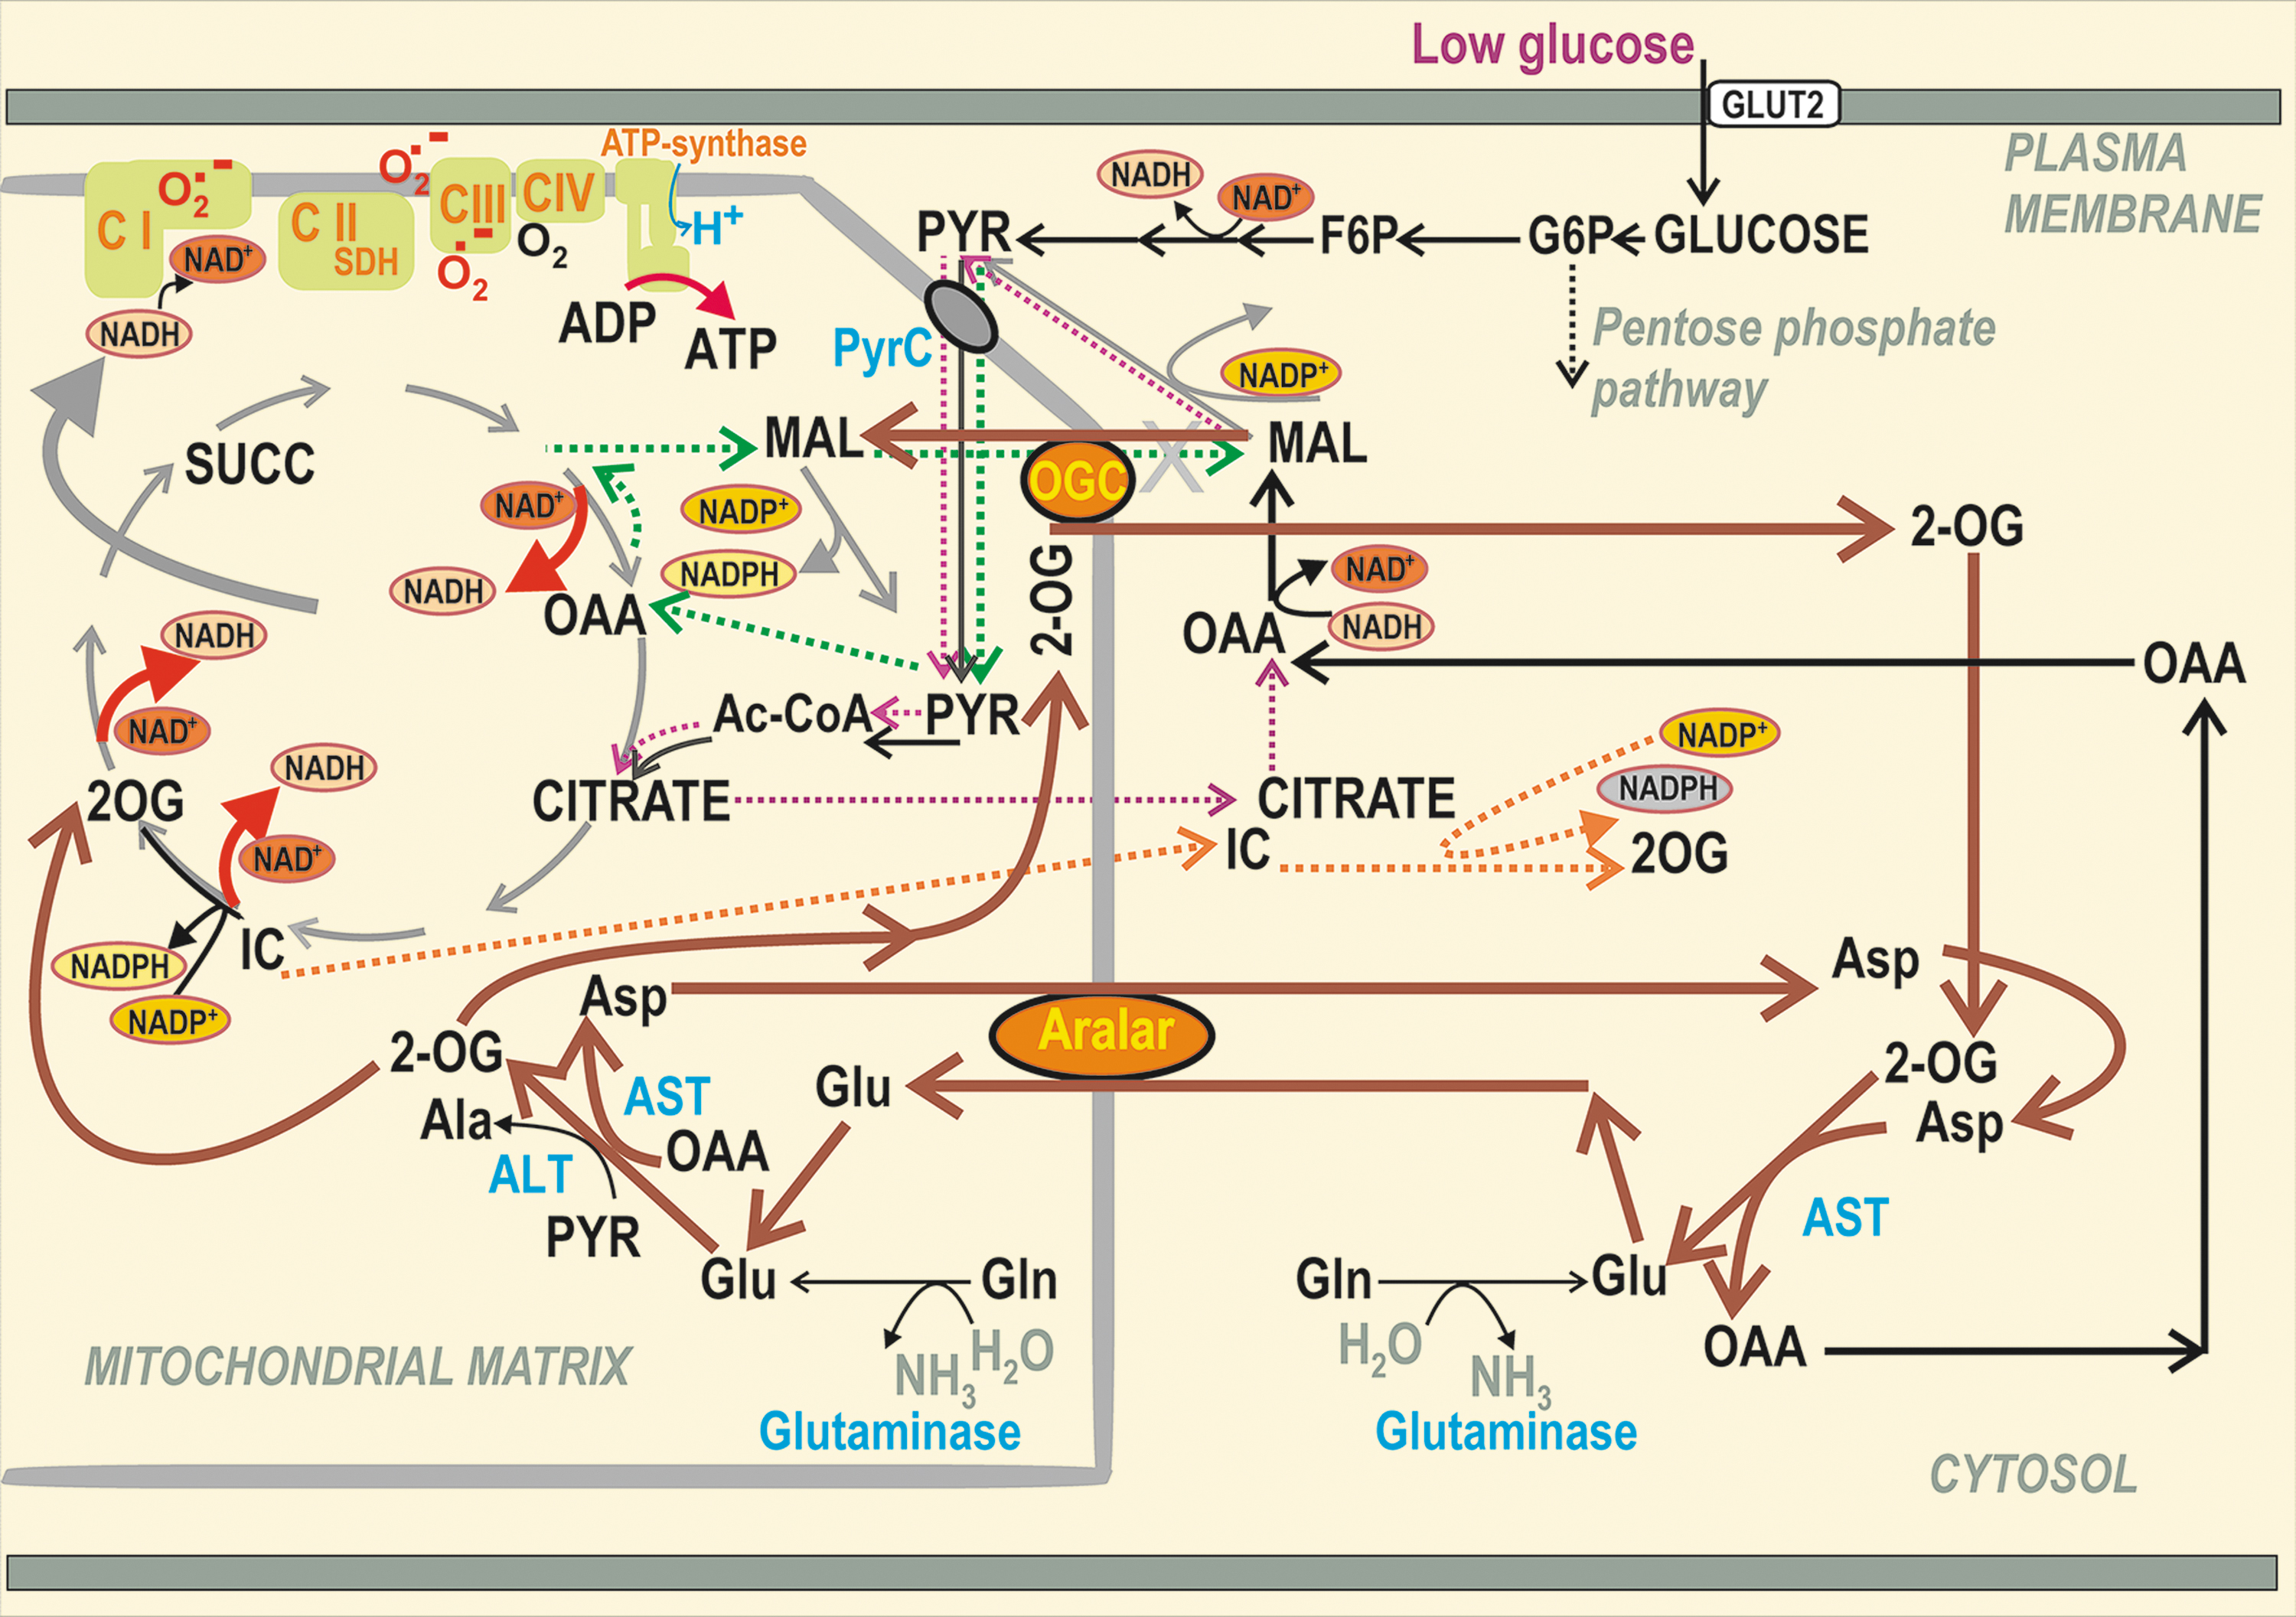
The 2-oxoglutarate carrier (2OGC) mediates the malate efflux coupled with the 2-oxoglutarate (2OG) uptake to the matrix at high [glucose], whereas the malate import coupled with the 2OG export is required for MAS, if it exists. Unlike with pyruvate-based redox shuttles, at least one of two glutamate-aspartate antiporter isoforms is required for MAS, enabling the glutamate import in exchange for aspartate export from the matrix. In contrast, the aspartate needs to be imported as a part of the pyruvate/malate redox shuttle. However, glutamate formed in the matrix was suggested to be exported to the β-cell cytosol to facilitate IGV maturation and exocytosis (30, 72, 92, 93, 153, 155, 250). This would again require the opposite direction of glutamate flux.
At low [glucose], both aspartate–glutamate antiporters can participate in MAS, that is, SLC25A12/AGC1/aralar (18, 217) and SLC25A13/AGC2 (193). The existence of MAS was derived from the essential requirement of transaminases (aminotransferases) and aspartate–glutamate antiporters for β-cells (18, 217). Metabolomics studies evidenced a decrease in total cell aspartate at the initiation of GSIS, while aconitate, citrate, isocitrate, malate, or fumarate instantly rose, and elevations of 2OG and succinate were delayed until 15 min (241). Elevations in metabolites originate from the disbalance between producing versus consuming reactions, while the latter is slower; whereas for losses of metabolite, the producing reactions are slower. Hence, the observed aspartate losses reflect this disbalance.
Due to providing cytosolic glutamate, MAS was implicated in the GLP-1 amplification of GSIS, but not in GSIS itself (72). The ablation of cytosolic transaminase AST1/GOT1 reversibly transforming 2OG and aspartate to oxaloacetate plus
β-Hydroxybutyrate dehydrogenase and acetoacetate metabolism
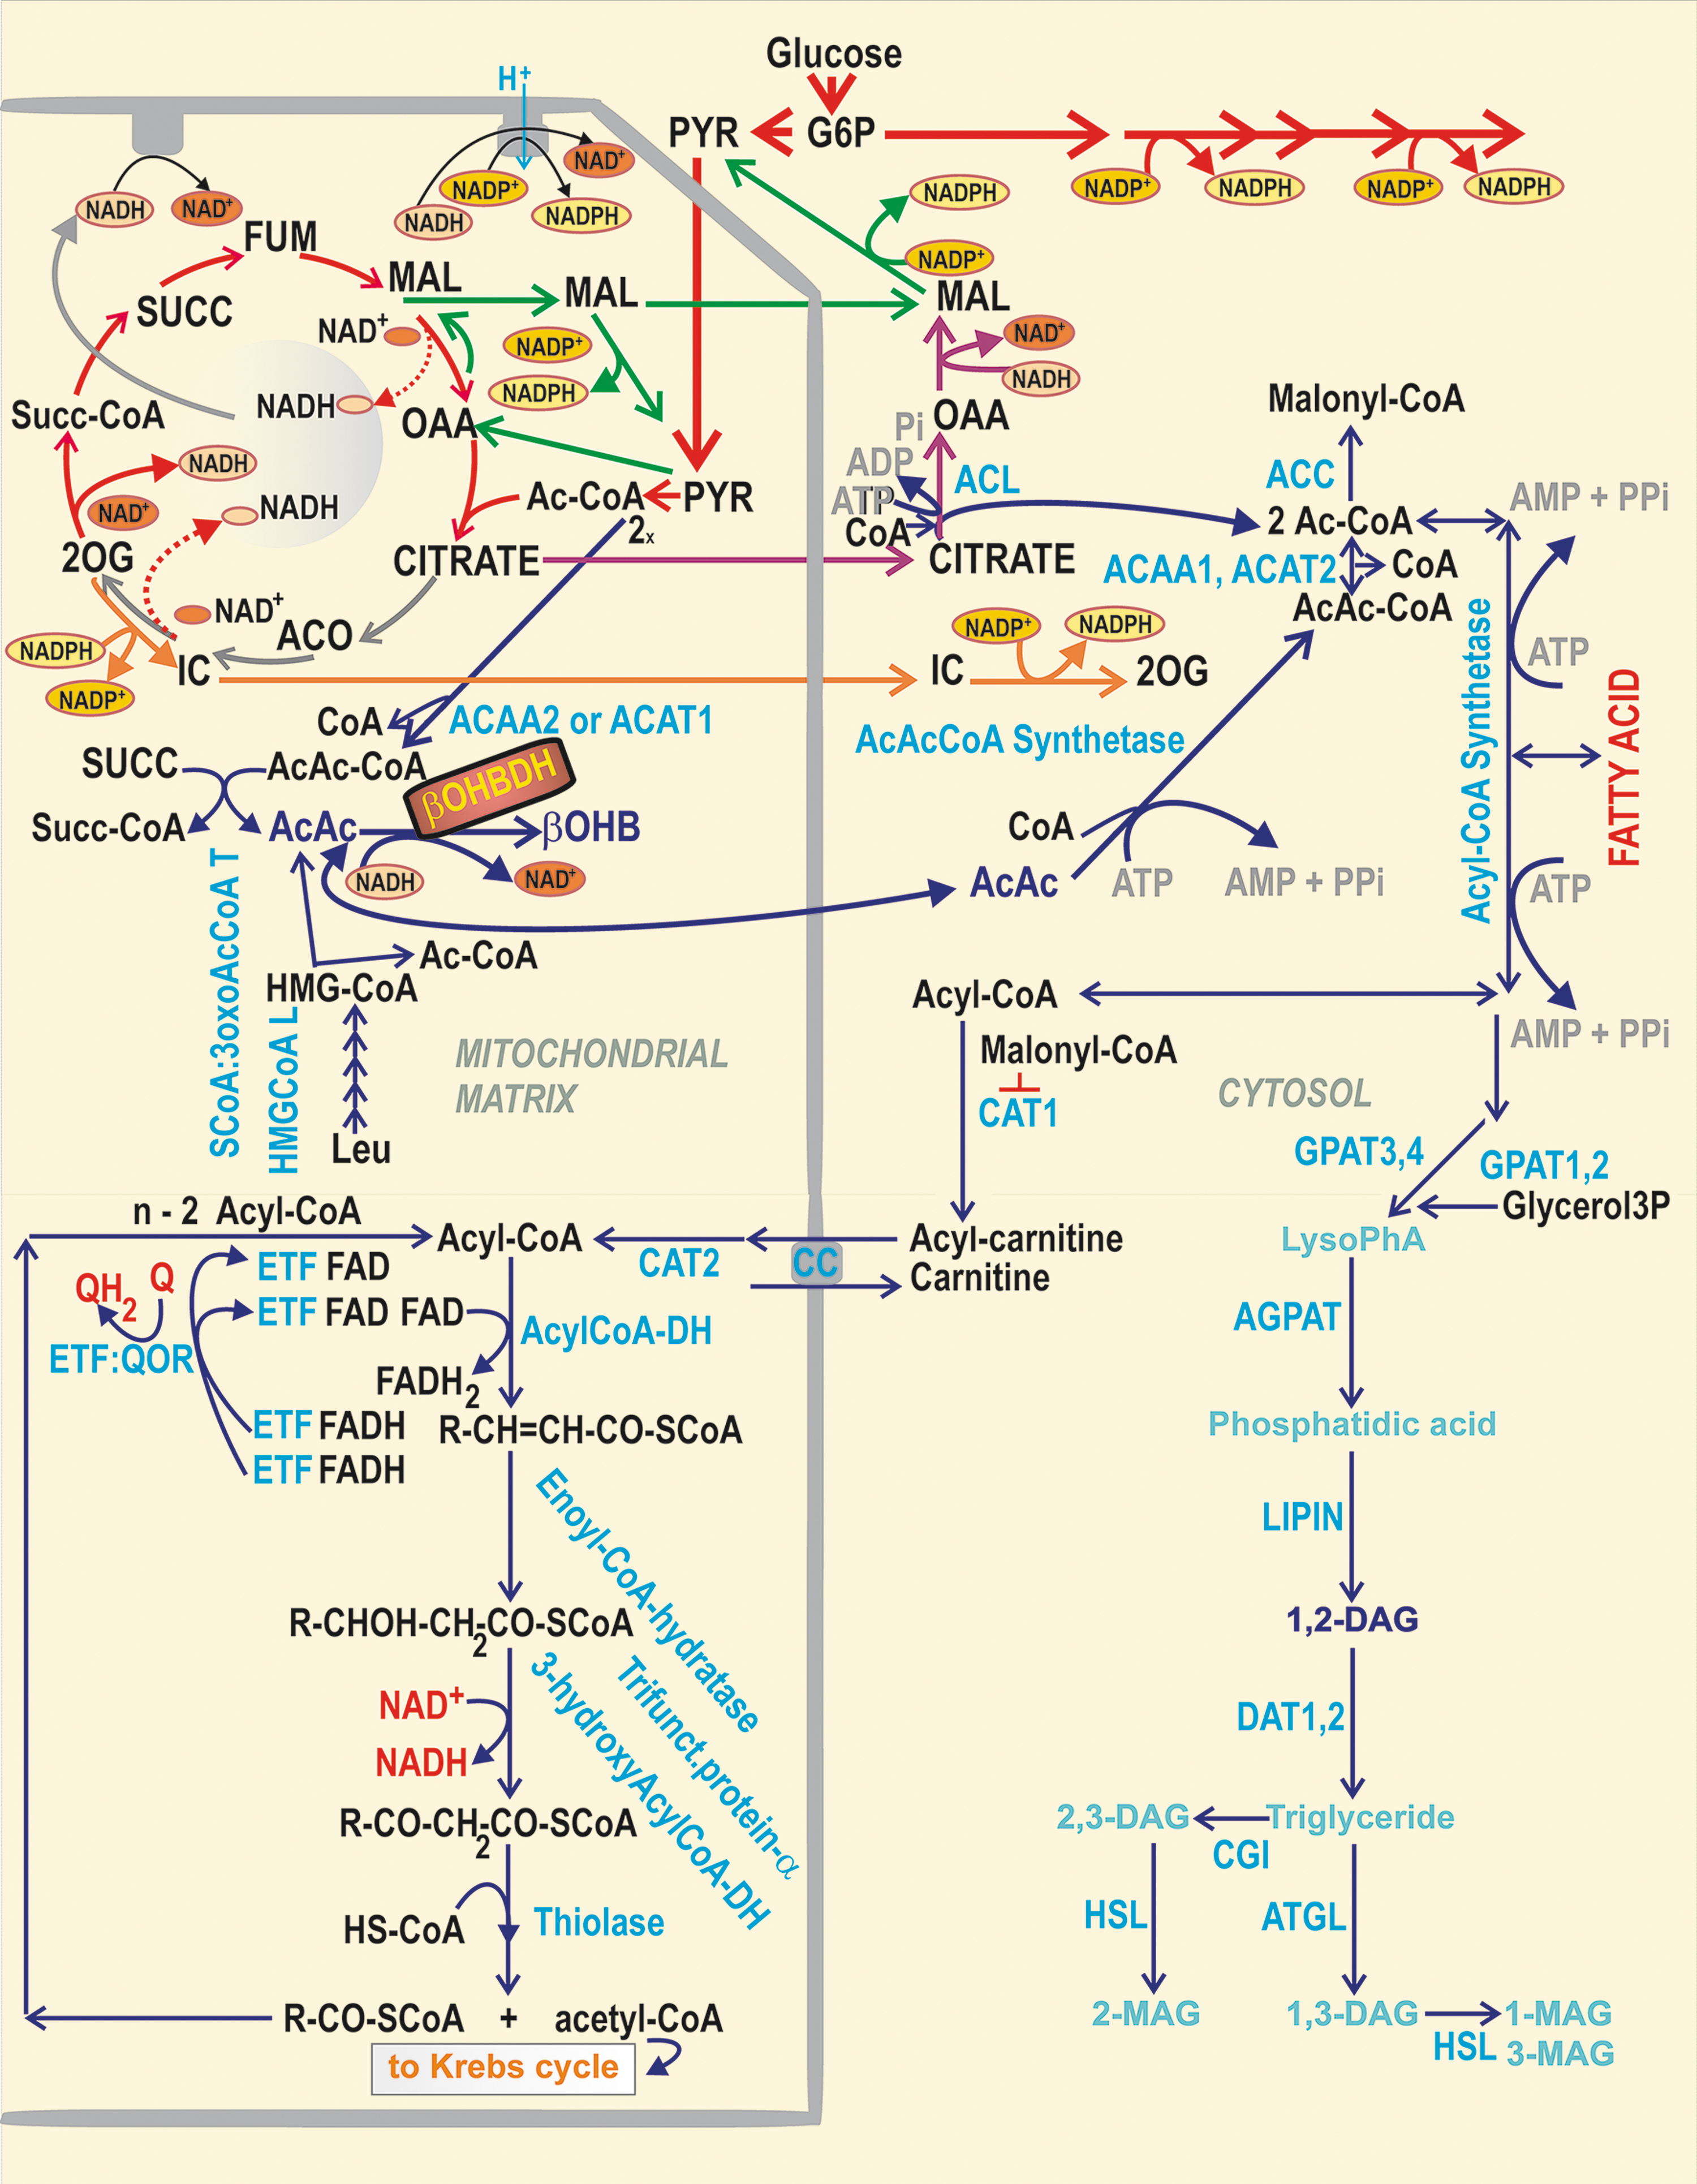
β-Hydroxybutyrate dehydrogenase (β-OHBDH) is exclusive to the matrix in rodent pancreatic β-cells, playing an important role in redox homeostasis (149, 178). In pioneering investigations with hepatocytes, the β-OHBDH reaction was suggested to precisely reflect the matrix NAD+/NADH ratio, which would therefore determine the ratio of (total) β-hydroxybutyrate/acetoacetate concentration (178). However, since the estimated order of magnitude for the matrix NAD+/NADH ratio is >100, such an excess of β-hydroxybutyrate is unlikely. Since we reported the increase in this ratio upon GSIS (193), one could speculate that also matrix β-hydroxybutyrate rises upon GSIS (Fig. 8). However, acetoacetate can also be exported to the cytosol, where it is utilized by other reactions (149, 178). This was thought to facilitate insulin secretion via the formation of various acyl-CoA derivatives (Fig. 8) (149), which could acetylate proteins thus speculatively enhancing GSIS (189, 190). β-Hydroxybutyrate (
Long-chain acyl-CoAs were also reported to bind to the KIR6.2 subunit of KATP (28), which potently activates this channel (27, 77). Since upon GSIS, there is a reduction in total cell acyl-CoAs and malonyl-CoA (146, 198), such a reduction could facilitate KATP closure (146). Alternatively, FA β-oxidation (long-chain acyl-CoA shortening) could also provide the redox signaling toward KATP or TRPM2 (79, 123, 223), as with KIC (194) (see the Mitochondrial Contribution to Insulin Secretion Stimulated by BCKAs and FAs section).
Phosphoenolpyruvate cycle and role of pyruvate kinases
Another cycle, the phosphoenolpyruvate (PEP) cycle was suggested to act in the low glucose conditions. The PEP cycle is cataplerotic, beginning by the mitochondrial PEP-carboxykinase 2 (PEPCK2) conversion of oxaloacetate to PEP, which is exported by the citrate carrier (SLC25A1) from mitochondria. Cytosolic pyruvate kinases (PKs, isoforms constituent M1, recruitable M2 and L), existing in beta cells (167) use then the cytosolic PEP to convert it to pyruvate, which is coupled to ATP formation from ADP. Pyruvate enters mitochondria, where is metabolized either by PDH or by pyruvate carboxylase (PC). The PC flux completes the cycle by pyruvate conversion to oxaloacetate.
Pyruvate kinase isoform recruitable M2 (PKM2) and pyruvate kinase isoform L (PKL), allosterically activated by fructose 1,6-bisphosphate, were recently reported to aid KATP closure, as derived from patch-clamp experiments in excision mode combined with PK activation by a small-molecule activator (141). The authors exemplified PEP cycle switched on/off in the β-cell responses to intermediate 9 mM glucose, when Vp and or [Ca2+]c bursts phases are interchanged with the interburst phases (Fig. 4). The decreased cytosolic ATP/ADP ratio was explained on the basis of the PEP cycle providing ATP synthesis by PK, that is, by “substrate” phosphorylation of ADP, independent of OXPHOS. Naturally low ATP sets KATP-channels open, which occurs before glucose elevation and/or after termination of the burst phase at 9 mM glucose. When OXPHOS continues to elevate ATP further, PEP cycle is less active and more importantly the Krebs cycle control strength overcomes that of PEP cycle. Consequently, the burst phase begins at 9 mM glucose. Also, PKM2 and PKL activator failed to improve GSIS in PEPCK2-knockout mice (1).
Glutamine and glutamate in pancreatic β-cells
Glutamine and glutamate metabolism
The reaction direction of mitochondrial glutamate dehydrogenase (GDH) in pancreatic β-cells was thought to favor the provision of glutamate and NAD+, while consuming 2OG, ammonium, and NADH (30, 92, 153, 155, 250). This would also contribute to decreasing [NADH]m, if acting upon GSIS. During fasting, GDH is activated by ADP and leucine, while at high [glucose], GDH is inhibited by GTP and ATP (67, 278).
Glutamate is exported from the matrix by the glutamate carrier GC1 (SLC25A22) (30, 92, 155). Also, pyruvate utilization by aminotransferases has a certain impact, despite being minor compared with the utilization by the matrix PDH complex and by the oxaloacetate anaplerosis provided by pyruvate carboxylase (6). Thus, cytosolic alanine aminotransferase (ALT1) and mitochondrial ALT2 [also termed glutamate pyruvate transaminases, GPT1 and GPT2 (188)] could catalyze the conversion of pyruvate plus
Glutamine is also utilized in PIs, reportedly promoting leucine-stimulated insulin secretion at low [glucose], when phosphate-dependent glutaminase produces glutamate, which is further oxidized by GDH (67).
Glutamate regulation of insulin secretion
Glutamate was first suggested to facilitate GSIS (30, 92, 154, 155, 229), which was questioned by subsequent reports (24, 148). The glutamate effects are instead connected with IGV biology (214, 260). The specific uptake of glutamate into IGVs was found, being driven by ΔpHIGV, established on the IGV membranes by the V-ATPase (10). Anion influx, namely Cl− influx by the ClC3 transporter, also helps to build ΔpHIGV. Additions of membrane-permeant dimethyl glutamate were reported to amplify both phases of GSIS, increasing the frequency of insulin granules merging with the plasma membrane (72).
Sufficient glutamate content inside the IGV lumen results from its uptake mediated by glutamate transporters VGLUT1,2,3 balanced by the EAAT2-mediated glutamate efflux (66). The ablation of VGLUTs reduced the GLP-1-induced amplification of GSIS but not GSIS itself (72). Ablation of the plasma membrane sodium-coupled neutral amino acid transporter 5 (SNAT5) also led to a reduced GLP-1 amplification of GSIS (86).
Mitochondrial Contribution to Insulin Secretion Stimulated by BCKAs and FAs
Insulin secretion by BCKAs involves mitochondrial retrograde redox signaling
Branched-chain amino acids versus BCKAs
A mixed meal leads to elevated levels of amino acids in circulation (244). During fasting or numerous pathologies, branched-chain amino acids (BCAAs) and BCKAs are also elevated in plasma. We will only discuss situations when pancreatic β-cells sense BCAAs and BCKAs in the islet microcirculation, or when these compounds are formed by metabolism. Thus, BCKAs, KIC (leucine metabolite) (7), 2-ketoisovalerate (KIV; valine metabolite), and 2-ketoisomethylvalerate (KMV; isoleucine metabolite) stimulate profound insulin secretion at low glucose (83, 88, 138 –140, 163, 189, 190). Leucine can also exert effects by allosterically activating GDH (278).
Retrograde redox signaling (i.e., from mitochondria to cell cytosol, nuclei, or other organelles) is provided when these BCKAs are oxidized in mitochondria (29). This is substantiated by the elevated mitochondrial superoxide formation due to BCKA oxidation, whereas superoxide is transformed to H2O2 either by the matrix MnSOD or by the intermembrane space CuZnSOD (Fig. 9).
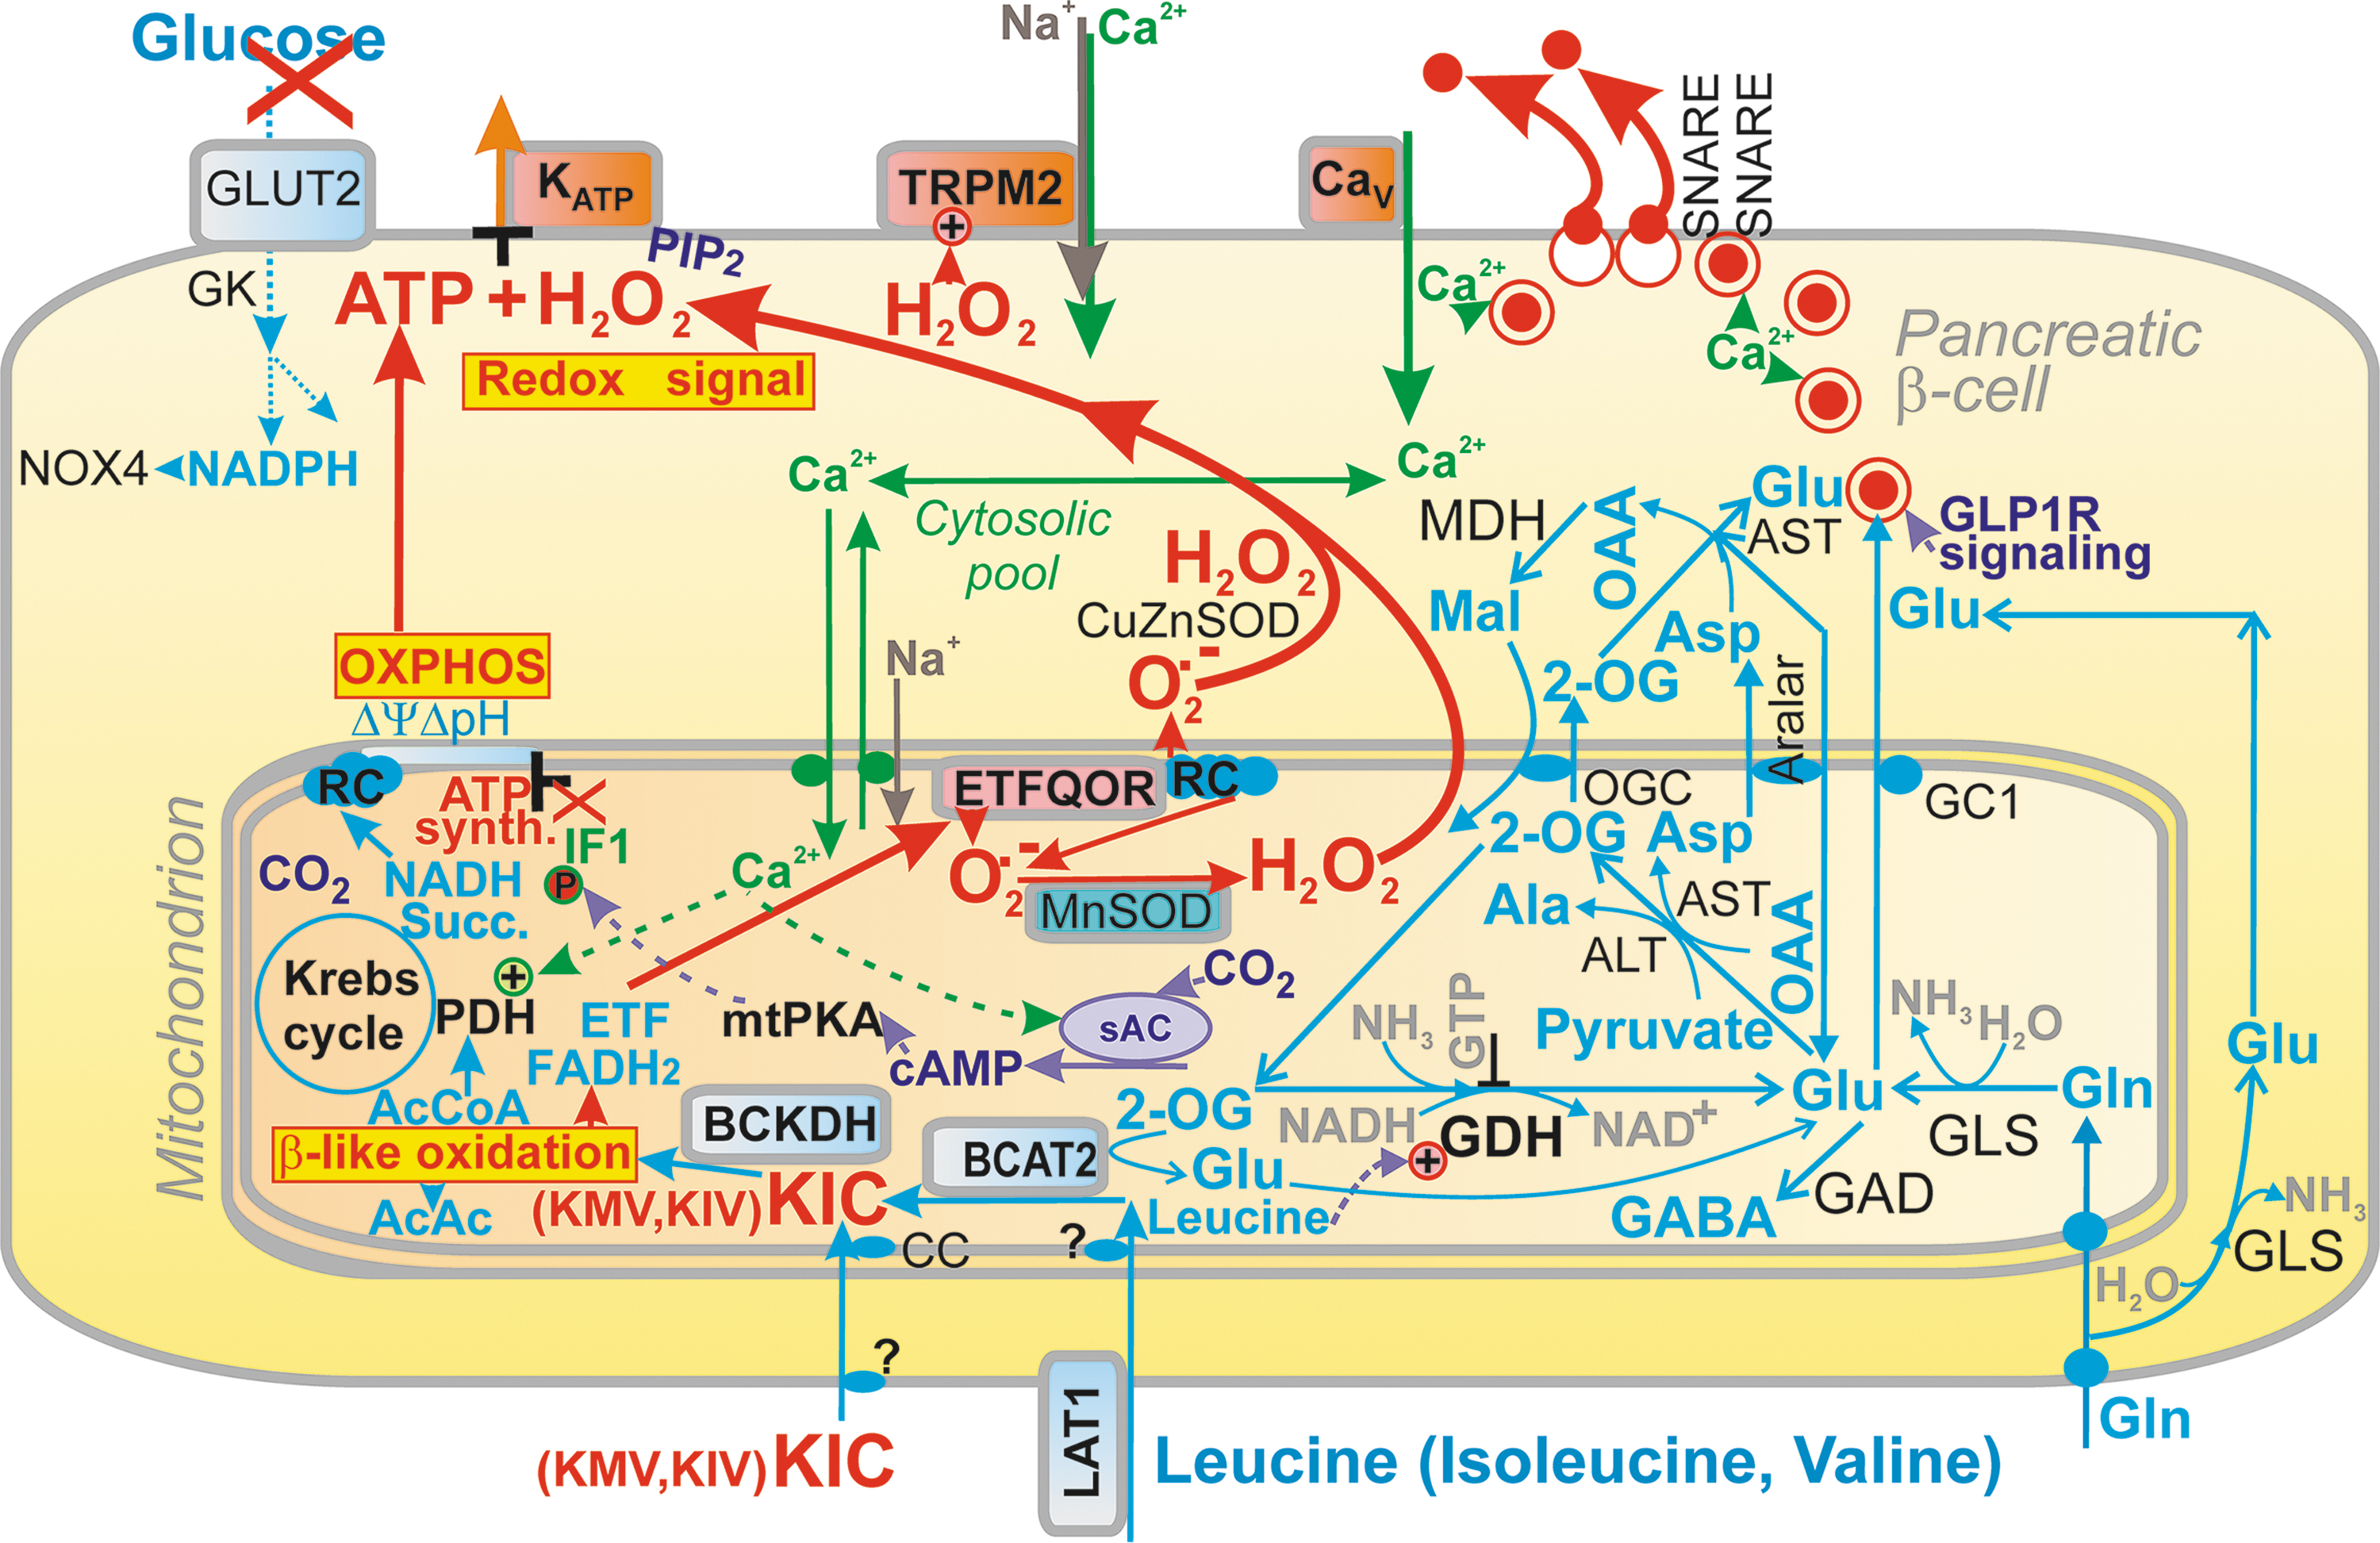
Despite there being details missing on how BCAA or BCKA are transported to the mitochondrial matrix, a well-known exclusively matrix BCKDH complex converts CoA plus BCKAs to proper BCKA-CoAs, that is, to isovaleryl-CoA, isobutyryl-CoA, and methyl-isobutyryl-CoA from KIC, KIV, and KMV, respectively. The entire series of reactions, a β-like oxidation (resembling FA β-oxidation) continues, for example, for KIC via methylcrotonyl-CoA carboxylase (MCC), methyl-glutoconyl-CoA hydratase (MGCoAH), and 3-hydroxy-3-methylglutaryl-CoA lyase (HMGCoAL), leading to the end products acetyl-CoA, which drives the Krebs cycle, and acetoacetate.
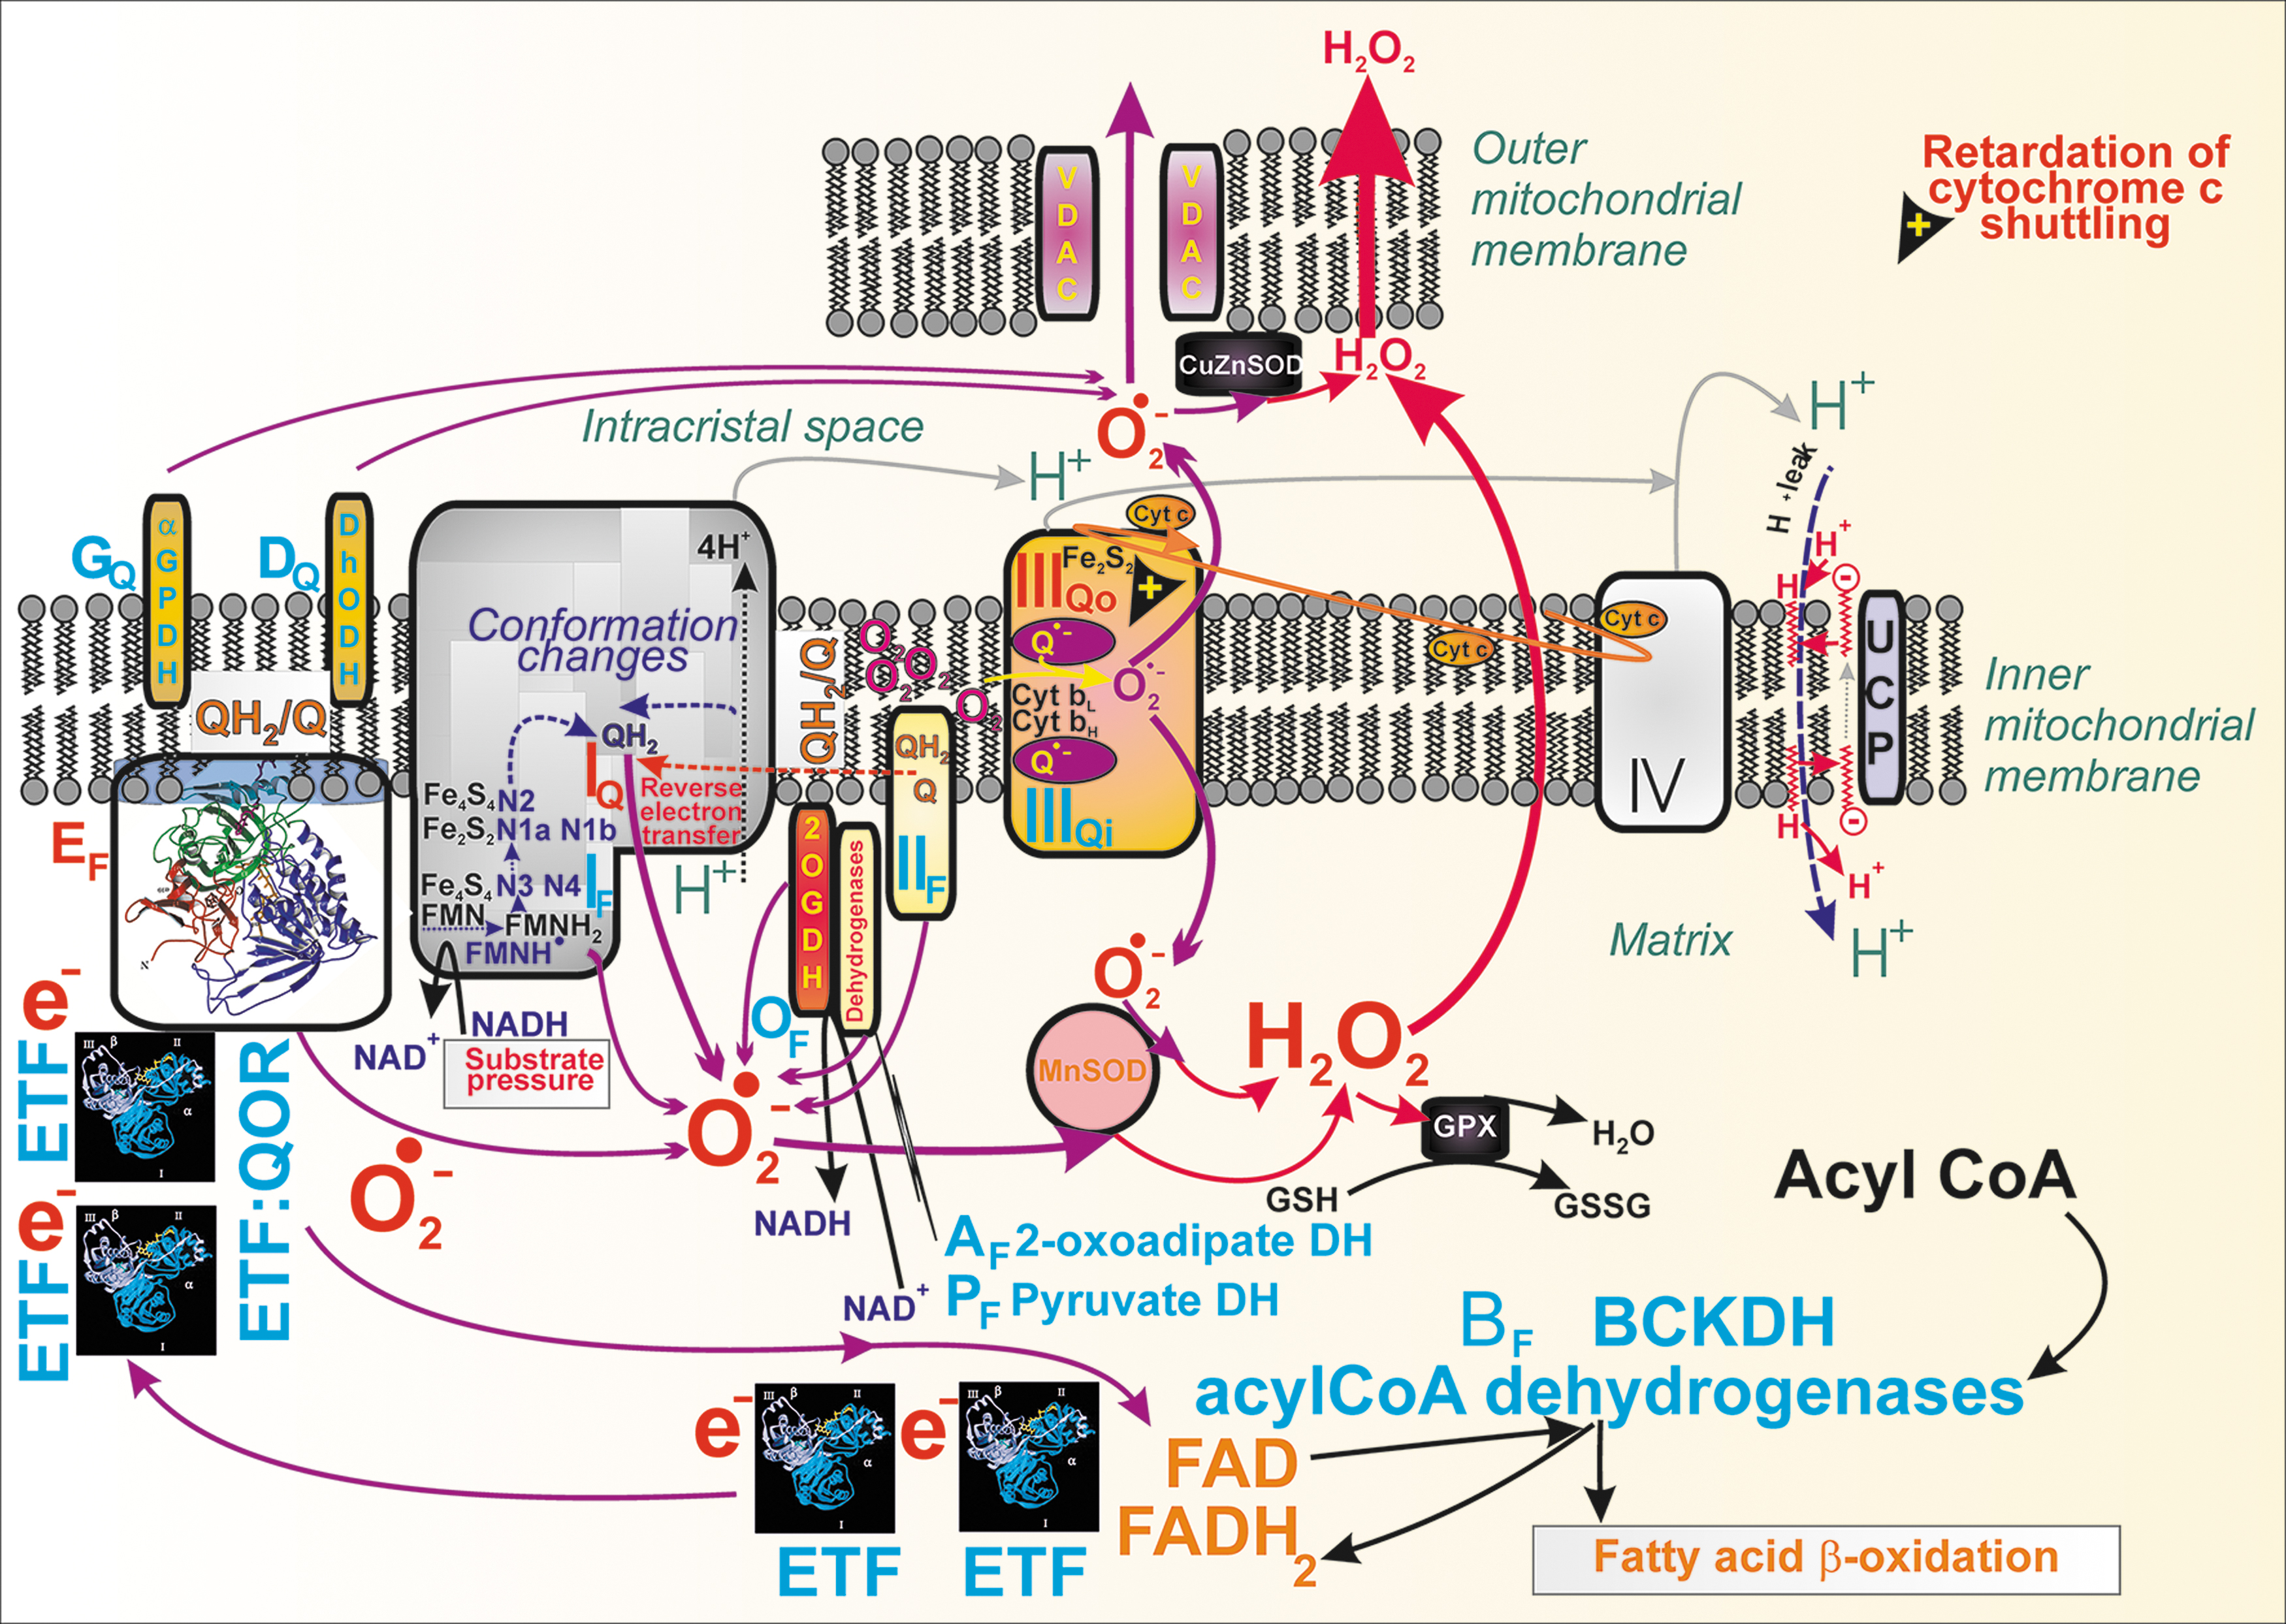
Mechanism of superoxide formation upon oxidation of BCKAs
The BCKDH reaction includes FAD as an electron acceptor. Subsequently, two electron transfer flavoprotein (ETF) molecules reoxidize the resulting FADH2 since each ETF is only a single-electron carrier. ETFs otherwise transfer electrons from 11 different mitochondrial flavoprotein dehydrogenases to the IMM ubiquinone (Q) pool. During BCKA oxidation, the transfer of electrons proceeds from one electron-reduced ETF one at a time to the lower potential FAD center of the electron transfer flavoprotein:quinone oxidoreductase (ETFQOR) (268). One electron is transferred to the iron cluster. ETF:QOR thus accepts two electrons, and this is coupled with the reduction of ubiquinone to ubiquinol (Q to QH2) with a transient semiubiquinone formation (268). This is a clue to the enhanced superoxide formation upon BCKA oxidation.
Since QH2 binds to the Complex I Q-binding site, the excessive supply of QH2 by ETF:QOR causes a feedback inhibition of the ongoing Q reduction to QH2 in Complex I. As a result, mitochondrial superoxide formation is accelerated at the so-called IQ site of superoxide formation (Fig. 11). The second possible source could be due to the ETF:QOR reaction itself, while electrons are leaking from flavin to oxygen at site EF (Fig. 11), forming initially a radical pair and finally superoxide (25). The third possible source is given by the excessive acetyl-CoA (propionyl-CoA) entry or methylmalonyl and S-CoA entry into the Krebs cycle. Since such enhanced catabolism accelerates respiration, an enhanced superoxide formation can be expected at Complex I site IF and site IQ, and Complex III site IIIQo, when the capacity of electron transfer is exceeded. Also, as discussed above, acetoacetate influences the established redox homeostasis.
Insulin secretion due to BCKAs
Insulin secretion upon elevated BCKA depends on increases in cytosolic ATP plus H2O2, now both supplied by mitochondria (Fig. 9). Indeed, BCKDH silencing blocked KIC-stimulated insulin secretion, as did the mitochondrial-matrix-targeted antioxidant SkQ1 (194). In contrast, the transaminase inhibitor aminooxyacetate had no effect. The blockage correlated with the suppressed matrix superoxide release, which was otherwise elevated by KIC. So, the H2O2 diffusion from the matrix substantiates the retrograde redox signaling from mitochondria. We admit the KIC doses may be supraphysiological in these experiments. A magnitude of a minimum threshold should be further investigated, which still creates sufficient mitochondrial superoxide/H2O2 in vivo to substantiate redox signaling reaching the plasma membrane and concomitant insulin exocytosis.
The most plausible terminal targets are located in the plasma membrane. They could be Cys residues of KATP, or an oxidizable Met residue of TRPM2 (223), or both. Note that TRPM2 or other NSCCs or chloride channels are essentially required to shift the depolarization to the −50 mV threshold required for the opening of CaV, and so for action potential firing (119, 221). This −50 mV threshold cannot be achieved without NSCCs or Cl− channels, even when 100% of KATP channels are closed. The latter is undoubtedly established by a highly elevated cytosolic ATP resulting from β-like oxidation and concomitant OXPHOS.
Redox signaling from mitochondria upon stimulation of insulin secretion by long-chain FAs
Fatty acid-stimulated insulin secretion requires mitochondrial β-oxidation and signaling via the GPR40 receptor
In rodent and human physiology, a mixed or fatty meal leads to the intestinal formation of chylomicrons that are brought by the circulation system to PIs after a few hours in humans, while also lipolysis is inhibited by secreted insulin (61). In contrast, the lipid- or FA-mediated secretion of GLP-1 by intestinal L-enterocytes comes earlier (173). Thus, a fatty meal induces insulin secretion via GLP-1 endocrine effects on PIs, whereas the further delayed insulin secretion due to chylomicrons arises at a time when even the 1-h-long second GSIS phase is terminated. So not only due to molecular mechanistic reasons, but due to physiological timing, it is crucial to study fatty acid-stimulated insulin secretion (FASIS).
In vivo, there is always a concomitant parallel portion of insulin secretion stimulated by 2-monoacylglycerol (MAG), cleaved from postprandial chylomicrons in PI capillaries by lipoprotein lipase (Fig. 10) (37, 158, 182, 272). The resulting MAG and long-chain FAs (37, 158, 182, 272) stimulate their own receptors (171). Adipose triglyceride lipase (ATGL) is the major isoform that cleaves triglycerides in PI capillaries (192), besides secretory phospholipases A2 (64). MAG activates metabotropic receptor GPR119, providing signaling via Gαs and cAMP (76, 87, 94, 96, 157, 171). It has been questioned whether the levels of FAs bound to albumin can initiate FASIS (102, 261), but this could happen with metabolic syndrome and/or obesity and type 2 diabetes since circulating FA levels are then elevated.
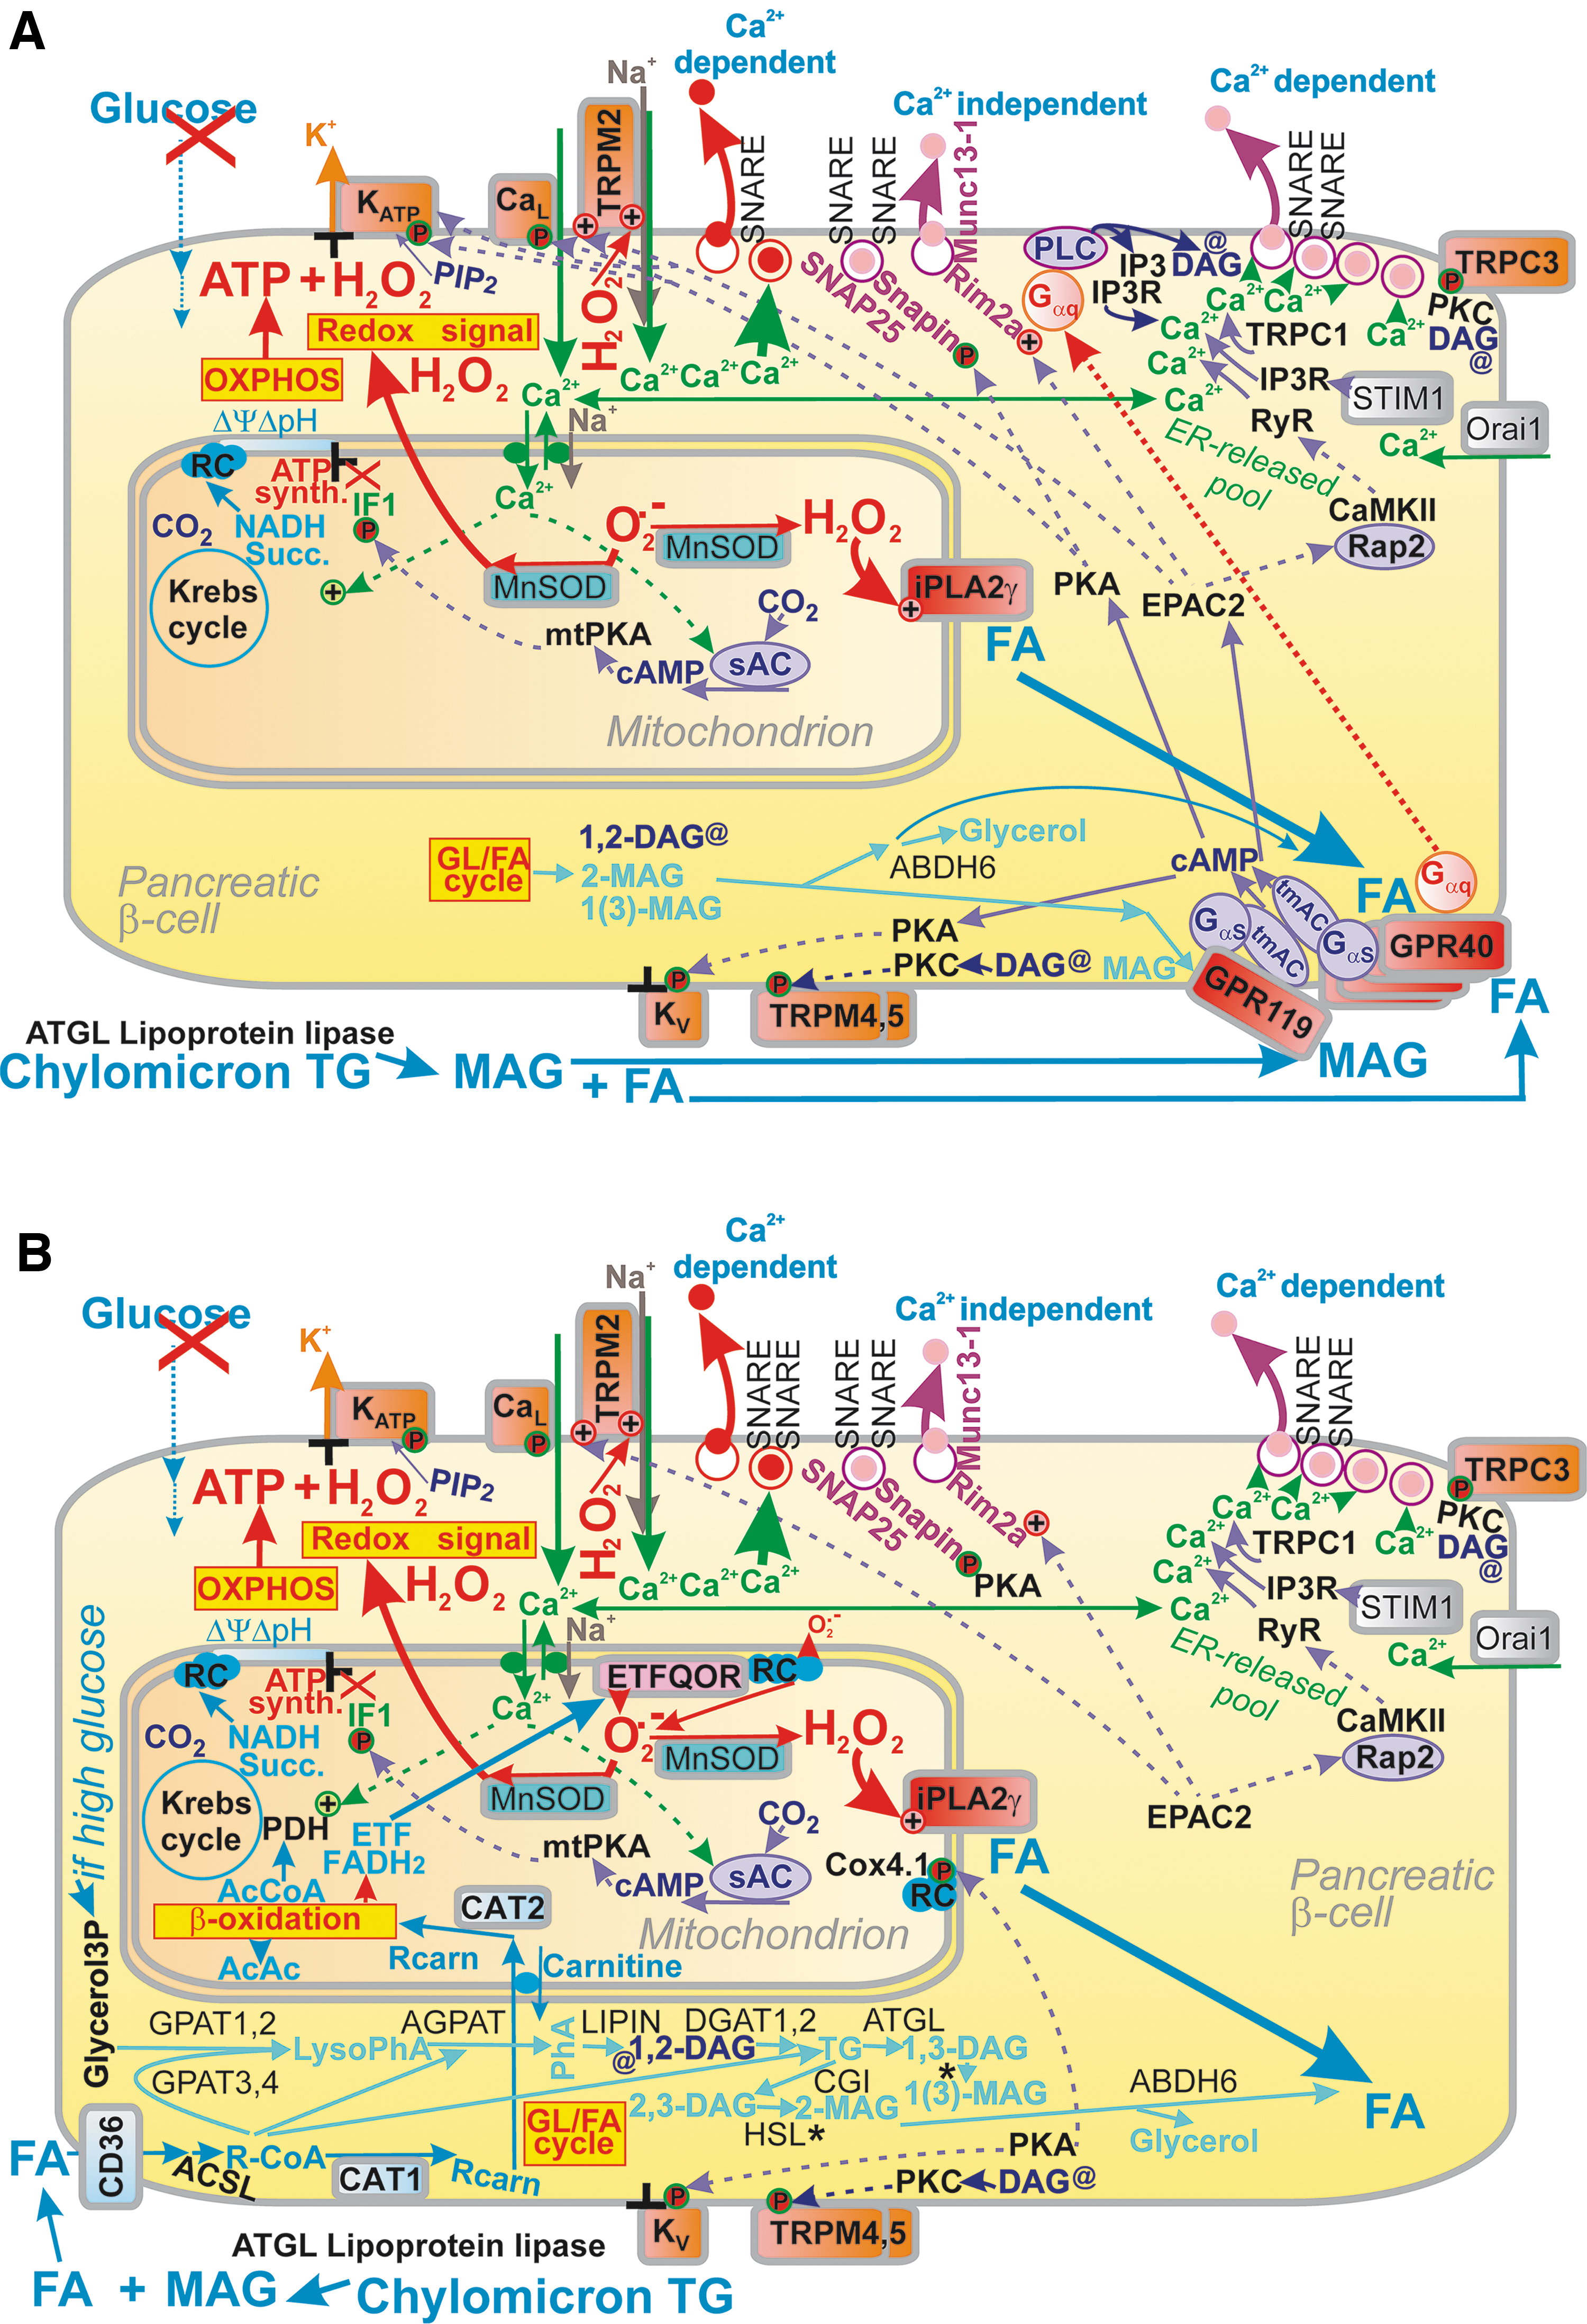
The consensus view was that sufficient glucose must always be present for FAs to induce any insulin secretion (51, 76, 87, 94 –96, 157, 206, 245, 276). However, FASIS was described to exist at low (insulin nonstimulating) [glucose] (32, 103, 106, 194), but not at zero glucose (32). Human islets perifused without glucose did not increase respiration with long-chain FAs, but released insulin (32), whereas both increasing respiration and insulin release were observed with long-chain FAs plus 5.5 mM glucose. FASIS was evidenced by FA triggering an action potential with a prolonged duration at low (insulin nonstimulating) [glucose] (57) and concomitantly increased Ca2+ influx and hence potentiation of insulin secretion (55, 184). As a result, FASIS should be based on the metabolic components plus metabotropic receptor GPR40 signaling (76, 87, 94, 96, 103, 106, 130, 157, 201, 222, 256, 281, 288). It has to be established whether these two branches are mutually independent.
The major receptor pathway of FASIS (Fig. 10A) includes the metabotropic receptor GPR40, as evidenced by its ablation or its point R258W mutation since both impaired FASIS (222). The major pathway downstream of GPR40 initiates signaling via the Gαq/Gα11 (226), activating phospholipase C-β- (PLC-β-) mediated hydrolysis of phosphatidylinositol 4,5-bisphosphate into DAG and IP3 (23). The major axis involves the phosphorylation of TRPM4 (TRPM5) channels by PKC activated by DAG (231) or TRPC3 activation (276). As with TRPM2, the opening of TRPM4, TRPM5, or TRPC3 determines the necessary depolarization shift, despite the 100% closed KATP ensemble. The KATP closure is provided by the metabolic component of FASIS, that is, by FA β-oxidation providing ATP and H2O2, which may also function under low glucose conditions.
Signaling along the axis of GPR40-Gαq/Gq11-PLC-IP3 promotes additional Ca2+ efflux from the ER (initiated by the CaV opening, Fig. 4) via the IP3R, forming a Ca2+ channel of ER membranes (13, 64). Alternatively, a synergy exists for the plasma membrane channel calcium release-activated calcium modulator 1 (Orai1) with IP3R1 and stromal interaction molecule 1 (STIM1), sensing ER Ca2+ (259). If biased GPR40-Gαs signaling occurs, also the EPAC2-RyR route of Ca2+-release from ER might contribute to Ca2+ oscillations. GPR40 also initiates pathways of protein kinase D (PKD), activated by DAG (56), signal-regulated kinase 1 and 2 (ERK1/2) (201), and p21-activated kinase 4 (PAK4) (21). The latter regulates cytoskeletal dynamics, facilitating IGV exocytosis. Signaling downstream of GPR40 slightly increases respiration during 1-h incubations (130). Thus, PKC (224) and downstream ERK1/2 signaling stimulates OXPHOS, hence mitochondrial ATP synthesis (224).
Long-chain FAs are also imported into pancreatic β-cells by the sirtuin-activated CD36 FA transporter (125) (Fig. 10B). If short-chain FAs are present, they act via the GPR41 metabotropic receptor and contribute to the fine-tuning of insulin secretion in both fed and fasting states (200, 263). Similarly, the metabotropic receptor GPR120, having a different selectivity for agonists, mediates the amplification and/or stimulation of insulin secretion, by, for example, α-linolenic acid and polyunsaturated FAs (12, 172).
FA synthesis versus β-oxidation
During GSIS, due to the operation of pyruvate/isocitrate and pyruvate/citrate shuttles, conditions are set for FA synthesis. Metabolomics studies confirmed this, while observing an increase in free palmitic acid after transitions from low to high [glucose] (240). FA metabolism is even considered to be a prerequisite for GSIS since GSIS attenuation was observed in isolated PIs with inhibited triglyceride lipolysis (162, 176), in mice with deleted lipase specifically in β-cells (60) or in ATGL-knockout mice (192). But the net FASIS was not affected by the ATGL deletion. In contrast, at low [glucose] FA β-oxidation readily proceeds in pancreatic β-cells, supplying OXPHOS (Figs. 8 and 10B). Fifty to seventy percent of FAs generated by long-chain acyl-CoA synthetase (ACSL) are recycled into lipogenesis (197).
Retrograde redox signaling upon FASIS
FA β-oxidation is based on mitochondrial flavoprotein dehydrogenases, such as the short-chain acyl-CoA dehydrogenase (EC 1.3.8.1), medium-chain acyl-CoA dehydrogenase (EC 1.3.8.7), long-chain acyl-CoA dehydrogenase (EC 1.3.8.8), and very long-chain acyl-CoA dehydrogenase (EC 1.3.8.9). All of them donate electrons to ETF:QOR via ETF and therefore contribute to the mitochondrial superoxide formation, which after conversion to H2O2 serves as redox signaling (Fig. 11). Therefore, the mechanism is similar as for the β-like oxidation of BCKAs. Even at low [glucose], the ETF-ETF:QOR redox relay to Complex I and III of the mitochondrial respiratory chain serves as the electron acceptor for dehydrogenases of β-oxidation. Interestingly, GPR40 signaling also activated NOX2 (181).
Redox-sensitive mitochondrial phospholipase iPLA2γ amplifies FASIS
Notably, the first FASIS phase (the second FASIS phase only moderately) was highly amplified by the action of mitochondrial phospholipase iPLA2γ (Ca2+-independent phospholipase A2 isoform γ [PNPLA8]), providing the cleaved mitochondrial FAs to GPR40 in insulinoma INS-1E cells (98, 103) and in mouse islets (Holendová et al., unpublished data). The iPLA2γ is directly activated by H2O2, and it is also activated by the intramitochondrial redox signaling resulting from FA β-oxidation (103). The activated iPLA2γ cleaves free long-chain FAs from mitochondrial phospholipids. The cleaved long-chain FAs diffuse to the plasma membrane and subsequently stimulate GPR40 (Fig. 10A, B).
This was indicated by the direct observation of FA diffusion to the plasma membrane using the FA-sensitive fluorescent protein ADIFAB (103). Thus, the pool of free long-chain FAs generated by the glycerol/FA cycle (Figs. 8 and 10B) and CD36-mediated import is enriched by FAs cleaved from mitochondrial membranes. In this way, FAs self-accelerate the GPR40 signaling and hence insulin secretion. In INS-1E cells, ∼66% of the FASIS first phase was dependent on GPR40, and nearly the same 66% of it was blocked upon the silencing of iPLA2γ (or its ablation in mice, unpublished data). Hypothetically, the remaining part may depend on the elevation of ATP plus redox signaling from β-oxidation.
Mixed GSIS and FASIS
At high [glucose], triglyceride synthesis alternates with triglyceride hydrolysis in pancreatic β-cells (197). Because of ATP consumption, this cycling is futile. Since DAG is one of the intermediates of this cycle, it may provide all the above-specified signaling (Figs. 8 and 10B). Moreover, free FAs released during the cycle enrich the net GSIS with this supplemental FASIS. Indeed, the addition of FAs to β-cells and PIs at insulin-stimulating [glucose] amplifies GSIS, whereas β-cell acyl-CoA levels increase and appear to rapidly esterify glycerol-3-phosphate into lysophosphatidic acid and several different glycerolipids (51). This partly replenishes cytosolic NAD+. Also, glycerol-3-phosphatase produces glycerol and thus regulates glycolysis, the cellular redox state, ATP production, and other important branches of metabolism (175). The largest amount of insulin was secreted by INS-1E cells when palmitic acid plus 25 mM glucose were added, relative to either palmitic acid stimulation alone (∼80% of maximum) and GSIS alone (∼30% of maximum) (103).
Higher glucose decreases acyl-CoA levels in pancreatic β-cells (146). Previously, acyl-CoAs were suggested to activate KATP (26), hence declining acyl-CoAs would ease the KATP closure. Moreover, the metabolism of the remaining long-chain acyl-CoAs leads to superoxide/H2O2 formation, which also aids the opening of CaV. In contrast, incoming higher glucose levels in pancreatic β-cells increase malonyl-CoA (81, 146), which inhibits carnitine palmitoyltransferase 1 (CPT1) and hence FA β-oxidation. This in turn opens the way for FA synthesis stemming from the ATP citrate lyase (ACL) reaction after the citrate efflux from the mitochondria (174). Nevertheless, the silencing of ACL and FA synthase in β-cells did not affect GSIS (113).
Upon increasing [glucose], glycerol-3-phosphate is also esterified, so the abundance of long-chain saturated monoacylglycerols increases (174, 291). These MAGs additionally stimulate insulin secretion via the GPR119 receptor and downstream PKA and EPAC2 pathway; the latter notably facilitates IGV priming by activating the protein Munc13-1 (291) (Figs. 8 and 10A). Note that this is similar to the GPR40 activation by the FAs cleaved in the cell interior, that is, from the mitochondrial membranes by mitochondrial phospholipase iPLA2γ.
Footnotes
Acknowledgment
Authors' Contributions
Conceptualization, P.J.; resources, B.H.; writing—original draft preparation, P.J.; writing—review and editing, P.J., B.H., A.D., M.J., and L.P-H.; funding acquisition, P.J.
Author Disclosure Statement
The authors declare no conflicts of interest.
Funding Information
This research was funded by the Grant Agency of the Czech Republic (Grantová Agentura České Republiky, GAČR), grant number 20-00408S.