
Abstract
Aims:
Current treatment options for ovarian clear cell carcinoma (OCCC) are limited to combination of platinum-based and other cytotoxic agents to which patients respond poorly due to intrinsic chemoresistance. There is therefore an urgent need to develop alternative therapeutic strategies for OCCC.
Results:
Cysteine deprivation suppresses OCCC growth in vitro and in vivo with no apparent toxicity. Modes of cell death induced by cysteine deprivation in OCCC are determined by their innate metabolic profiles. Cysteine-deprived glycolytic OCCC is abolished primarily by oxidative stress-dependent necrosis and ferroptosis, which can otherwise be prevented by pretreatment with antioxidative agents. Meanwhile, OCCC that relies on mitochondria respiration for its bioenergetics is suppressed through apoptosis, which can otherwise be averted by pretreatment with cysteine precursor alone, but not with antioxidative agents. Cysteine deprivation induces apoptosis in respiring OCCC by limiting iron−sulfur (Fe−S) cluster synthesis in the mitochondria, without which electron transport chain may be disrupted. Respiring OCCC responds to Fe−S cluster deficit by increasing iron influx into the mitochondria, which leads to iron overload, mitochondria damage, and eventual cell death.
Innovation:
This study demonstrates the importance of cysteine availability in OCCC that is for its antioxidative property and its less appreciated role in mitochondria respiration. Regardless of OCCC metabolic profiles, cysteine deprivation abolishes both glycolytic and respiring OCCC growth in vitro and in vivo.
Conclusion:
This study highlights the therapeutic potential of cysteine deprivation for OCCC.
Introduction
Epithelial ovarian cancer is classified into four major types based on histopathology: (i) serous, (ii) clear cell, (iii) endometrioid, and (iv) mucinous. Of the four histotypes, ovarian clear cell carcinoma (OCCC) is known to be more resistant to conventional platinum-based therapy (5, 7, 20). For recurrent and chemoresistant OCCC, treatment options remain limited to coupling cytotoxic drugs such as docetaxel, paclitaxel, and irinotecan with platinum-based therapy. These cytotoxic drug cocktails have failed to show improvement of patient prognosis from clinical trials (7, 36, 41). This underscores the urgent need for better and more effective therapeutic alternatives for OCCC.
Molecularly, OCCC is defined by cytoplasmic glycogen accumulation that is mainly driven by hepatocyte nuclear factor 1 beta (HNF1B) transcription factor (40). Also, high activity of the PI3K/AKT/mTOR pathway, mediated by PIK3CA mutations, has been widely identified in OCCC cases (19). However, these biomarkers have not been demonstrated to have predictive value for therapeutic outcome in the clinic. Interestingly, both HNF1B overexpression and PIK3CA mutations are commonly involved in cellular metabolism (26), suggesting possible metabolic involvement in OCCC pathogenesis and progression.
Deregulated cellular energetics illustrated by metabolic switch to aerobic glycolysis is one of the hallmarks of cancer (17). Later discoveries have shown that cancer cells are not only addicted to glucose but also dependent on nonessential amino acids (NEAAs) such as glutamine, asparagine, serine, and glycine (25, 29, 35, 46). This highlights possible alternative metabolism-centric strategies in cancer therapy.
Innovation
Treatment options for ovarian clear cell carcinoma (OCCC) are currently limited to cocktails of cytotoxic agents, which do not significantly improve patient's prognosis. Our study is the first to show OCCC's profound dependence on cysteine for survival. We demonstrate the potential of cysteine deprivation to abolish OCCC. We show OCCC to be metabolically heterogeneous, and cysteine deprivation can target both glycolytic and respiring OCCC through the elevation of oxidative stress and energy exhaustion, respectively. We showcase the importance of cysteine in regulating iron homeostasis and mitochondria function, a role besides its well-known antioxidative property.
Cysteine is one of NEAAs, produced endogenously from cystathionine precursor by cysteinase (also known as cystathionase (CTH)/cystathionine-γ-lyase), a pyridoxal phosphate-dependent enzyme, along reverse trans-sulfuration pathway (43). In addition to endogenous cysteine production, cells rely on system xc − for extracellular cystine uptake in exchange for intracellular glutamate (33). Cells require cysteine for it being the rate-limiting amino acid for glutathione (GSH) synthesis. Cysteine is therefore critical for cytoprotection against oxidative stress.
In cysteine-deprived condition, cancer cell is reported to undergo senescence, especially in the presence of stressor, as demonstrated in human melanoma model in which CTH expression is silenced (22). Meanwhile, cysteine deprivation by way of system xc − inhibition is reported to trigger iron-dependent lipid peroxidation and eventual cancer cell death termed ferroptosis, which can otherwise be prevented by iron or lipid peroxidation scavengers (9, 10, 42). Cysteine starvation has furthermore been reported to cause necrosis in Von Hippel-Lindau (VHL)-deficient renal cell carcinoma (RCC) and in triple negative breast cancer (TNBC) (38, 39). Regardless of mechanisms of growth retardation and/or cytotoxicity, these studies show cysteine deprivation to be a potential anticancer strategy, particularly for cancers that display evident addiction to cysteine for survival.
In this study, we revealed OCCC's profound reliance on cysteine for growth. Cysteine deprivation by way of starvation and simultaneous pharmacological inhibition of CTH and system xc − abolishes OCCC proliferation. We further show that cysteine deprivation can target both (i) glycolytic OCCC by oxidative stress-induced necrosis and ferroptosis and (ii) respiring OCCC by ATP depletion due to iron−sulfur (Fe–S) cluster biogenesis deficit. Cysteine deprivation can potentially overcome metabolic heterogeneity and exhaust metabolic flexibility in OCCC. This study showcases how altered bioavailability of cysteine can trigger a cascade of events that eventually inhibit OCCC survival. The work here proposes cysteine deprivation as a potential therapeutic strategy for OCCC.
Results
OCCC survival is highly dependent on cysteine availability
Ten OCCC cell lines were subjected to individual amino acid deprivation (both essential and NEAAs) over a period of 3 days to evaluate their reliance on amino acid for survival. Among the amino acids tested, the growth inhibitory effect of cysteine deprivation was the most prominent (Fig. 1A and Supplementary Fig. S1). OCCC cell lines demonstrate a spectrum of sensitivity toward cysteine deprivation-induced growth inhibition with OVISE, RMG-1, and KOC-5C showing >90% of growth inhibition, while RMG-5, RMG-2, and KOC-7C showing <50% (Fig. 1A).
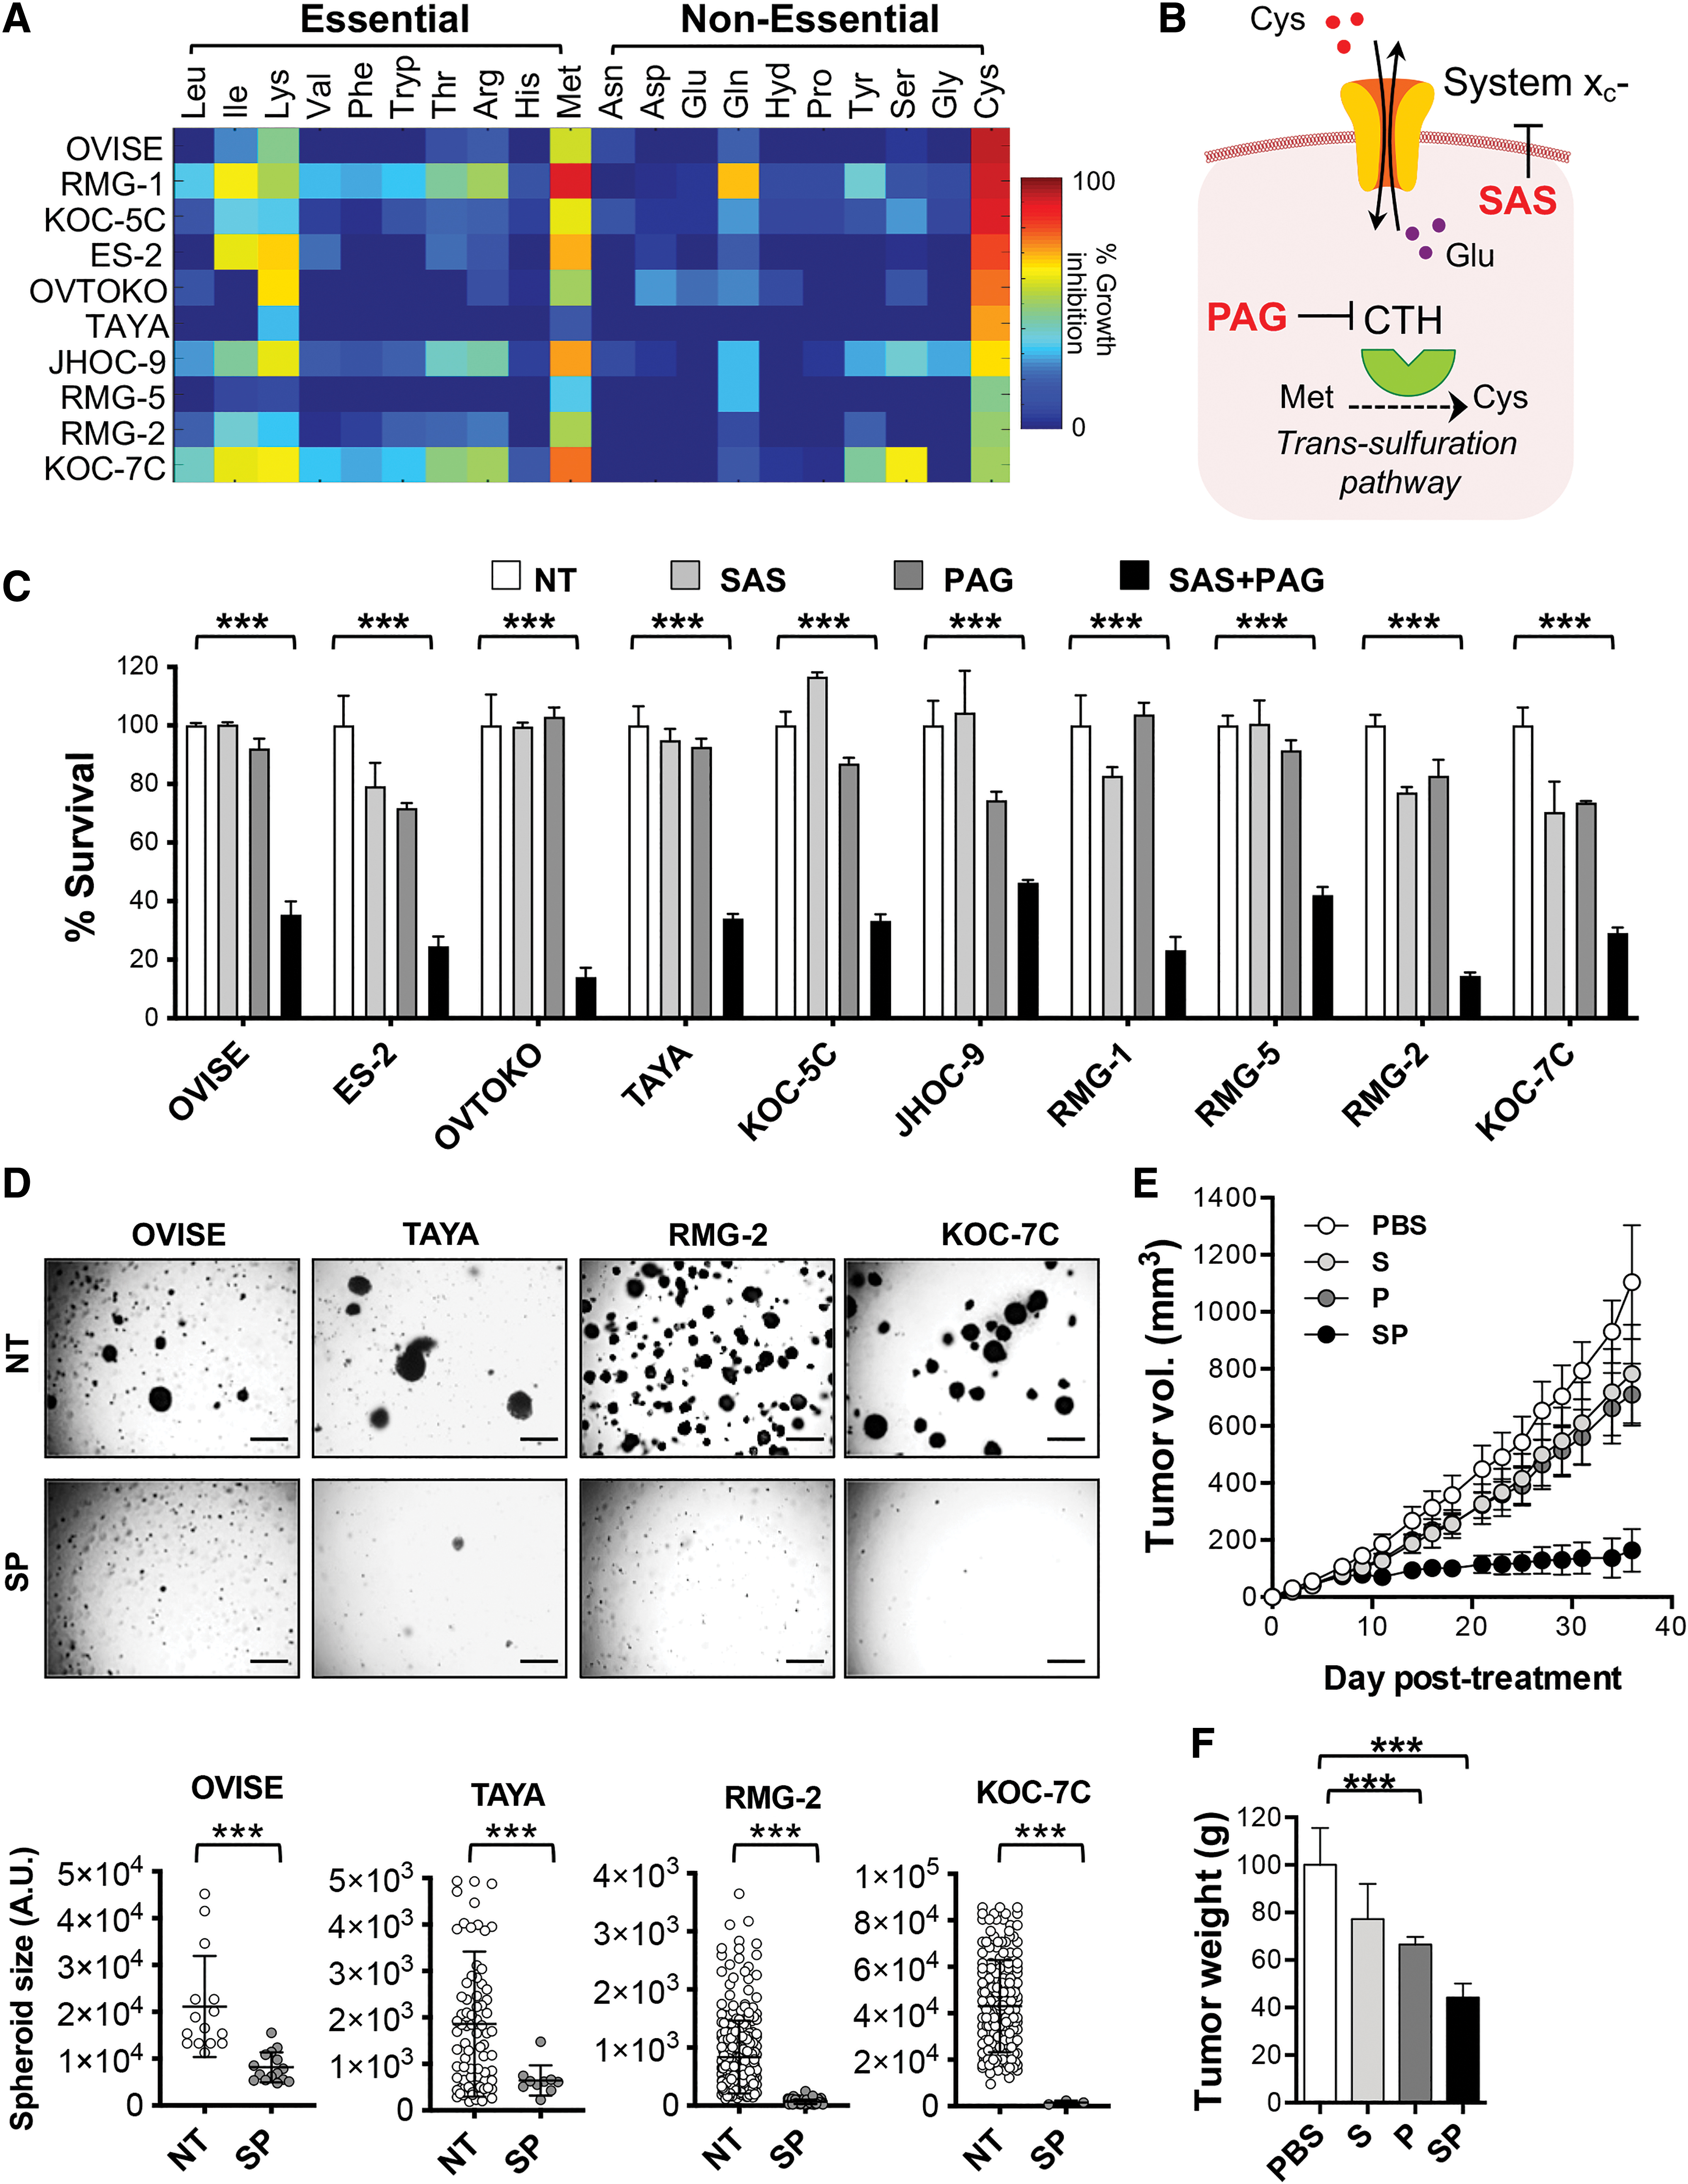
In contrast, glutamine starvation, of which detrimental effects on cancer cell proliferation have been commonly reported (29, 35, 40, 45), did not show significant growth inhibition in OCCC (Fig. 1A and Supplementary Fig. S1). OCCC cells could either survive or were only marginally affected (<40% cell death) by glutamine starvation. Meanwhile, the growth of most OCCC cell lines was inhibited when they were cultured in medium devoid of essential amino acids, particularly isoleucine, lysine, and methionine (Fig. 1A and Supplementary Fig. S1). Interestingly, unlike cysteine starvation, growth inhibition mediated by methionine deprivation was not observed in all OCCC cell lines tested. This is despite methionine being the precursor for the de novo synthesis of cysteine (43). Taken together, the observations here suggest that OCCC cell survival depends on cysteine availability.
The intracellular cysteine pool is maintained by the endogenous cysteine production via CTH and also by the exchange of extracellular cystine with intracellular glutamate, via the system xc
− antiporter (Fig. 1B) (33). We further explored which mechanism could be responsible for the cysteine dependency in OCCC. CTH is highly expressed in OCCC tumor and cell lines compared with other histotypes (Supplementary Fig. S2A, B). However, suppression of CTH catalytic activity by
Thus, we tested the growth inhibition effects of SAS and PAG in combination with these OCCC cell lines. Indeed, OCCC cell lines that did not initially respond to either PAG or SAS alone (KOC-5C, JHOC-9, RMG-5, RMG-2, and KOC-7C) were significantly inhibited by the combination of sublethal concentrations of both inhibitors (Fig. 1C). Combination of SAS and PAG treatment could also inhibit anchorage-independent clonogenicity of OCCC in soft agar (Fig. 1D). Importantly, SAS and PAG combined treatment, but not single drug injection, significantly suppressed OCCC growth in vivo without dramatic mouse body weight change over the course of treatment (Fig. 1E, F and Supplementary Fig. S3). Combined SAS and PAG treatment showed potency in OVISE and KOC-7C xenograft mouse models, both of which being the most and least sensitive to cysteine deprivation, respectively.
Cysteine deprivation mediates two distinct mechanisms of cytotoxicity, apoptosis, and oxidative stress-dependent necrosis and ferroptosis
As OVISE and KOC-7C showed the highest and lowest sensitivity to cysteine deprivation (Fig. 1A), we utilized these two cell lines to further elucidate the mechanisms underlying cysteine deprivation-induced growth inhibition. Similar to combination of SAS and PAG treatment (Fig. 1C), double knockdown of system xc − and CTH decreased OVISE and KOC-7C cell viability (Supplementary Fig. S2E). The greater cytotoxicity observed when using combination of SAS and PAG coincided with maximum cellular cysteine depletion in both OVISE and KOC-7C (Fig. 2A).
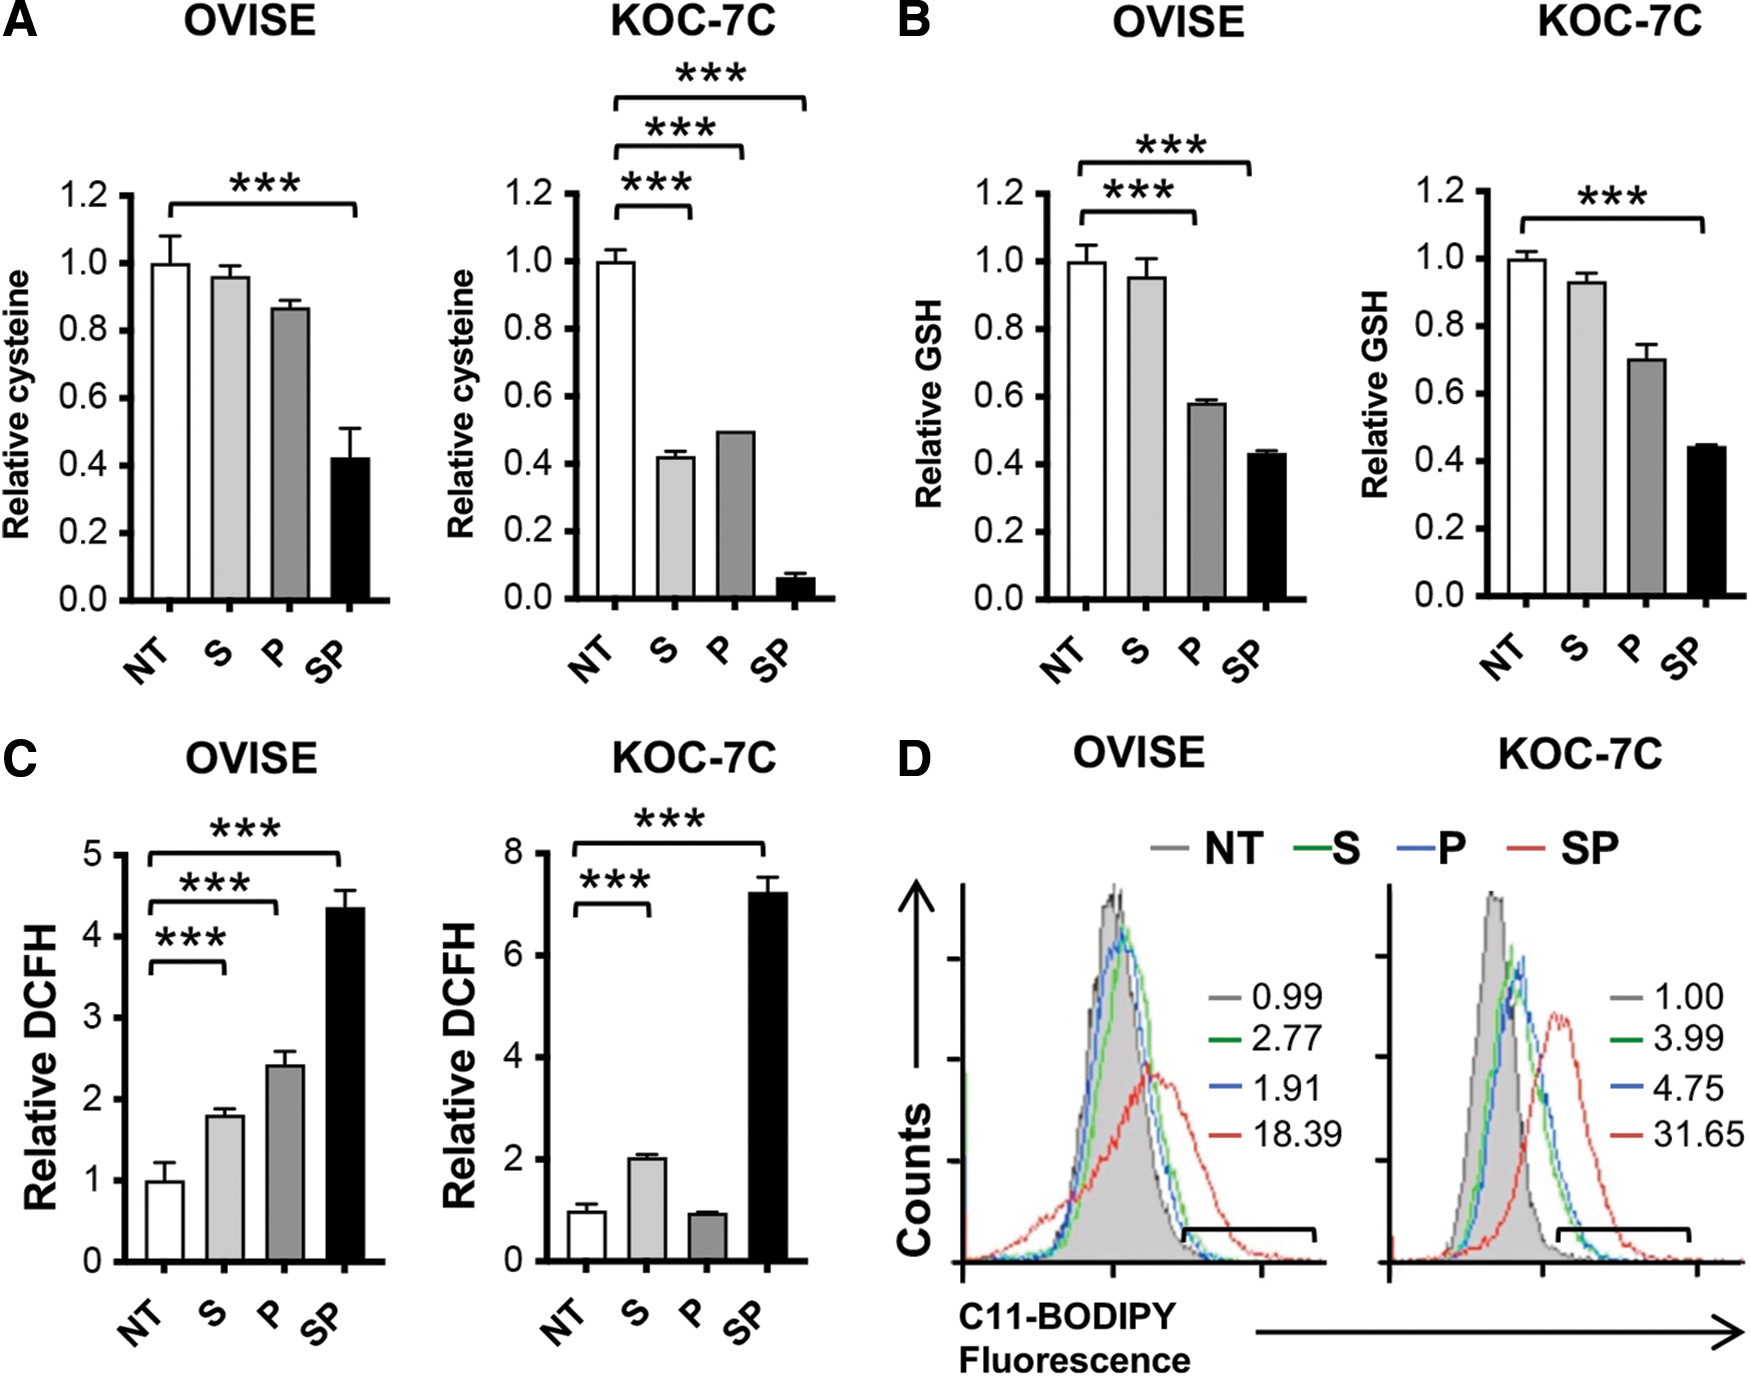
Cysteine is the limiting amino acid for de novo synthesis of glutathione, the major nonenzyme antioxidant in cell. Therefore, cysteine deprivation is expected to disrupt cellular defense against oxidative stress. In agreement, we observed a marked decrease in total glutathione level in both cell lines upon SAS and PAG combinatory treatment (Fig. 2B). Consistent with the reduction in glutathione levels, there was a higher detectable level of reactive oxygen species (ROS) in combined SAS- and PAG-treated OVISE and KOC-7C (Fig. 2C). The increase in ROS also oxidized cell membrane lipids resulting in increased lipid peroxidation (Fig. 2D).
It is worth mentioning that OVISE and KOC-7C have different basal cysteine levels, such that OVISE has significantly lower intracellular cysteine pool compared with KOC-7C (Supplementary Fig. S4A). In addition, the cysteine levels are inversely correlated with the amount of ROS detected at steady state (Supplementary Fig. S4C). Interestingly, despite the differing basal cysteine levels between OVISE and KOC-7C, both cell lines have comparable levels of GSH (Supplementary Fig. S4B). We posited that cysteine in KOC-7C is utilized for other biological purposes besides GSH synthesis.
Rescue experiments were next attempted to assess the involvement of oxidative stress in cysteine deprivation-mediated growth suppression. Combination of SAS and PAG treatment cumulated to cytotoxicity and was successfully prevented by preaddition of the cysteine precursor, N-acetyl
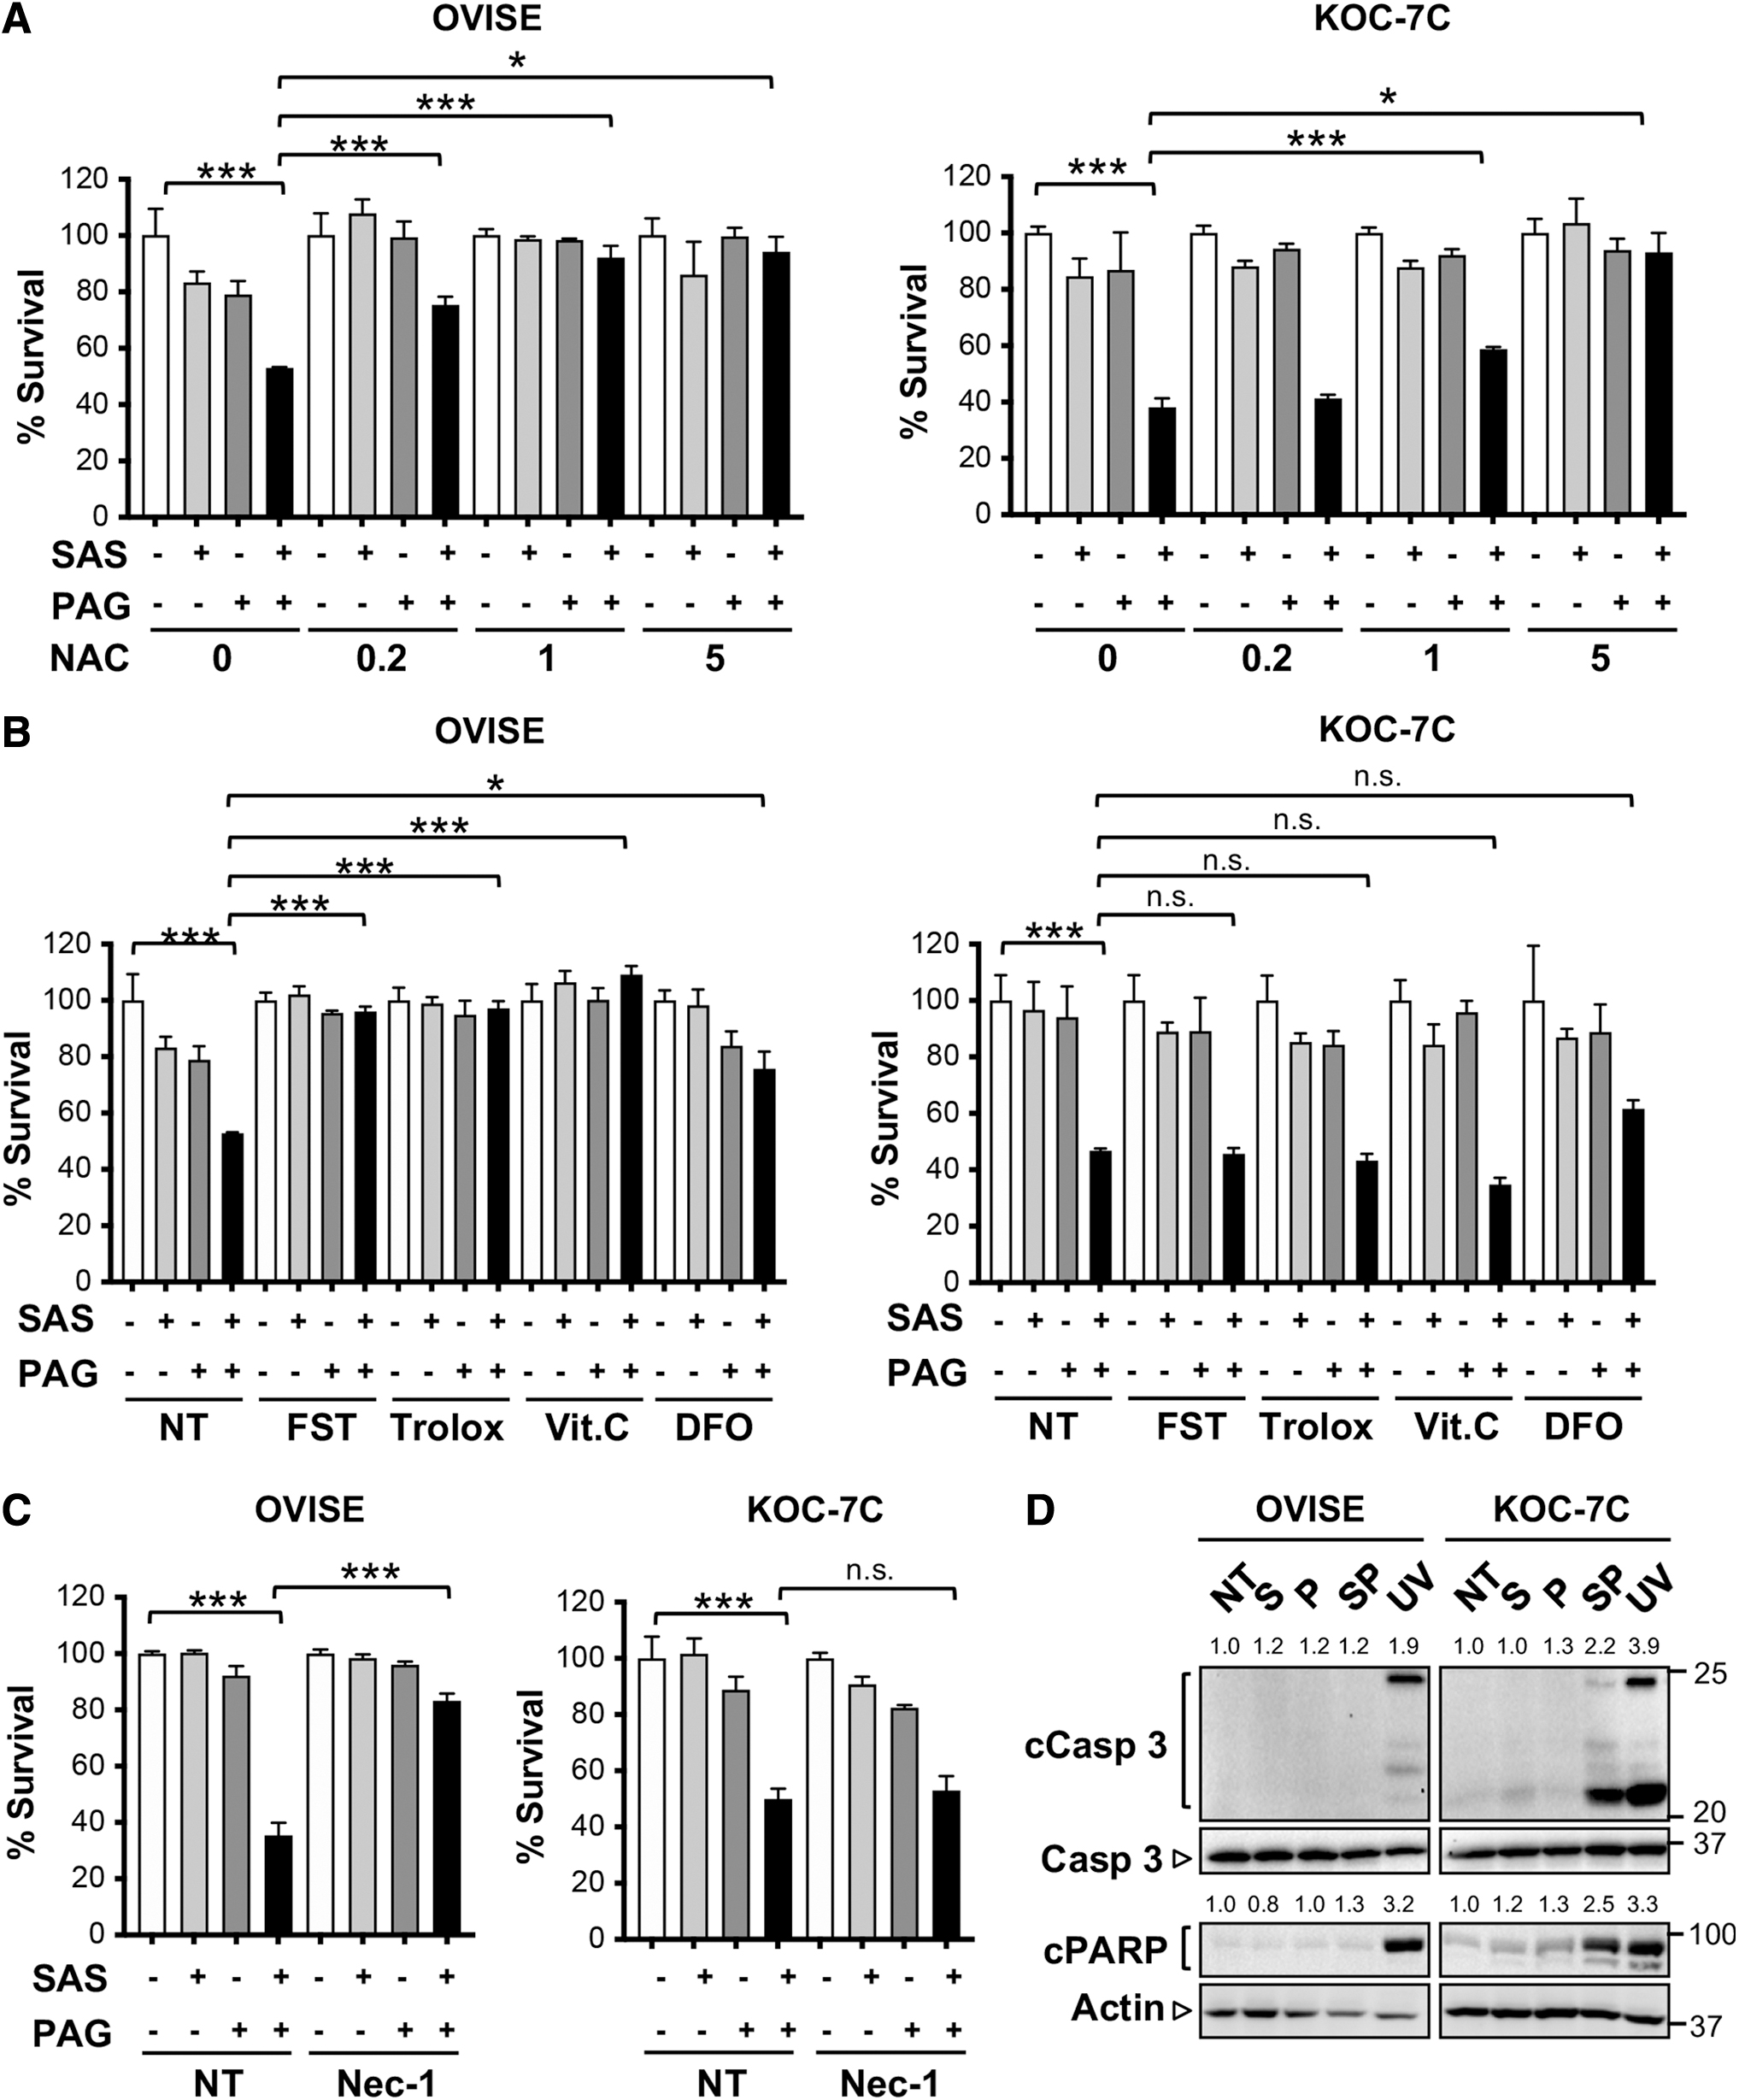
Apart from ferroptosis, cysteine deprivation has been reported to cause cell death by necrosis in VHL-deficient RCC and in TNBC (38, 39). We explored whether necrosis could also be observed in cysteine-deprived OVISE. By pretreating OVISE and KOC-7C with necrostatin-1 (Nec-1), an inhibitor of necrosis, Nec-1 protected OVISE, but not KOC-7C from cysteine deprivation-induced cell death (Fig. 3C). Such distinctive rescue profiles were also observed in other OCCC cell lines; ES-2 and TAYA survival upon SAS and PAG treatment could be sustained by various antioxidative agents, while SAS- and PAG-treated JHOC-9 cell death could only be prevented significantly by NAC (Supplementary Fig. S5). Altogether, the data suggest that cysteine deprivation induces ferroptosis and necrosis in OVISE but not in KOC-7C.
Only pretreatment with cysteine precursor NAC could alleviate growth inhibition in KOC-7C (Fig. 3A, right panel). This suggests to us that ROS is not the primary driver of growth inhibition in KOC-7C, and its reliance on cysteine for survival could be more than cysteine's role as an antioxidant. Our speculation is supported by the comparable steady-state levels of GSH between OVISE and KOC-7C, despite KOC-7C having a significantly higher intracellular cysteine pool (Supplementary Fig. S4A, B).
Analysis of caspase 3 and PARP cleavage showed a preference for apoptosis-mediated cell death in KOC-7C after SAS and PAG combinatory treatment (Fig. 3D). This is further supported by flow cytometry profile that showed increase in Annexin V/propidium iodide (PI) staining, an indication for both early and late apoptosis, in combined SAS- and PAG-treated KOC-7C (Supplementary Fig. S6). In contrast, the lack of caspase 3 and PARP cleavage in OVISE supports the alternative mode of cell death; that is, ferroptosis in combination with necrosis.
Our observations thus far show two distinct mechanisms of cytotoxicity brought about by cysteine deprivation: (i) apoptosis that seems to be independent of oxidative stress exemplified by KOC-7C and (ii) oxidative stress-dependent necrosis, in combination with ferroptosis, demonstrated by OVISE. Such dual death mechanisms in OCCC further support our previous postulation that cysteine may carry out other roles in addition to its antioxidative function.
Mode of cysteine deprivation-induced cytotoxicity in OCCC is associated with intrinsic metabolic profiles
The differing dependence on oxidative stress as a mediator of cell death in KOC-7C and OVISE alludes to their different metabolic profiles. We initially postulated that OVISE acquires cellular energy through mitochondria respiration. In the event of cysteine deprivation and glutathione depletion, mitochondria ROS generated from oxidative phosphorylation left unchecked, leading to cytotoxicity. We, however, observed otherwise. There was no significant difference in basal oxygen consumption rate between OVISE and KOC-7C (Fig. 4A). Notably, OVISE showed a significantly higher spare respiratory capacity compared with KOC-7C upon mitochondria uncoupler carbonyl cyanide-4-(trifluoromethoxy)phenylhydrazone (FCCP) challenge (Fig. 4A, right panel). This implies that mitochondria of OVISE are not fully utilized while those of KOC-7C are already functioning at its maximum. This suggests KOC-7C (instead of OVISE) intrinsic dependence on mitochondria for bioenergetics.
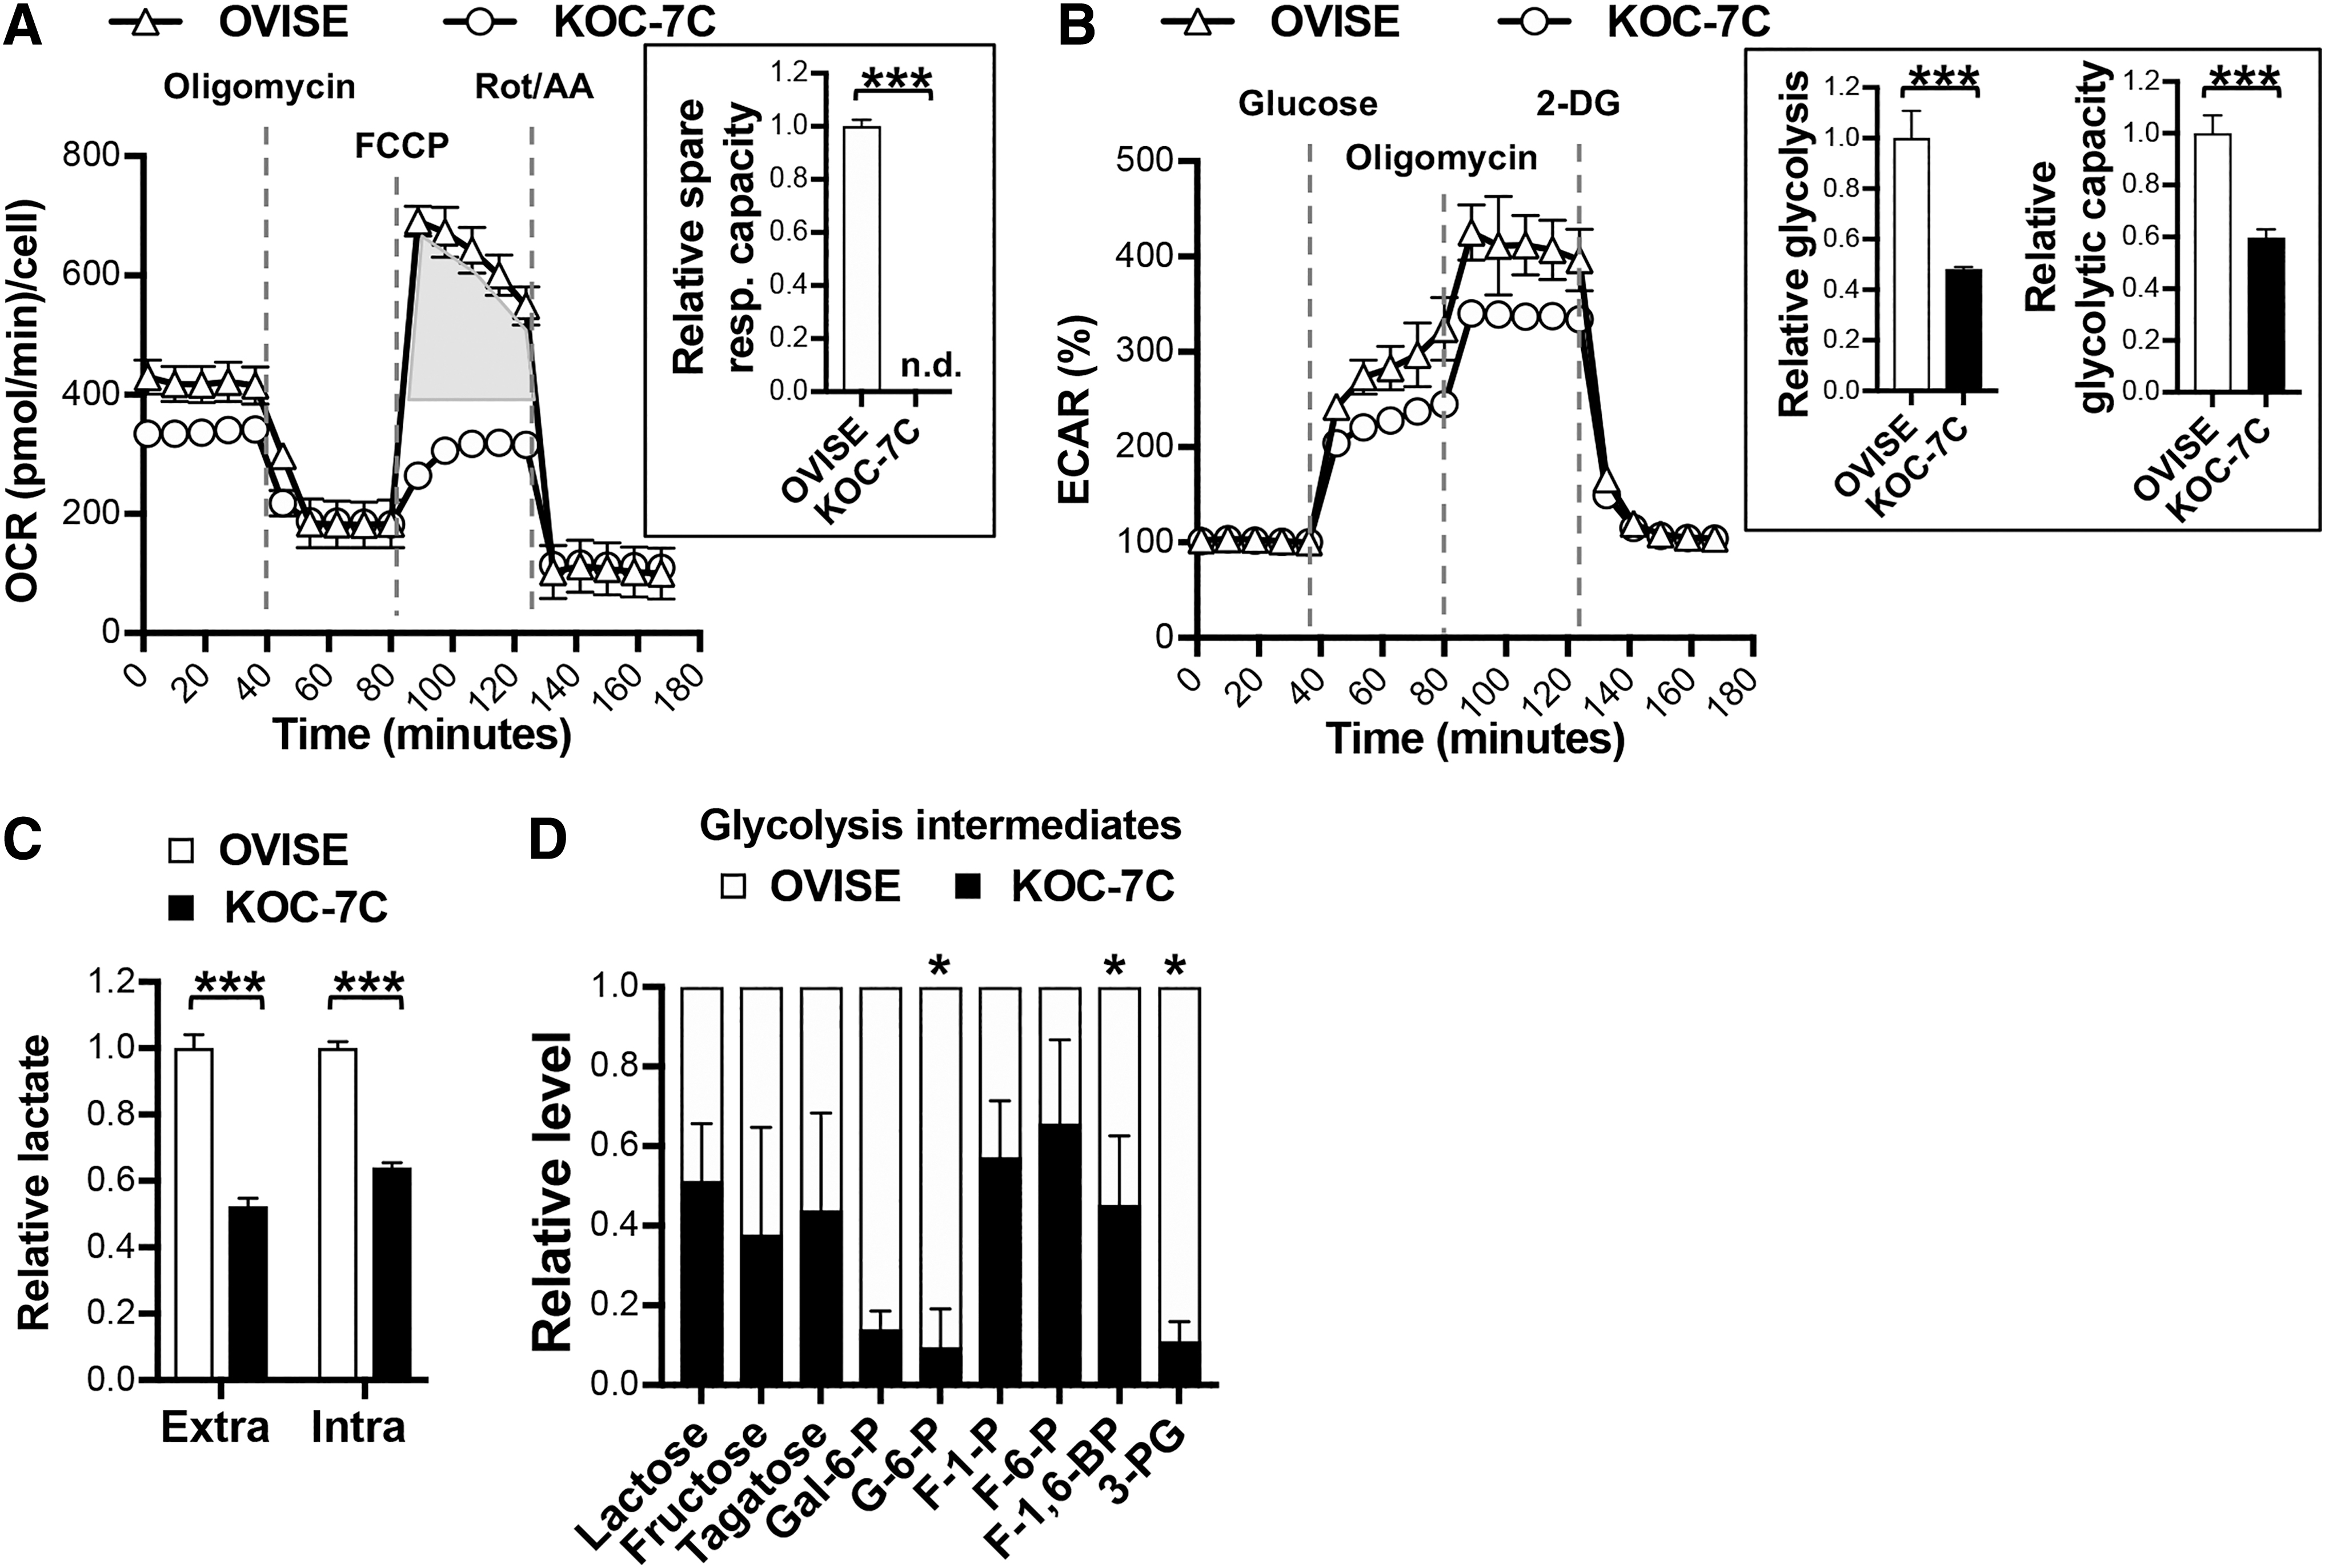
Since OVISE is not dependent on mitochondria respiration for energy compared with KOC-7C, we hypothesized that OVISE may be intrinsically more glycolytic. Using extracellular acidification rate (ECAR) and lactate production as indicators for glycolysis, we observed a significantly higher glycolytic rate and capacity as well as extra- and intracellular lactate production in OVISE compared with KOC-7C (Fig. 4B, C and Supplementary Fig. S4D). A metabolomic analysis comparing these two cell lines further classifies OVISE as a preferentially glycolytic OCCC. OVISE showed significantly higher levels of glycolysis intermediates, such as glucose-6-phosphate, fructose-1,6-bisphosphate, and 3-phosphoglycerate (Fig. 4D). Taken together, our data draw attention to metabolic heterogeneity in OCCC, with KOC-7C being respiring and OVISE being glycolytic. The different metabolic profiles may account for their very different modes of death in response to cysteine deprivation.
Deficits in Fe–S cluster biogenesis during cysteine deprivation lead to mitochondria damage in respiring OCCC
Given KOC-7C's predisposition toward mitochondria respiration, we next asked if SAS and PAG combined treatment would impact KOC-7C mitochondria function to cause cell death. Indeed, similar to the mitochondria uncoupler FCCP, SAS and PAG combined treatment results in mitochondria membrane potential (MMP) loss (Fig. 5A). The release of cytochrome c into the cytosol further evidences the loss in MMP (Fig. 5B). Altogether, these observations strengthen apoptosis as the mechanism of cell death in KOC-7C upon SAS and PAG treatment. Cysteine deprivation was also found to cause the total collapse of the mitochondrial respiratory chain (Fig. 5C).
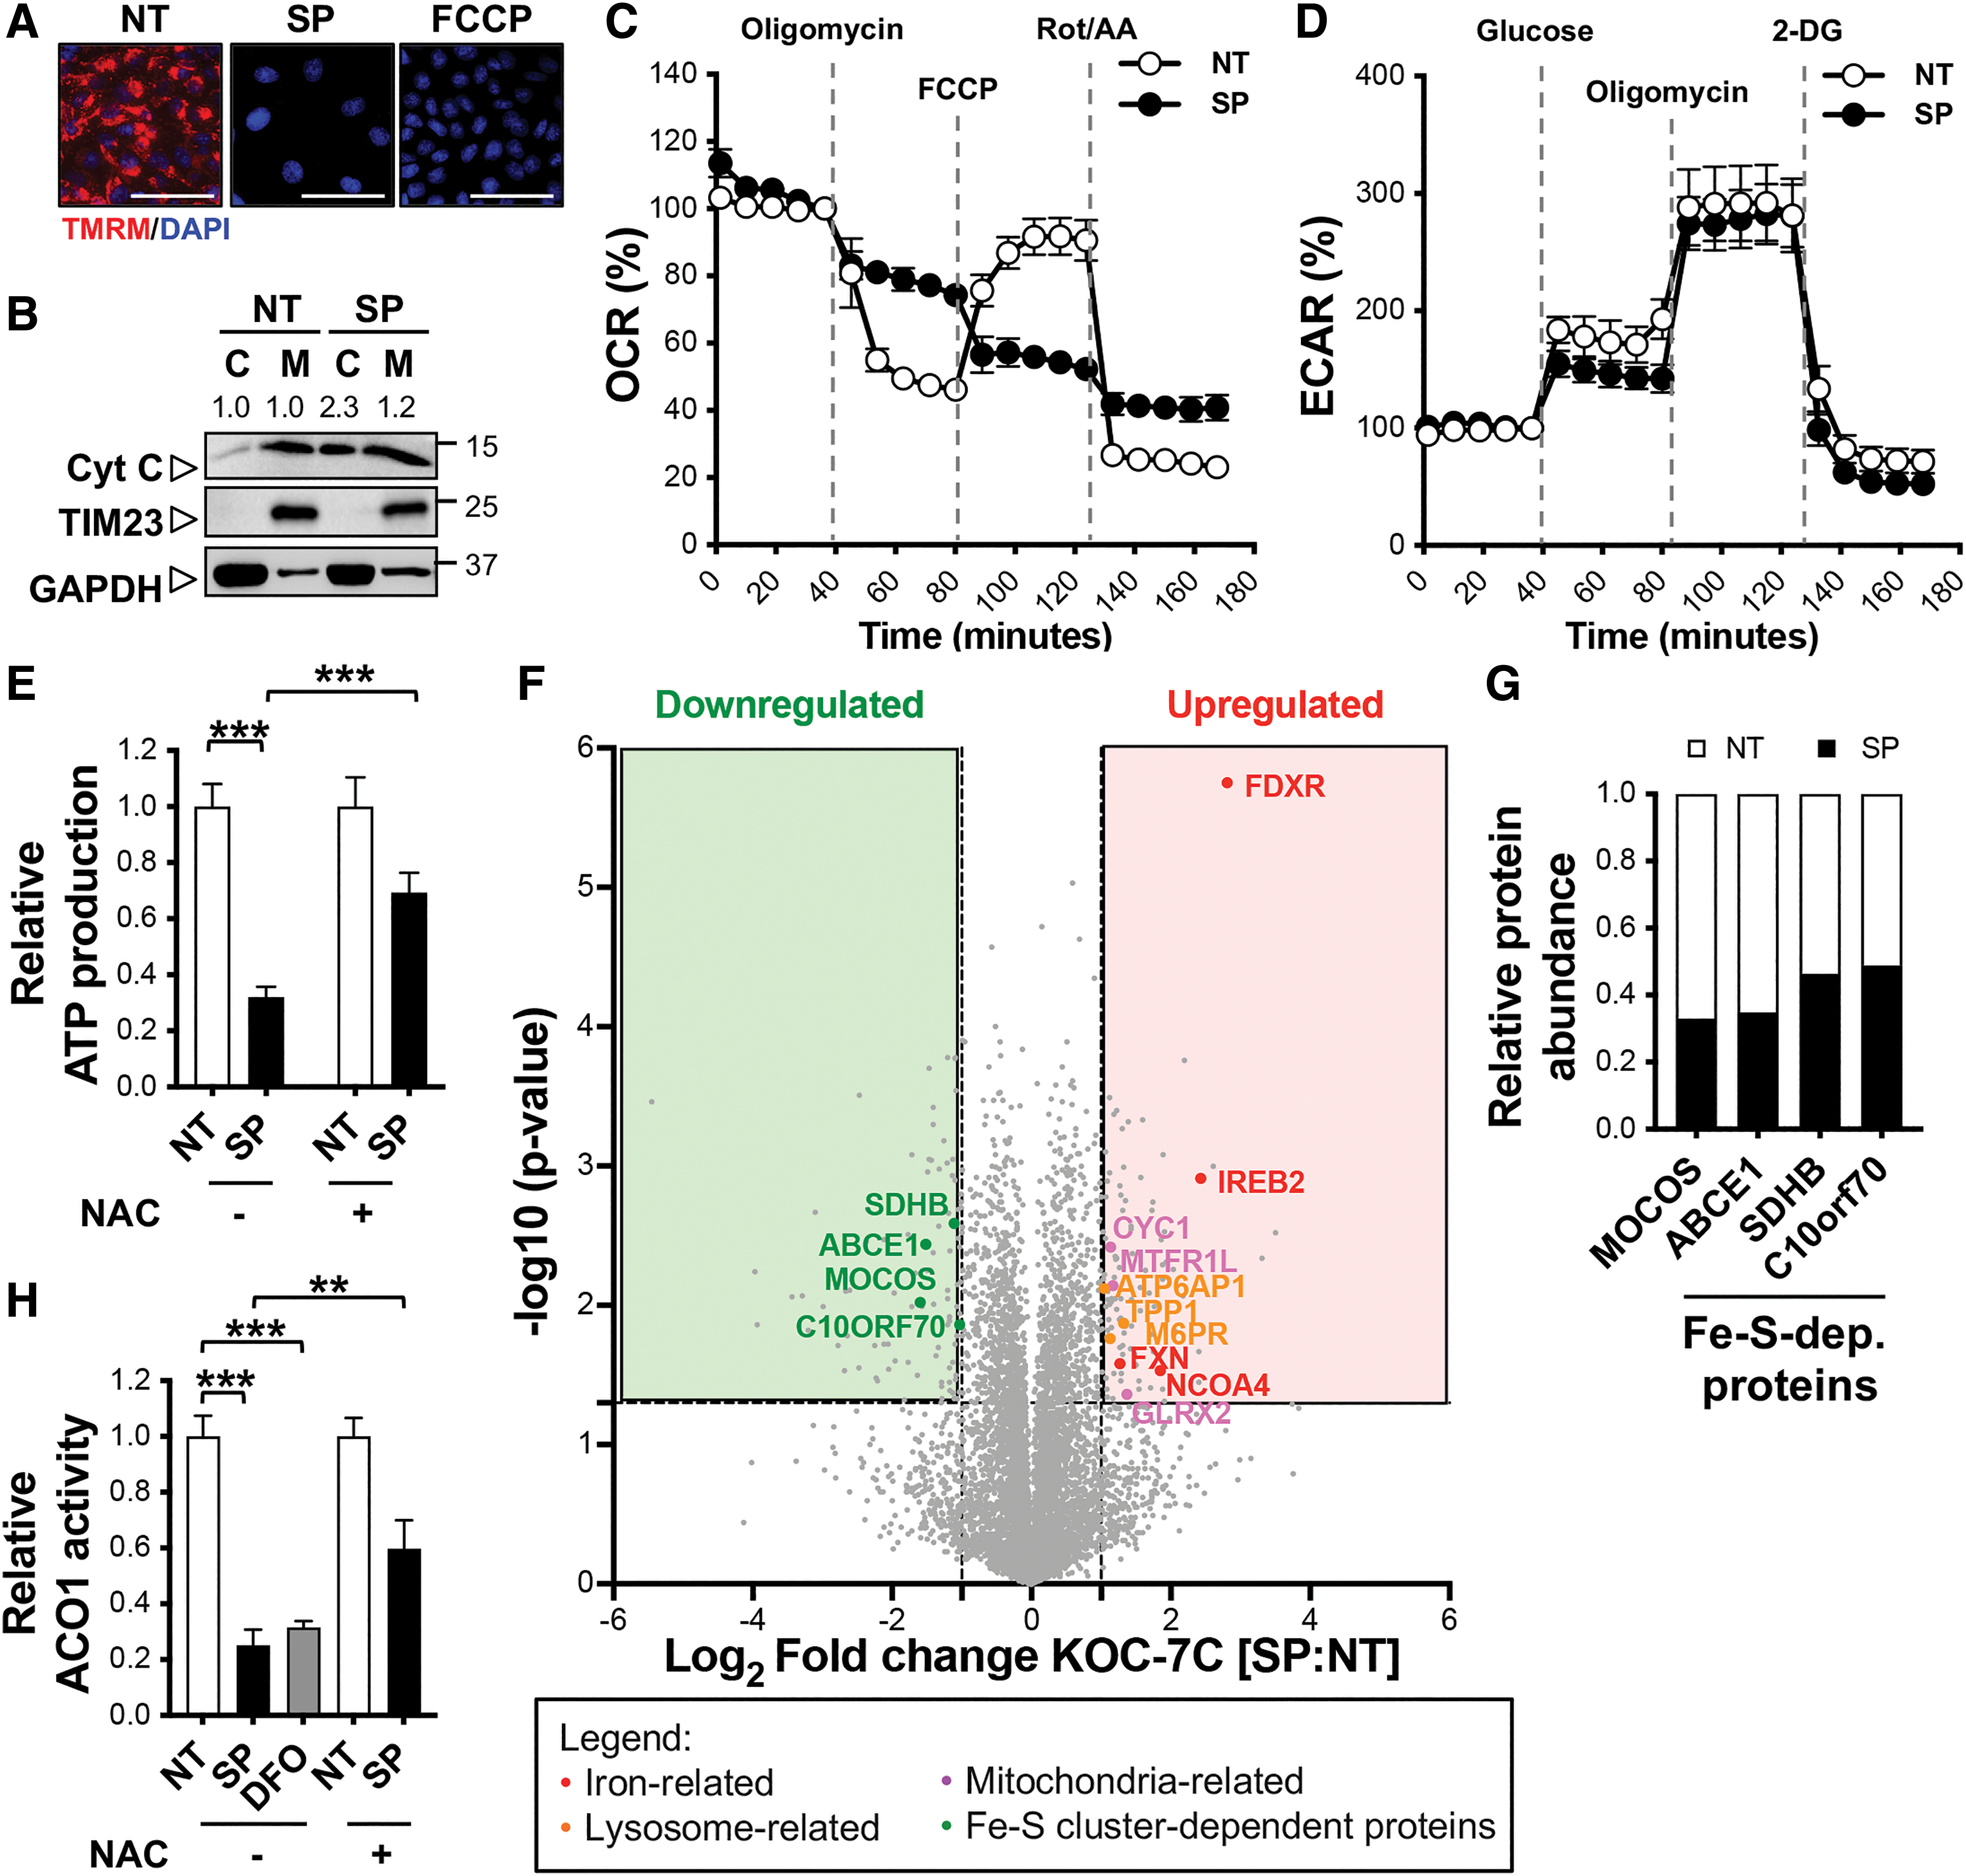
With the loss of mitochondria function, compensation by metabolic switch from respiration to glycolysis is expected. However, ECAR analysis showed that combined SAS and PAG treatment did not alter KOC-7C glycolytic activity significantly (Fig. 5D). Naturally, ATP production in KOC-7C fell drastically (Fig. 5E). These observations reiterate KOC-7C's reliance on mitochondria respiration for energy, and that SAS and PAG combinatory treatment results in KOC-7C cytotoxicity via disruption of mitochondria function.
Mitochondria proteins that participate in electron transport chain are predominantly metalloenzymes whose activities depend on Fe−S cluster cofactor (34). We postulated that Fe−S cluster synthesis is impaired when cysteine is limiting, given that cysteine is the main source of sulfur in mitochondria. We speculated that the excess steady-state cysteine level detected in KOC-7C (Supplementary Fig. S4) may have been utilized for Fe−S cluster biogenesis.
Global proteomics analysis showed an overall decrease in the expressions of Fe−S cluster-dependent proteins (Fig. 5F, G) such as molybdenum cofactor sulfurase and mitochondrial succinate dehydrogenase B in cysteine-deprived KOC-7C. Furthermore, Fe−S-dependent aconitase 1 (ACO1, also known as IREB1 or IRP1) enzyme activity was decreased upon SAS and PAG combined treatment, similar to effect of iron chelator, DFO treatment (Fig. 5H). The decrease in ACO1 activity indicates a deficit in Fe−S cluster biogenesis. Pretreatment with the cysteine precursor, NAC, partially rescued both ATP production and ACO1 enzymatic activity in KOC-7C (Fig. 5E, H). This suggests to us that Fe−S cluster synthesis deficit underlies the mitochondria dysfunction observed in cysteine-deprived KOC-7C.
Cysteine deprivation mimics an iron-deplete cellular environment and shifts ACO1 cellular function from enzymatic to transcription regulation in respiring OCCC
Our global proteomics analysis (Fig. 5F) also revealed a prominent increase of iron-responsive element-binding protein 2 (IREB2 also known as IRP2). IREB2, together with ACO1, function as the cellular iron sensors, and IREB2 expression is enhanced when level of intracellular iron is low (3). In agreement with the proteomics data, IREB2 expression level in cysteine-deprived KOC-7C was elevated (Fig. 6A) similar to the phenomena observed with DFO treatment. This increase in IREB2 expression was restored to basal level when KOC-7C was pretreated with NAC. In contrast, exposure to ferrous ammonium sulfate hexahydrate, an iron salt, decreased IREB2 levels, demonstrating that cysteine deprivation is rather similar to iron-deplete cellular environment in KOC-7C.
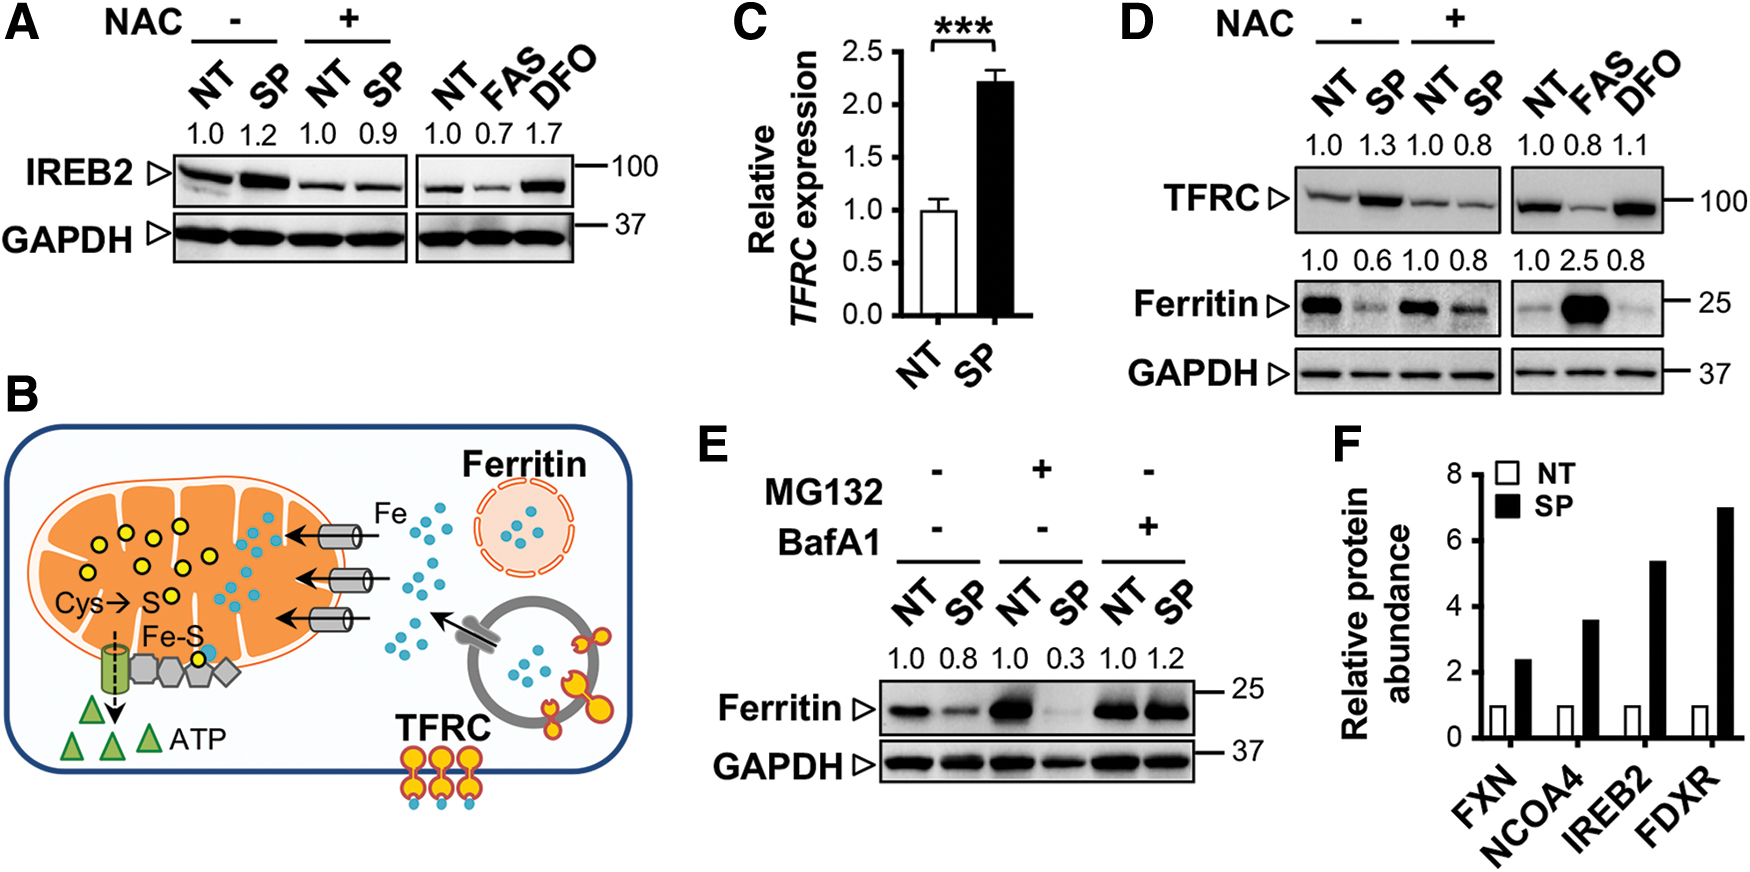
ACO1's ability to catalyze the conversion of aconitate to isocitrate is suppressed in iron-deplete conditions, a phenomenon we also observed in cysteine-deprived KOC-7C (Fig. 5H). In turn, ACO1 shifts its cellular function to that of a transcription regulator, upregulating the expression of transferrin receptor (TFRC also known as TFR1), which is responsible for maintaining intracellular iron levels (Fig. 6B) (3). Both TFRC transcript and protein were consistently upregulated in SAS- and PAG-treated KOC-7C (Fig. 6C, D). The predominant role of ACO1 in transcription regulation during cysteine deprivation further draws parallel with iron-deplete intracellular environment in respiring OCCC.
Cysteine deprivation promotes lysosomal degradation of cytosolic ferritin and results in iron buildup in the mitochondria of respiring OCCC
In SAS and PAG combined treatment, we observed ferritin protein downregulation, which was partially rescued by pretreatment with NAC (Fig. 6D). Proteomic analysis showed increased expressions of proteins involved in lysosomal acidification and degradation activity such as vacuolar-type proton ATPases (ATP6AP1) and tripeptidyl peptidase 1 (Fig. 5F). In particular, we noticed the significant elevation in the expression of nuclear receptor coactivator 4 (NCOA4) in cysteine-deprived KOC-7C (Fig. 5F). NCOA4 is known to bind to ferritin heavy chain and chaperone it to lysosome (11). Restoration of ferritin levels by the lysosomal inhibitor, bafilomycin A1 (BafA1), but not the proteasomal inhibitor, MG132 (Fig. 6E) indicates a higher ferritin turnover by lysosomal breakdown in cysteine-deprived cells.
With an increase in TFRC-mediated extracellular iron uptake (Fig. 6D) and intracellular lysosomal degradation of ferritin nanocages (Fig. 6D, E), cellular iron was expected to increase in treated KOC-7C. Consistently, labile iron pool (LIP) drastically increased in cells treated with combined SAS and PAG, compared with the control NT group (Fig. 7A). The increase in LIP possibly reflects KOC-7C's feedback mechanism to restore Fe–S cluster synthesis in mitochondria. Interestingly, the day-dependent increase in LIP was in line with the increase in gene expression of mitoferrin 2 (MFRN2 also known as SLC25A28), a mitochondria-localized iron importer, that peaked on day 3 post-PAG and SAS combined treatment (Fig. 7B). We also observed the elevation of mitochondria iron upon cysteine deprivation (Fig. 7C). Mitochondria are equipped with their own ferritin to restore iron homeostasis in the event of iron overload (12, 23, 28). Consistently, we observed an increase in mitochondria ferritin expression (Fig. 7D).
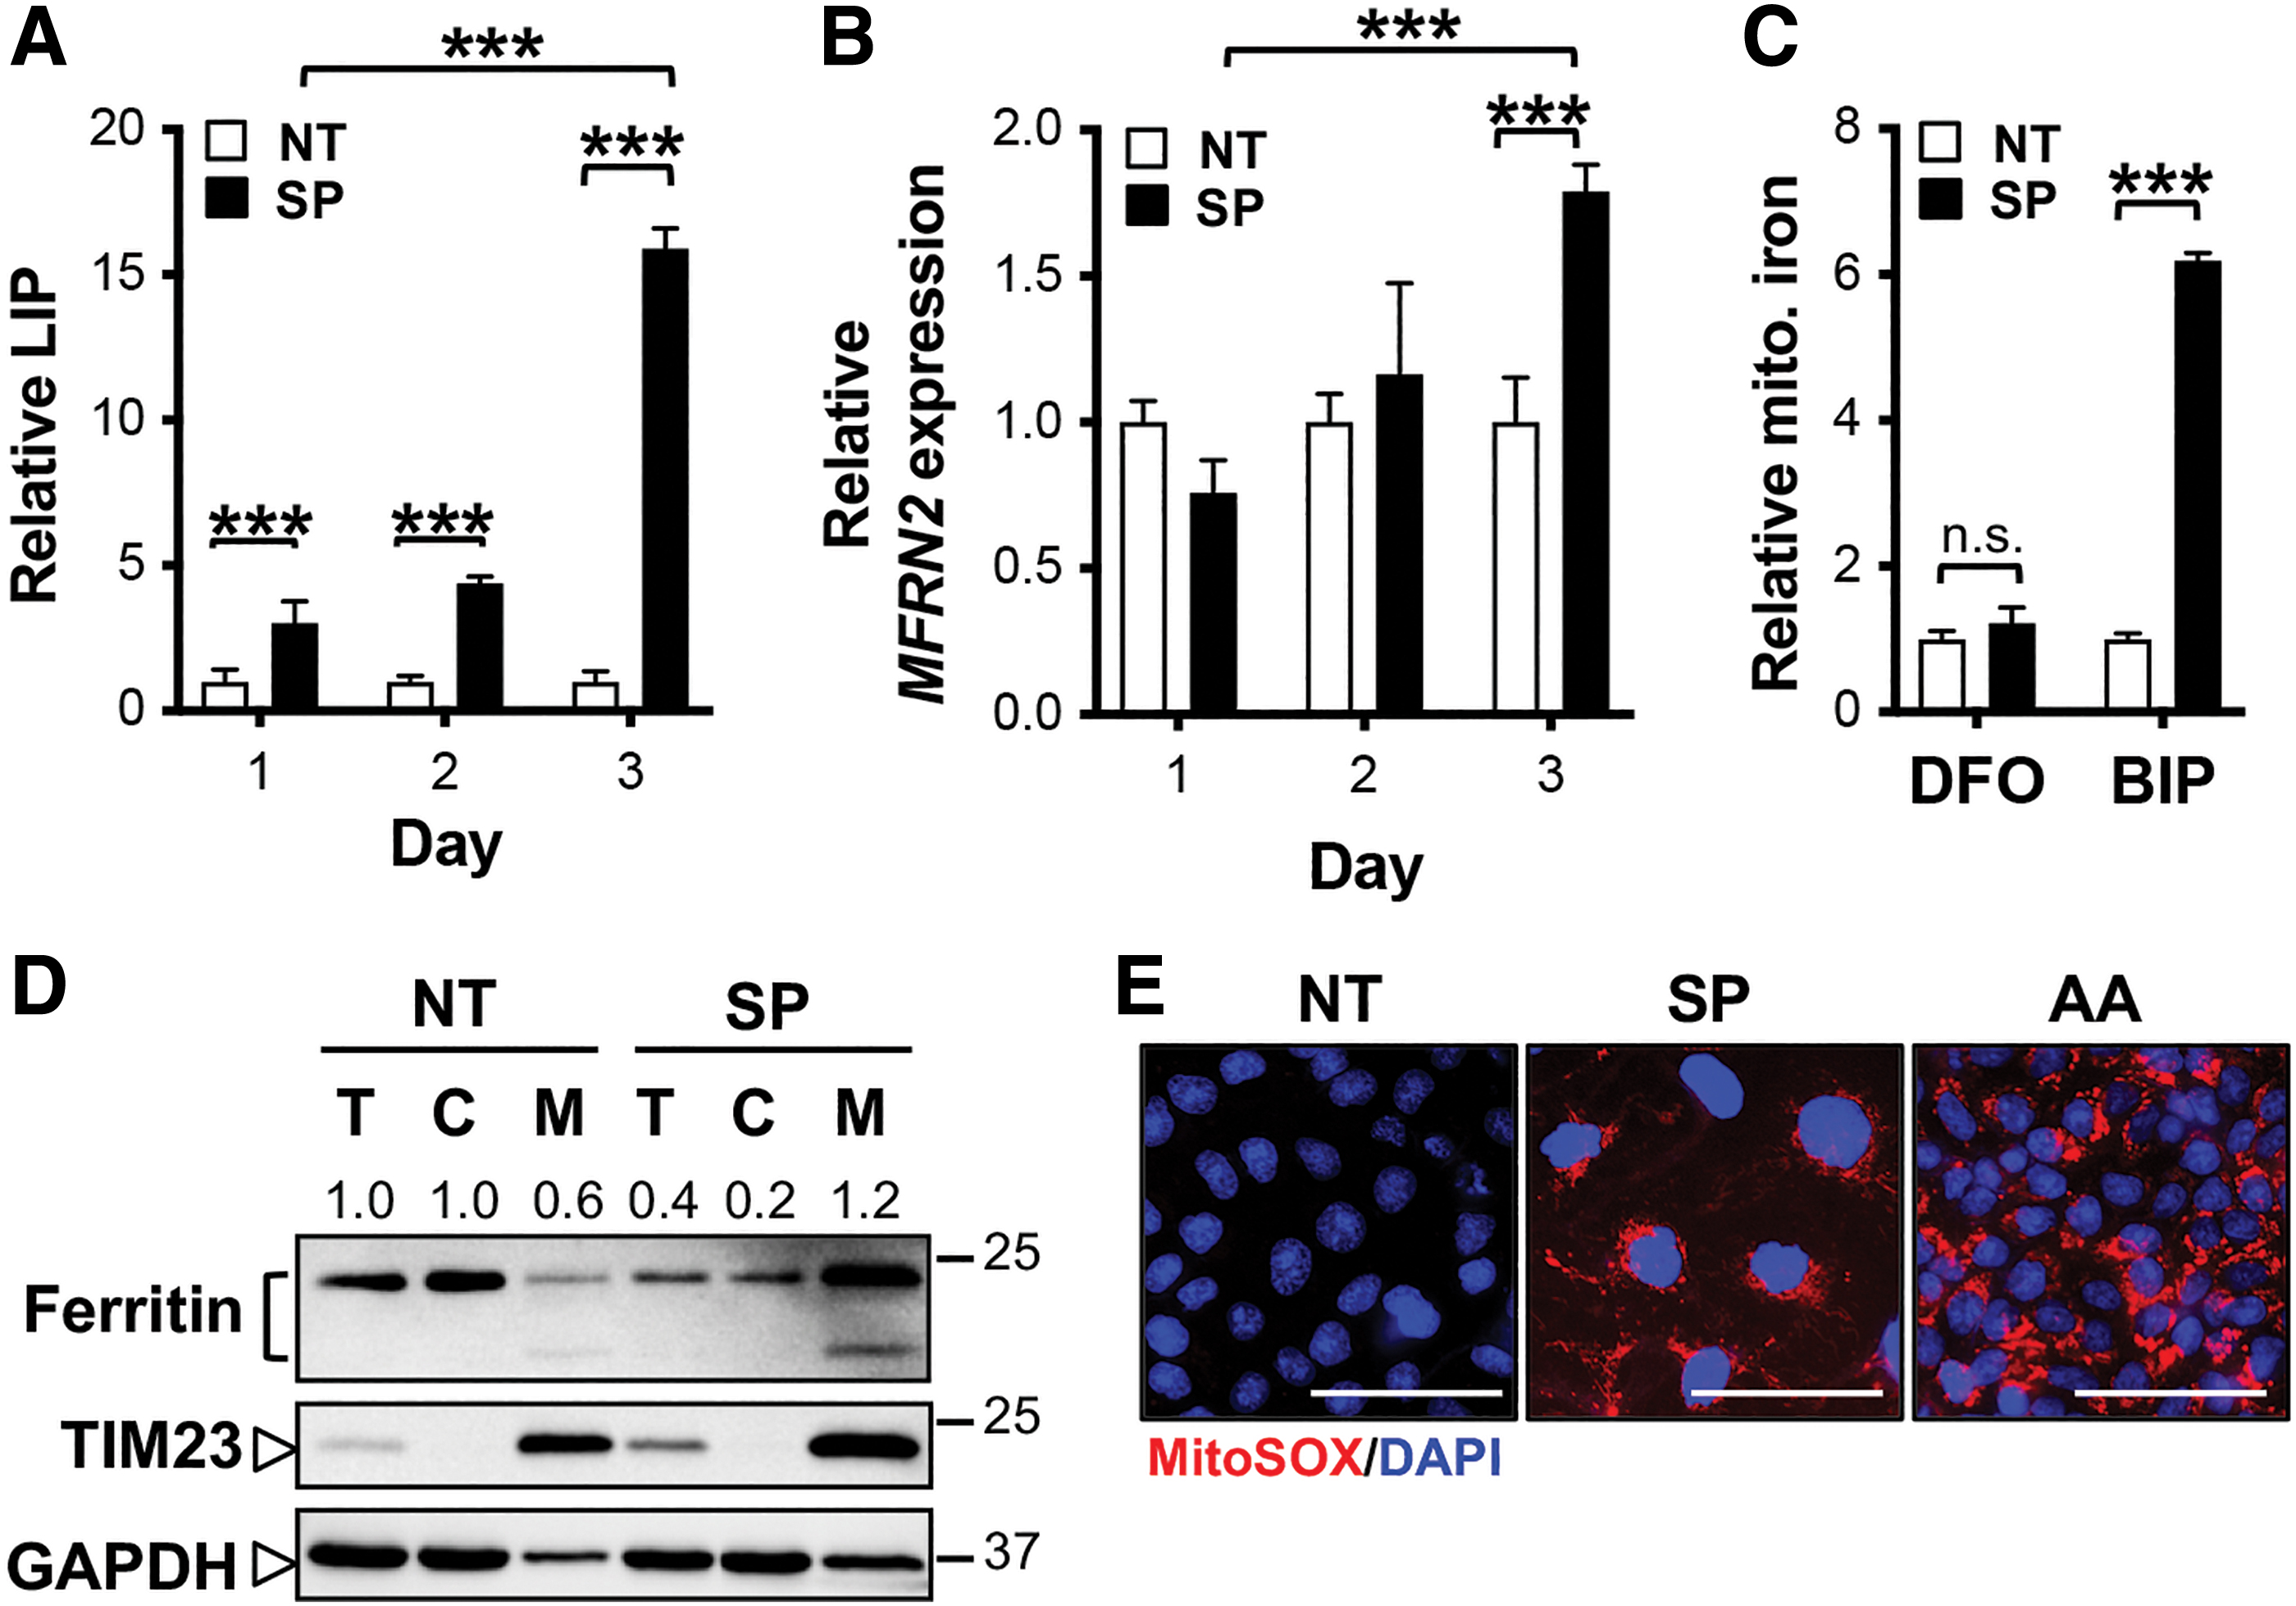
Altogether, the data suggest an influx of iron into mitochondria of respiring OCCC during cysteine deprivation. However, with the limited cysteine level to supply sulfur for Fe–S cluster synthesis, the import of iron into mitochondria leads to iron overloading and mitochondria damage, as indicated by the increase in mitochondrial ROS upon treatment (Fig. 7E). The mitochondria iron overload ultimately leads to KOC-7C cell death by apoptosis.
Discussion
Our study demonstrates OCCC dependence on NEAA cysteine for survival, thereby presenting cysteine limitation as a unique therapeutic approach for OCCC. We showed that pharmacological cysteine deprivation by way of SAS and PAG combination treatment (SP) can inhibit OCCC tumor growth both in vitro and in our OVISE and KOC-7C xenograft mice model (Fig. 1 and Supplementary Fig. S3). Notably, we did not observe any significant change in body weight of SP-treated mice (Supplementary Fig. S3). The absence of apparent toxicity in vivo was also corroborated by Cramer et al. who systemically depleted cysteine using an engineered and pharmacologically optimized human cysteinase enzyme in mice and nonhuman primates (6). The engineered cysteinase was shown to suppress the growth of prostate, nonsmall cell lung carcinoma, and breast cancer xenografts (31). Our study and others demonstrate potential application of cysteine deprivation approaches to impede cancer progression.
Alternative to engineered cysteinase, our study exerts maximal cysteine deprivation in OCCC via combined pharmacological inhibition of CTH and system xc − activities by PAG and SAS, respectively. Treatment with either PAG or SAS alone cannot effectively abolish OCCC survival. This suggests the possibility that cancer cells can switch reliance to endogenous cysteine production in the event of system xc − inhibition and vice versa. Two independent groups have demonstrated the requirement of dietary cysteine in CTH-deficient mice and the importance of CTH when dietary cysteine is restricted (18, 27). CTH expression has also been shown to compensate for SLC7A11 loss of function in human melanoma (22). As such, combined SAS and PAG brings about maximum cysteine depletion and leaves little room for compensation.
Interestingly, we observed dual mechanistic actions of cysteine deprivation in OCCC, depending on intrinsic metabolism of the cancer cell. Cysteine deprivation induces oxidative stress in glycolytic OCCC, leading to ROS-induced necrosis and ferroptosis. Cysteine deprivation is also detrimental to respiring OCCC that depends on mitochondria respiration for its bioenergetics. In this case, cysteine deprivation hampers Fe–S cluster synthesis, and consequently disrupts the mitochondria electron transport chain leading to energy shortage and mitochondria damage-induced apoptosis.
Cysteine limitation presents as an appealing therapeutic approach for OCCC as it targets both glycolytic and oxidative phosphorylation-dependent OCCC (Fig. 8). The conventional antioxidative role of cysteine in physiology and pathophysiology, including cancers, has been widely reported. However, the antioxidative property of cysteine is generically reported without specific association with metabolic characteristics of the cancer cell. Here, we show that the survival of glycolytic OCCC (OVISE) is abolished by necrosis and ferroptosis when the cell is deprived of cysteine. Pretreatment with various antioxidative agents could indiscriminately prevent cell death from taking place. This shows that cysteine deprivation causes oxidative stress-mediated cytotoxicity (Fig. 3A, B, left panels).
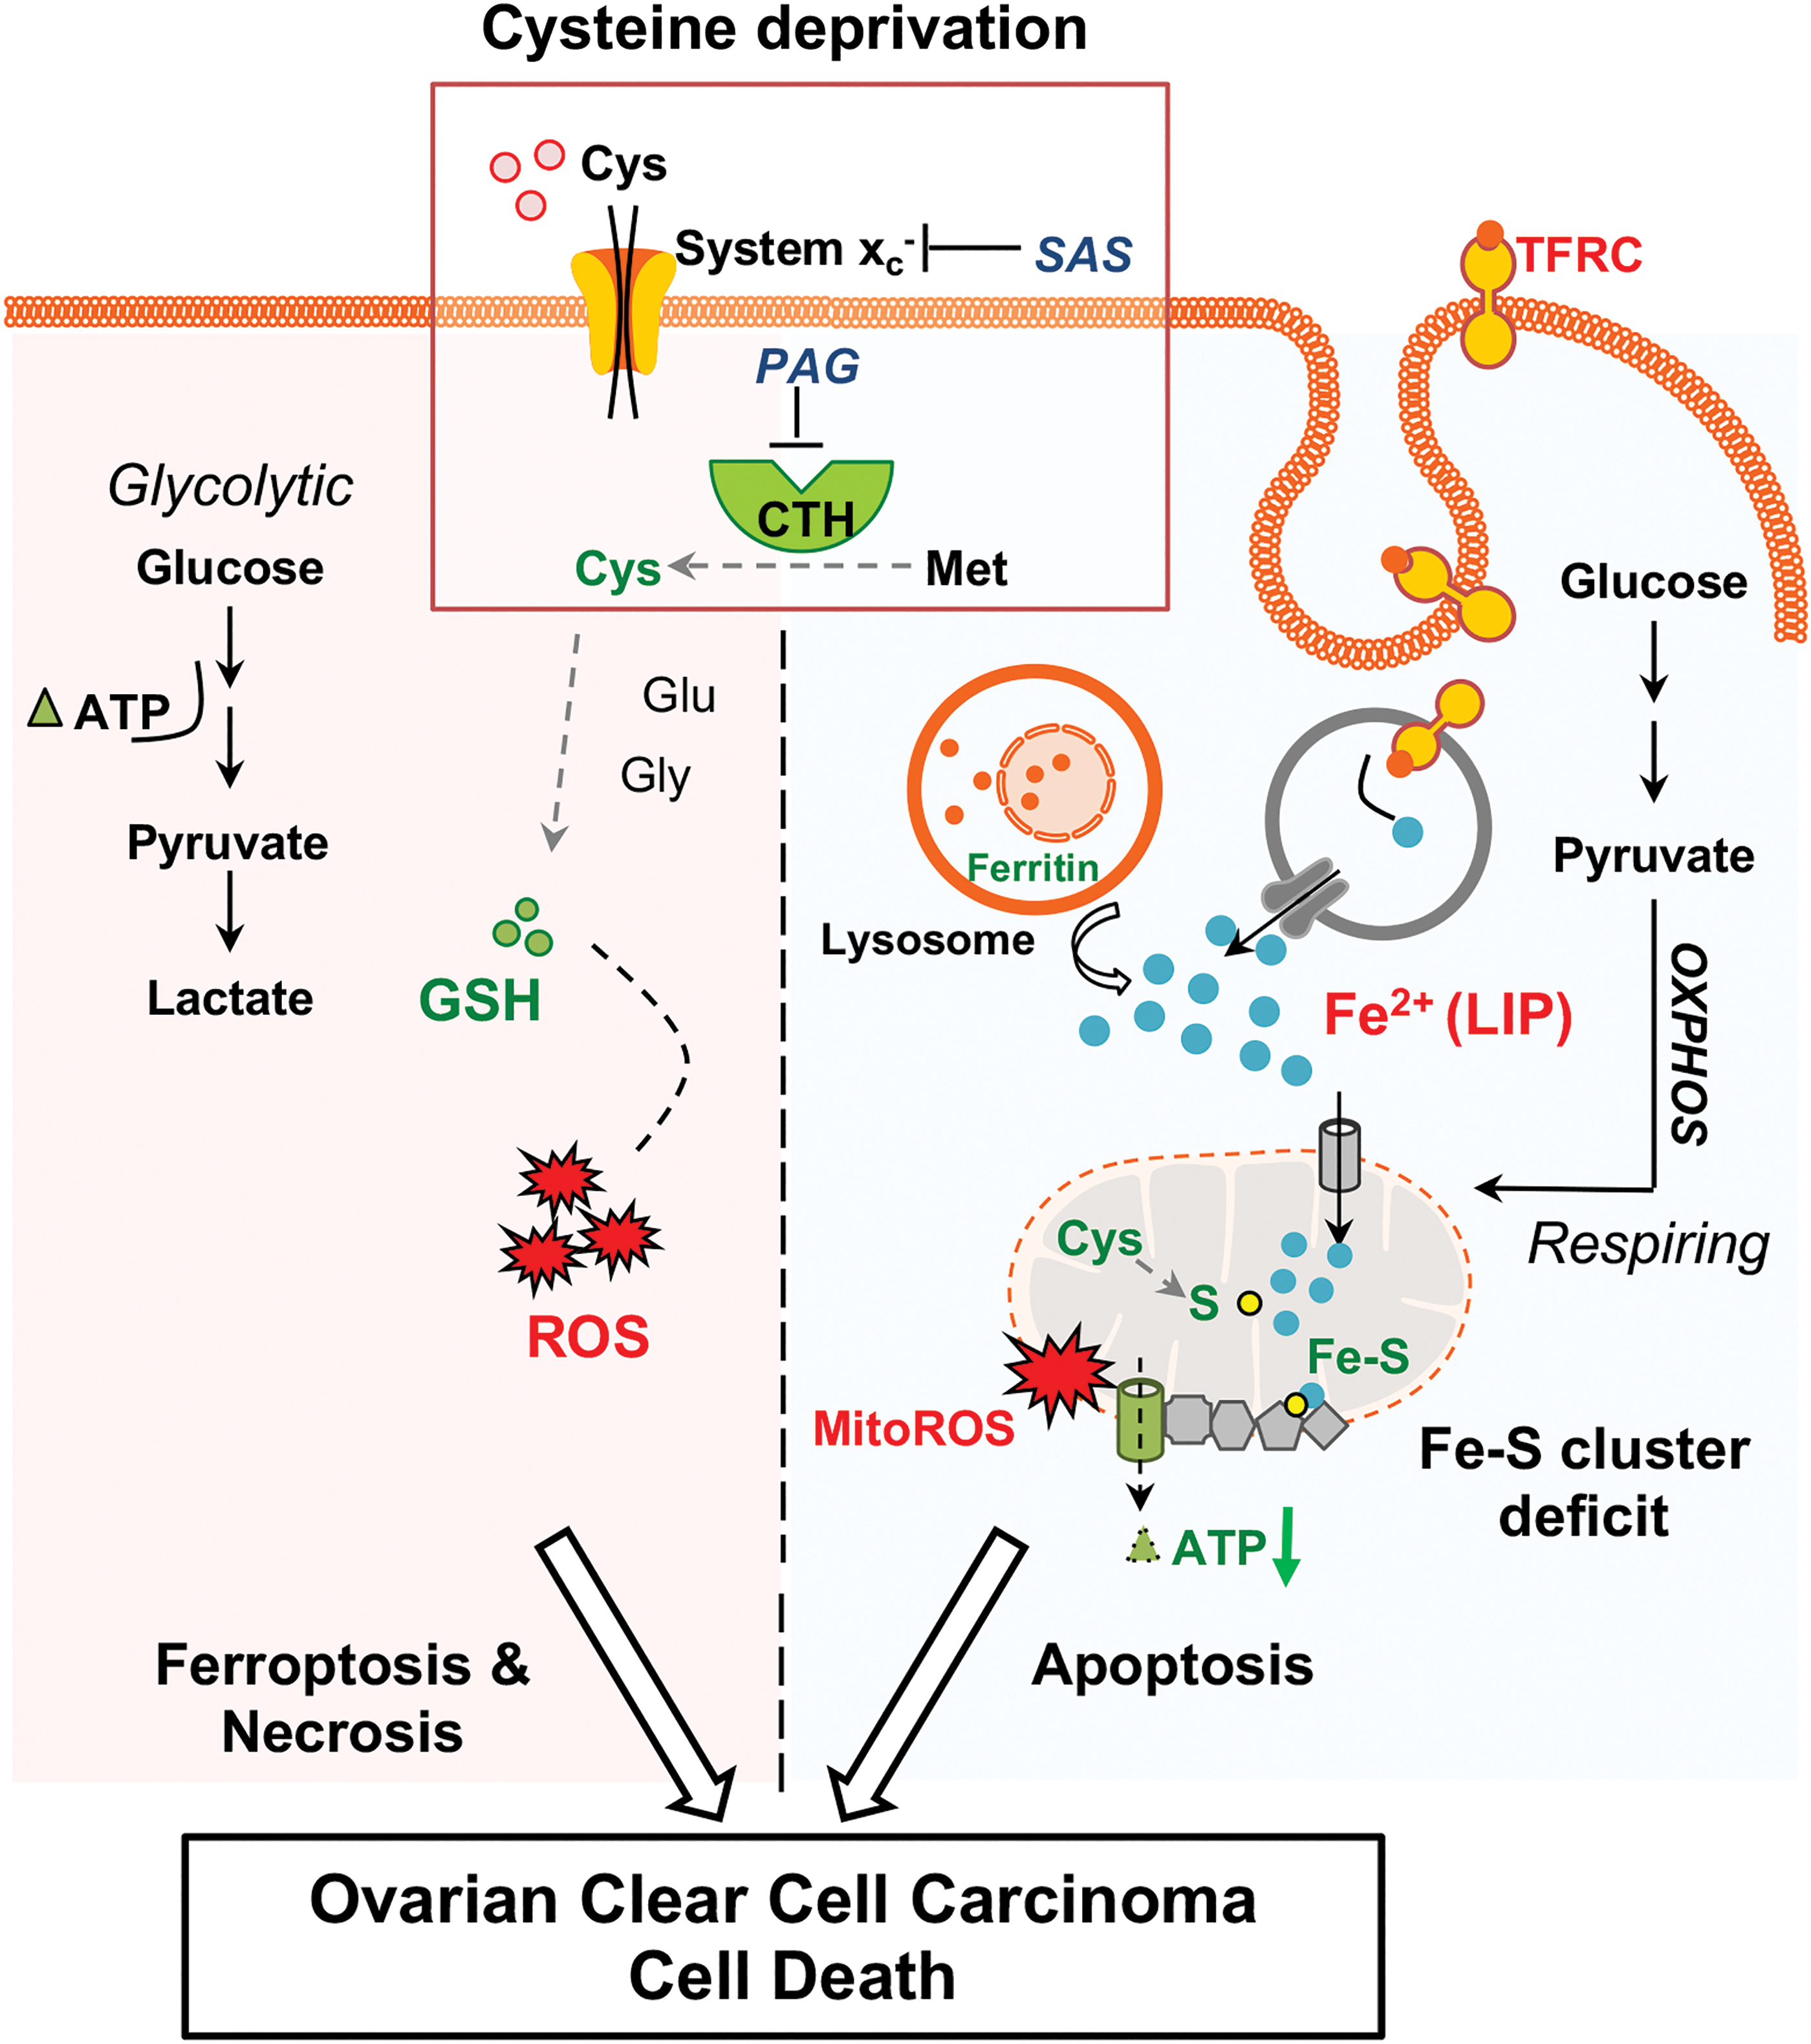
More intriguing is how cysteine deprivation leads to cell death in respiring OCCC (KOC-7C). Pretreatment with cysteine source, NAC alone, but not other antioxidative agents prevents cysteine deprivation-mediated cell death in KOC-7C (Fig. 3A, B, right panels). In respiring OCCC (KOC-7C), cysteine is needed to supply sulfur for Fe–S cluster synthesis in the mitochondria. Fe–S cluster is especially vital for mitochondrial metalloenzyme complexes to function along electron transport chain for energy production. The complete collapse of mitochondria respiration exhausts KOC-7C primary bioenergetics and triggers apoptosis. Mechanistically, the data on KOC-7C showcase the role of cysteine besides its antioxidative function. We speculate that the failure to synthesize Fe–S cluster in the event of cysteine deprivation, rather than oxidative stress, is the primary driver for KOC-7C apoptosis. Antioxidant treatment may have only alleviated the secondary oxidative stress effect but not the primary Fe–S cluster biogenesis deficit.
Our data suggest that when free cysteine is limited and Fe–S cluster biogenesis is hampered, the cell is induced to (i) increase its extracellular iron uptake (Fig. 6C, D), (ii) break down its cytosolic ferritin storage (Fig. 6D, E), and (iii) channel iron into mitochondria (Fig. 7A–D). The phenomenon observed is supported by a recent finding which reported that cysteine desulfurase (NFS1) silencing in lung cancer induces “iron-starvation response,” and increases iron uptake to compensate for the Fe–S cluster biogenesis deficit (1).
Such observed “iron-starvation response” is intriguingly similar to that observed in Friedreich ataxia (FRDA), an autosomal recessive degenerative disease caused by the functional deficiency of frataxin (24, 44). Frataxin is a mitochondrial protein required for Fe–S cluster biogenesis. FRDA patients with defective frataxin have impaired Fe–S cluster synthesis and execute the “iron rescue/starvation response” by upregulating TFRC expression. The “rescue response,” however, results in iron overload that is channeled into the mitochondria via mitoferrin.
We draw parallels between cysteine-deprived OCCC and FRDA. It appears that KOC-7C is constantly induced by the cysteine deprivation challenge to restore Fe–S cluster biogenesis deficit. This is evidenced by the prominent increase in ferredoxin reductase and frataxin, which are required for reducing sulfane sulfur to sulfide and for binding iron with the sulfide, respectively (Fig. 5D). The increased expressions of FDXR and FXN may indicate a feedback response to Fe–S cluster biogenesis deficit. As long as cysteine bioavailability is limited, such feedback response is, however, a futile effort that does more damage than salvation.
It is interesting yet peculiar to see that KOC-7C responds to cysteine deprivation-induced Fe–S cluster biogenesis deficit by increasing iron uptake instead of restoring cysteine pool. One possible way to replenish cysteine reservoir is by autophagy, a process that breaks down cellular constituents in the event of nutrient starvation. However, KOC-7C did not seem to undergo autophagy as the level of pS6 and LC3B proteins remained unchanged (Supplementary Fig. S7A, B). Perhaps, combined SAS and PAG treatment reaches the stress limit of KOC-7C, and overwhelms the autophagy adaptive mechanism.
In conclusion, OCCC metabolism (glycolysis vs. oxidative phosphorylation) is a crucial determinant for cysteine deprivation-mediated modes of cell death. In addition to cysteine's well-reported role in oxidative stress, the requirement of cysteine in Fe–S cluster biogenesis is another major function in the survival of OCCC that is innately more dependent on mitochondria respiration for energy. Importantly, cysteine deprivation brings about OCCC cell death regardless of their metabolic profiles.
Materials and Methods
Cell culture
OCCC cell lines (OVISE, OVTOKO, TAYA, RMG-1, RMG-2, RMG-5, KOC-5C, JHOC-9, KOC-7C) were kind gifts from Dr. Noriomi Matsumura. All OCCC cell lines are cultured in RPMI 1640 supplemented with 10% fetal bovine serum (FBS) in a humidified incubator at 37°C and 5% CO2. Cell lines were authenticated via short tandem repeat assay performed by Centre for Translational Research and Diagnostics at Cancer Science Institute, Singapore. These cell lines were tested free of mycoplasma contamination by MycoAlert Mycoplasma Detection Kit (Lonza).
Xenograft mouse models
Female 6-week-old NOD scid gamma (NSGTM) mice were purchased from Jackson Laboratories and housed, and cared for throughout in specific pathogen-free isolators according to the guidelines approved by Institutional Animal Care and Use Committee. OVISE (8 × 10⁶) or KOC-7C cells (1 × 10⁷) were mixed with equal volume of Matrigel matrix (Corning® #354234), and subcutaneously injected into the left flank of recipient mice. Animals with palpable tumor size of 100–200 mm3 were treated intraperitoneally with either phosphate-buffered saline (PBS), SAS alone (125 mg/kg, twice a week), PAG alone (25 mg/kg, daily), or a combination of SAS and PAG for 46 days (OVISE) or 36 days (KOC-7C). Mouse weight and tumor size were regularly measured by vernier caliper. Tumor volume was calculated as length (l) × weight (w)2/2.
Reagents and antibodies
The amino acids used in this study were purchased from Sigma-Aldrich. The reagents used in this study were as follows: PAG (Sigma-Aldrich; Cat. #P7888), SAS (Sigma-Aldrich; Cat. #S0883), NAC (Sigma-Aldrich; Cat. #A7250), Ammonium iron (II) sulfate hexahydrate (Sigma-Aldrich; Cat. #203505), FST (Cayman Chemical; Cat. #17729), 6-hydroxy-2,5,7,8-tetramethylchroman-2-carboxylic acid (Trolox, Cat. #238813; Sigma-Aldrich), Ascorbic acid/Vit. C (MedChem Express; Cat. #HY-B0166), Nec-1 (MedChem Express; Cat. #HY-15760), MG-132 (Sigma-Aldrich; Cat. #M8699), BafA1 (Santa Cruz Biotechnology; Cat. #sc-201550), Annexin V-Alexa Fluor 647 (ThermoFisher Scientific; Cat #A23204), and PI (Sigma-Aldrich; Cat. #P4170).
The primary antibodies used in this study were as follows: Mouse α-CTH (Novus; Cat. #H00001491-M01), Rabbit α-xCT/SLC7A11 (Cell Signaling Technology [CST]; Cat. #12691), Rabbit α-cleaved caspase 3 (CST; Cat. #9661), Rabbit α-caspase 3 (CST; Cat. #9662), Rabbit α-cleaved PARP (CST; Cat. #9541), Rabbit cytochrome c (CST; Cat. #4280), Mouse α-TIM23 (Biomed Diagnostics; Cat. #611222), Rabbit α-ACO1 (CST; Cat. #20272), Rabbit α-IREB2 (D6E6W, Cat. #37135; CST), Rabbit α-ferritin (Abcam; Cat. #ab75973), Rabbit α-TFRC (clone D7S5Z, Cat. #13208; CST), Rabbit α-phosphorylated S6 (CST; Cat. #4858), Rabbit α-phosphorylated p70S6 kinase (CST; Cat. #9234), Rabbit α-p70S6 kinase (CST; Cat. #2708), Rabbit α-LC3B (CST; Cat. #4108), and Rabbit α-GAPDH (Santa Cruz Biotechnology; Cat. #sc-25778).
Amino acid deprivation
Cells were plated in the complete RPMI 1640 medium a day before amino acid starvation for 3 days. Amino acid deprivation medium was prepared using Earle's Balanced Salt Solution, supplemented with 3.7 g/L sodium bicarbonate, 4.5 g/L
In vitro drug treatments
The concentrations of SAS and PAG used for each cell line were as follows: 50 μM SAS and 0.25 mM PAG for OVISE; 125 μM SAS and 2.5 mM PAG for ES-2 and OVTOKO; 200 μM SAS and 1 mM PAG for TAYA; 250 μM SAS and 5 mM PAG for RMG-1 and RMG-5; 500 μM SAS and 10 mM PAG for KOC-5C, JHOC-9, RMG-2, and KOC-7C. For rescue experiments, the cells were pretreated with either 200 μM, 1 or 5 mM NAC, 10 μM FST, 100 μM Trolox, 0.25 mM ascorbic acid (Vit. C), 5 μM DFO or 10 μM Nec-1 for an hour at 37°C. The previous media were then topped up with media containing PAG alone, SAS alone, or combination of both, together with the rescue agents freshly added at the indicated concentrations for a period of 72 h. For ferritin protein stability, previous media containing drug treatment (48 h) were replaced with fresh media containing 2 μM MG132 or 50 nM BafA1 together with treatment for the last 24 h of the experiment.
Gene silencing
OVISE or KOC-7C cells were at 20%–30% confluency at the point of transfection. Forward transfection was carried out using siRNA packaged by LipofectamineTM RNAiMAX (ThermoFisher Scientific) according to the manufacturer's protocol. CTH-specific siRNA sequence is as follows: sense, 5′-GGUUAUUUAUCCUGGGCUGdTdT-3′ and antisense, 5′-CAGCCCAGGAUAAAUAACCdTdT-3′. xCT-specific siRNA sequence is as follows: sense, 5′-UCACAGCAAUUCUGAUAAUdTdT-3′ and antisense, 5′-AUUAUCAGAAUUGCUGUGAdTdT-3′. Transfected cells were incubated at 37°C for 96 h before cell viability assessment or collection of cell pellet for Western blotting.
Cell survival and soft agar colony formation assay
Cell viability after amino acid deprivation or drug treatment was determined by crystal violet staining. Colony formation was assessed by soft agar assay. In brief, cells (OVISE, 20,000 cells; TAYA and RMG-2, 10,000 cells; KOC-7C, 5000 cells) were resuspended in 2 × Dulbecco's Modified Eagle Medium containing 20% FBS and mixed at 1:1 ratio with 0.4% Noble agar (Affymetrix/USB™; Cat. #J10907A1). The mixture was then layered on top of solidified base agar, that is, 1% agarose. Once Noble agar, in which the cells were suspended, solidified, media containing vehicle or treatment were added dropwise. The vehicle- or treatment-containing media were replaced every 4 days for a total of 14–21 days of treatment. Colonies number and sizes were counted and measured using Image-Pro Analyzer version 6.2.
ROS measurement
Intracellular ROS was assessed by incubating the cells with 2′,7′-dichlorofluorescein diacetate (Sigma-Aldrich; Cat. #D6883) at 37°C for 1 h. Fluorescent intensity was read at excitation/emission wavelength of 498/522 nm.
Mitochondria superoxide level was assessed by incubating the cells with MitoSOXTM Red Mitochondrial Superoxide Indicator (ThermoFisher Scientific; Cat. #M36008) at 37°C for 1 h. Stained live cells were visualized using fluorescence microscope (Olympus; IX81). Alternatively, fluorescent intensity was read at excitation/emission wavelength of 510/580 nm using Syngene H1 microplate spectrophotometer and normalized to the corresponding cell number.
Lipid peroxide was assessed by first incubating the cells with BODIPYTM C11 (ThermoFisher Scientific; Cat. #D3861) at 37°C for half an hour, followed by flow cytometry (BD FACSCantoTM II; BD Biosciences) using 488 nm laser for excitation. Fluorescent emission peak shift from 590 to 510 nm was collected using the 530/30 nm band-pass filter.
Metabolite measurement
Cellular cysteine concentration was measured according to Gaitonde (14). Samples were mixed with neat glacial acetic acid and ninhydrin reagent (Sigma-Aldrich; Cat. #151173). Cysteine level was determined by measuring absorbance at 570 nm.
Cellular glutathione level was measured according to Rahman et al. (32). Enzymatic reactions were performed in 0.1 M potassium phosphate assay buffer with a final concentration of 1.7 mM 5,5′-Dithiobis-(2-nitrobenzoic acid), 0.4 mM NADPH, and 1 U/mL glutathione reductase from baker's yeast (Sigma-Aldrich; Cat. #G3664). Absorbance at 415 nm was kinetically monitored.
Cellular lactate was determined according to the protocol described in Lee et al. (21). Enzymatic reaction was carried out in 0.4 M hydrazine, 0.5 M glycine, pH 9.0 buffer with 2 mM NAD and 2 U/mL lactate dehydrogenase (Sigma-Aldrich; Cat. #L3888). Absorbance at 340 nm was measured kinetically. Intracellular lactate was determined by lysing snap-frozen cell pellet with water with the aid of sonication. Enzymatic reaction was performed in 0.5 M glycine, pH 9.0 buffer with 2 mM NAD, 2 U/mL lactate dehydrogenase, 0.1 mg/mL tetrazolium dye MTT, and 0.2 mM phenazine ethosulfate. Absorbance at 570 nm was kinetically monitored.
Calibration standards for cysteine, glutathione, and lactate were prepared and analyzed alongside the actual samples. Absorbance was read using Syngene H1 microplate spectrophotometer. Cellular cysteine, glutathione, and lactate were normalized to the corresponding protein concentration.
Mitochondria isolation
Cells were washed once with ice-cold PBS and resuspended in 500 μL of mitochondria extraction buffer (200 mM mannitol, 68 mM sucrose, 100 mM HEPES-KOH [pH 7.4], 50 mM KCl, 5 mM ethylenediaminetetraaceticacid, 2 mM MgCl2, with protease and phosphatase inhibitors and 1 mM dithiothreitol [DTT] added fresh) and rotated at 4°C for 30 min. Cell suspension was homogenized using dounce on ice. The protein concentrations of both cytosolic and mitochondria fractions were then quantified by Bradford assay. The quality of the mitochondrial preparation was assessed by Western blot using GAPDH and TIM23 for cytosolic and mitochondria markers, respectively.
Oxygen consumption
Cells were plated into XFe24 Cell Culture Microplates (Seahorse Bioscience) and treated with drugs for 3 days. Previous medium was replaced with XF Assay Medium supplemented with 1 mM sodium pyruvate and 10 mM glucose adjusted to pH 7.4. Oligomycin, FCCP, antimycin A, and rotenone were sequentially injected at a final concentration of 1, 0.5, 1, and 1 μM, respectively. Experiments were run using a XFe24 analyzer, and data were normalized to cell number and presented as percentage to basal measurement.
Extracellular acidification
Cells were plated into XFe24 Cell Culture Microplates and treated with drugs for 3 days. Previous medium was replaced with XF Assay Medium supplemented with 1mM
Metabolomics
Cells were treated with a combination of SAS and PAG for 72 h. Five independent replicates of each frozen control and treated cell pellet were used to measure and compare primary metabolite changes by gas chromatography-time-of-flight system in West Coast Metabolomics Centre at University of California, Davis. The extraction solvent was prepared by mixing isopropanol/acetonitrile/water at the volume ratio 3:3:2 and degassing this mixture by directing a gentle stream of nitrogen through the solvent for 5 min. The solvent was cooled to −20°C before extraction. Randomly processing all samples of the study, 1 mL of cold solvent per 20 mg of ground tissue was added, vortexed for 10 s, and shaken at 4°C for 5 min to extract metabolites and simultaneously precipitate proteins. After centrifugation at 12,800 g for 2 min, 90% of the supernatant was removed, taking care not to remove any residues from the pellet. The supernatant was separated into two equal aliquots and concentrated to dryness in a Centrivap cold trap vacuum concentrator at room temperature for 4 h. Data are acquired using the following chromatographic parameters, with more details to be found in Fiehn et al. (13).
Instruments
Gerstel CIS4—with dual MPS Injector/Agilent 6890 GC-Pegasus III TOF MS.
Injector conditions
Agilent 6890 GC is equipped with a Gerstel automatic liner exchange system that includes a multipurpose sample (MPS2) dual rail and a Gerstel CIS cold injection system (Gerstel, Muehlheim, Germany) with temperature program as follows: 50°C–275°C final temperature at a rate of 12°C/s and hold for 3 min. Injection volume is 0.5 μL with 10 μL/s injection speed on a splitless injector with purge time of 25 s. Liner (Gerstel #011711-010-00) is changed after every 10 samples (using the Maestro1 Gerstel software version 1.1.4.18). Before and after each injection, the 10 μL injection syringe is washed three times with 10 μL ethyl acetate.
Gas chromatography conditions
A 30 m long, 0.25 mm i.d. Rtx-5Sil MS column (0.25 μm 95% dimethyl 5% diphenyl polysiloxane film) with additional 10 m integrated guard column is used (Restek, Bellefonte, PA). 99.9999% pure Helium with built-in purifier (Airgas, Radnor PA) is set at constant flow of 1 mL/min. The oven temperature is held constant at 50°C for 1 min and then ramped at 20°C/min to 330°C at which it is held constant for 5 min.
Mass spectrometer settings
A Leco Pegasus IV time-of-flight mass spectrometer is controlled by the Leco ChromaTOF software version 2.32 (St. Joseph, MI). The transfer line temperature between gas chromatograph and mass spectrometer is set to 280°C. Electron impact ionization at 70 V is employed with an ion source temperature of 250°C. Acquisition rate is 17 spectra/s, with a scan mass range of 85–500 Da.
Proteomics
Cells were treated with a combination of SAS and PAG for 72 h. Dry, PBS-washed frozen cell pellets were lysed directly in 8 M urea, 50 mM ammonium bicarbonate supplemented with 1 × Complete protease inhibitor (Roche), 1 × Phosphatase inhibitor (Roche) and treated with 50 μg/mL DNase I and RNase A. Urea-soluble proteins were quantified by Bradford assay. Thirty micrograms total protein from each sample was reduced in 4 mM DTT for 1 h at 20°C, alkylated with 8 mM iodoacetamide for 1 h at 20°C in the dark. Enzymatic digestion was performed first with Lys C (Wako) for 4 h at 37°C (1:75), then with trypsin for 16 h at 37°C (1:75).
Digested peptides were next prefractionated on reverse-phase C18 stage tips in ammonium formate at pH 10. Each peptide fraction was then dried by vacuum centrifugation, reconstituted in 10% formic acid, and subjected to second dimension liquid chromatography-mass spectrometer at low pH. Samples were analyzed on an Orbitrap Q Exactive HFX spectrometer (Thermo Scientific) connected to a UHPLC 1290 system (Agilent). Raw files were processed using MaxQuant version 1.5.3.30 and the Andromeda search engine, against the human Uniprot database (161,042 entries, version Nov 2017).
Mitochondria iron measurement
Mitochondria iron was measured following the protocol described by Petrat et al. (30) and Chang et al. (4). Live cells were loaded with 1 μM rhodamine B-[1,10-phenanthrolin-5-yl)-aminocarbonyl] benzylester (RPA) (Squarix Biotechnology; Cat. #ME043.1 [RPA.1]) and incubated at 37°C for 30 min. Excess dye was then removed and replaced with fresh culture media with or without supplementation with 100 μM DFO (Sigma-Aldrich; Cat. #D9533) or 2,2′-bipyridyl (BIP, Cat. #D216305; Sigma-Aldrich) together with fresh drug treatment. Fluorescent intensity was read at excitation/emission wavelength of 564 and 601 nm, respectively, with Syngene H1 microplate spectrophotometer. LIP (relative fluorescence units [RFU]) = R.F.UDFO/BIP − R.F.UNoDFO/BIP. LIP was finally normalized to the corresponding cell number.
LIP measurement
Intracellular LIP was measured following the protocol described by Glickstein et al. (15). Live cells were loaded with 100 nM calcein AM (ThermoFisher Scientific; Cat. #C1430) and incubated at 37°C for 30 min. Excess dye was then removed and replaced with fresh culture media with or without supplementation with 100 μM DFO, together with fresh drug treatment. Fluorescent intensity was read at excitation/emission wavelength of 495 and 529 nm, respectively, with Syngene H1 microplate spectrophotometer. LIP (R.F.U.) = R.F.UDFO − R.F.UNoDFO. LIP was finally normalized to the corresponding cell number.
MMP measurement
MMP was assessed by incubating the cells with tetramethylrhodamine fluorescent dye (ThermoFisher Scientific; Cat. #T668) at 37°C for 1 h. Stained live cells were visualized using fluorescence microscope (Olympus; IX81).
ACO1 activity measurement
ACO1 (IRP1) activity was assessed following the method described in Dickman and Cloutier (8). Enzymatic reaction was performed in 50 mM Tris-HCl (pH 7.4) buffer with 0.6 mM MnCl2, 0.2 mM NADP+, 2.5 mM trisodium citrate dehydrate, and 2 U/mL isocitric dehydrogenase (NADP) from porcine heart (Sigma-Aldrich; Cat. #I1877). Reduction of NADP+ to NADPH was monitored kinetically by measuring absorbance at 340 nm using Syngene H1 microplate spectrophotometer.
Quantitative real-time polymerase chain reaction
Cells were lysed in situ on culture plate using TRIzol reagent (ThermoFisher Scientific; Cat. #15596018), following manufacturer's protocol. One microgram of total RNA was then converted to cDNA by using oligo(dT)20 primer according to iScript Select cDNA synthesis kit manual (Bio-Rad). Quantitative polymerase chain reaction was performed using iTaq universal SYBR green supermix (Bio-Rad) with iQ5 Multicolor Real-time PCR detection system (Bio-Rad). Primers used in this study are MFRN2/SLC25A28 forward: 5′-CTGCGTGATGTACCCCATCG-3′, reverse: 5′-CCTGTTGCTGTGACGTTCAG-3′; TFRC/TFR1 forward: 5′-AGTTGAACAAAGTGGCACGAGCAG-3′, reverse: 5′-AGCAGTTGGCTGTTGTACCTCTCA-3′. Ribosomal RPL13A gene was used as the housekeeping gene.
Western blot analysis
Cells were lysed in RIPA buffer supplemented with protease and phosphatase inhibitors. Protein concentration was determined by Bradford assay. Equal amounts of protein (20–30 μg) were loaded for sodium dodecyl sulfate-polyacrylamide gel electrophoresis (8%–15% gel depending on the size of the proteins) and transferred onto polyvinylidene difluoride membrane by basic wet transfer method. Protein signal was detected by Western Lightning Plus-ECL detection system (Perkin Elmer). Actin or GAPDH was used as the housekeeping protein. Caspase 3 and PARP cleavage were determined by Western blot. Ultraviolet-treated cells (exposed to 50 mJ/cm2 and harvested 24 h postexposure) served as a positive control. Caspase 3 and GAPDH were used as protein loading controls.
Annexin V/PI flow cytometry
Cells were resuspended in Annexin V binding buffer (10 mM HEPES pH 7.4, 150 mM NaCl and 2.5 mM CaCl2 in PBS), and stained with 1000 × diluted Annexin V-Alexa Fluor 647 (ThermoFisher Scientific; Cat. #A23204) and a final concentration of 0.2 μg/mL PI (Sigma-Aldrich; Cat. #P4170) for 15 min at room temperature in the dark. Stained cells were analyzed by Becton-Dickinson LSRII flow cytometry. 10,000 events were collected per sample. Data were analyzed using FlowJo software (v10.6.2). Forward and side scatter profiles were obtained from the same samples. Gates were set based on single stained control samples.
Quantification and statistical analysis
Experimental results were collected from three independent cultures for each sample and analyzed with GraphPad Prism 8.0 software (San Diego, CA). Data are shown as mean ± standard deviation in plots, unless otherwise stated. p < 0.05, 0.01, 0.001 denoted by *, **, ***, respectively, indicate statistical significance in group comparison, as derived from Student's two-sided t-test.
Footnotes
Authors' Contributions
W.N., Z.-W.L., and L.-W.D. conceived and designed experiments. W.N., M.Z.-Y.D., S.B.I., H.W., and W.W. performed the experiments. A.Y.L.S., Y.C.L., R.Y.-J.H. contributed reagents/materials and provided intellectual input. W.N., Z.-W.L., S.B.I., D.S.N., W.W., J.M.A.D., T.Z.T. analyzed the data. W.N., Z.-W.L., D.S.N., R.Y.-J.H., L.-W.D. wrote and edited the article. L.-W.D. supervised and managed the overall study.
Acknowledgments
We thank Dr. Noriomi Matsumura for the OCCC cell lines, Dr. Yih-Cherng Liou and Dr. Shuo-Chien Ling for sharing reagents, Hayden Weng Siong Tan for sharing protocol, and Kencana Kesuma for her assistance with the figures.
Author Disclosure Statement
No competing financial interests exist.
Funding Information
This work was supported by Bench-to-Bedside (B2B) grant (R183000393733) and Ministry of Education Academic Research Fund Tier 1 (R183000405114) and Tier 2 (R183000415112).
Supplementary Material
Supplementary Figure S1
Supplementary Figure S2
Supplementary Figure S3
Supplementary Figure S4
Supplementary Figure S5
Supplementary Figure S6
Supplementary Figure S7
Abbreviations Used
References
Supplementary Material
Please find the following supplemental material available below.
For Open Access articles published under a Creative Commons License, all supplemental material carries the same license as the article it is associated with.
For non-Open Access articles published, all supplemental material carries a non-exclusive license, and permission requests for re-use of supplemental material or any part of supplemental material shall be sent directly to the copyright owner as specified in the copyright notice associated with the article.