
Abstract
Aims:
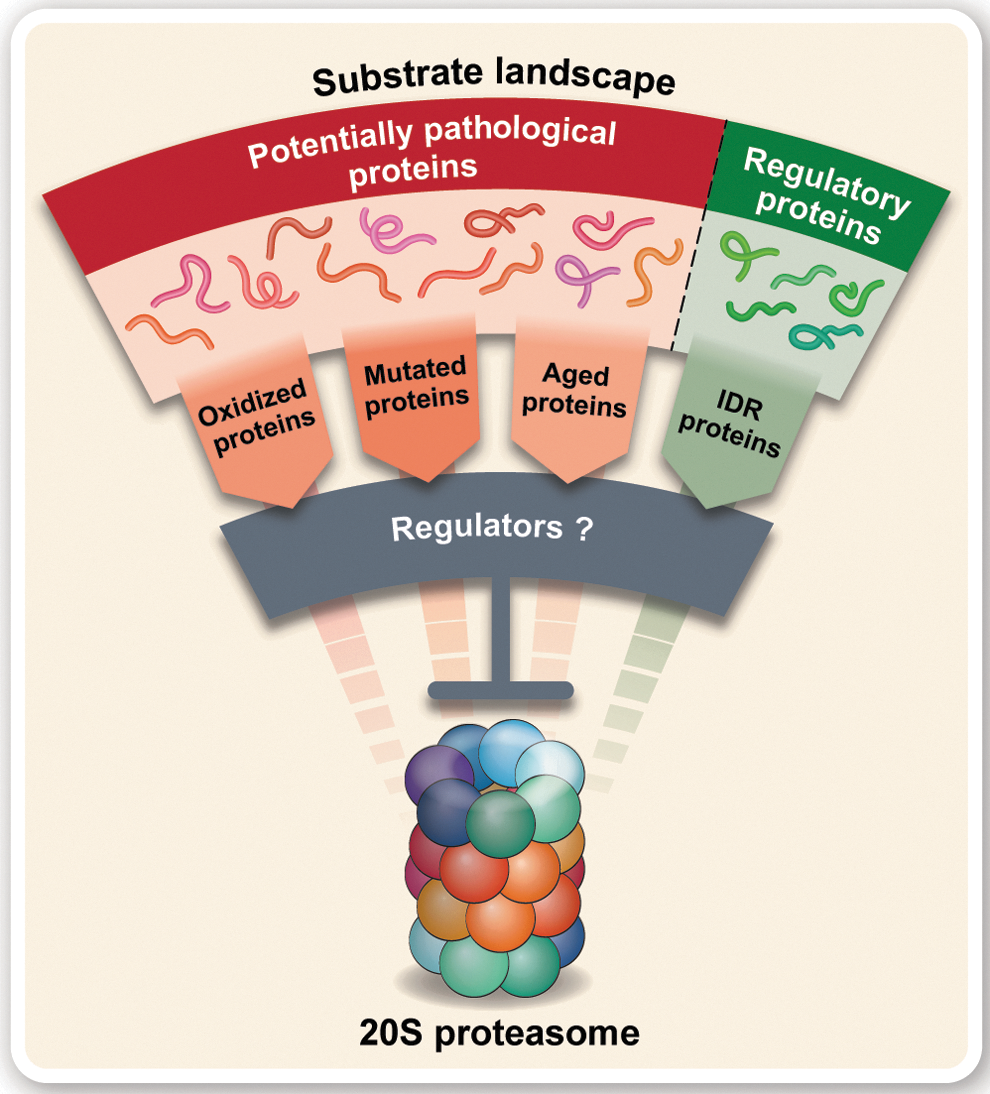
The protein degradation machinery plays a critical role in the maintenance of cellular homeostasis, preventing the accumulation of damaged or misfolded proteins and controlling the levels of regulatory proteins. The 20S proteasome degradation machinery, which predominates during oxidative stress, is able to cleave any protein with a partially unfolded region, however, uncontrolled degradation of the myriad of potential substrates is improbable. This study aimed to identify and characterize the regulatory mechanism that controls 20S proteasome-mediated degradation.
Results:
Using a bioinformatic screen based on known 20S proteasome regulators, we have discovered a novel family of 20S proteasome regulators, named catalytic core regulators (CCRs). These regulators share structural and sequence similarities, and coordinate the function of the 20S proteasome by affecting the degradation of substrates. The CCRs are involved in the oxidative stress response via Nrf2, organizing into a feed-forward loop regulatory circuit, with some members stabilizing Nrf2, others being induced by Nrf2, and all of them inhibiting the 20S proteasome.
Innovation and Conclusion:
These data uncover a new family of regulatory proteins that utilize a fine-tuned mechanism to carefully modulate the activity of the 20S proteasome, in particular under conditions of oxidative stress, ensuring its proper functioning by controlling the degradative flux.
Innovation
The current understanding of the regulation of the ubiquitin-independent degradation activities of the 20S proteasome is limited, and only a small number of regulators have been identified to date. Given the importance of the 20S proteasome, in particular during oxidative stress, tight regulation must exist to control its degradative capacity. With our discovery of this novel family of 20S proteasome regulatory proteins, the catalytic core regulators, and their connection to the oxidative stress response, we have greatly expanded our understanding of this critical degradation pathway and the fine-tuned mechanisms that control its function.
Introduction
T
While protein degradation via the ubiquitin/26S proteasome pathway is the predominant mechanism used by the cell to degrade proteins, it has been well established that the 20S catalytic core of the proteasome is capable of operating independently of the 19S regulatory particle (4, 6, 17, 18, 49, 50). The 20S proteasome can degrade protein substrates in a ubiquitin- and ATP-independent manner, by recognizing unfolded or unstructured regions within its substrates, as opposed to the specificity of a ubiquitin tag as required by the 26S proteasome (22, 56). Proteins can acquire unstructured regions as a result of mutation, acute oxidative stress, and age-related damage. During aging, the proteome accumulates time-inflicted damage from oxidation, irradiation, and mutations, leading to widespread protein dysfunction, which can affect multiple cellular processes (50). Alternatively, proteins can contain intrinsically disordered regions (IDRs), for example, the cell cycle regulators p21 and p27, and tumor suppressors p53 and p73 (21, 34, 70, 74). Beyond complete degradation of unstructured protein substrates, the 20S proteasome has also been shown to be responsible for the post-translational processing of certain proteins, generating proteolytic products that display unique roles and functionality compared with their parent proteins (3, 45, 46, 49, 62).
Notably, it has been demonstrated that 20% of all cellular proteins are degraded in an ubiquitin-independent manner by the 20S proteasome (4), and analysis of the human genome has indicated that almost half of all proteins are predicted to contain disordered segments (21, 70). Thus, the theoretical substrate pool for the 20S proteasome is substantial, even in unstressed cells without widespread damage to proteins. In addition, recent studies have quantified the proportions of the various proteasome complexes across multiple cell types, revealing that the free 20S proteasome is consistently the most abundant form of the proteasome in cells (23, 24). Furthermore, under conditions of oxidative stress, there is de novo synthesis of 20S proteasome subunits and disassembly of the 26S proteasome into its 20S and 19S components, increasing the total amount of free 20S proteasome in the cell (1, 31, 72). The 20S proteasome remains catalytically active and has been implicated in the degradation of oxidatively damaged proteins, preventing them from accumulating and causing cytotoxicity and cell death (50). Oxidative stress also leads to the inactivation of ubiquitin conjugating enzymes, disrupting the ubiquitination cascade and thus reducing the flux of proteins through the 26S proteasome pathway (58).
The relatively large proportion of free 20S proteasomes, in particular under conditions of oxidative stress, is therefore theoretically capable of degrading a significant amount of proteins within the cell, both under normal and stress conditions. Given the broad substrate landscape of the 20S proteasome, which encompasses not only damaged proteins but also important regulatory proteins, it is unlikely that 20S proteasome-mediated degradation persists in an unregulated manner, as critical imbalances may occur. In addition, the significant increase in damaged proteins during stress that become potentially pathological and prone to aggregation and toxicity and require degradation could overload the 20S proteasomes leading to proteasome clogging and consequently dysfunction. Therefore, it is reasonable to assume that the flux of substrate proteins through the 20S proteasome pathway will be tightly regulated (Fig. 1).
While the presence of a regulatory mechanism to control this degradation process is highly likely, to date only two 20S proteasome regulators have been identified; NAD(P)H dehydrogenase [quinone] 1 (NQO1) (2, 48) and DJ-1 (47). These proteins share multiple similarities in structure and function, such as the presence of a Rossmann fold, their role in the cellular response to oxidative stress, and the ability to “moonlight” as 20S proteasome inhibitors while being enzymatically active in other cellular pathways (47). Given the cellular implications of improper regulation of the 20S proteasome, and the fact that DJ-1 was explored as a potential 20S proteasome regulator based on its similarities to NQO1, we hypothesized that there may exist a broader family of proteins that exhibit these features, and thus may also be able to regulate the 20S proteasome.
Here we performed a bioinformatic screen to identify other proteins with sequence and structural similarities to DJ-1 and NQO1. This led to the discovery of a family of 17 relatively small proteins of 20–30 kDa, which we named catalytic core regulators (CCRs), that oversee 20S proteasome activity. Of the 10 short-listed proteins that were identified and characterized, all were able to inhibit 20S proteasome degradation of known substrates, both in vitro and in cells. These protein regulators were able to specifically bind to the 20S proteasome, but not the 26S proteasome, and affect protein degradation. In addition, we demonstrate that the CCRs organize into a feed-forward regulatory circuit involving the master regulator of the oxidative stress response, Nrf2. Certain CCRs influence the stability of Nrf2, which subsequently upregulates the expression of other CCRs, leading to an overall dampening of 20S proteasome-mediated degradation of unfolded protein substrates within the cell. Overall, our results suggest that 20S proteasome-mediated degradation is not a simple and random process, but rather a highly CCR-regulated and coordinated mechanism.
Results
DJ-1 inhibition of the 20S proteasome is conserved across evolution
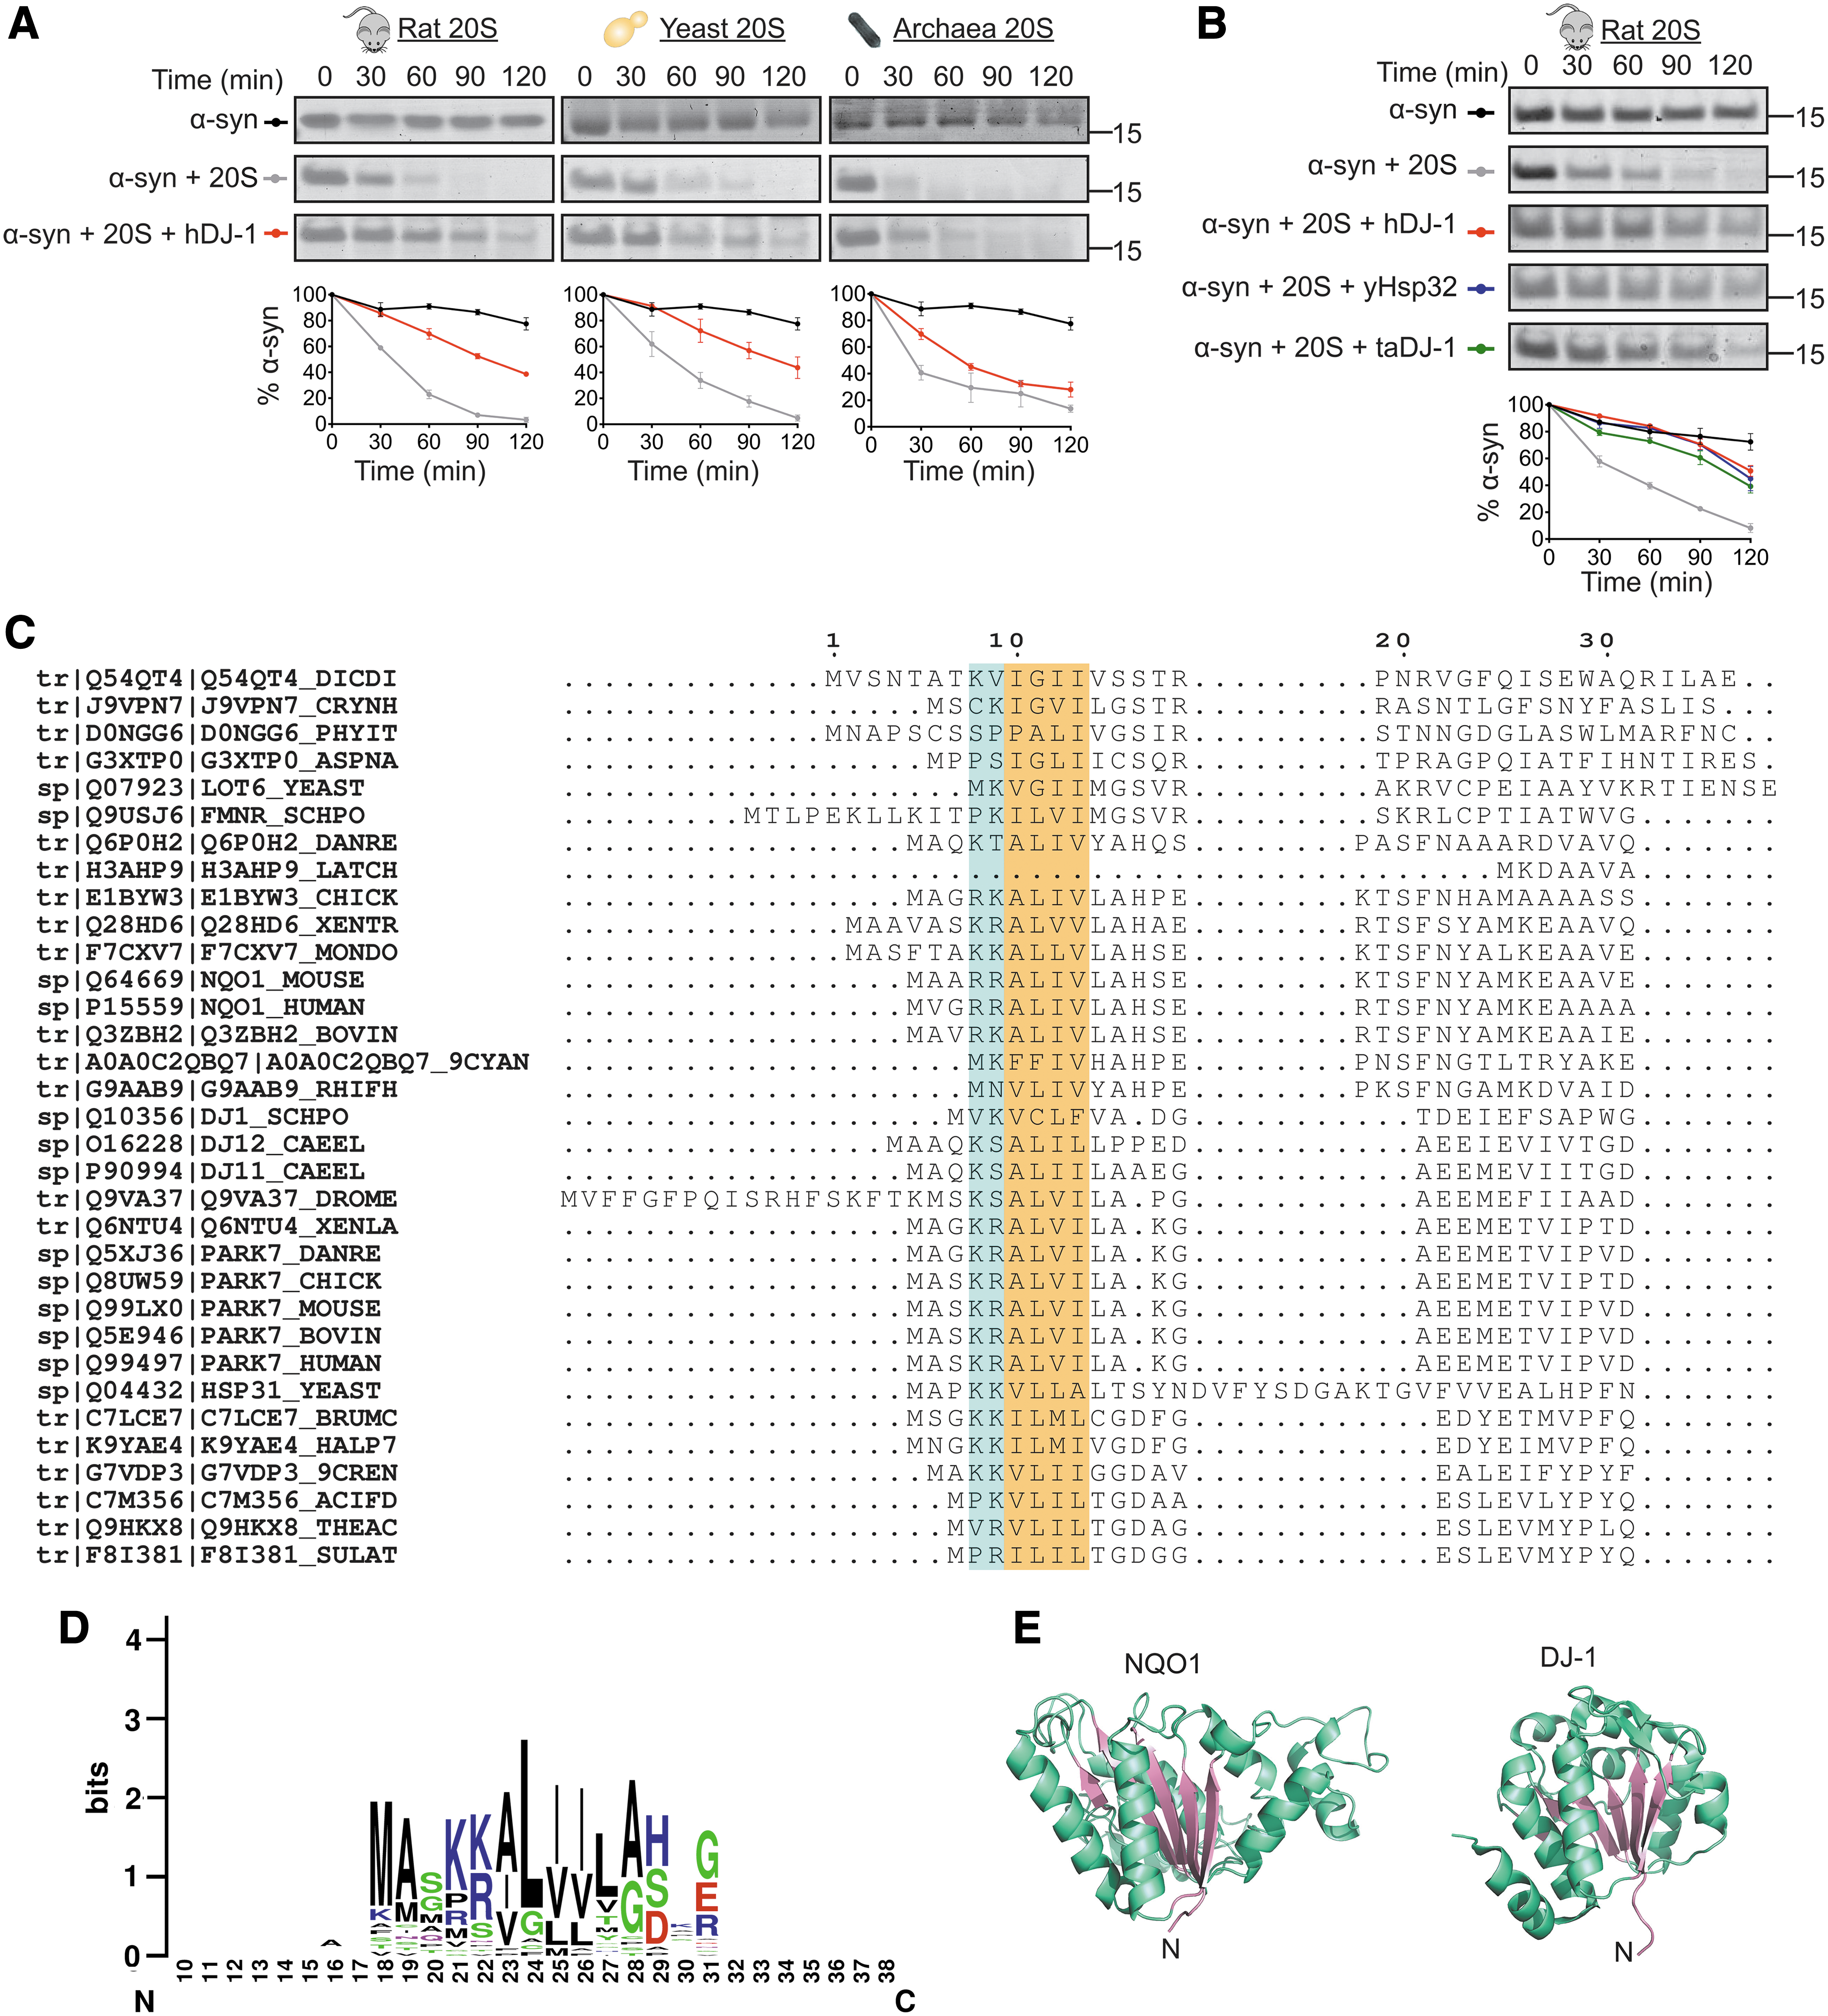
Previously, we discovered that DJ-1, the Parkinson's disease-related protein, is a regulator of the 20S proteasome (47). To determine if the inhibitory capacity of DJ-1 is evolutionarily conserved, we began by analyzing its ability to inhibit 20S proteasomes purified from three different sources; mammals, yeast, and archaea (Fig. 2A). The IDR containing model substrate α-synuclein (α-syn) was used to monitor 20S proteasome-mediated degradation over time. Inhibition of the human and yeast 20S proteasomes occurred to a similar degree, and despite the vast evolutionary distance, human DJ-1 was also able to reduce the rate of degradation of the archaeal 20S proteasome (Fig. 2A). The reciprocal experiment was also performed, in which DJ-1 homologues from mammals, yeast, and archaea were tested for their ability to inhibit the mammalian 20S proteasome (Fig. 2B). All three DJ-1 homologues were able to inhibit the 20S proteasome, reducing the rate of degradation of α-syn over the course of the experiment. Taken together, these results indicate that the inhibition of the 20S proteasome by DJ-1 is conserved across evolution, highlighting the essentiality of this cellular process.
Bioinformatic screen identified a new family of CCRs
The ability of DJ-1 to inhibit 20S proteasomes from such evolutionarily distant species not only indicates that this process evolved early but it also provides the basis for searching for additional proteins with similar properties. In addition, a homologue of NQO1 from yeast, Lot6, was also shown to interact with and inhibit the 20S proteasome, further supporting the view that this is a conserved process (61). Therefore, a bioinformatic approach was used to reveal the sequence and structural similarities of NQO1 and DJ-1, with the rationale that identified features would then be exploited to search for new 20S proteasome regulatory candidates. As a first step, a multiple sequence alignment (MSA) of NQO1 and DJ-1 homologues from a wide variety of species was performed (Fig. 2C), revealing a conserved region toward the N-terminus of the proteins. This motif consists of two positively charged residues (K or R) followed by at least four hydrophobic residues (A, V, I, or L) (Fig. 2D). Both NQO1 and DJ-1 adopt a Rossmann fold, composed of an extended parallel β-sheet with α-helices surrounding both faces to produce a three-layered α/β/α sandwich (Fig. 2E). Therefore, the search for new 20S proteasome regulatory candidates was restricted to proteins that have been classified as Rossmann fold containing proteins, contain the conserved N-terminal motif, and are less than 100kDa in size.
The search yielded 17 proteins, including NQO1 and DJ-1, herein referred to as CCRs (Table 1). Interestingly, all of these proteins range in size from 20 to 30 kDa, and examination of the literature indicated that many of them are known to be connected to the oxidative stress response in cells, with links to Nrf2 (references listed in Table 1). Included among the potential CCRs are several well-characterized enzymes, such as the quinone reductase enzyme NRH:quinone oxidoreductase 2 (NQO2), which is in the same enzyme family as NQO1, carbonyl reductase 3 (CBR3) and 15-hydroxyprostaglandin dehydrogenase (PGDH). Multiple members of the Ras superfamily of proteins are represented, such as NRas, KRas, and HRas, as well as Rho and Rap family proteins. Interestingly, analysis of the tissue-wide protein expression levels of 10 of these putative CCRs demonstrates that some of them display specificity to certain tissues, such as retinoblastoma binding protein 9 (RBBP9) in the oral epithelium and PGDH in the lung, while DJ-1 and RhoA display a significantly more widespread expression profile than that of the other proteins (Supplementary Fig. S1). This hints toward variation in the activities of these proteins, possibly indicating additional significance to the roles of DJ-1 and RhoA.
Shortlisted Catalytic Core Regulator Candidates Containing Conserved N-Terminal Motif and a Rossmann Fold
Relevant references linking between the transcription factor Nrf2 and a specific CCR are indicated.
CCR, catalytic core regulator.
CCRs inhibit 20S proteasome substrate degradation in vitro
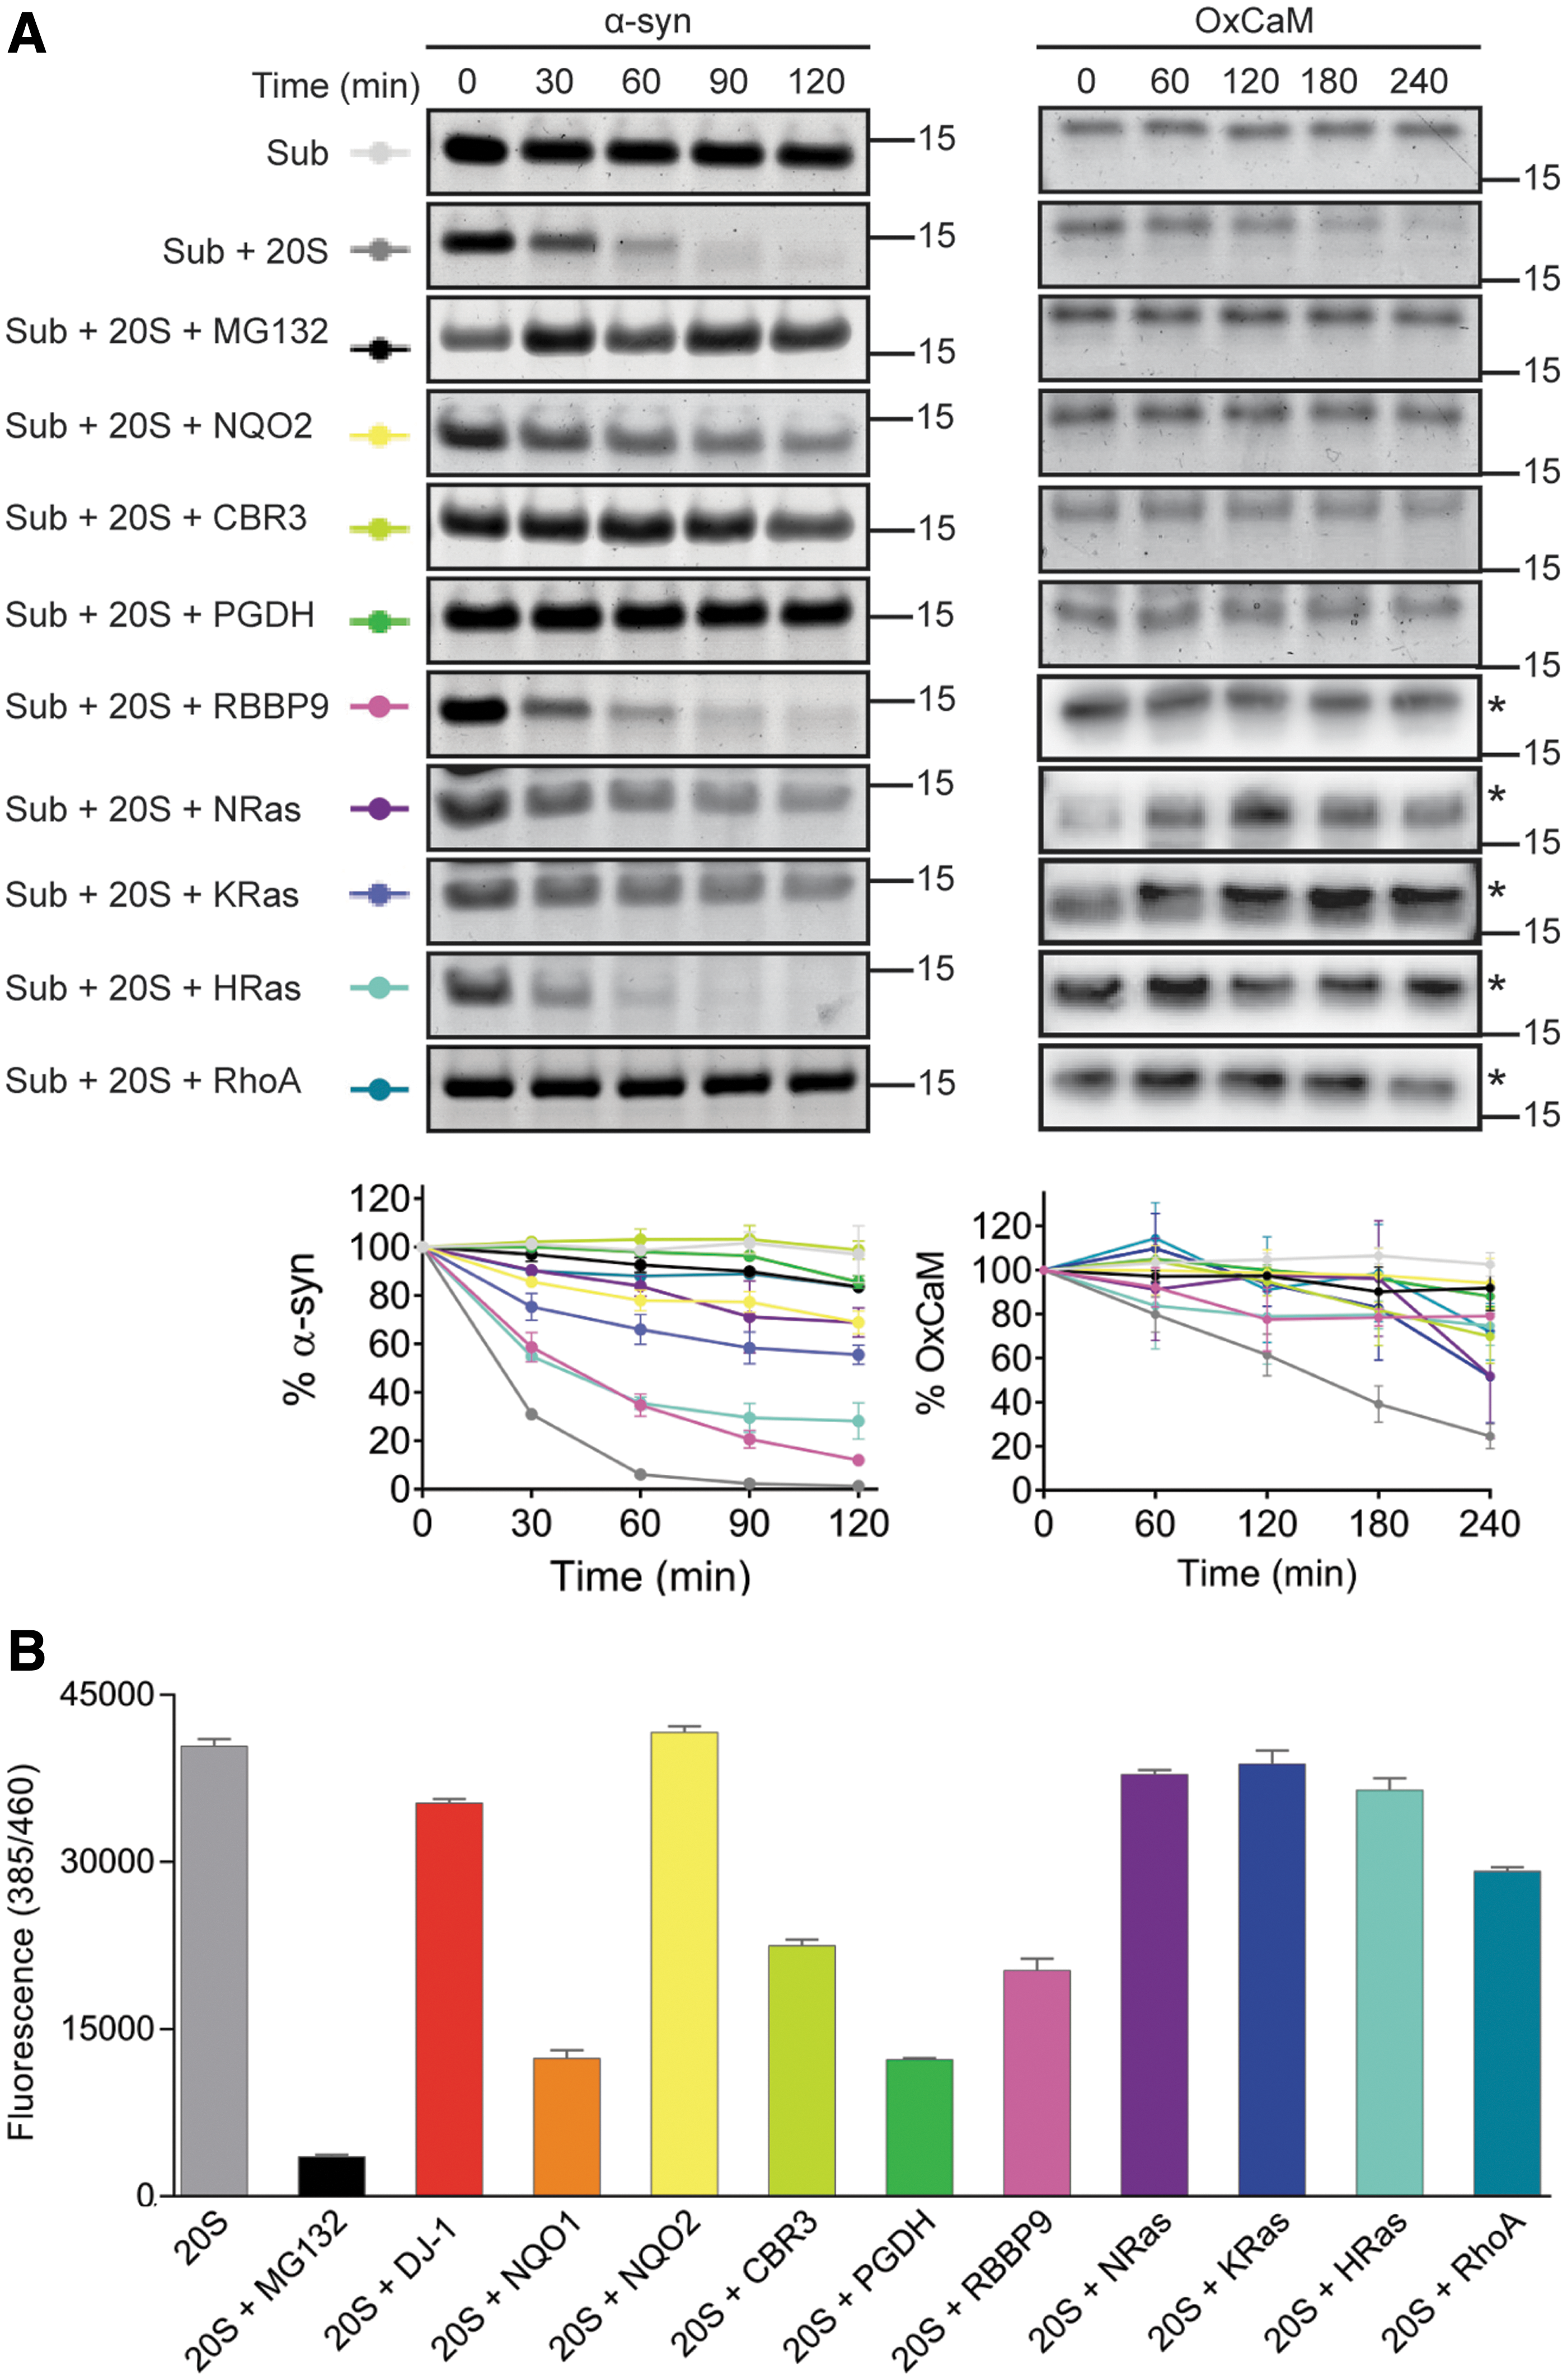
To determine if any of these candidates are indeed capable of affecting the 20S proteasome activity, we selected in addition to NQO1 and DJ-1, eight proteins for analysis: NQO2, CBR3, PGDH, RBBP9, NRas, KRas, HRas, and RhoA. These proteins were expressed, purified, and tested by in vitro degradation assays with purified mammalian 20S proteasomes and two different model substrates, α-syn (66) and oxidized calmodulin (OxCaM) (25) (Fig. 3A). MG132 was included as a control for proteasome inhibition. The majority of the CCRs successfully inhibited the degradation of α-syn, with the exception of RBBP9 and HRas. However, all of the candidates prevented the degradation of OxCaM. To assess the concentration dependence of the CCRs in inhibiting the 20S proteasome, three representative CCRs, NQO2, CBR3, and NRas, were further analyzed using a concentration range of the CCRs, while maintaining constant levels of 20S proteasome and α-syn (Supplementary Fig. S2A). While CBR3 and NRas clearly showed concentration-dependent inhibition of the 20S proteasome, the inhibition by NQO2 was highly potent, strongly inhibiting degradation even at the lowest concentration tested (Supplementary Fig. S2A). We also performed a representative degradation assay using nanomolar concentrations of CBR3, 20S proteasome, and α-syn, to validate the ability of this CCR to inhibit the 20S proteasome at these more physiologically relevant concentrations (Supplementary Fig. S2B). Taken together, these results indicate that the CCRs are capable of inhibiting protein degradation by the 20S proteasome in vitro, with an element of substrate specificity demonstrated for HRas and RBBP9.
To clarify whether the inhibition is a result of competitive inhibition, that is, the CCRs themselves are being degraded by the 20S proteasome in preference to the model substrates, each CCR was analyzed by in vitro degradation assay with 20S proteasome in the absence of a substrate (Supplementary Fig. S3A). Quantification of the amount of CCRs remaining over the course of the assay indicated that they themselves are stable, and are therefore not acting as competitive substrates (Supplementary Fig. S3B).
We continued by examining whether the CCRs can affect the enzymatic activity of the 20S proteasome using a fluorogenic peptidase activity assay (Fig. 3B). Compared with MG132, which drastically reduced the proteolytic activity of the 20S proteasome, several of the CCRs behaved like DJ-1 (47) and showed an insignificant effect on peptide degradation. However, CBR3 and RBBP9 reduced the proteolytic activity by about half, while NQO1 and PGDH showed the most significant inhibition. To determine the concentration dependence of the CCRs on their ability to inhibit peptide degradation, representative CCRs that inhibited (NQO1, CBR3) or did not inhibit (NQO2, NRas) peptide degradation were selected and tested using a concentration range of the CCRs (Supplementary Fig. S4). While the inhibitory CCRs displayed a clear concentration dependence in their inhibition, the peptide-noninhibitory CCRs did not inhibit at any concentration tested. While there are differences in the capacity of the CCRs to prevent peptide degradation, they are not able to completely block degradation, as was observed for MG132. This indicates that they do not deactivate the catalytic sites of the proteasome, but rather they act using another regulatory mechanism. Whether the CCRs prevent protein degradation by masking the entrance to the proteasome or by an allosteric mechanism remains to be determined.
To address whether the CCR inhibitory capacity on the 20S proteasome is conserved across evolution, as was demonstrated for DJ-1 (Fig. 2), we selected CBR3 as a representative CCR and analyzed its effect on the degradation of α-syn by yeast and archaeal 20S proteasomes (Supplementary Fig. S5A, B). Human CBR3 inhibited degradation by both proteasomes, indicating that like DJ-1, inhibition of the 20S proteasome by the CCR family is conserved across evolution. This observation further strengthens the possibility of conservation of function across CCRs from evolutionarily distant species (Supplementary Fig. S5C).
CCRs preferentially bind to the 20S proteasome over the 26S proteasome to inhibit substrate degradation
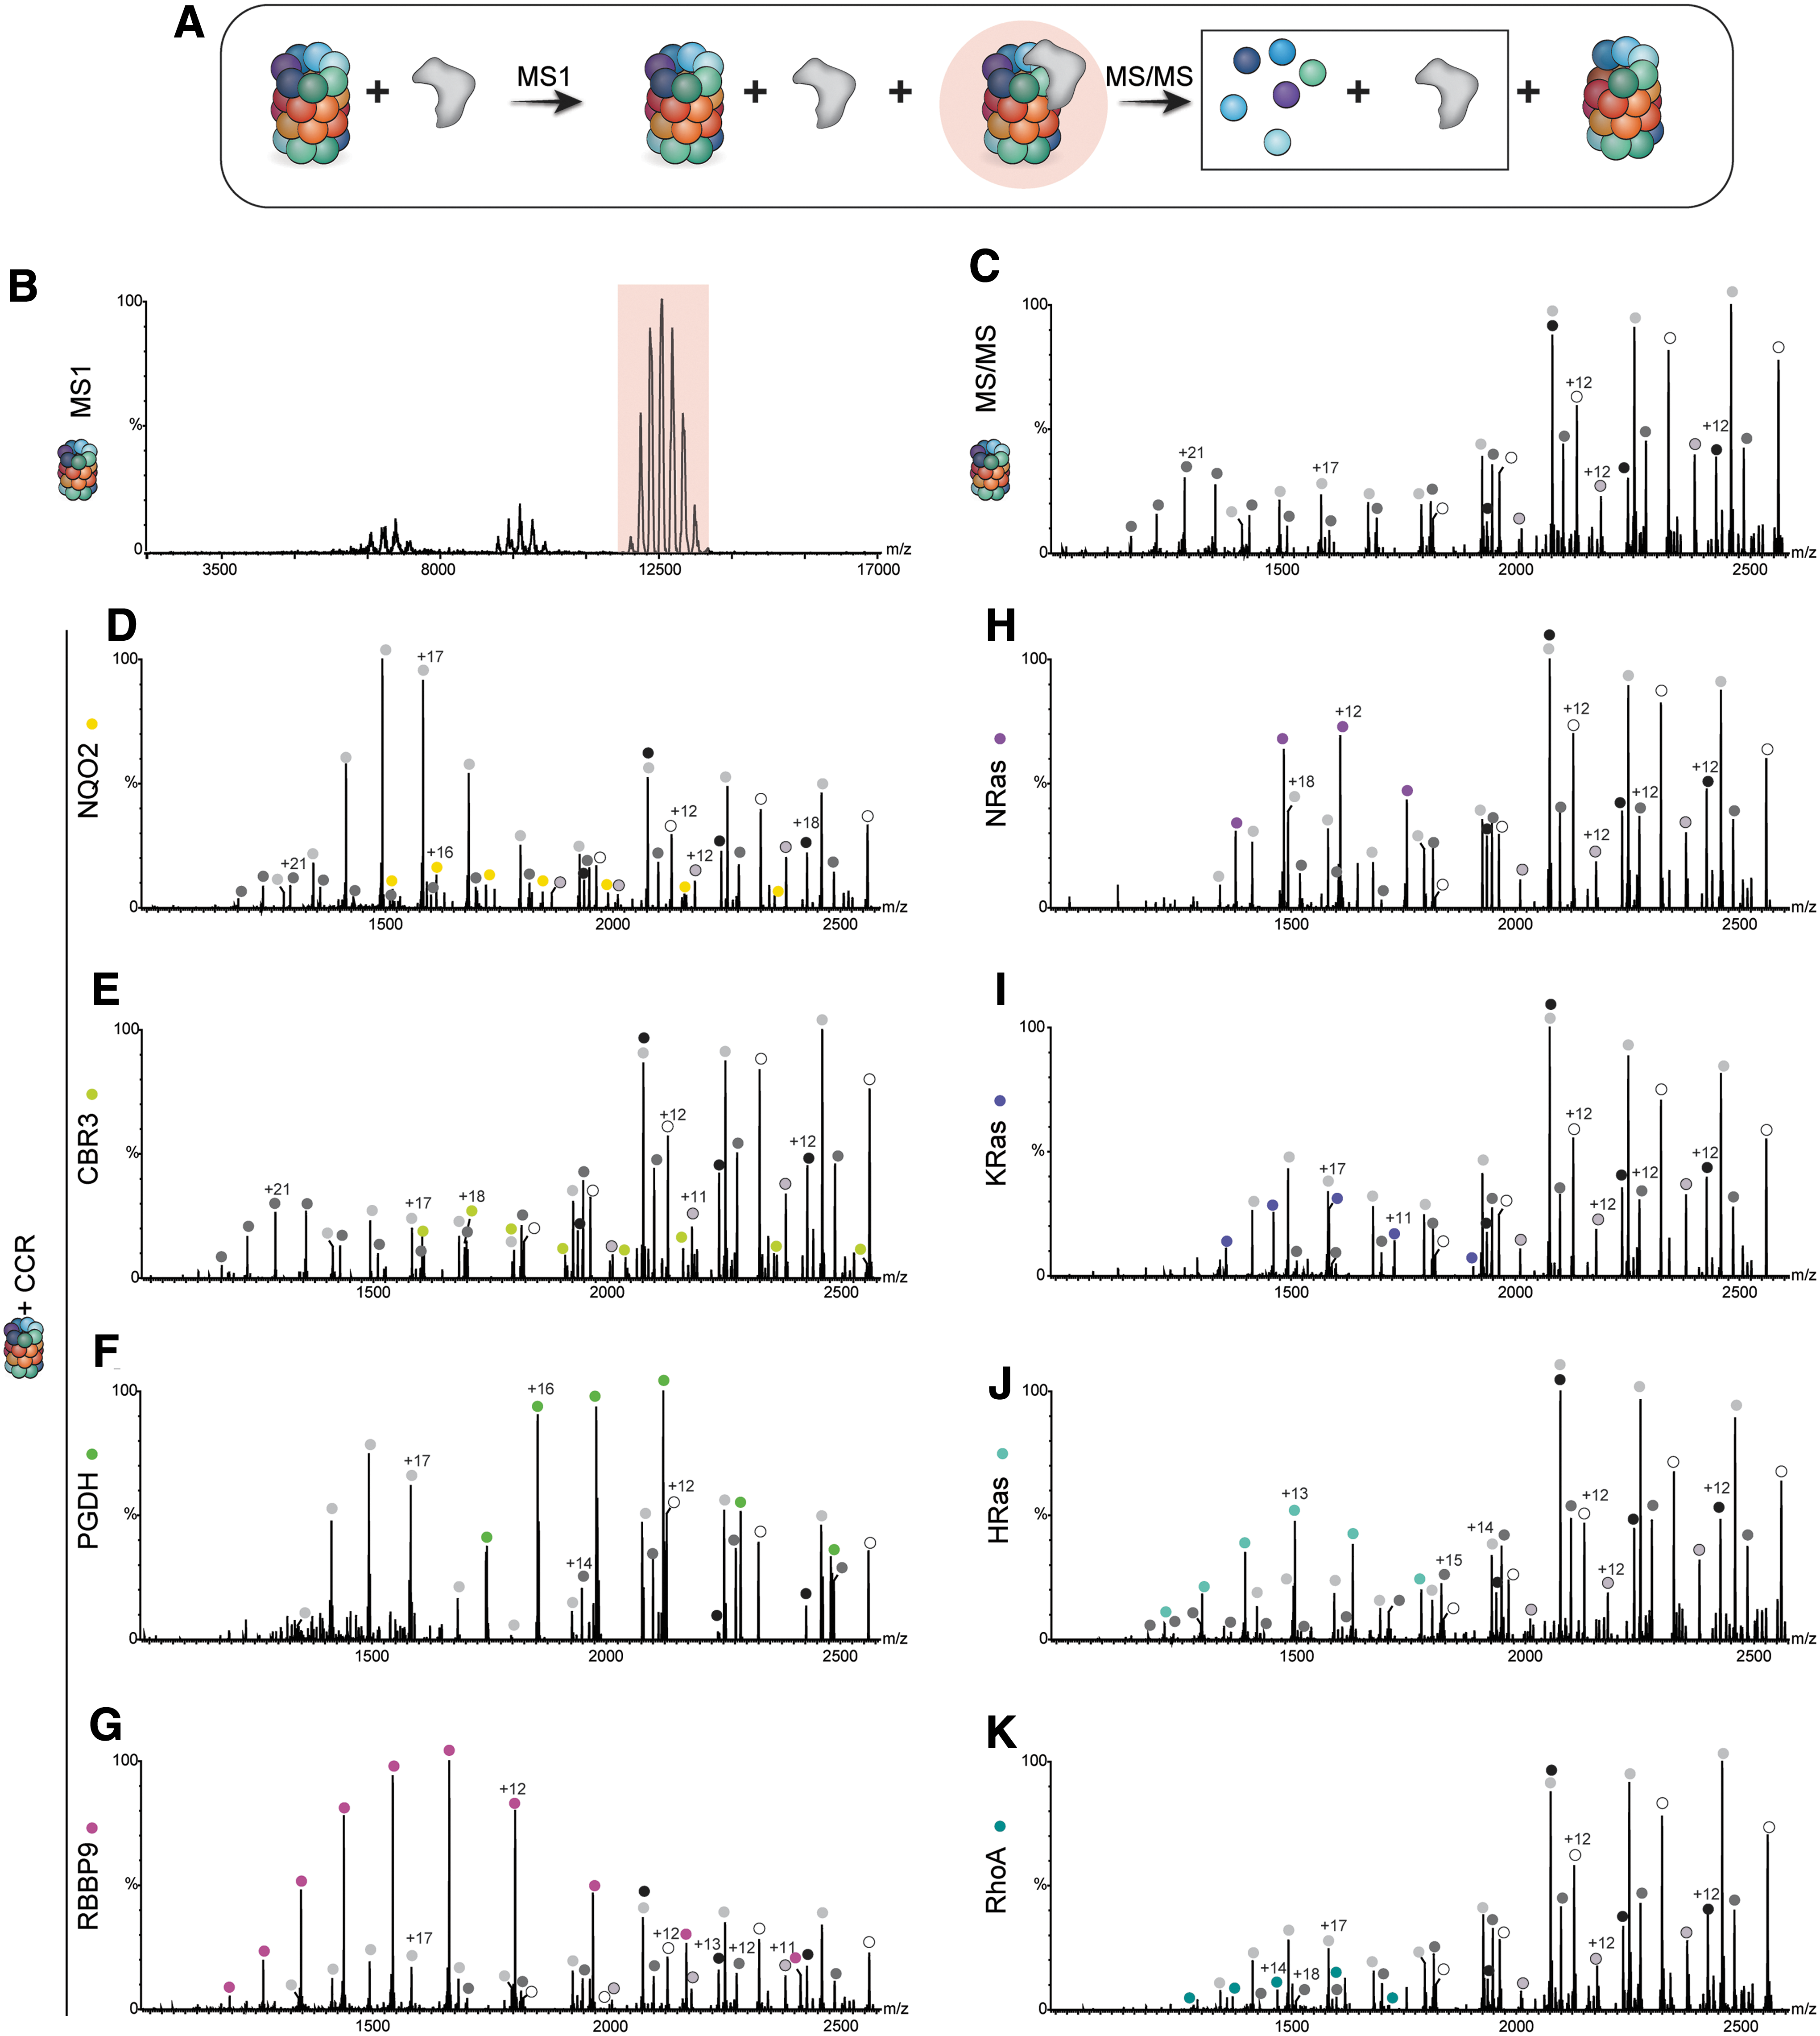
The ability of the CCRs to inhibit protein degradation could be due to either direct interactions with the 20S proteasome or sequestration of the substrate away from the proteasome by forming a stable complex with the regulator. Previous experiments with NQO1 and DJ-1 revealed that they did not interact with the substrate itself but rather physically bound to the 20S proteasome and inhibited its activity directly (47, 48). We therefore utilized this native mass spectrometry approach and started by analyzing the interaction between the CCRs and α-syn (Supplementary Fig. S6). α-syn was incubated with each of the CCRs and their native mass spectra were analyzed. No larger complexes formed by the CCRs and α-syn were detected, suggesting that the inhibition of protein degradation does not occur by competitive inhibition via substrate sequestration. The inhibition of protein degradation is therefore likely mediated by direct binding of the CCRs to the 20S proteasome. To test this, each of the CCRs was incubated with 20S proteasome, and tandem mass spectrometry (MS/MS) was used to detect binding. MS/MS involves three stages, beginning with the acquisition of a native MS spectrum of the intact protein complex in the protein mixture. This allows for the identification of the 20S proteasome in the high m/z range, as well as free CCR in the low m/z range. The peak series corresponding to the 20S proteasome complex is then isolated, allowing for specific selection of the 20S proteasome and its associated proteins, and not free CCR that remains unbound. The isolated complexes are subjected to high collision energies, leading to dissociation of any bound proteins as well as individual subunits of the 20S proteasome. These dissociated monomeric subunits and proteins can be detected in the low m/z range of the spectrum, and mass assignment allows for the identification of known 20S subunits, as well as CCRs that were bound to the 20S proteasome (Fig. 4A). For each of the samples containing the CCRs, a unique series of peaks corresponding in size to the predicted molecular weight of the specific CCR were identified, that were not found in the spectrum for the 20S proteasome alone, alongside peak series corresponding to known 20S proteasome subunits (Fig. 4B–K and Supplementary Table S1). By extrapolation, we can therefore conclude that before the MS/MS analysis, the examined CCRs bound directly to the 20S proteasome to regulate its function.
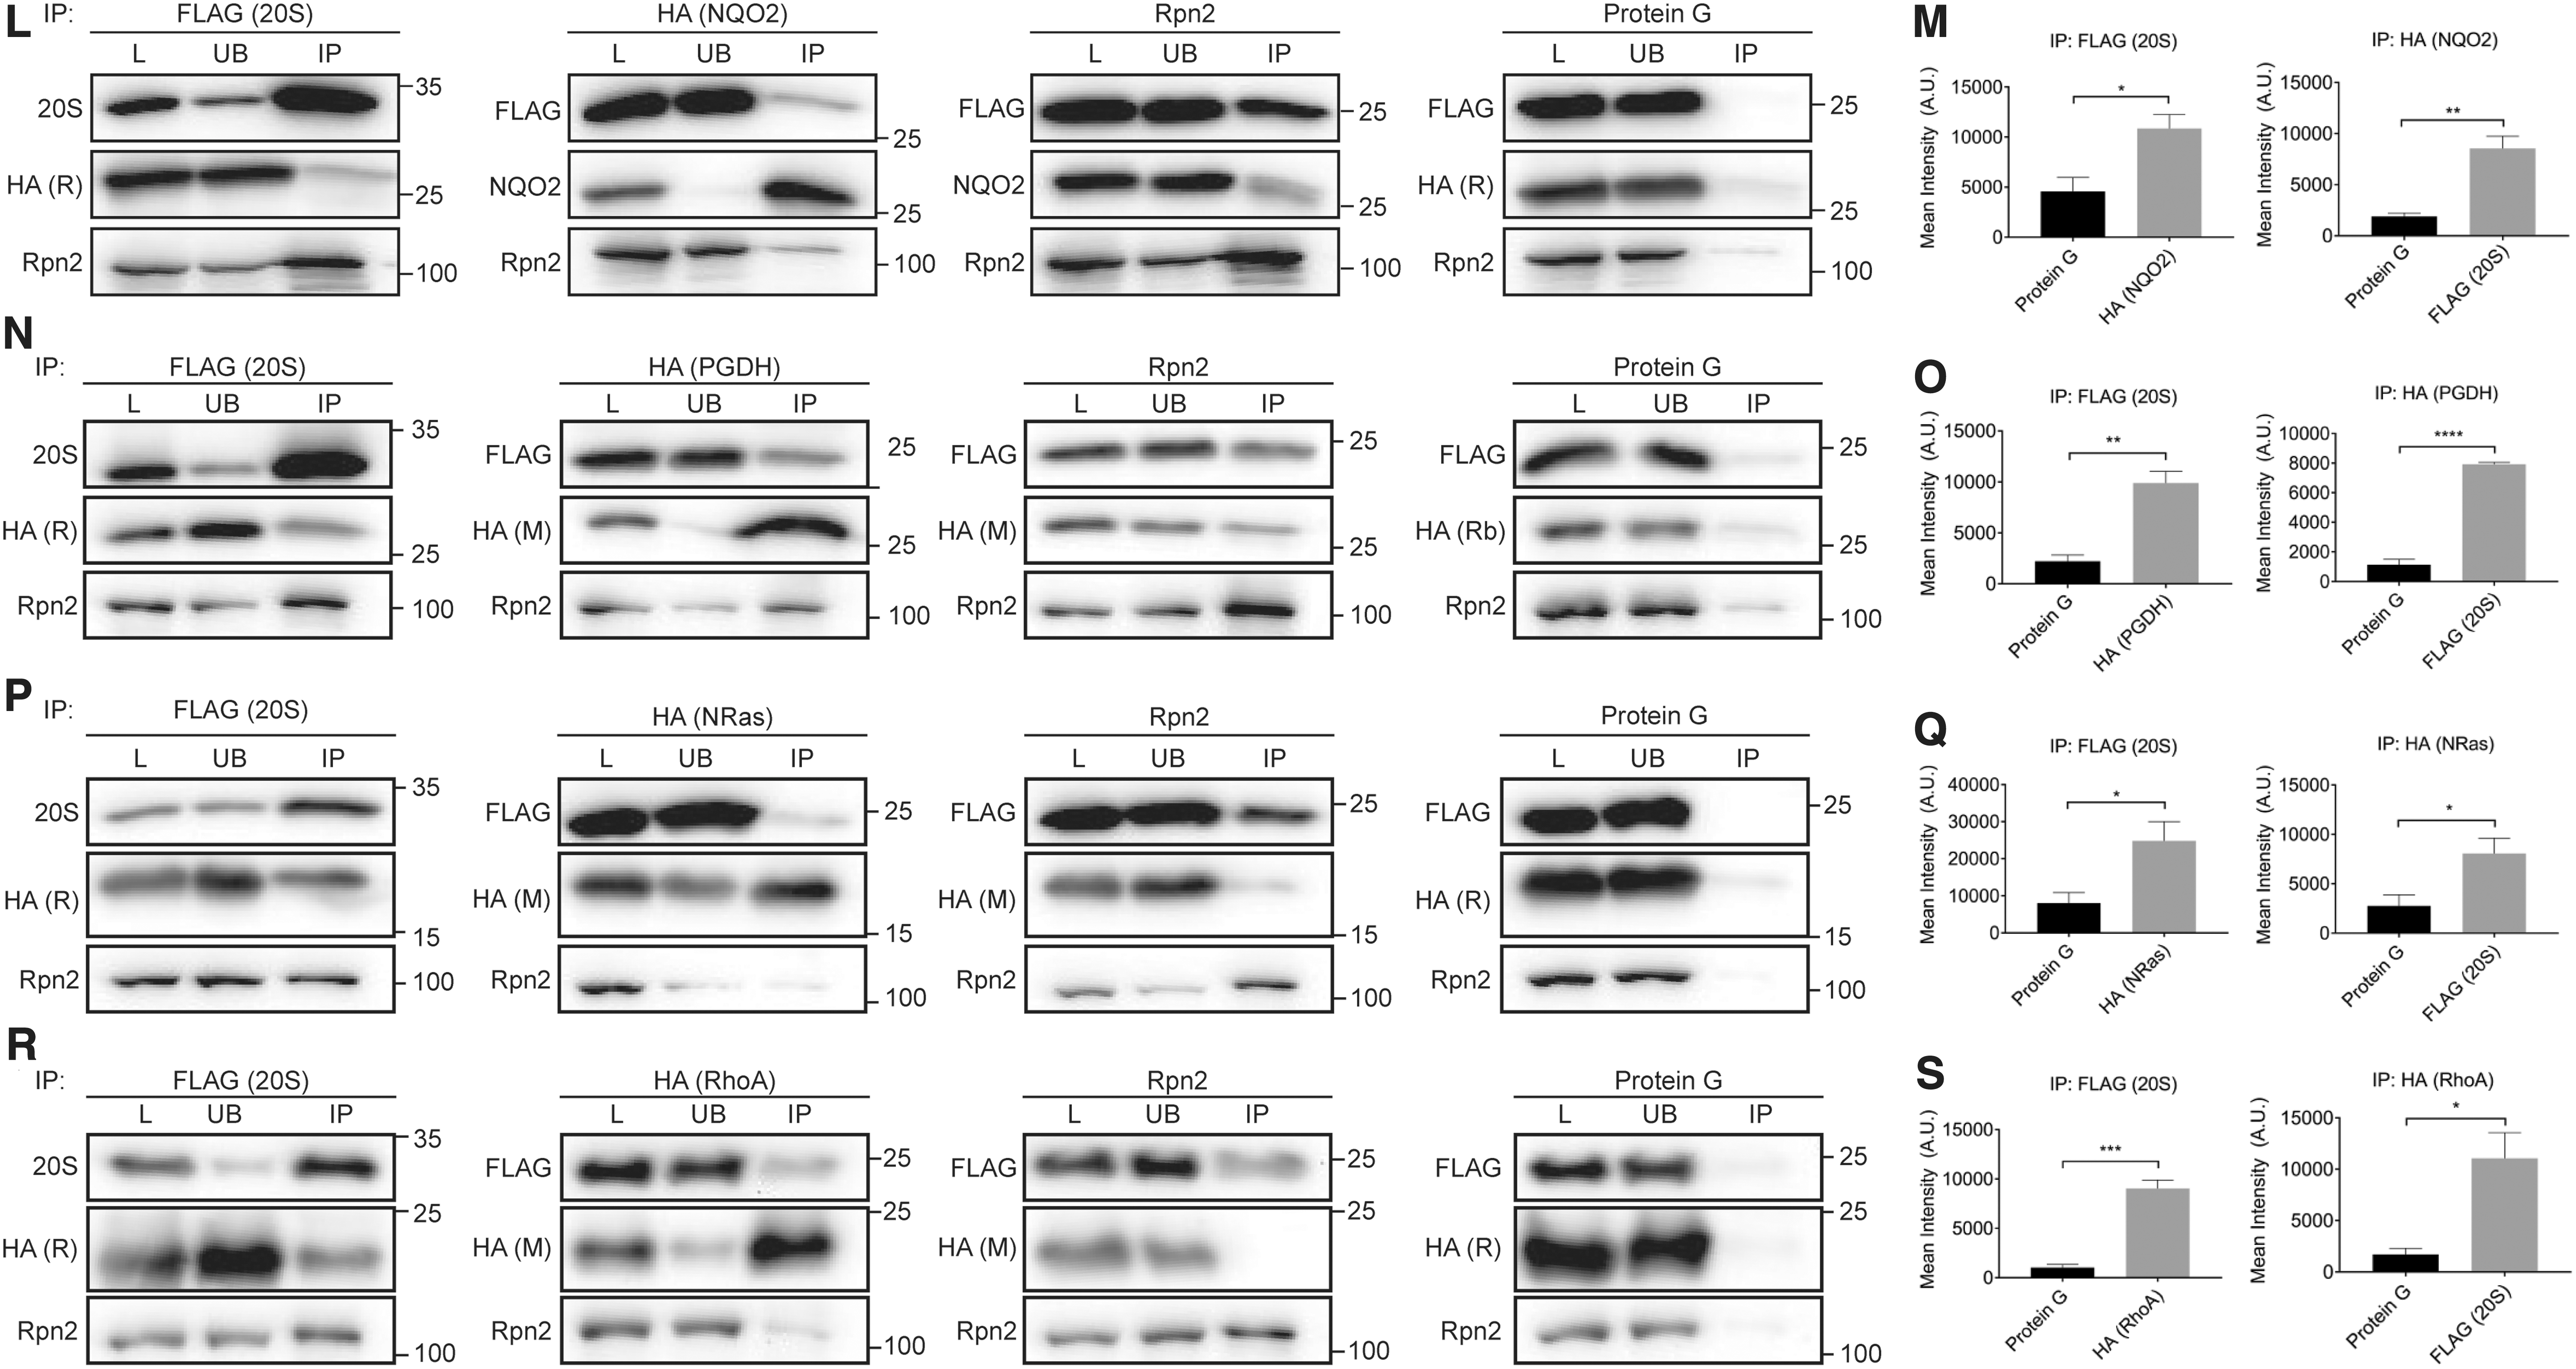
To determine whether this binding occurs in cells, and is specific for the 20S proteasome, or if the CCRs can also bind to the 26S proteasome, immunoprecipitation (IP) experiments were performed using HEK293T cells stably expressing the 20S proteasome β4 subunit with a FLAG-tag on the C-terminus. Four representative CCRs (NQO2, PGDH, NRas, and RhoA) were selected for the analysis. Each of these CCRs, containing a C-terminal HA-tag, was transiently overexpressed before lysis and IP to aid in the efficiency of the pull down. Whole cell lysates were IP'd with anti-FLAG, anti-HA, or anti-Rpn2 (a subunit of the 19S regulatory particle of the 26S proteasome) antibodies, to pull down the 20S proteasome, the CCRs, or the 26S proteasome, respectively. A control IP using uncoupled Protein G beads was performed in parallel to ascertain the background levels of the proteins binding to the beads during the IP. Bound proteins were then analyzed by Western blotting with anti-PSMA1 (20S proteasome α1 subunit), anti-Rpn2 (19S subunit), and anti-CCR/HA antibodies (Fig. 4L, N, P, R, and Supplementary Fig. S7). Quantification of the levels of the CCRs being pulled down with the 20S proteasome in the FLAG IP revealed a significant increase in the amount of CCRs binding to the 20S proteasome, compared with the Protein G control (Fig. 4M, O, Q, S—left panels). This interaction was confirmed in the reciprocal IP, where the amount of 20S proteasome being pulled down with the CCRs in the HA IP is significantly increased compared with the Protein G control (Fig. 4M, O, Q, S—right panels). Of note, the interaction between RhoA and the 20S proteasome was detectable only after exposure of the cells to oxidative stress, likely due to the increased levels of free 20S proteasome under these conditions, as discussed earlier. Binding of the CCRs to the 26S proteasome (Rpn2) only occurred at low levels in both the HA and Rpn2 IPs, indicating a preference for CCR binding to the 20S proteasome, or to singly capped 26S proteasomes. Taken together, these results establish that the CCRs specifically bind to the 20S proteasome in cells.
CCRs stabilize the cellular levels of 20S proteasome substrates
We were motivated to examine whether our in vitro observations, revealing the CCR ability to bind to the 20S proteasome and to prevent substrate degradation, are also relevant in a cellular context. To explore this, we overexpressed three representative CCRs (NQO2, CBR3, and PGDH), alongside green fluorescent protein (GFP) as a control, in HEK293T cells and measured the effect on known 20S proteasome substrates, α-syn and p53 (2) (Fig. 5A–C and Supplementary Fig. S8A–C). The cellular levels of both α-syn and p53 increased significantly when the CCRs were overexpressed compared with GFP. These data indicate that the 20S proteasome is being inhibited by the increased levels of CCRs in the cells, leading to reduced degradation of substrates and their consequent accumulation.
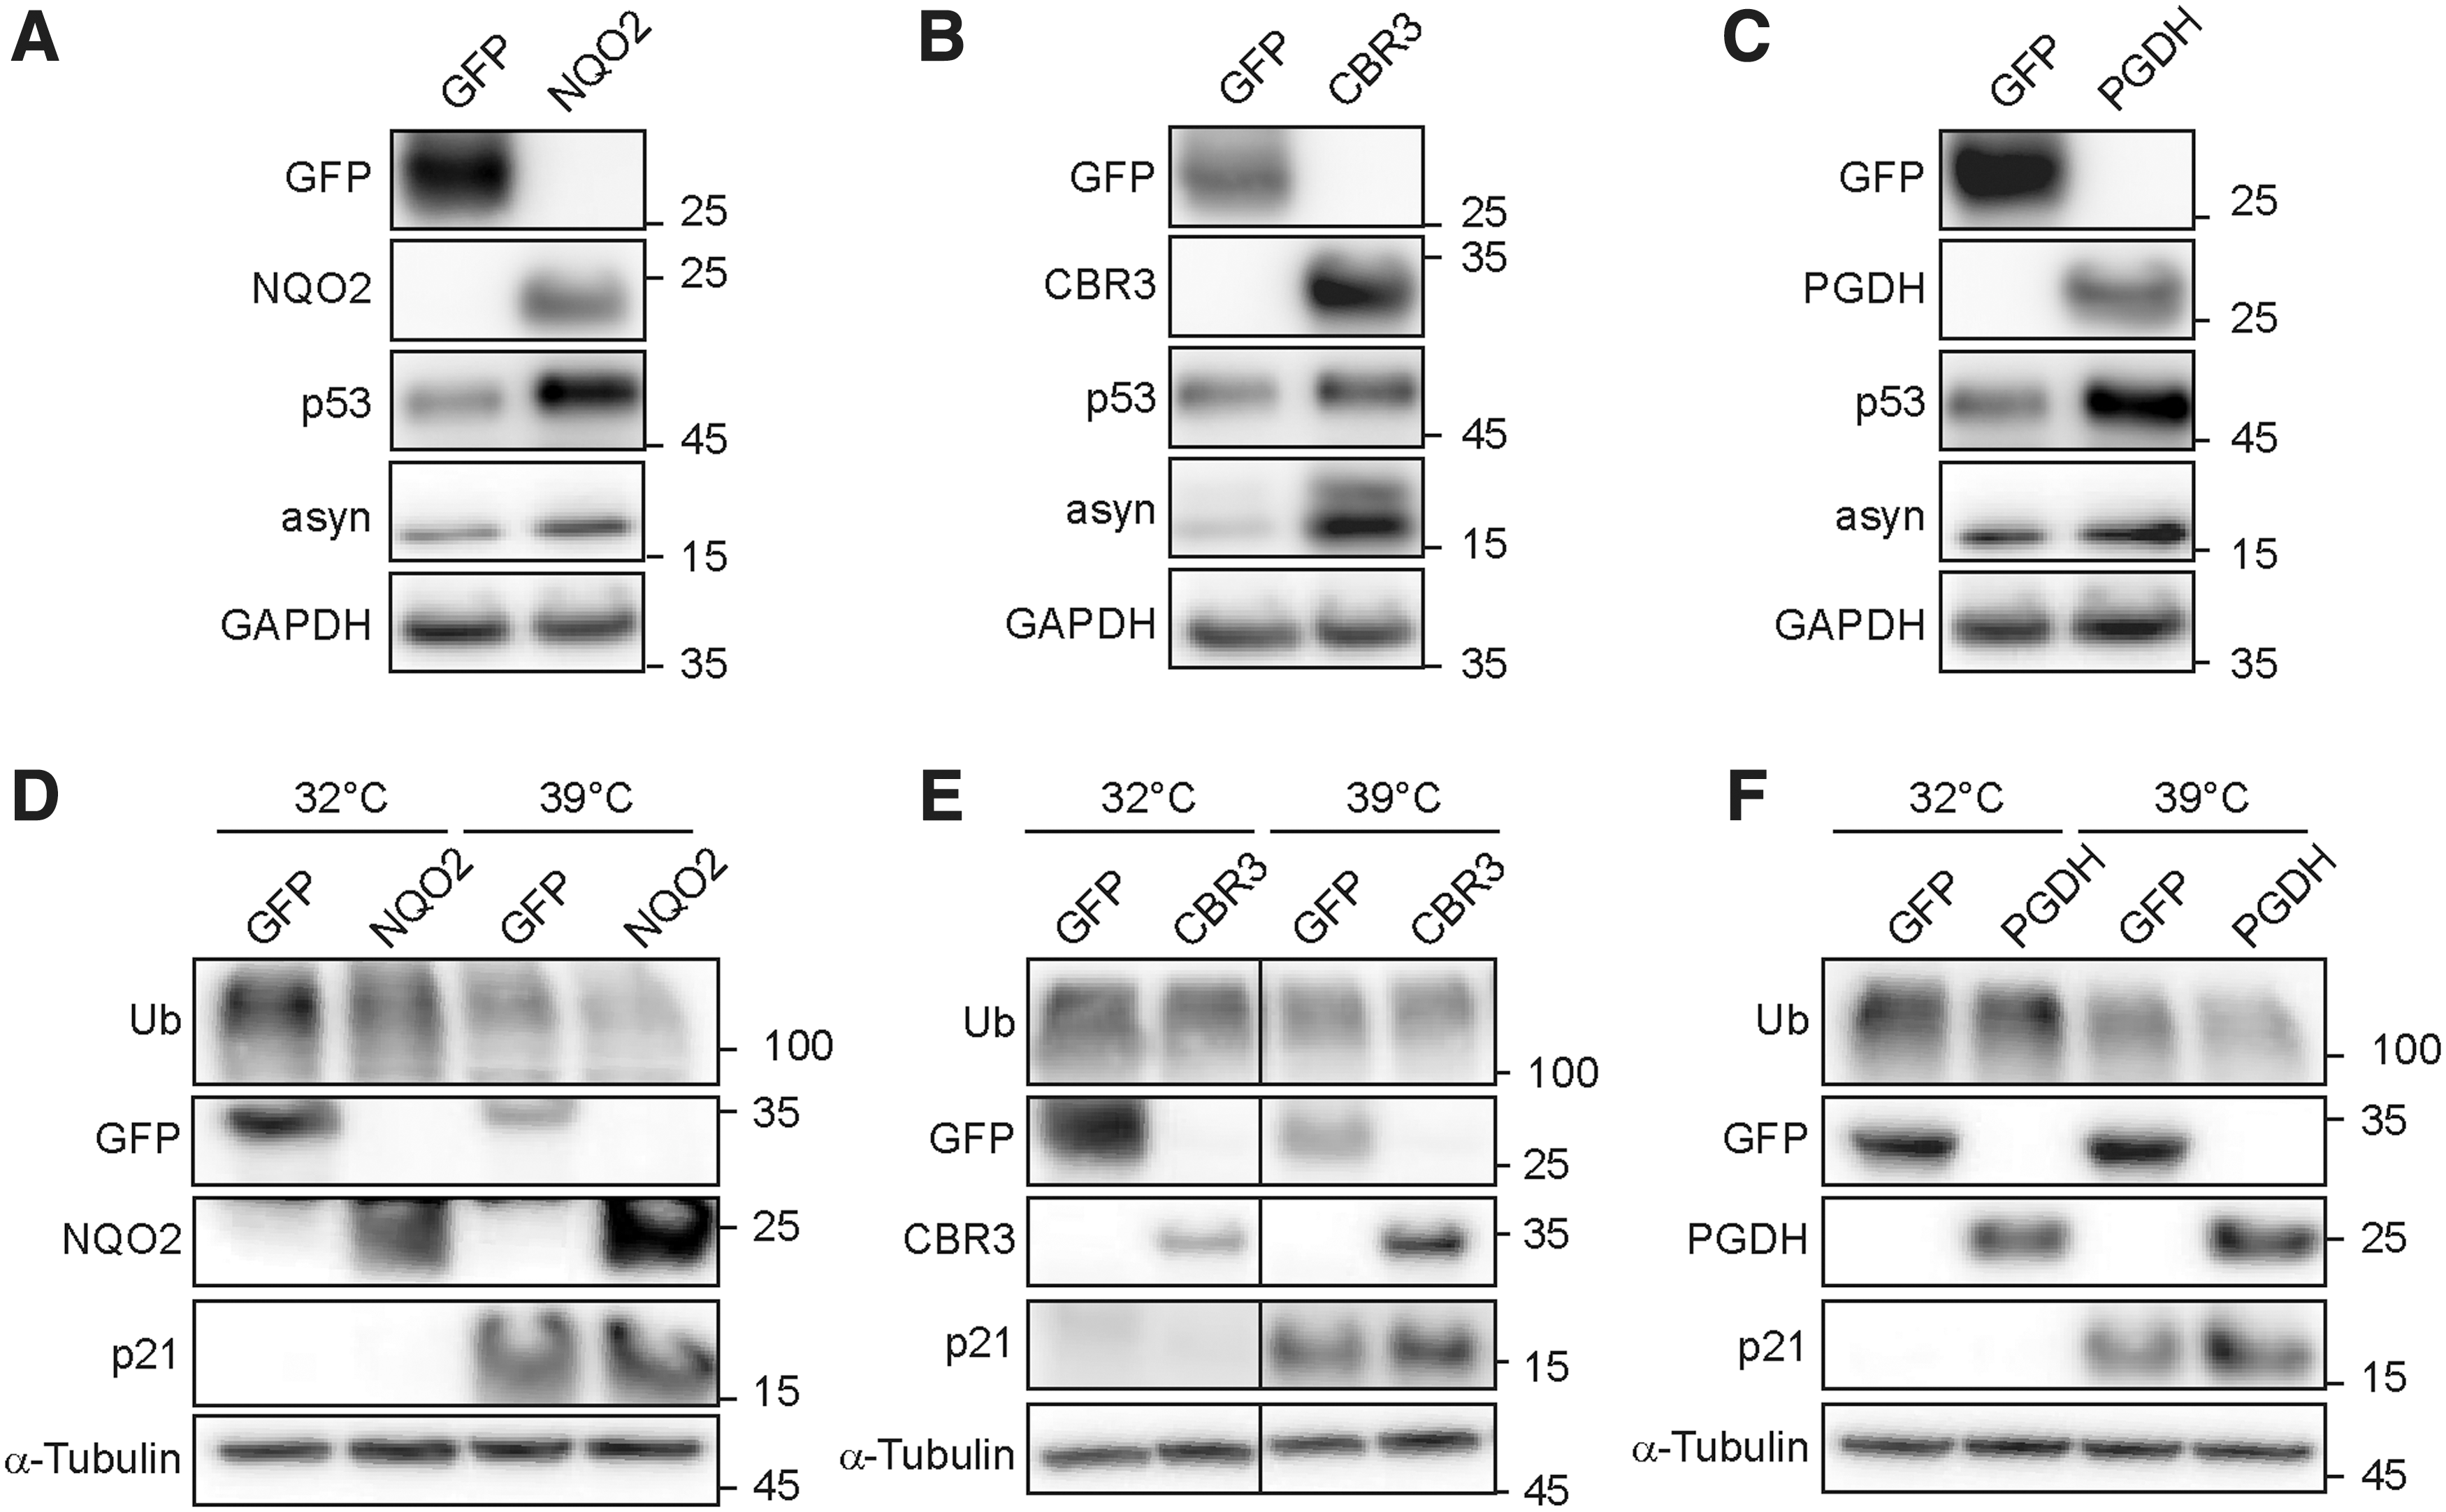
To determine if the effect of CCR inhibition of the 20S proteasome is relevant to other known substrates, we followed the levels of a cell cycle regulator, p21, an IDP that has been previously shown to be a substrate of the 20S proteasome (11, 12, 38). However, analysis of this protein is complicated by two factors. First, evidence has shown that p21 can be ubiquitinated and degraded both by the 26S proteasome and the 20S proteasome (8), making it challenging to differentiate by which route p21 is being degraded and therefore which degradation pathway is affected by any treatment or intervention. Second, the basal levels of p21 are low across most of the cell cycle, with the exception of enrichment at the G1/S checkpoint (74), leading to difficulties in the detection of p21 at sufficient levels for analysis. Therefore, to follow changes in the levels of p21, we used the mouse fibroblast cell line, A31N-ts20 BALB/c, which contains a temperature-sensitive mutant of the E1 ubiquitin activating enzyme (55). Incubation of these cells at the permissive temperate of 32°C allows normal cell growth. Upon transfer of the cells to the restrictive temperature of 39°C, the E1 enzyme is deactivated, and the ubiquitination cascade is subsequently affected. The reduction in ubiquitination levels allows for the accumulation of proteins such as p21, which is normally ubiquitinated and degraded. Under these conditions, degradation by the 26S proteasome is attenuated, while leaving the 20S proteasome degradation route unaffected. We transiently overexpressed the same three CCRs (NQO2, CBR3, and PGDH) in A31N-ts20 BALB/c cells, followed by 24 h of growth at either 32°C or 39°C (Fig. 5D–F and Supplementary Fig. S8D–F). At the restrictive temperature, we clearly see a reduction in ubiquitin conjugate levels, and appearance of p21, due to the loss of the ubiquitination cascade. Compared with the GFP control, p21 levels are enriched when the CCRs are overexpressed. This stabilization of p21 levels is likely due to the specific inhibition of the 20S proteasome degradation pathway by the CCRs. Altogether, these data demonstrate that the CCRs influence the cellular levels of 20S proteasome substrates.
CCRs and Nrf2 form a robust regulatory circuit during oxidative stress
Previous research demonstrated that NQO1 and DJ-1 form a feedback loop with the transcription factor Nrf2 in response to oxidative stress to regulate the activity of the 20S proteasome (47). DJ-1 was shown to stabilize the levels of Nrf2 (15), in turn inducing the expression of NQO1 and subunits of the 20S proteasome (47). In parallel, DJ-1 and NQO1 both inhibit the 20S proteasome, thus providing a delicate balance between increased 20S proteasome levels during oxidative stress, and appropriate control of 20S proteasome degradation (47). Many of the newly discovered CCRs have been shown to be linked to Nrf2 either as downstream transcriptional targets or upstream factors that influence stability (Table 1) (13, 19, 28, 60, 65, 71, 75). To determine the status of each CCR during the Nrf2 response to oxidative stress, we downregulated the levels of Nrf2 followed by induction of oxidative stress using diethylmaleate (DEM), a compound that depletes glutathione, leading to the accumulation of reactive oxygen species (Fig. 6A, B, and Supplementary Figs. S9A and S10). As expected, induction of oxidative stress led to nuclear translocation of Nrf2 accompanied by its accumulation. Quantification of the levels of the CCRs led us to classify them into three groups, depending on their response to oxidative stress and Nrf2 silencing (Fig. 6C–E). The first group is the inducible Nrf2 responders: NQO2 and CBR3 responded in the same manner as NQO1, with increasing protein levels over the time-course of oxidative stress, which were reduced when Nrf2 was silenced (Fig. 6C). The second group is the basal Nrf2 responders, comprising only NRas, which did not show a significant increase during oxidative stress, however, when Nrf2 was silenced its levels were significantly reduced (Fig. 6D). This observation is supported by previous studies showing that Nrf2 can activate the transcription of certain genes under basal conditions, as opposed to under oxidative stress (41). This is the first reported data revealing transcriptional regulation of NRas by Nrf2, hinting toward a potentially important influence of Nrf2 on the Ras family signaling pathways.
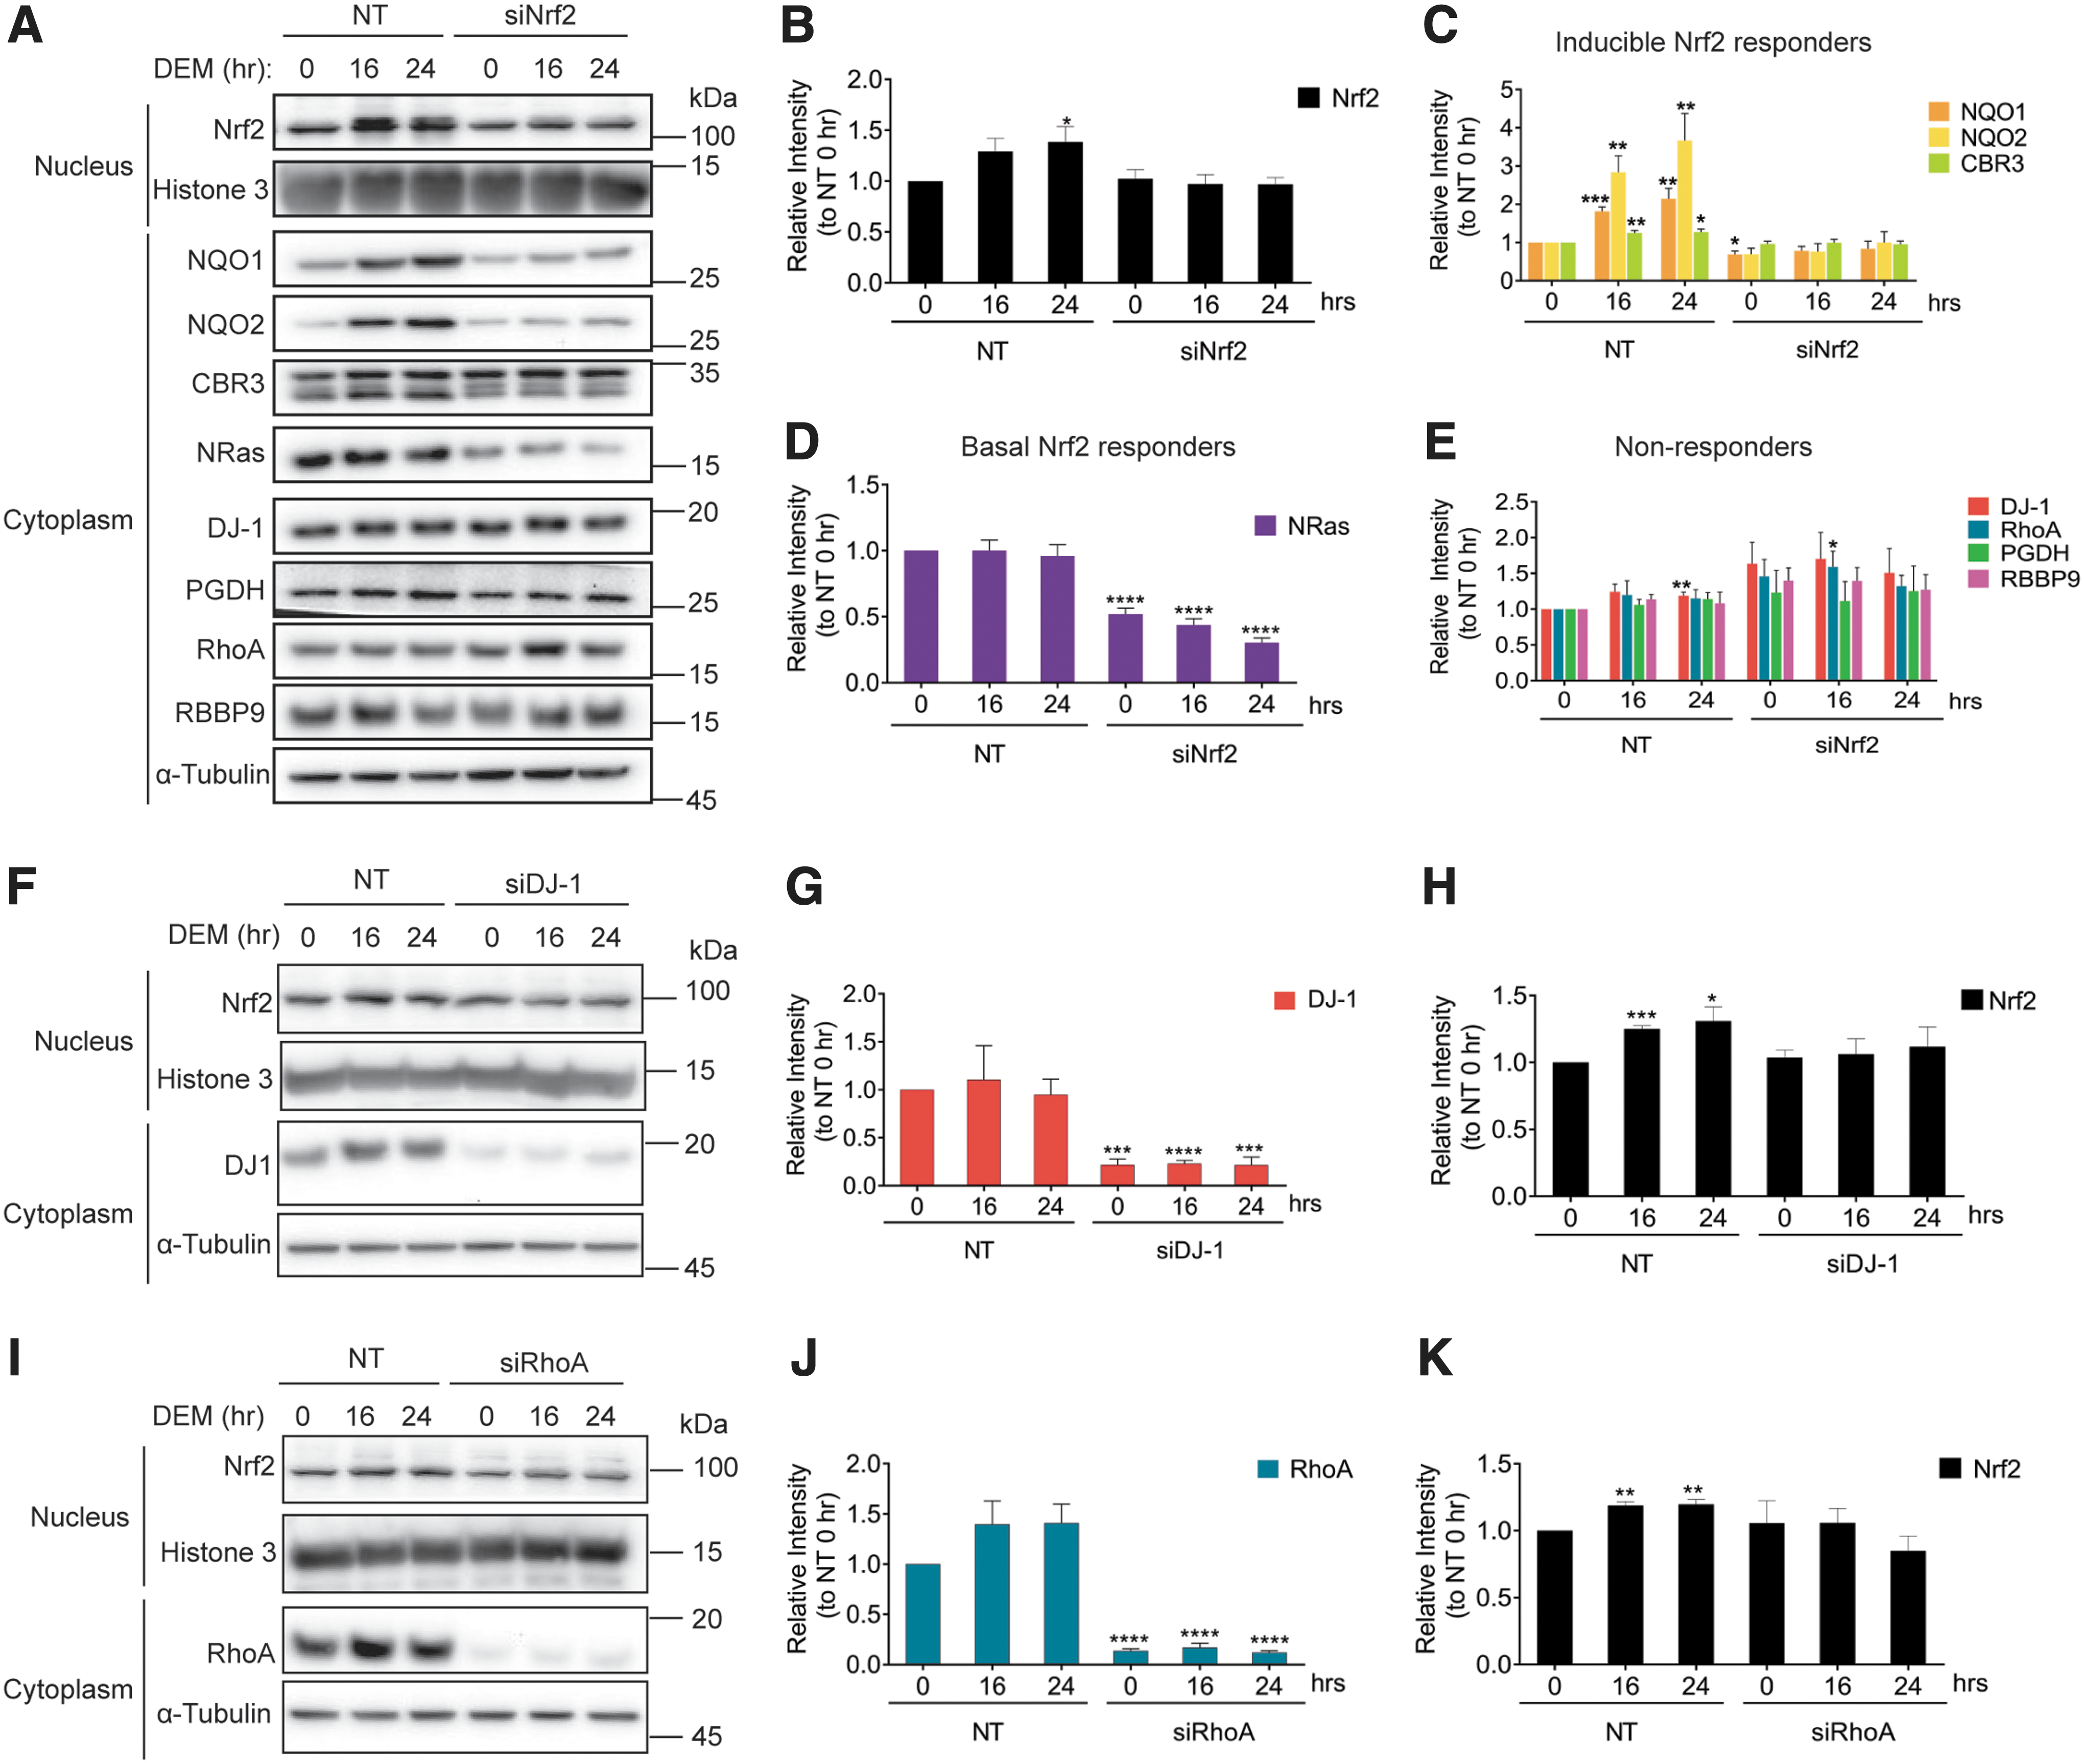
The CCRs (along with DJ-1) that did not increase during oxidative stress, or decrease when Nrf2 was silenced, and are thus classified as nonresponders, were PGDH, RBBP9, and RhoA (Fig. 6E). Interestingly, the presence of DJ-1 and RhoA in this group adds additional significance to the tissue-wide expression data (Supplementary Fig. S1), which demonstrated that these two CCRs show the highest and most widespread protein expression levels of all the CCRs analyzed. Given that DJ-1 was shown to stabilize Nrf2 (47), there could be a correlation between widespread protein expression and Nrf2 stabilization. To determine if RhoA can stabilize the levels of Nrf2 in the same manner as DJ-1, we silenced these CCRs and monitored the levels of Nrf2 in the nucleus during oxidative stress. As expected, silencing of DJ-1 prevented an increase in Nrf2 in the nucleus during oxidative stress (Fig. 6F–H and Supplementary Figs. S9B and S10), in accordance with our previous results (47). Reducing the levels of RhoA also significantly weakened the response of Nrf2 to oxidative stress, preventing nuclear accumulation of Nrf2 (Fig. 6I–K and Supplementary Figs. S9C and S10). These results indicate that DJ-1 and RhoA act upstream of Nrf2 to stabilize its levels and ensure appropriate nuclear accumulation during oxidative stress, enabling the oxidative stress response to occur.
Discussion
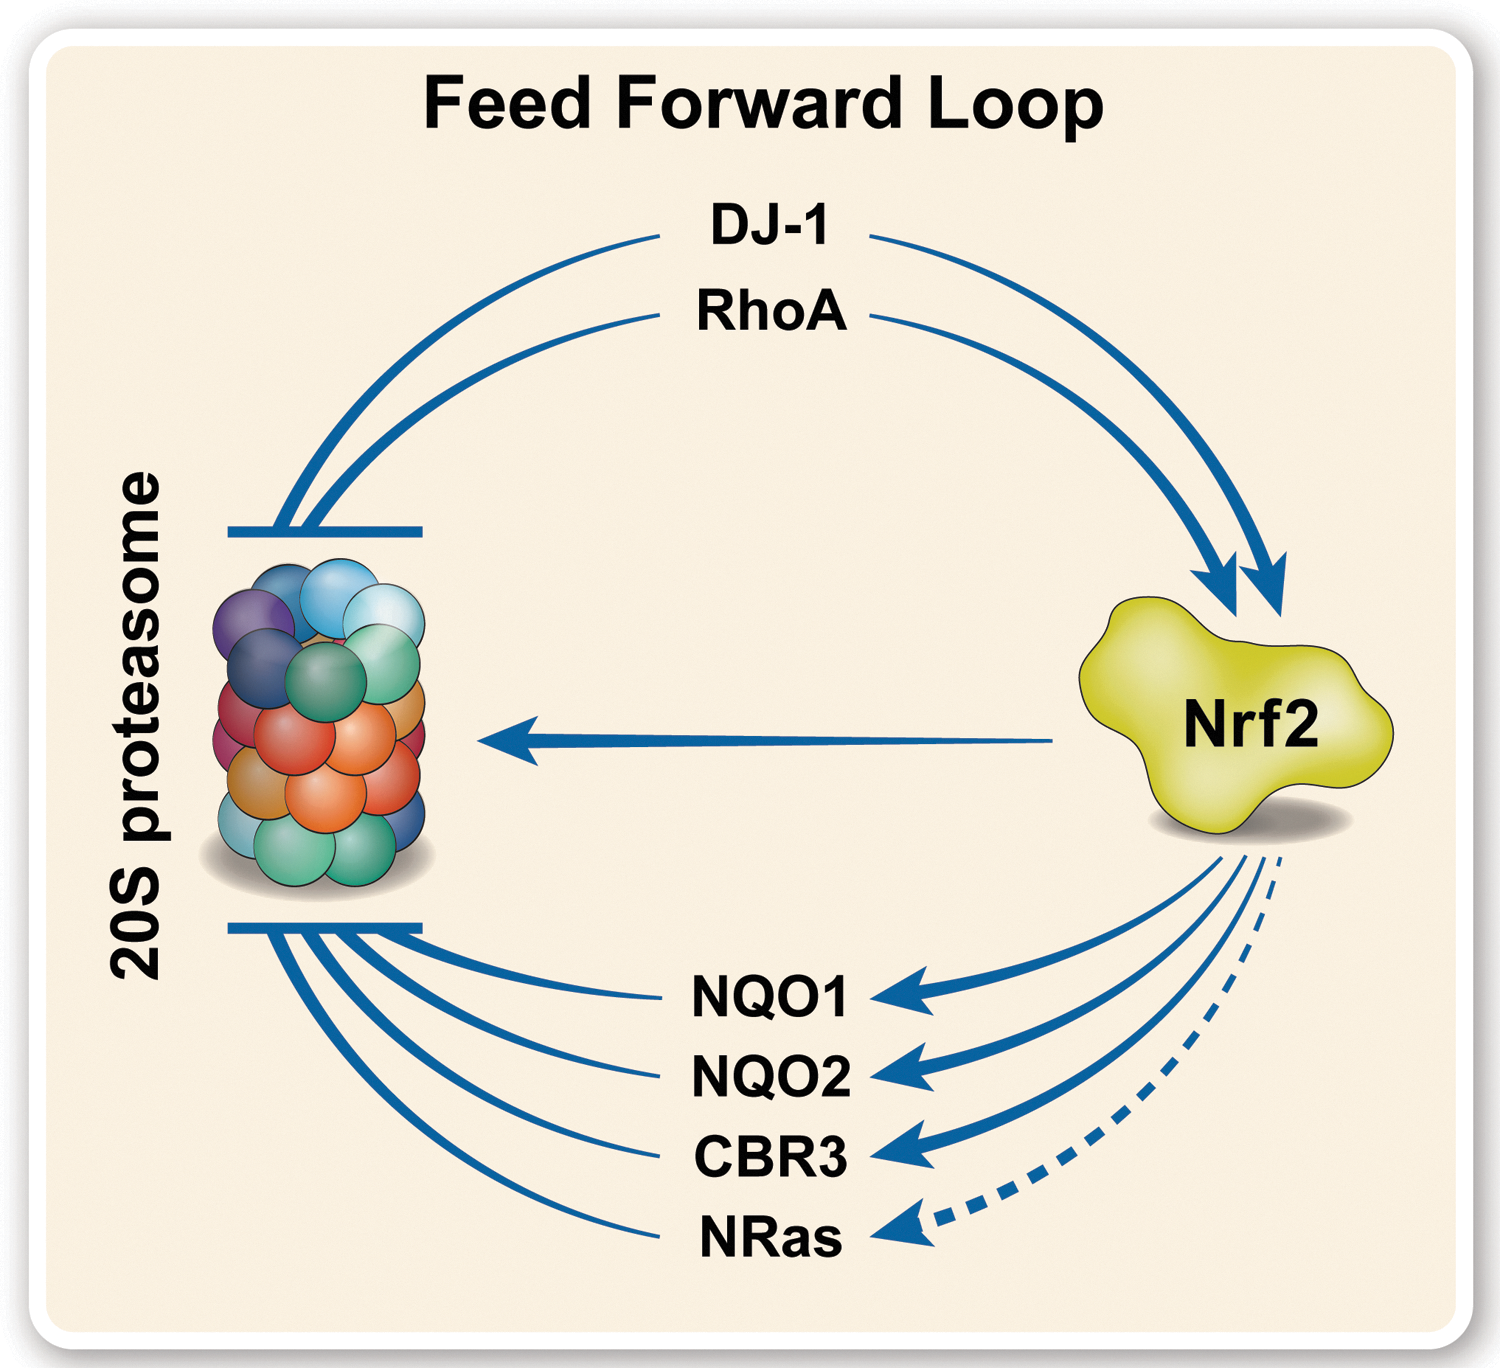
This study describes the discovery of a novel family of 20S proteasome regulators, the CCRs. We have demonstrated that a robust link exists between Nrf2 and the CCRs, specifically regulating the 20S proteasome by physically binding, and attenuating, substrate degradation. The expression of many of the CCRs is controlled by Nrf2, which in turn is itself stabilized by at least two members of the CCR family. Together, this creates a feed-forward loop of regulation (42), within which the 20S proteasome is upregulated by Nrf2 and simultaneously inhibited by the CCRs (Fig. 7). This enables a pulse of activity and rapid shutdown during the oxidative stress response, allowing degradation of damaged proteins while protecting the levels of important regulatory proteins and preventing proteasome clogging, to ensure recovery after the oxidative insult has subsided.
The members of the CCR family described in this study are greatly varied in their alternative functions beyond their moonlighting roles as 20S proteasome inhibitors. Multiple roles for DJ-1 have been described, such as DNA repair (52) and methylglyoxalate activity (67). NQO1 and NQO2 are both members of the quinone reductase family (20, 71), while other CCRs are involved in various metabolic pathways, such as carbonyl reduction (CBR3) (57), prostaglandin inactivation (PGDH) (63), and serine hydrolysis (RBBP9) (59). In addition, multiple members of the Ras superfamily, which are small GTPases involved in cell proliferation, morphology, signaling, transport, and so on (29), are represented in the CCRs. In addition to those CCRs that were analyzed in this study, there are other candidates that still need to be explored (Table 1). These include more members of the Ras superfamily, electron transfer flavoprotein B, the β subunit of the electron transfer flavoprotein complex in the mitochondria, known to generate free radicals and therefore contribute to oxidative stress (53), and phosphoglycerate mutase 1, an enzyme in the glycolytic pathway (10). The varying roles of the CCRs, along with the ability to inhibit the 20S proteasome, suggest that the dual functionality of these proteins may be important for focused inhibition of the 20S proteasome in association with specific metabolic or signaling pathways, in a spatiotemporal manner. In support of this hypothesis, research has shown that RBBP9 is located in the extranuclear compartment (59), CBR3 and NQO2 are cytoplasmic (43, 71), RhoA is associated with the cytoskeleton, and NRas, KRas, and HRas shuttle between the cytoplasmic membrane and the cytosol depending on their nucleotide state (29). It has been shown that the free, constitutive 20S proteasome also localizes to different cellular compartments (6, 9, 23), and therefore, the presence of location-specific regulators may be vital to ensure that 20S proteasomal degradation occurs at an appropriate pace and on the necessary substrates in each location in the cell.
Many of the CCRs are also associated with mutation- or expression-driven pathologies, such as neurodegenerative disease and various cancers. For example, missense mutations in DJ-1 are known to cause early-onset Parkinson's disease (16, 35), and intriguingly, one of these mutants was shown to be able to inhibit the 20S proteasome more effectively than wild-type DJ-1 (5). Mutations in NQO1 have been correlated with an increased risk of Alzheimer's disease (7, 68), while changes in PGDH expression have been linked to tumor growth in multiple cancers (64, 73), as well as late-stage neurodegenerative disease (44). Preliminary links have been found between changes in RBBP9 levels and ALS progression (39) as well as pancreatic cancer (59). RhoA overexpression is associated with cancer progression (75), and the Ras family of proteins is famously associated with numerous oncogenetic mutations, leading to constitutively activated Ras proteins that drive the development and growth of multiple cancers (33). Moreover, many cancers and neurodegenerative diseases are also associated with oxidative stress (36, 51), and as described here, most of the CCRs analyzed are involved in the oxidative stress response. It is therefore tempting to speculate that given the dual roles of these moonlighting proteins, mutations or changes in their expression may also affect their ability to inhibit the 20S proteasome and participate in the oxidative stress response, thus leading to imbalances in the levels of 20S proteasome substrates, compounding the negative effects on the cell.
The discovery of the CCR family was based on the presence of a Rossmann fold and the conserved N-terminal sequence motif found across NQO1 and DJ-1 homologues (Fig. 3). Considering that Rossmann folds are one of the most common structural motifs found in proteins (32), it is likely that many more proteins exist that share these features, but whose structures are yet to be elucidated. In addition, the Rossmann fold is one of the most ancient protein folds, found even in ancient organisms such as archaea (40). The conservation of function of the CCRs in regulating the 20S proteasome from archaea (Fig. 2 and Supplementary Fig. S5) indicates that this regulatory interaction may have evolved early in evolution, possibly even before the evolution of the 26S proteasome pathway, demonstrating the importance of modulating the degradation of proteins by the 20S proteasome. Therefore, the CCR family may actually contain many more members than those described here, making the regulatory network of the 20S proteasome far more wide reaching than currently thought. Future research into the CCRs analyzed in this study, and the potential discovery of more members of this family, will be critical for mapping the global network of proteasome regulators, as well as for elucidating the exact mechanistic details of 20S proteasome regulation.
The clinical success of proteasome inhibitors, such as bortezomib for the treatment of multiple myeloma and mantle cell lymphoma, is testament to the potential of the proteasome pathways as drug targets (69). However, the inability of these proteasome inhibitors to distinguish between the 26S and 20S proteasomes, which as described here display different functions and are regulated by different mechanisms, has been a drawback of these therapies, leading to unwanted and deleterious side effects (27). As such, exploiting this novel 20S proteasome-specific regulation, possibly via a conserved mechanism shared by the CCRs, could open avenues for the development of novel 20S proteasome-specific inhibitors to treat diseases of proteasome dysfunction.
Materials and Methods
Cell lines
HEK293T cells stably expressing the β4 subunit of the proteasome tagged with a C-terminal FLAG tag were obtained from Chaim Kahana (Weizmann Institute of Science). Wild-type HEK293T cells were obtained from Eitan Reuveny (Weizmann Institute of Science). The mouse fibroblast cell line A31N-ts20 BALB/c and human mammary epithelial MCF10A cells were obtained from Yosef Shaul (Weizmann Institute of Science).
HEK293T and A31N-ts20 BALB/c cells were maintained in Dulbecco's modified Eagle's medium (Sigma) supplemented with 10% fetal bovine serum (Gibco), 100 U/mL penicillin/100 μg/mL streptomycin (Biological Industries), 0.1 mM sodium pyruvate (Biological Industries), modified Eagle's medium-Eagle nonessential amino acids (Biological Industries), and MycoZap Prophylactic (Lonza) according to the manufacturer's instructions. β4-FLAG HEK293T cells were additionally supplemented with 1 mg/mL puromycin. MCF10A cells were maintained in Dulbecco's modified Eagle's medium/nutrient mixture F-12 Ham (Sigma) (of note, this medium contains high levels of sodium pyruvate that neutralize externally added H2O2) supplemented with 5% donor horse serum (Gibco), 20 ng/mL epidermal growth factor (Sigma), 10 μg/mL insulin (Sigma), 0.5 μg/mL hydrocortisone (Sigma), 100 ng/mL cholera toxin (Sigma), 100 U/mL penicillin/100 μg/mL streptomycin (Biological Industries), and 2 mM
Microbe strains
The DH5α strain of Escherichia coli was used for all plasmid cloning experiments. The BL21(DE3) strain of E. coli was used for all recombinant protein expression experiments.
Organisms as source for materials used in experiments
The Saccharomyces cerevisiae strain RJD1144, generated in the laboratory of Raymond Deshaies, Caltech (CA), which contains a chromosomally FLAG-tagged β4 (PRE1) subunit was used for the purification of yeast 20S proteasome.
The Rattus norvegicus strain RCS was used as a source of liver for the purification of the mammalian 20S proteasome.
Bioinformatic analyses
Sequences of DJ-1 and NQO1 homologues from multiple species were acquired from UniProtKB. MSAs were performed using Clustal Omega, figures were generated using ESPript (
Plasmids and cloning
The following plasmids were acquired from Addgene: pT7-7 α-syn WT (#36046), pNIC28-Bsa4 CBR3 (#38800), pET28-MHL NRASA (#25256, containing truncated NRas amino acids 1–172), pET28-MHL KRASB (#25153, containing truncated KRas amino acids 1–169, and Q61H mutation), pGEX2T-HRas (#55653), and pNIC28-Bsa4 RhoA (#73231, containing truncated RhoA amino acids 1–184). pGEM-T NQO2 (HG14634-G) was acquired from Sino Biological. Modifications made to the plasmids are as follows: pGEX2T-HRas was used as a template to amplify truncated HRas (amino acids 1–172) using the primer pair: forward 5′ AACCTGTACTTCCAGGGTACCATGACAGAATACAAGCTTGTG and reverse 5′ CTCGAGTGCGGCCGCAAGCTTTCAGTTCAGTTTCCGCAAT. The amplified product was inserted into the pET28 plasmid using Infusion, introducing an N-terminal 6xHis tag and TEV cleavage site. pET28-MHL KRASB was used as a template to reverse the Q61H mutation, using the primer pair: forward 5′ CAGCAGGTCAGGAGGAGTACA and reverse 5′ TGTCGAGAATATCCAAGAGAC. pGEM-T NQO2 was used as a template to amplify NQO2 using the primer pair: forward 5′ AACCTGTACTTCCAGGGTACCATGGCAGGTAAGAAAGTACTCA and reverse 5′ CTCGAGTGCGGCCGCAAGCTTTCATTGCCCGAAGTGC. The amplified product was inserted into the pET28 plasmid using Infusion, introducing an N-terminal 6xHis tag and TEV cleavage site.
Total RNA was extracted from HEK293T cells using NucleoZOL (Macherey-Nagel) according to the manufacturer's instructions. cDNA was synthesized using ProtoScript II Reverse Transcriptase (NEB) and d(T)20 oligonucleotide according to the manufacturer's instructions. RBBP9 and PGDH were amplified from the cDNA using the primer pairs: RBBP9: forward 5′ AACCTGTACTTCCAGGGTACCATGGCTTCTCCTAGCAAGGCA and reverse 5′ CTCGAGTGCGGCCGCAAGCTTCTATGCTGGTACTTTCAGCAA; and PGDH: forward 5′ AACCTGTACTTCCAGGGTACCATGCACGTGAACGGCAAAGTG and reverse 5′ CTCGAGTGCGGCCGCAAGCTTTCATTGGGTTTTTGCTTGAAATGGA. The amplified products were cloned into pET28 to introduce a C-terminal 6xHis tag.
The pCDF1 expression plasmid, used for mammalian cell transfection, was loaded with the following inserts amplified with their respective primer pairs: NQO2: forward 5′ GGGCGCGCCGGATCCATGGCAGGTAAGAAAGTACTCATTG and reverse 5′ CGCGGCCGCGAATTCTCATTGCCCGAAGTGCCAG; NQO2-HA: forward as for NQO2 and reverse 5′ TCGCGGCCGCGAATTCTCACGCATAGTCAGGAACATCGTATGGGTAACCTCCTTGCCCGAAGTGCCAGTGGGC; CBR3: forward 5′ GGGCGCGCCGGATCCATGTCGTCCTGCAGCCGC and reverse 5′ CGCGGCCGCGAATTCTCACCAGTTTTGCACAACTTTG; PGDH: forward 5′ GGGCGCGCCGGATCCATGCACGTGAACGGCAAAGTG and reverse 5′ CGCGGCCGCGAATTCTCATTGGGTTTTTGCTTGAAATGG; PGDH-HA: forward as for PGDH and reverse 5′ TCGCGGCCGCGAATTCTCACGCATAGTCAGGAACATCGTATGGGTAACCTCCTTGGGTTTTTGCTTGAAATGGAGTTG; NRas-HA: forward 5′ GAGCCCGGGCGCGCCGGATCCGCCACCATGACTGAGTACAAACTGGTG and reverse 5′ TCGCGGCCGCGAATTCTCACGCATAGTCAGGAACATCGTATGGGTAACCTCCGTTGAGTTTTTTCATTCGGTACTGG; and RhoA-HA: forward 5′ CGGGCGCGCCGGATCCATGGCTGCCATCCGGAAG and reverse 5′ TCGCGGCCGCGAATTCTCACGCATAGTCAGGAACATCGTATGGGTAACCTCCCCCACGTCTAGCTTGCAGAGC. Empty pCDF1 and pCFD1-GFP were obtained from Yardena Samuels (Weizmann Institute of Science).
Protein expression and purification
Purification of substrates α-syn and OxCaM
BL21(DE3) was transformed with pT7-7 α-syn WT. Cells were grown in LB medium supplemented with 100 μg/mL ampicillin at 37°C until they reached OD600 0.8. Protein expression was induced by the addition of 1 mM isopropyl-β-
Calmodulin was purchased from Sigma as a lyophilized powder (P1431) and oxidized to produce OxCaM as previously described (25) with the following modification: instead of 50 mM HOMOPIPES pH 5, 50 mM HEPES pH 7.5 was used.
Purification of human DJ1 and yeast DJ-1 (Hsp32)
DJ-1 and Hsp32 were expressed and purified as previously described (47). BL21(DE3) was transformed with pET-15b-hDJ-1 or pET28-Hsp32. Cells were grown in LB medium supplemented with 100 μg/mL ampicillin or 50 μg/mL kanamycin, respectively, at 37°C until they reached OD600 0.45. Protein expression was induced by the addition of 0.4 mM IPTG for 2.5 h. Cells were harvested by centrifugation at 5000 g for 10 min, and resuspended in 50 mL of 50 mM Tris-HCl pH 7.4, 2 mM EDTA, 1 mM DTT, 1 mM PMSF, and a protease inhibitor cocktail (Complete; Roche). Cells were lysed in a French Press, centrifuged for 10 min at 5000 g and the lysate was passed through a Source-15Q anion exchange 55 mL column (GE Healthcare) pre-equilibrated with 50 mM Tris-HCl pH 7.4, 1 mM DTT. After lysate loading, proteins were eluted with 200 mL of 50 mM Tris-HCl pH 7.4, 1 mM DTT. Fifty milliliter fractions were collected and DJ-1/Hsp32-containing fractions (eluted after 150–200 mL) were concentrated using a 3-kDa Amicon Ultra column (Millipore). Concentrated DJ-1/Hsp32 was loaded onto a gel filtration column (Superdex 200, 10/300 GL; GE Healthcare), pre-equilibrated with 50 mM Tris-HCl pH 7.4, 300 mM NaCl, and 1 mM DTT. DJ-1/Hsp32-containing fractions were combined, concentrated, frozen in liquid nitrogen, and stored at 80°C.
Purification of archaea DJ-1
The BL21 (DE3) was transformed with pET28-taDJ-1. Cells were grown at 37°C to an OD600 of 0.5 in 100 mL LB medium supplemented with 50 μg/mL kanamycin. Protein expression was induced by the addition of 0.5 mM IPTG for 7 h at 37°C, and then, the cells were moved to 16°C for overnight protein expression. Cells were harvested by centrifugation for 20 min at 5000 g and resuspended in 50 mM Tris-HCl pH 7.5, 50 mM NaCl, 20 mM imidazole, 250 U benzonase (Millipore), 1 mM PMSF. Cells were lysed by sonication and the lysate was centrifuged for 30 min at 40,000 g. The supernatant was loaded onto a HisTrap FF 5 mL column (GE Healthcare) pre-equilibrated with 50 mM Tris-HCl, 50 mM NaCl, and 20 mM imidazole. After lysate loading, protein was eluted with 0%–100% gradient elution buffer (50 mM Tris-HCl pH 7.5, 300 mM NaCl, and 500 mM imidazole). taDJ-1 containing fractions were pooled and dialyzed with TEV protease against 50 mM Tris pH 7.4, 1 mM EDTA, and 2 mM DTT. Following the overnight TEV cleavage, the taDJ-1 was loaded on HisTrap FF 5 mL, and flow through fraction was collected, concentrated, frozen in liquid nitrogen, and stored at −80°C.
Purification of NQO2
BL21(DE3) was transformed with the pET28-NQO1 or pET28-NQO2. Cells were grown in LB medium supplemented with 50 μg/mL kanamycin at 37°C until they reached OD600 0.45. Protein expression was induced by the addition of 0.4 mM IPTG for 2.5 h. Cells were harvested by centrifugation and lysed by sonication in 50 mM Tris-HCl (pH 7.5), 150 mM NaCl, and 1 mM PMSF. Cellular debris was removed by sonication, and the supernatant was passed over a HisTrap FF column (GE Healthcare). His-TEV-NQO1 or His-TEV-NQO2 was eluted over a gradient up to 400 mM imidazole. Fractions containing the proteins were pooled and TEV protease was added. The sample was incubated at room temperature for 4 h, followed by overnight dialysis against 50 mM Tris-HCl (pH 7.5) 150 mM NaCl. The dialyzed protein was passed over a HisTrap FF column to remove the TEV protease and any uncleaved protein. The flow-through was collected and concentrated using a 10 kDa Amicon Ultra column (Millipore), and loaded onto a gel filtration column (Superdex 200, 10/300 GL; GE Healthcare) pre-equilibrated with 20 mM Tris-HCl (pH 7.4), 50 mM NaCl. NQO1 or NQO2 containing fractions were pooled, concentrated, frozen in liquid N2, and stored at −80°C.
Purification of CBR3
BL21(DE3) was transformed with pNIC28Bsa4-CBR3. Cells were grown in LB medium supplemented with 50 μg/mL kanamycin at 37°C until they reached OD600 0.6. Protein expression was induced by the addition of 1 mM IPTG for 3 h. Cells were harvested by centrifugation at 5000 g for 10 min, and resuspended in 20 mM sodium dihydrogen phosphate pH 7.4, 20 mM imidazole, 150 mM NaCl, 0.26 mM PMSF, 1 mM benzamidine, and 1.4 μg/mL pepstatin. Cells were disrupted by the addition of 1 mg/mL lysozyme followed by rolling at 4°C for 30 min, and sonication (40% amp, 30-s pulses for 7.5 min). The lysed cells were centrifuged at 18,000 rpm for 45 min at 4°C to remove cellular debris. The supernatant was applied to a HisTrapHP column pre-equilibrated in 20 mM sodium dihydrogen phosphate pH 7.4, 20 mM imidazole, and 150 mM NaCl. His-TEV-CBR3 was eluted with a linear gradient to 400 mM imidazole over 40 mL. Fractions containing His-TEV-CBR3 were pooled and incubated at room temperature for 3 h with TEV protease. The cleaved sample was dialyzed overnight against 20 mM sodium dihydrogen phosphate pH 7.4, 150 mM NaCl, and then reapplied to a HisTrapHP column to remove uncleaved protein and TEV protease. The flow-through was collected, concentrated using a 10 kDa Amicon Ultra column (Millipore), and loaded onto a gel filtration column (Superdex 200, 10/300 GL; GE Healthcare) pre-equilibrated with 20 mM sodium dihydrogen phosphate pH 7.4, and 50 mM NaCl. CBR3 containing fractions were pooled, concentrated, frozen in liquid N2, and stored at −80°C.
Purification of PGDH and RBBP9
BL21(DE3) was transformed with pET28-PGDH or pET28-RBBP9 with a C-terminal 6xHis tag. Proteins were purified as for CBR3 with the following changes. After elution from the first HisTrapHP column, fractions containing PGDH-His or RBBP9-His were concentrated and loaded onto a gel filtration column (Superdex 200, 10/300 GL; GE Healthcare) pre-equilibrated with 20 mM sodium dihydrogen phosphate pH 7.4, and 50 mM NaCl. Fractions containing PGDH-His or RBBP9-His were pooled, concentrated, frozen in liquid N2, and stored at −80°C.
Purification of NRas, KRas, HRas, and RhoA
BL21(DE3) transformed with pET28-MHL NRASA, pET28-MHL KRASB (H61), pET28-HRas, or pNIC28-Bsa4 RhoA was induced and purified as for CBR3 with the following changes. Cells were resuspended in 20 mM Tris-HCl pH 7.4, 20 mM imidazole, 150 mM NaCl, 0.26 mM PMSF, 1 mM benzamidine, and 1 μg/mL pepstatin. TEV cleaved proteins were dialyzed against 20 mM Tris pH 7.4, and 150 mM NaCl. The Superdex 200 10/300 GL gel filtration column was pre-equilibrated in 20 mM Tris pH 7.4, and 50 mM NaCl.
Purification of mammalian 20S proteasomes
Purification of the rat 20S proteasome was performed as described previously (47). In brief, rat livers were homogenized in buffer containing 20 mM Tris-HCl pH 7.5, 1 mM EDTA, 1 mM DTT, and 250 mM sucrose. The extract was subjected to centrifugation at 1000 g for 15 min. The supernatant was then diluted to 400 mL to a final concentration of 0.5 M NaCl and 1 mM DTT and subjected to ultracentrifugation for 2.2 h at 145,000 g. The supernatant was centrifuged again at 150,000 g for 6 h. The pellet containing the proteasomes was resuspended in 20 mM Tris-HCl pH 7.5 and loaded onto 1.8 L Sepharose 4B resin. Fractions containing the 20S proteasome were identified by their ability to hydrolyze the fluorogenic peptide suc-LLVY-AMC, in the presence of 0.02% sodium dodecyl sulfate (SDS). Proteasome-containing fractions were then combined and loaded onto four successive anion exchange columns: Source Q15, HiTrap, DEAE FF, and Mono Q 5/50 GL (GE Healthcare). Elution was performed with a 0- to 1-M NaCl gradient. Active fractions were combined, and buffer exchanged to 10 mM phosphate buffer pH 7.4 containing 10 mM MgCl2 using 10 kDa Vivaspin 20 mL columns (GE Healthcare). Samples were then loaded onto a CHT ceramic hydroxyapatite column (Bio-Rad Laboratories, Inc.); a linear gradient of 10–400 mM phosphate buffer was used for elution. The purified 20S proteasomes were analyzed by SDS–polyacrylamide gel electrophoresis (SDS–PAGE), activity assays, and MS analysis.
Purification of yeast 20S proteasomes
S. cerevisiae expressing FLAG-tagged 20S proteasome (Pre1) was grown in 4 × 700 mL YPD medium overnight at 30°C. Cells were harvested at 5000 g for 20 min, and the pellets rinsed in 10 mL water and centrifuged again at 5000 g for 20 min. The pellet was resuspended in 100 mL lysis buffer containing 50 mM Tris-HCl pH 7.5, 150 mM NaCl, 10% glycerol, 5 mM MgCl2, 1 mM PMSF, protease inhibitor cocktail (Complete; Roche), and 250 U benzonase (Millipore). Cells were lysed using a glass bead beater and prechilled with 50% glycerol and dry ice, with 1-min pulses for 7 min in total. The lysed cells were separated from the glass beads and centrifuged at 35,000 g for 20 min at 4°C to remove cell debris. The supernatant was collected, incubated with 2 mL anti-FLAG M2 affinity gel (Sigma), and prerinsed with sequential washes of lysis buffer, glycine pH 3.5, and lysis buffer, for 1.5 h at 4°C while gently rotating. The beads were collected, washed sequentially with lysis buffer containing 0.2% NP40, lysis buffer, and lysis buffer containing 500 mM NaCl. The last wash was incubated on the beads for 1 h at 4°C, followed by a final wash in lysis buffer. 20S proteasomes were eluted using 500 mg/mL FLAG peptide in lysis buffer containing 15% glycerol.
Purification of archaea 20S proteasomes
The α and β subunits of Thermoplasma acidophilum 20S proteasome were expressed as separate fusion proteins with a TEV-cleavable His tag (α) or with NusA-His tag (β) in BL21 (DE3) cells. Expression of both subunits was induced with the addition of 1 mM IPTG, 37°C for 3 h (α) or for 5 h (β) at 37°C. Cells were collected by centrifugation at 5000 g for 20 min. Cells were lysed by sonication in 50 mM sodium phosphate buffer pH 8.0, supplemented with protease inhibitors (0.5 mM benzamidine, 0.1 mg/mL pepstatin A, and 0.1 μM PMSF), 0.88 mg/mL lysozyme, and 250 U benzonase (Millipore). After centrifugation at 40,000 g for 30 min, the supernatant was loaded onto a HisTrap FF (GE Healthcare) pre-equilibrated in 50 mM sodium phosphate buffer pH 8.0, 200 mM NaCl, and 10 mM imidazole. The α and β subunits were eluted in 100 mM sodium phosphate buffer pH 7.8, and 300 mM imidazole. The fractions containing the fusion protein were pooled and dialyzed overnight with TEV protease against 50 mM Tris pH 7.4, 1 mM EDTA, and 2 mM DTT. Following the overnight TEV cleavage, the α and β subunits were loaded onto a HisTrap FF column and flow-through fractions were collected. The full proteasome (α7β7β7α7) was assembled by mixing a slight molar excess of α subunit over β subunit, and incubated at 37°C for 6 h. The mixture was then concentrated to 0.5 mL and incubated overnight at 37°C. The assembled 20S proteasome complex was loaded onto a Superdex 200 10/300 GL (GE Healthcare) pre-equilibrated in 50 mM sodium phosphate buffer pH 7.5, and 200 mM NaCl.
Proteasome degradation assays
To monitor the ability of proteins to regulate the activity of the 20S proteasome in vitro, 10 μM of the CCRs or MG132 was preincubated with 0.1 μM of the 20S proteasome for 30 min on ice in 50 mM HEPES pH 7.5. To initiate the assay, α-syn was added to 1 μM, and the reaction mixtures were incubated at 37°C. For experiments using yeast or archaea 20S proteasomes, the experiments were performed at 25°C. Ten-microliter samples were taken every 30 min for 120 min, quenched by the addition of reducing sample buffer and snap frozen in liquid N2. After all time points were collected, the samples were thawed, boiled for 5 min, and loaded onto a 15% SDS-PAGE gel. Gels were stained with Coomassie brilliant blue, and changes in the level of α-syn were quantified by band densitometry using ImageJ, normalized to T0, and plotted using GraphPad Prism.
Degradation assays using OxCaM were performed in the same way with minor modifications. OxCaM was added to a final concentration of 2.5 μM, and time points were collected every hour for 4 h. Assays performed with RBBP9, NRas, KRas, HRas, and RhoA were analyzed by Western blot with the anti-calmodulin antibody, due to these CCRs being the same size as OxCaM.
Proteasome activity assays
Proteasome activity assays were performed as previously described (47). In brief, between 0.1 and 0.3 μM, 20S proteasomes were incubated either alone or with 10 μM MG132 or CCRs in 25 mM HEPES pH 7.5 for 30 min on ice. Four microliters of the mixture was combined with 40 μL 25 mM HEPES pH 7.5 containing 100 μM Suc-LLVY-AMC and 0.02% SDS. Samples were incubated at 30°C for 30 min in the dark. To stop the reaction, 200 μL of 1% SDS was added to the mixture. The fluorescence of hydrolyzed AMC groups was measured with a microplate reader (Infinite 200; Tecan Group), using an excitation filter of 380 nm and an emission filter of 460 nm.
Native mass spectrometry analysis
Nanoflow electrospray ionization MS and tandem MS experiments were conducted under nondenaturing conditions on a Q-Exactive Plus Orbitrap EMR (Thermo Fisher Scientific). Before MS analysis, 20 μL of up to 100 mM sample was buffer exchanged into 0.5–1 M ammonium acetate pH 7.5, using Bio-Spin columns (Bio-Rad). Assays were performed in positive ion mode and conditions were optimized to enable the ionization and removal of adducts, without disrupting the noncovalent interactions of the proteins tested. In MS/MS experiments, the relevant m/z values were isolated and argon gas was admitted to the collision cell. Spectra are shown without smoothing or background subtraction. Typically, aliquots of 2 μL of sample were electrosprayed from gold-coated borosilicate capillaries prepared in-house. The following experimental conditions were used on the Q-Exactive Plus Orbitrap EMR: capillary voltage 1.7 kV, MS spectra were recorded at low resolution (5000), and the high-energy collision dissociation (HCD) cell voltage was set to 20–50 V, at trapping gas pressure setting of 3.9. For MS/MS analyses, a wide isolation window of ±2000 m/z around the most intense charge state of the 20S proteasome (around 12,000 m/z) was set in the quadrupole, allowing the transmission of only high m/z species. Transmitted ions were subjected to collision-induced dissociation in the HCD cell, at an accelerating voltage of 200 V, and the trapping gas pressure was set to 1.5.
Immunoprecipitation
HEK293T cells stably expressing the FLAG-β4 proteasome subunit were plated in four 15-cm dishes, at a density of 1.5 × 10⁶ cells per dish. Each plate was transfected with 20 μg of pCDF1-NQO2-HA, pCDF1-PGDH-HA, pCDF1-NRas-HA, or pCDF1-RhoA-HA and grown for 48 h. Cells were collected by trypsinization, combined, washed in phosphate-buffered saline, and resuspended in 1 mL lysis buffer (20 mM HEPES pH 7.4, 10% glycerol, 10 mM NaCl, 3 mM MgCl2, and 1 mM ATP) and protease inhibitors (1 mM PMSF, 1 mM benzamidine, and 1.4 μg/mL pepstatin). Cells were incubated on ice for 15 min and homogenized in a glass-Teflon homogenizer for 40 strokes. Lysate was cleared by centrifugation at 18,000 g for 10 min at 4°C. For IP using anti-FLAG affinity gel, 1 mg protein was diluted in 500 μL lysis buffer. NaCl concentration was adjusted to 150 mM and rotated overnight at 4°C in the presence of 45 μL anti-FLAG M2 affinity gel (Sigma). The following morning, beads were washed three times with lysis buffer containing 150 mM NaCl and boiled in 55 μL reducing sample buffer. For IP using anti-HA or anti-Rpn2 antibodies, 1 mg protein was diluted in 500 μL lysis buffer. NaCl concentration was adjusted to 150 mM. Proteins were precleared using 40 μL of Protein G Sepharose (GE Healthcare), for 1 h at 4°C, at a gentle rotation. The beads were discarded and the lysate was rotated overnight at 4°C in the presence of 9 μL anti-HA rabbit (ab9110; Abcam) or 9 μL anti-Rpn2 (PSMD1, ab140682; Abcam) antibody. The following morning, 45 μL Protein G Sepharose beads (GE Healthcare) were added, and lysate was rotated for 2 h at 4°C. The beads were then washed three times in lysis buffer containing 150 mM NaCl and boiled in 55 μL protein sample buffer.
CCR overexpression
A31N-ts20 BALB/c cells were transfected by electroporation using an NEPA21 electroporator (Nepa Gene Co., Ichikawa-City, Japan). For electroporation, 2 × 10⁶ cells were mixed with 20 μg pCDF1 plasmid containing GFP, NQO2, CBR3, or PGDH, and transfected according to the manufacturer's instructions, using a poring pulse of 125 V for 5 ms. After electroporation, cells were cultured at 32°C for 24 h. The growth medium was then replaced and the cells returned to 32°C for 24 h. Cells were transferred to 39°C for 24 h, or left at 32°C as indicated. Seventy-two hours post-transfection, the cells were collected and lysed in modified RIPA buffer containing 50 mM HEPES pH 7.5, 150 mM NaCl, 1% NP-40, 0.25% Na-deoxycholate, 0.26 mM PMSF, 1 mM benzamidine, 1.4 μg/mL pepstatin, 4 mM Na-pyrophosphate, 4 mM β-glycerophosphate, and 5 mM Na-orthovanadate. Cellular debris was removed by centrifugation, and the supernatant was collected. Total protein concentration was estimated by Bradford assay. For Western blot analysis, 30 μg of total protein was loaded for each sample.
Silencing and oxidative stress experiments
The following siRNAs from Dharmacon (ON-TARGETplus SMARTpool) were used for silencing experiments: Nontargeting pool, Human NFE2L2 (Nrf2), Mouse NFE2L2, Human Park7 (DJ-1), Mouse Park7, Human RhoA, Mouse RhoA. MCF10A cells were transfected with human or mouse siRNAs, respectively, using jetPRIME transfection reagent (Polyplus) according to the manufacturer's instructions. After 24 h, the cells were divided into three plates, allowing for replacement of the cell media, prevention of growth beyond confluency, and preparation of plates for oxidative stress time points. Oxidative stress was induced by adding DEM (since H2O2 is neutralized by their specialized growth media) to a final concentration of 150 μM at 48 and 56 h post-transfection, allowing for DEM exposure of 24 and 16 h, respectively, before collecting the cells at 72 h post-transfection.
Cell fractionation
MCF10A cells from a 6-cm tissue culture dish were resuspended in 70 μL hypotonic buffer, containing 10 mM HEPES pH 7.4, 10 mM KCl, 1.5 mM MgCl2, 0.5% NP-40, 4 mM Na-pyrophosphate, 4 mM β-glycerophosphate, 5 mM Na-orthovanadate, 0.26 mM PMSF, 1 mM benzamidine, and 1.4 μg/mL pepstatin, and incubated on ice for 10 min. Five microliters of 10% NP-40 was added and cells were vortexed for 10 s. The cytosolic fraction was separated from the nuclei by centrifugation at 2500 rpm for 4 min and further clarified by centrifugation at 10,000 g for 10 min. The nuclear pellet was washed in 0.1 mL hypotonic buffer and nuclei were pelleted at 2500 rpm for 4 min. Nuclei were then resuspended in 35 μL hypertonic buffer, containing 20 mM HEPES pH 7.6, 100 mM NaCl, 300 mM sucrose, 3 mM MgCl2, 1 mM CaCl2, 0.5% TritonX-100, 0.26 mM PMSF, 1 mM benzamidine, and 1.4 μg/mL pepstatin, and incubated on ice for 3 min. The nucleoplasmic fraction was separated by centrifugation at 5000 g for 5 min. The pellet was resuspended in 28 μL hypertonic buffer and incubated at room temperature for 15 min with 1000 gel units of micrococcal nuclease (NEB). Chromatin-bound proteins were released from the DNA by addition of 7 μL of 1 M ammonium sulfate on ice for 5 min, followed by centrifugation at 5000 g for 5 min. Nucleoplasmic and chromatin-bound fractions were combined. Thirty micrograms of cytoplasmic and 20 μg total nuclear fractions were loaded onto 12% SDS-PAGE gels, followed by Western blot analysis.
Western blot
After separation of samples on SDS-PAGE, proteins were transferred to 0.45 μm immobilon-P PVDF membranes (Millipore) preactivated in methanol, in standard Tris-Glycine transfer buffer (pH 8.3) supplemented with 20% methanol for 2.5 h at 400 mA. Membranes were blocked in 5% skim milk powder in TBS-T for 1 h, followed by incubation with appropriate primary antibodies on an orbital shaker at 4°C overnight. Membranes were rinsed thoroughly in TBS-T, followed by incubation with appropriate secondary horseradish peroxidase (HRP)-conjugated antibodies for 1 h on an orbital shaker at room temperature. Membranes were rinsed thoroughly and developed using WesternBright ECL (Advansta) in myECL Imager (Thermo Scientific) according to the manufacturer's instructions.
Primary antibodies used for Western blots include anti-calmodulin (1:1000, ab105498; Abcam), anti-HA rabbit (1:6000, ab9110; Abcam), anti-HA mouse (1:1000, ab18181; Abcam), anti-PSMD1 (1:1000, ab2941; Abcam), anti-PSMA1 (1:1000, ab140499; Abcam), anti-FLAG (1:2500, F3165; Sigma), anti-GFP (1:2500, ab290; Abcam), anti-NQO2 (1:500, sc271665; Santa Cruz), anti-CBR3 (1:1000, 15619-1-AP; Proteintech), anti-PGDH (1:200, sc271418; Santa Cruz), anti-p53 HRP (1:2500, HAF1355; Biotest), anti-α-syn (1:500, ab51252; Abcam), anti-GAPDH (1:1000, MAB374; Millipore), anti-ubiquitin (1:1000, PW0930; Enzo), anti-p21 (1:1000, ab109199; Abcam), anti-α-tubulin (1:10,000, ab184613; Abcam), anti-Nrf2 (1:500, ab137500; Abcam), anti-histone H3 (1:1000, ab24834; Abcam), anti-NQO1 (1:1000, ab28947; Abcam), anti-NRas (1:200, sc31; Santa Cruz), anti-DJ-1 (1:10,000, ab76008; Abcam), anti-RhoA (1:200, sc418; Santa Cruz), and anti-RBBP9 (1:1000, 12230-2-AP; Proteintech).
Secondary antibodies used for Western blots include goat anti-mouse IgG-HRP (1:10,000, 115-035-003; Jackson) and goat anti-rabbit IgG-HRP (1:10,000, 111-035-003; Jackson).
Quantification and statistical analysis
Where indicated in the figure legends, at least three independent biological replicates were performed. The n number of experiments and the details of the statistical analysis are described in the figure legends. Student's t-tests were performed to measure statistical significance, which is defined as *p < 0.05, **p < 0.01, ***p < 0.001, and ****p < 0.0001. All error bars correspond to standard error of the mean as indicated in the figure legends. Statistical analysis was performed using GraphPad Prism.
Footnotes
Acknowledgments
We thank Sarel Fleishmann and Gideon Schreiber for helpful discussions. We thank Yardena Samuels for generously providing NRas antibodies and the pCDF1 plasmid, and for helpful discussions. We thank Yossi Shaul for generously providing MCF10A cells. We thank Ron Rotkopf and Maria Fuzesi-Levi for helpful insights and discussions.
Author Disclosure Statement
No competing financial interests exist.
Funding Information
We are also grateful for the support of a starting grant from the European Research Council (ERC) (Horizon 2020)/ERC grant agreement number 636752, and an Israel Science Foundation (ISF) grant 300/17. Maya A. Olshina is supported by a Deans Fellowship from the Faculty of Life Sciences, a Senior Postdoctoral Fellowship from the Koshland Fund, Weizmann Institute of Science, and a Postdoctoral Fellowship from the Israel Cancer Research Fund. Michal Sharon is an incumbent of the Aharon and Ephraim Katzir Memorial Professorial Chair.
Supplementary Material
Supplementary Table S1
Supplementary Figure S1
Supplementary Figure S2
Supplementary Figure S3
Supplementary Figure S4
Supplementary Figure S5
Supplementary Figure S6
Supplementary Figure S7
Supplementary Figure S8
Supplementary Figure S9
Supplementary Figure S10
Abbreviations Used
References
Supplementary Material
Please find the following supplemental material available below.
For Open Access articles published under a Creative Commons License, all supplemental material carries the same license as the article it is associated with.
For non-Open Access articles published, all supplemental material carries a non-exclusive license, and permission requests for re-use of supplemental material or any part of supplemental material shall be sent directly to the copyright owner as specified in the copyright notice associated with the article.