
Abstract
Significance:
Proton-electron double-resonance imaging (PEDRI) employs electron paramagnetic resonance irradiation with low-field magnetic resonance imaging so that the electron spin polarization is transferred to nearby protons, resulting in higher signals. PEDRI provides information about free radical distribution and, indirectly, about the local microenvironment such as partial pressure of oxygen (pO2), tissue permeability, redox status, and acid-base balance.
Recent Advances:
Local acid-base balance can be imaged by exploiting the different resonance frequency of radical probes between R and RH+ forms. Redox status can also be imaged by using the loss of radical-related signal after reduction. These methods require optimized radical probes and pulse sequences.
Critical Issues:
High-power radio frequency irradiation is needed for optimum signal enhancement, which may be harmful to living tissue by unwanted heat deposition. Free radical probes differ depending on the purpose of PEDRI. Some probes are less effective for enhancing signal than others, which can reduce image quality. It is so far not possible to image endogenous radicals by PEDRI because low concentrations and broad line widths of the radicals lead to negligible signal enhancement.
Future Directions:
PEDRI has similarities with electron paramagnetic resonance imaging (EPRI) because both techniques observe the EPR signal, directly in the case of EPRI and indirectly with PEDRI. PEDRI provides information that is vital to research on homeostasis, development of diseases, or treatment responses in vivo. It is expected that the development of new EPR techniques will give insights into novel PEDRI applications and vice versa. Antioxid. Redox Signal. 28, 1345–1364.
Introduction:
P
Historical Background
DNP of nuclear spin states was predicted by Albert Overhauser in 1953 (100), a technique that became known as the Overhauser effect. In the theory, saturating the electron spin resonance of a paramagnetic species will significantly enhance the polarization of surrounding nuclear spins. This prediction was confirmed by Carver and Slichter in 1956 who had been researching the electron spin resonance of lithium (20). In the process of experimental verification of the Overhauser effect, they concluded that the effect could be observed in any system in which the nuclear relaxation was dominated by a coupling to electrons in which the nuclear spin flip requires a simultaneous electron flip. To further verify these conclusions, they successfully performed experiments on systems of 7Li, 23Na, and even 1H (20). The Nuclear Overhauser Effect (NOE) is an extension of the Overhauser effect explained with experimental observation by Kaiser in 1962, demonstrating polarization transfer from one population of nuclear spins to another via cross relaxation (65). The NOE is utilized in the field of NMR spectroscopy, including its use to determine the three-dimensional structure of complex molecules. Here, we focus on the Overhauser effect where electron spin polarization is transferred to 1H polarization with subsequent MRI to reveal the localized concentration of free radicals.
The ability to image the distribution of paramagnetic solutions in vivo has many potential uses in biology and medicine. EPRI, which uses methods analogous to those employed in NMR imaging, has been developed with considerable effort (8, 9, 31, 38, 85). However, EPR was typically restricted to small samples (∼50 mm) because of the relatively large line widths (∼MHz) and the strong gradients necessary to achieve useful spatial resolution. Endogenous free radicals are present in small quantities and are often short-lived with a very low steady-state concentration. Therefore, it is necessary to introduce free radicals as “probes” into the living system that should be biocompatible, stable during the measurement, and nontoxic. Oxygen concentration in tissues can be deduced via its line-broadening effect on the EPR spectrum of injected free radical.
To image paramagnetic species such as injected free radicals in larger-sized biological systems and animals, Lurie et al. developed in 1988 an imaging technique that combines proton NMR imaging with the Overhauser effect, called PEDRI, which is also known as OMRI (79). The main difference between PEDRI and EPRI is that the enhanced proton signal is observed in PEDRI, whereas the electron signal from the free radical probe is observed directly in EPRI. Unlike EPRI, large sample sizes with higher resolution can be achieved in PEDRI because proton resonances are detected after enhancement by the Overhauser effect. The terms PEDRI and OMRI represent one and the same technique; throughout this article, we will use PEDRI.
Under appropriate conditions, EPR irradiation causes a transfer of polarization from the unpaired electrons to the proton nuclei of tissue water, increasing the intensity of the 1H NMR signal. The enhancement of the NMR signal can be described by the enhancement factor, E, given by:
where AZ and A0 are the NMR signals with and without EPR irradiation, respectively. The enhancement can be described by the following relationship:
where ρ is the coupling factor (−1 ≤ ρ ≤ 1/2, with ρ = 1/2 for dipole–dipole interactions), f is the leakage factor (0 ≤ f ≤ 1), s is the saturation factor (0 ≤ s ≤ 1), n is the number of hyperfine lines in the EPR spectrum (n = 3 for a typical nitroxide-free radical), and γe and γp are the electron and nuclear gyromagnetic ratios (for experiments involving protons, the ratio [γe/γp ≈ 659]). Equation [2] assumes that only one EPR resonance is irradiated at a time (81).
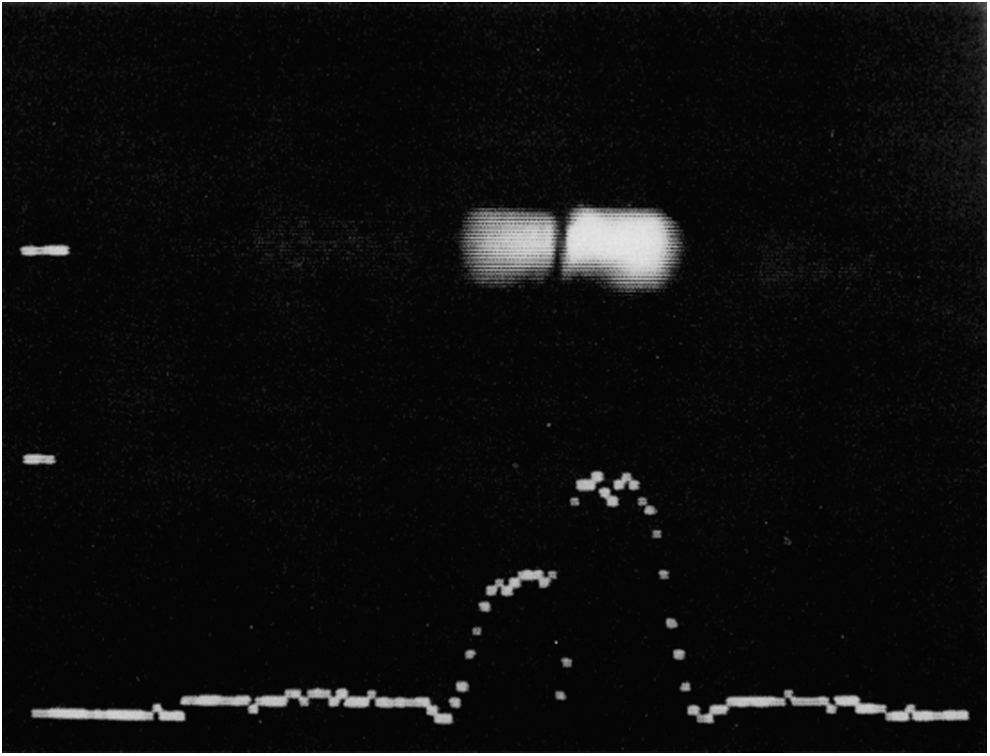
Figure 1 shows the capability of PEDRI to provide 1H images at low magnetic fields and to assess the influence of dissolved oxygen on the enhancement (79). Two identical phantom tubes were filled with 2.5 mM 4-hydroxy-2,2,6,6-tetramethylpiperidine-1-oxyl (TEMPOL) solution dissolved in water, one of which had been equilibrated with nitrogen by bubbling the gas through the phantom and the other with air. The nitrogen-equilibrated phantom exhibited a 40% greater enhancement than the air-equilibrated one with calculated enhancement factors of −6.9 (left) and −9.8 (right). This effect occurs because EPR resonances of spin labels are differentially broadened in the presence of dissolved oxygen (13, 46, 100, 117). A broad EPR line is more difficult to saturate; thus, the observed enhancement factor for a given magnetic field strength is reduced. PEDRI images have been obtained with TEMPOL concentrations as low as 0.3 mM, which is, nevertheless, more than three orders of magnitude higher than the concentration of intrinsic radicals (84).
Field Cycling
To make PEDRI applicable for in vivo experiments by avoiding excessive sample heating due to high power of EPR irradiation, field cycling (FC) was introduced in the pulse sequence of image acquisition, which greatly reduces the applied field strength during EPR irradiation (82). In FC-PEDRI, the magnetic field applied to the sample is changed throughout the experiment. Figure 2 shows the pulse sequence of FC-PEDRI. The EPR irradiation is applied at low magnetic field strength (at a correspondingly low frequency), during which the Overhauser polarization transfer alters the proton magnetization (Evolution Period). The magnetic field is then increased rapidly for the detection period, during which the NMR detection pulse(s) and magnetic field gradients are applied (Detection Period). Applying the EPR irradiation at a low field decreases the EPR frequency and the nonresonant power deposition (which varies approximately as the square of the frequency), allowing larger samples to be used. The optimum EPR frequency as well as evolution field depends on the EPR linewidth of the free radical and on the size of the sample. It has previously been shown that with nitroxide-free radicals and large samples, the optimum frequency is between 30 and 60 MHz, corresponding to an Evolution (EPR) field of ∼3 mT (78). Detecting the NMR signals at a high field is necessary to increase the SNR of the experiment.
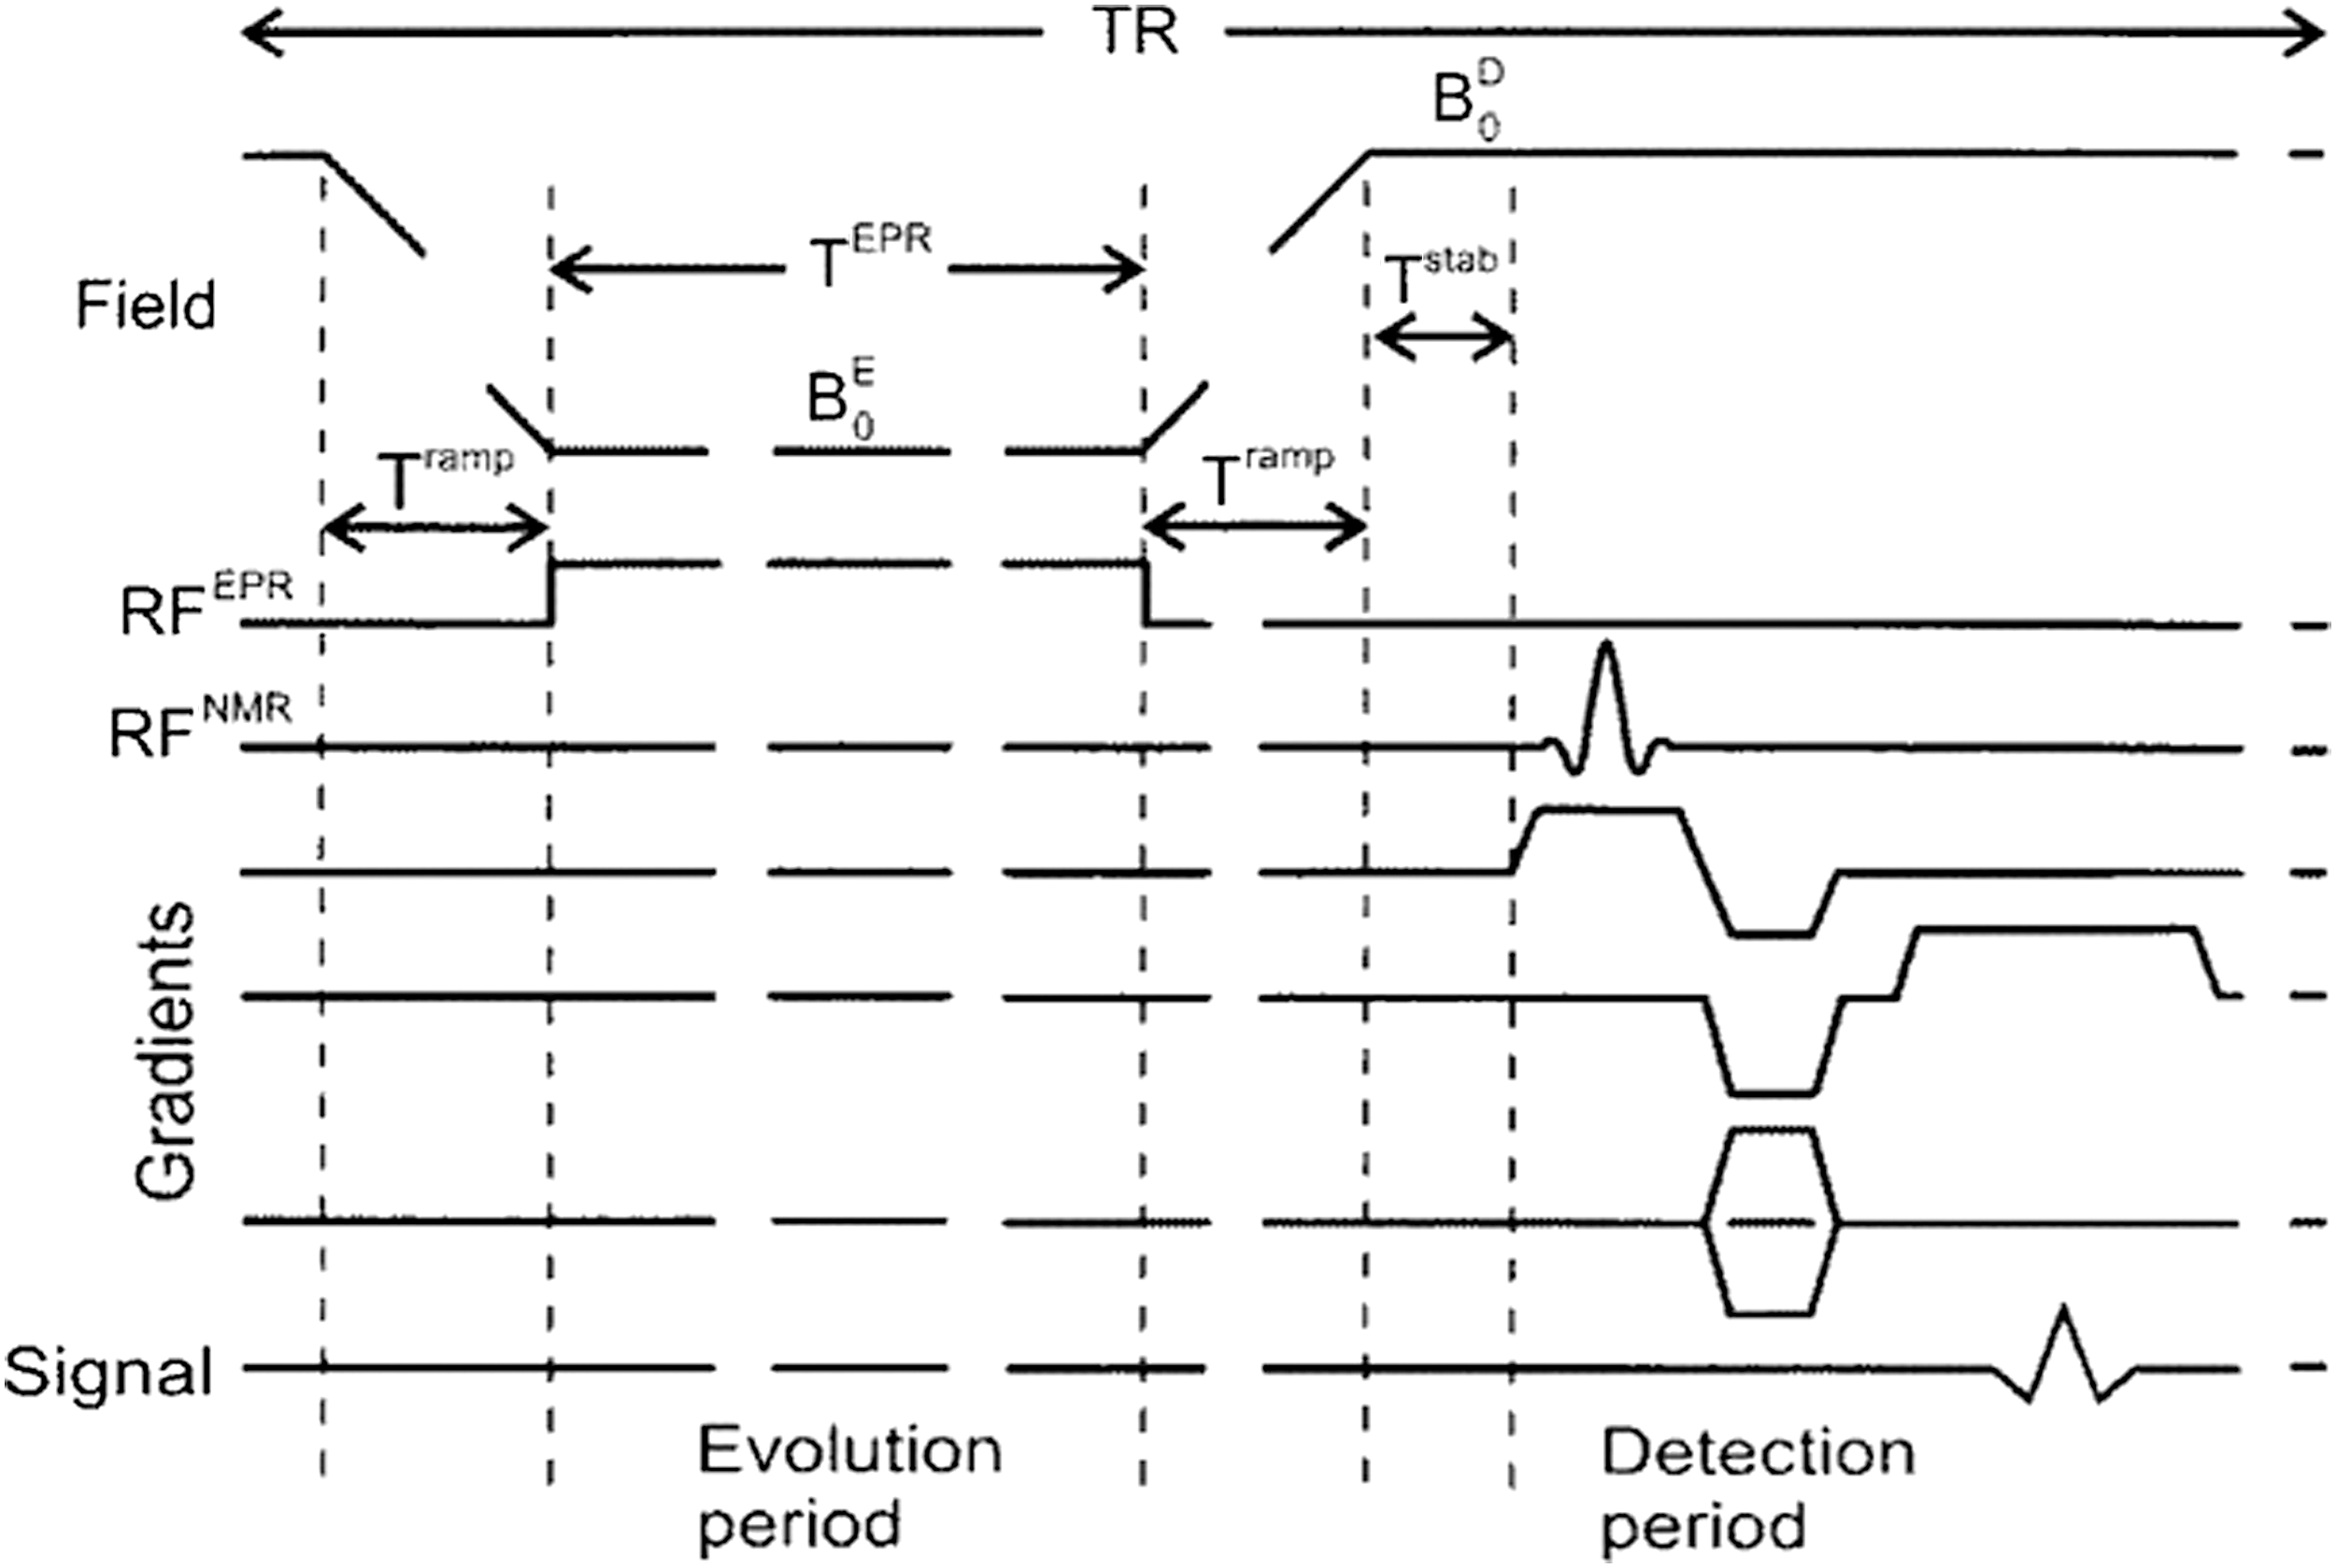
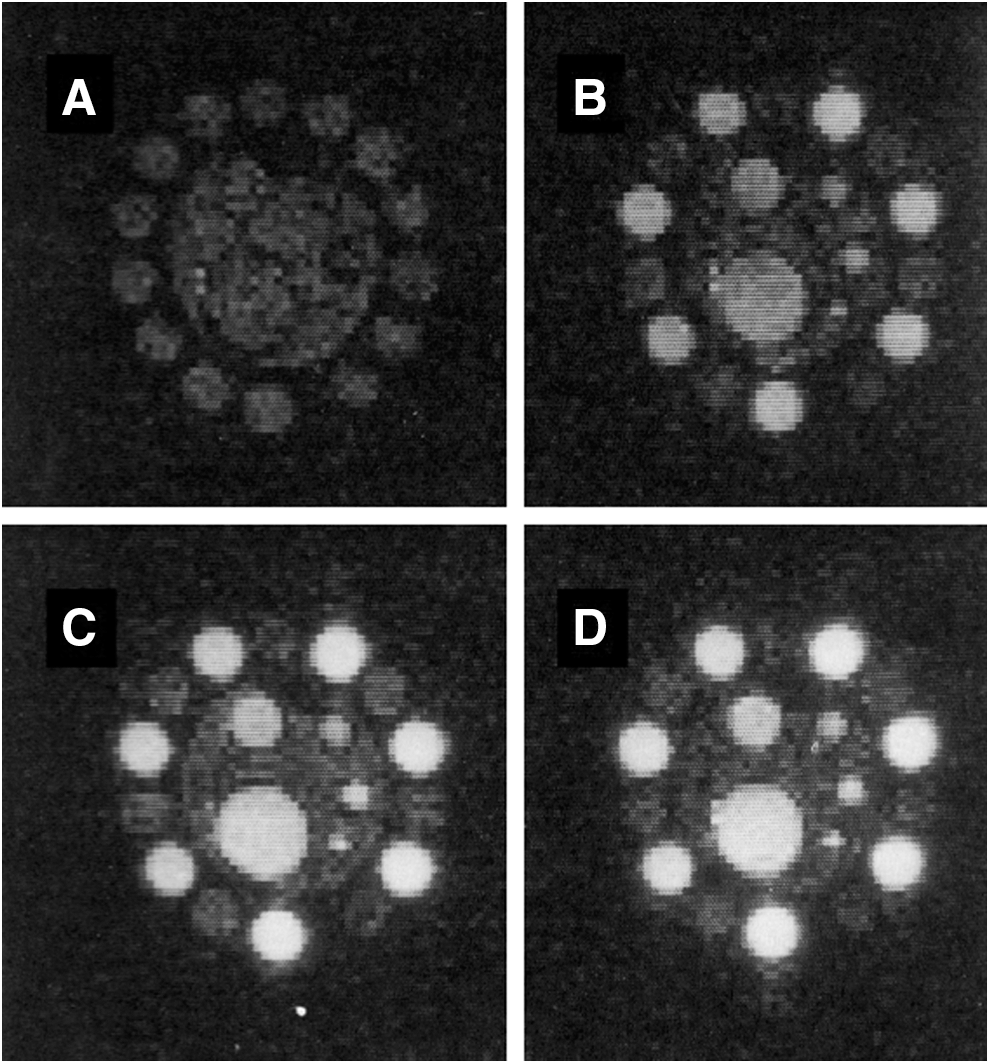
Figure 3 shows FC-PEDRI images of a resolution phantom (B–D); a field-cycled non-PEDRI image (A) is also shown for comparison (82). The center of the phantom consisted of five tubes of internal diameters 15, 9, 5, 4, and 3 mm filled with 2 mM TEMPOL solution. These were enclosed in a cylindrical container of diameter 4 cm that was filled with water doped with copper sulfate to give the same T1 as that of the free radical solution (650 ms at 2.5 MHz). Fourteen sample tubes with internal diameters of 8 mm were attached around the outside of the cylinder, with alternate tubes being filled with 2 mM TEMPOL solution or copper sulfate-doped water. The overall diameter of the phantom was 6 cm, about the size of a small rat. The three FC-PEDRI images were obtained by using EPR irradiation time (TEPR) values of 750, 1000, and 1500 ms with a repetition time of 2000 ms, and the average observed enhancement factors were −4.0, −5.3, and −7.1, respectively. The instantaneous power level in the EPR irradiation was approximately 7 W/kg, whereas the average applied power ranged from 2.7 to 5.3 W/kg depending on the pulse sequence timing. In FC-PEDRI, the enhanced versus unenhanced image intensity ratio depends not only on the power of the EPR irradiation but also on the relative timing of the polarization and evolution intervals, and the values of B0 P and B0 D. At the beginning of the evolution period, the size of the magnetization depends on the length of the polarization period compared with the sample's T1 at B0 P. During the evolution period, the magnetization decays at a rate determined by the sample's T1 at B0 E. Meanwhile, the magnetization in regions of the sample containing free radical increases at a rate depending on T1 toward an equilibrium value that depends on the EPR irradiation power. The results from FC-PEDRI show that free radicals can be imaged with greater resolution than with EPR, which typically relies on projection reconstruction.
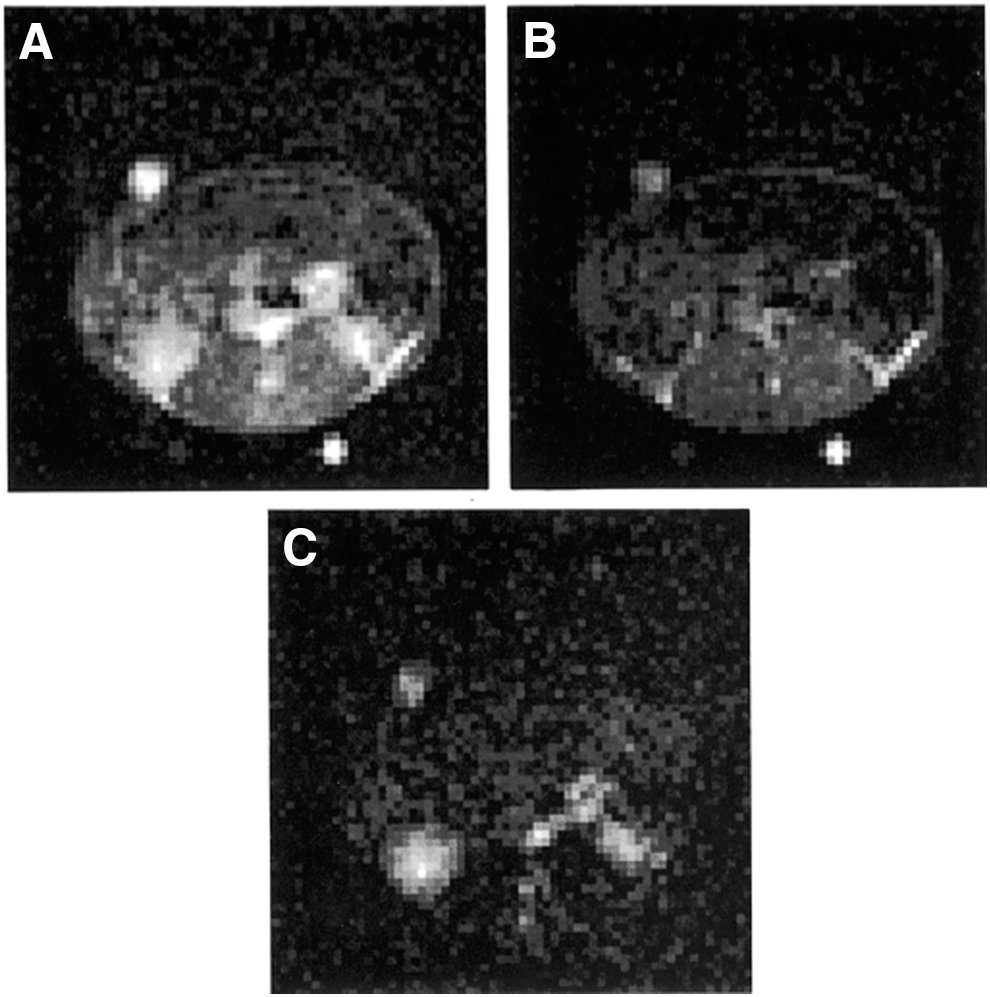
In vivo experiments using FC-PEDRI have been reported. Figure 4 shows images from an in vivo experiment using the nitroxide radical proxyl carboxylic acid (PCA) in the rabbit (81). An anesthetized rabbit was placed supine with the kidneys placed centrally, and an FC-PEDRI image was collected. The free radical probe was then administered, and a series of FC-PEDRI images was obtained at approximately 6 min intervals. Images were obtained by using both 64 × 64 and 128 × 128 matrices. In both cases, the image parameters were: field of view 15 cm, slice thickness 3 cm, TR = 1000 ms, TEPR = 300 ms, T ramp = 40 ms, T stab = 10 ms, EPR frequency 51.0 MHz, and B0 E = 3.05 mT. The forward power to the birdcage resonator was approximately 300 W, and the power absorbed in the animal can be estimated as 130 W by using the loaded and unloaded Q factors (measured to be 193 and 346, respectively). Considering the duty cycle of the EPR irradiation (300 ms in 2000 ms, or 15%), the average specific absorption rate (SAR) in the 2.2 kg animal is 9 Wkg−1. Considering the delays between consecutive image collections, the overall SAR was only 3 W kg−1. Although this is still higher than desirable, the experiment successfully demonstrated that FC-PEDRI of a moderately large animal was possible without overheating the animal due to nonresonant absorption of the EPR irradiation. Figure 4 shows “without EPR,” “with EPR,” and “difference” transaxial images through the animal's abdomen obtained 2 min after injection of the nitroxide-free radical. As reported in the rat (111), PCA is cleared through the rabbit's kidneys, and this can be seen clearly in the difference image, together with major blood vessels. The SNR in the difference image was measured to be 14 ± 1.5 (81).
Optimization of Probes for PEDRI
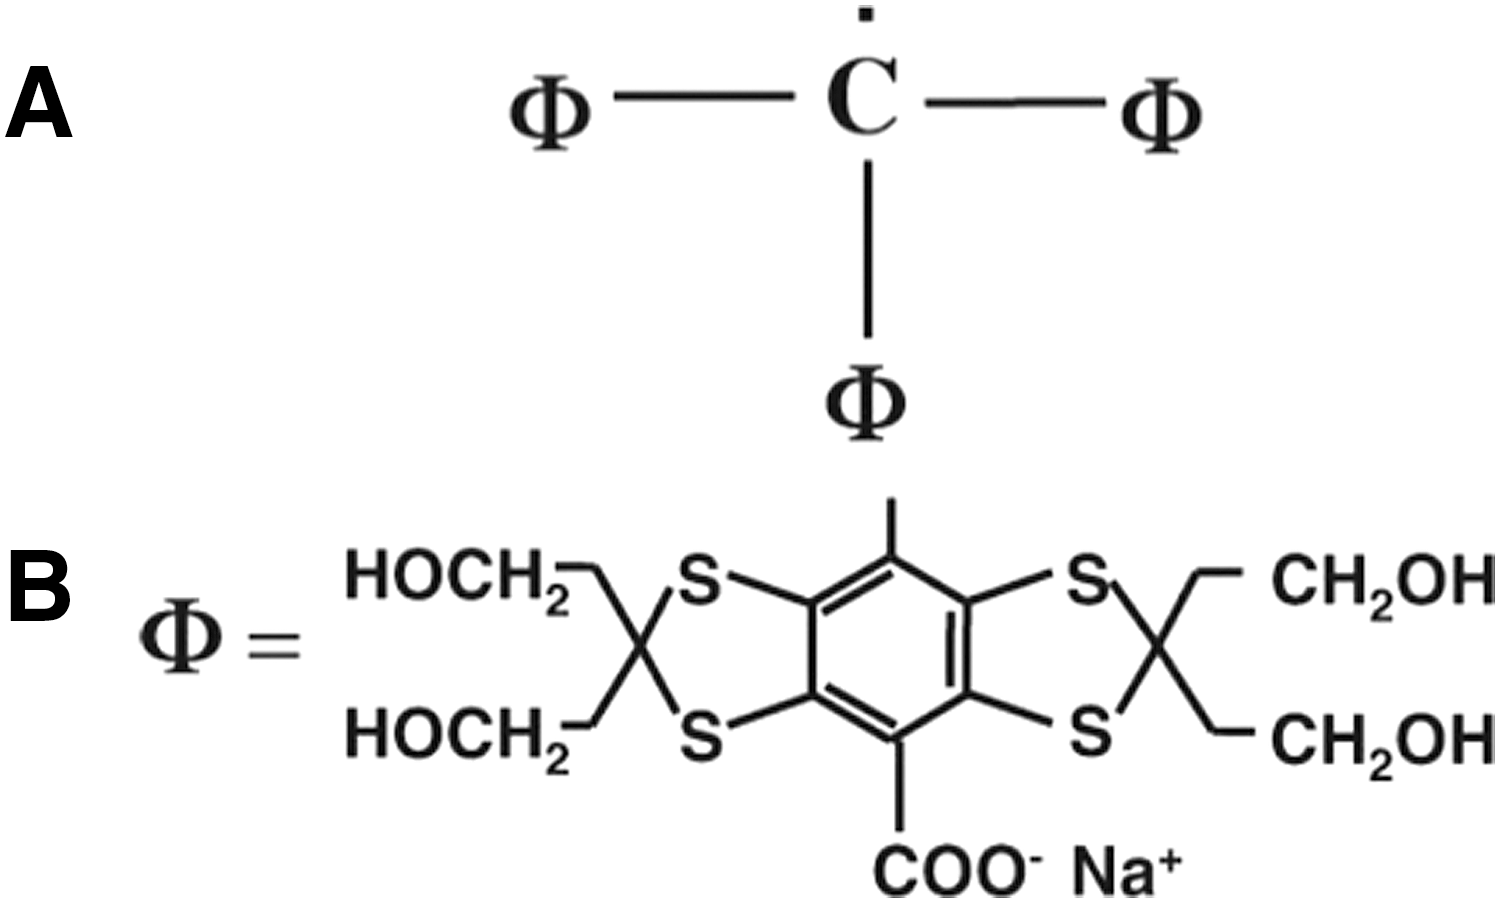
The feasibility of in vivo application of PEDRI had been intensively researched by several groups in the literature in the 1990s. However, nitroxides used as contrast media in the studies until the late 1990s were not optimized enough to produce morphological images at ∼10 mT (3, 47, 79, 82). The nitrogen nucleus has a spin 1 and splits the single transition into three transitions. So, when one transition is irradiated, only 1/3 of the possible enhancement is available and high power is needed to saturate it due to the short relaxation time. Both these factors result in restricted enhancement and, consequently, a low SNR in the resulting images. In addition, the short pharmacological half-lives of these species further limited their use for PEDRI research. To improve the SNR of in vivo PEDRI, triarylmethyl or trityl radicals (TAM), paramagnetic substances with single narrow lines and a long relaxation time were synthesized as probes (4, 17, 44, 105, 131, 134). Figure 5A shows the chemical structural formula of TAM, and Figure 5B illustrates the case of Φ when it is Ox63. The narrow line without splitting was realized by designing the location of unpaired electron more than five bonds away from magnetic nuclei. The carboxyl group in Φ makes TAM highly soluble. TAM distributes in extracellular space due to its negative charge. TAM also has other characteristics that are needed for EPR probe (stability, low toxicity, long in vivo half-lives, and pO2-dependent EPR line widths).
By combining these probes with improved imaging hardware and pulse sequences, significant improvements in the quality of morphological images in rats were reported in 1998 (44). That study also showed that TAM behaved pharmacokinetically as an extravascular, extracellular MR contrast medium, which indicated that it remains mainly within the vascular bed during the first few re-circulations in the body. In vivo images from another study are illustrated in Figure 6, which shows the difference between unenhanced MRI and PEDRI by using TAM in a mouse at 20 mT. The PEDRI image displays significantly higher SNR, though both images were taken in comparable times. The imaging parameters are listed in the figure caption (83).
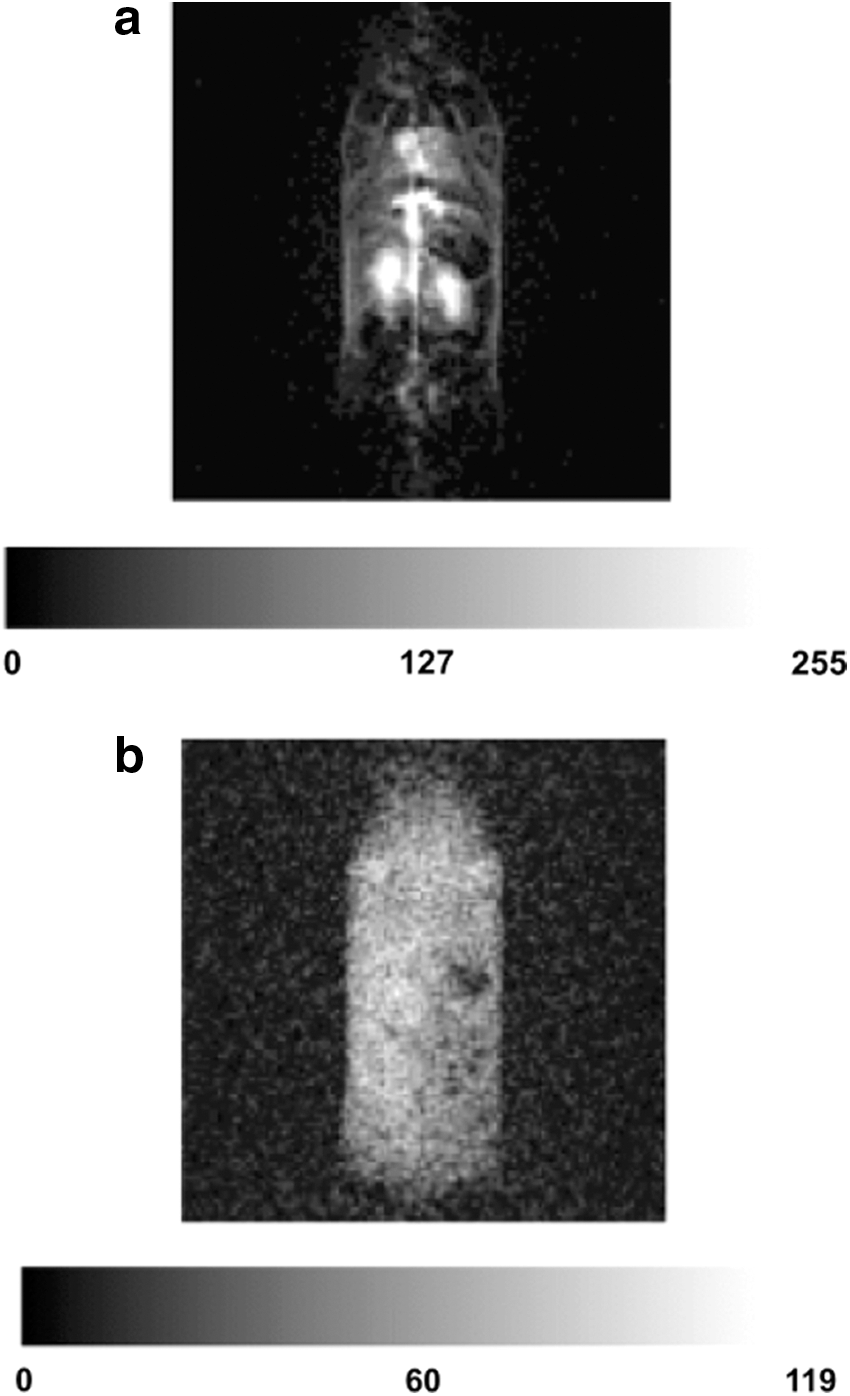
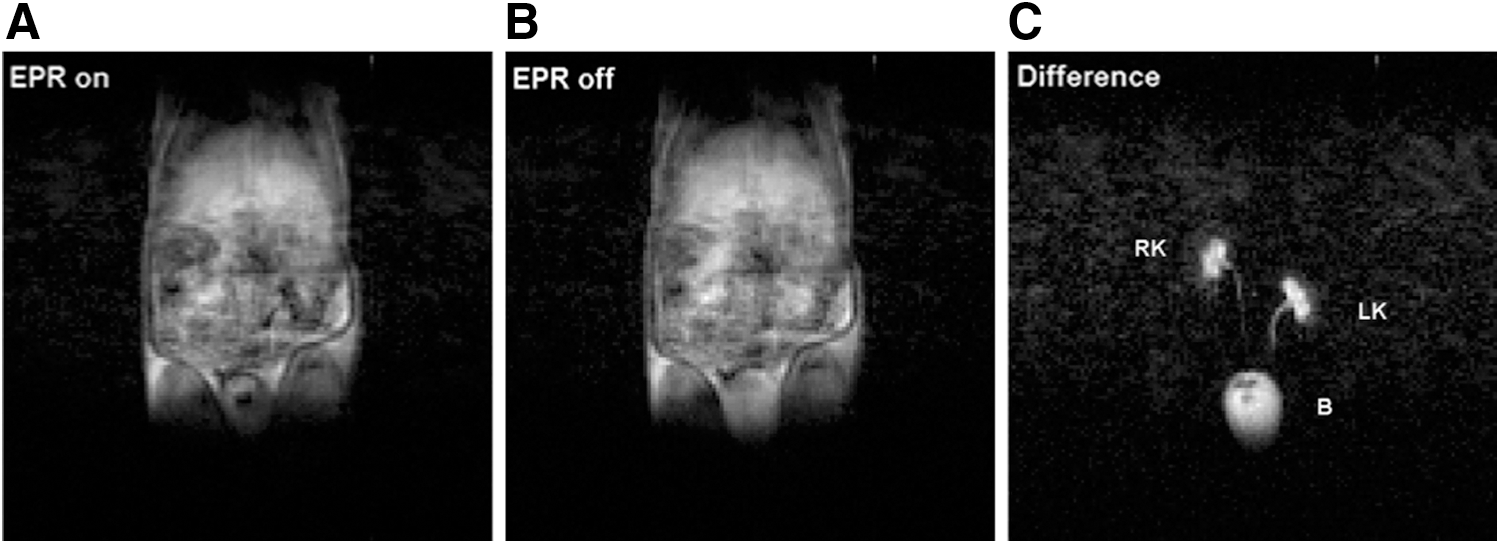
Figure 7 also shows a set of coronal FC-PEDRI images (EPR-on, EPR-off and difference, Fig. 7A–C respectively) of a 172 g rat, 51 min after injection of a dose of TAM; imaging parameters are listed in the figure caption (80). These images illustrate the advantage of using a relatively high-detection magnetic field (0.45 T) to boost the overall SNR, with an attendant increase in sensitivity and image quality. A slice thickness of 30 mm was used to visualize the injected free radicals independent of its anterior–posterior position within the animal. In the difference image, the animal's kidneys and bladder can clearly be seen. The ureters are also clearly visible, even though they represent only a small fraction of the volume of a voxel (the voxel dimensions are 30/0.8/0.8 mm). It is also noteworthy that by using TAM the imaging of renal excretion has improved substantially from Figure 4 using PCA.
pO2 Mapping with PEDRI
Oxygen supply and diffusion into tissues is necessary for cellular function (19). The oxygen pO2, which is a key measure of the physiological state of an organ, results from the balance between oxygen delivery and its consumption. Oxygen transported by red blood cells is delivered dependent on the metabolic requirements and functional status of each organ. Tissue oxygenation is severely disturbed during pathological conditions such as cancer, diabetes, coronary heart disease, stroke, etc., which are associated with a decrease in pO2 (19). Several different techniques have been developed to quantify the concentration of oxygen. Invasive methods involve oxygen sensitive electrodes such as the Clark electrode (51, 54) or the Eppendorf electrode (127, 130). As noninvasive methods, the blood oxygenation level-dependent MRI techniques (16, 96, 99) where a T2*-sensitive gradient echo pulse sequence is used to visualize the ratio between oxy/deoxy-hemoglobin and nonhydrogen nuclei such as 17O (89, 97, 136) or 19F MR images (88, 101, 107) where the oxygen concentration is reflected in the signal intensity of the image are available.
The electron spin relaxation times are mainly determined by self-broadening and oxygen-induced relaxation (1, 35, 39, 40, 67, 118, 120, 137). In PEDRI, the presence of O2 shortens the relaxation times and, consequently, results in the decreased transfer of polarization to nuclear spins during the EPR irradiation. Variations in the concentration of the unpaired electron substance can also influence the electron spin relaxation times in the same way. Hence, the signal intensity of PEDRI can be calculated by using both oxygen concentration and concentration of radical probe on the relaxation rates. Thus, in vivo oximetry is one of the most straightforward and useful applications of PEDRI (4, 32, 75, 79, 92). EPR methods (both spectroscopic and imaging) are also employed to obtain oxygen information. In EPRI, the spatial as well as the spectral information of the exogenously administered spin probes is obtained. Therefore, EPRI present the in vivo visualization of the spin probes but without complementary anatomical information. In contrast, MRI is a well-established modality that gives superior anatomical information. PEDRI uses the Overhauser effect, thereby indirectly detecting the EPR signal. After the EPR irradiation, using standard MR-imaging techniques, distribution of the probe and the oxygen concentration near the probe is visualized in PEDRI (4, 45, 117, 128). In vivo applications of PEDRI oximetry have been demonstrated, for example by Golman et al. (45).
In the oncology field, approximately one-third of human tumors evaluated for oxygen status have shown significant oxygen deficiency. Oxygen deficiency increases the tumor's resistance toward cancer treatment modalities, including radiation and chemotherapy (25, 52, 53, 55, 104, 115, 126). In addition, hypoxic microenvironments in tumors are known to promote processes driving malignant progression, such as angiogenesis, elimination of p53 tumor suppressor activity, genetic instability, and metastasis (42, 52, 94). An understanding of tumor hypoxia could lead to the discovery of diagnostic and prognostic markers for malignant progression, discovery of novel therapeutic targets, and the development of new constructs for gene therapy applications in human cancer. Therefore, oximetry by PEDRI, which is a noninvasive and real-time measurement, is of importance in preclinical research. Since PEDRI also provides a quantitative measurement, it is possible to track the change in oxygenation kinetics over days.
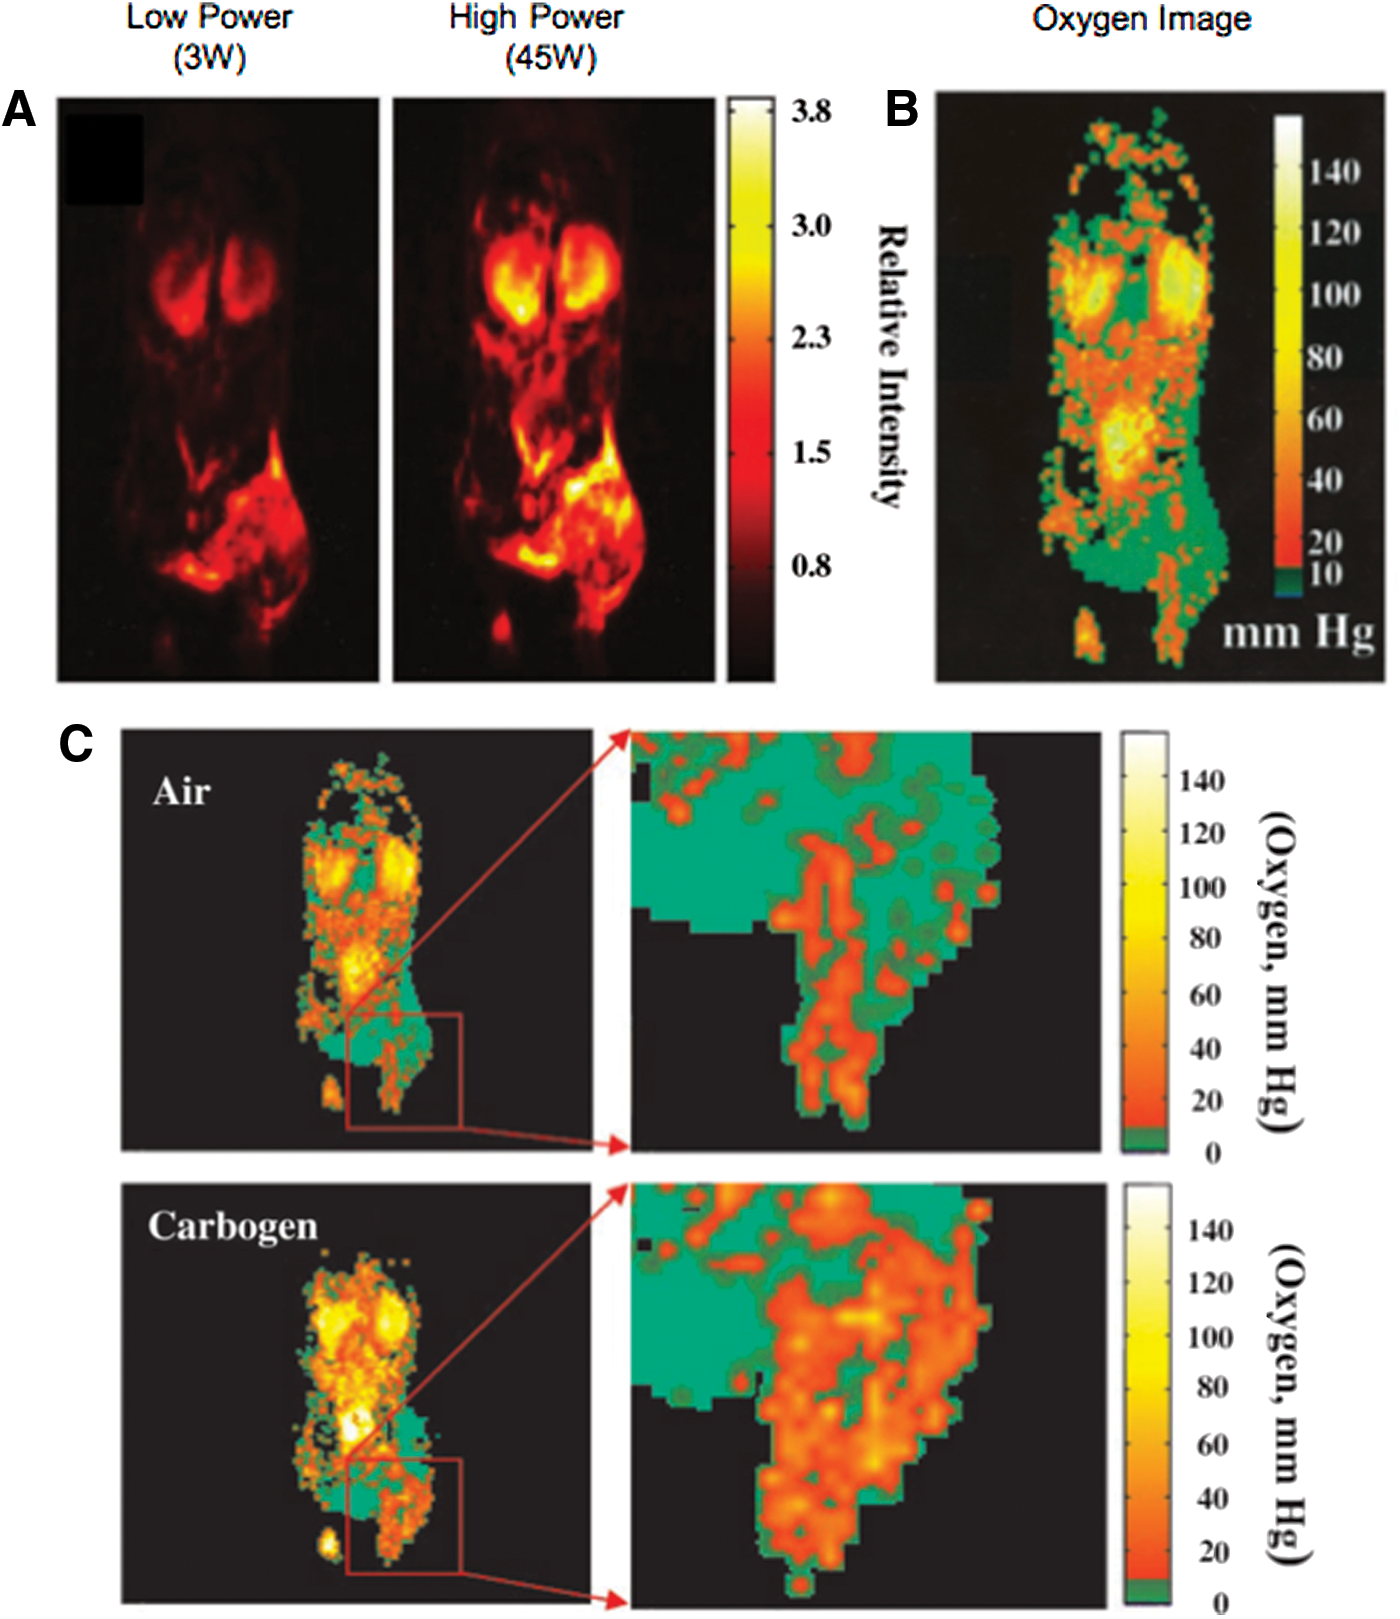
Figure 8 shows the enhancement of proton signal by the Overhauser effect in an SCC VII tumor-bearing mouse (right hind leg) by using two different EPR saturating power levels (75). Electron spin-density images and oxygen images can be obtained from these images. These oxygen images were verified by a direct comparison with Eppendorf electrode measurement. The pO2 images of the tumor (Fig. 8B) show distinct intra-tumor heterogeneity with a gradation of oxygen concentration. The pO2 values range from hypoxic to normoxic values (∼50 mmHg) and are comparable with tumor pO2 values reported in using different invasive methods. The imaging times ranged between 4 and 8 min, and degradation of pO2 maps caused by animal motion, system instability, and the contrast agent distribution were not observed during this period. This study also shows that PEDRI is capable of monitoring changes in tumor oxygenation in response to the alteration of the breathing gas. In general, mean pO2 values increased during carbogen (95% oxygen and 5% carbon dioxide) breathing (Fig. 8C). In particular, the percentage of extremely hypoxic regions (∼5 mmHg pO2) decreased ∼30% during carbogen breathing. The result explains the previous reports that the treatment efficiency improved when the tumor was oxygenated either by letting the subject breathe carbogen (41, 50, 75, 91) or when the patient was confined to a hyperbaric oxygen chamber (2, 6, 14, 22). The results from this study showed the capability of PEDRI in obtaining quantitative maps of in vivo tumor oxygen status noninvasively.
Permeability Mapping with PEDRI
PEDRI can also be used for simultaneous assessment of tumor pO2 as well as for permeability of the tumor vasculature since the TAM derivative Ox63 is localized to the extracellular, extravascular space in a similar way to the widely used Gd3+ complexes. In normal tissue, there is a balance between proangiogenic and antiangiogenic factors, where mature vasculature with regular architecture ensures adequate supply of nutrients and oxygen. However, in tumors, because of excess proangiogenic factors (37, 95), tumor neo-vasculature is abnormal and chaotic in architecture and has poor structural integrity (61). The lack of adequate pericyte and endothelial coverage results in large vascular pores, causing a marked regional heterogeneity in tumor perfusion and making the tumor vascular hyper-permeable (29, 62). As a result, tumor progression is associated with disorganized angiogenesis, which results in inadequate oxygen supply and limited delivery of chemotherapeutics to the tumor (15, 63). Thus, noninvasive vascular permeability imaging will be useful in evaluating the tumor vasculature and choosing a treatment strategy. Leakage of exogenously administered tracers from blood vessels can be used to assess the tumor vascular permeability (93). Especially the most commonly used TAM (Ox63: molecular mass 1427) has a molecular mass three times larger than typical gadolinium complexes, which makes its endothelial transport more sensitive to microvascular permeability. With PEDRI, the tissue microvascular permeability imaging can be acquired by using the same datasets that are needed for oximetry. The endothelial transfer coefficient Ktrans was obtained from pharmacokinetics analysis of the contrast agent-induced dynamic signal change that provides useful data to quantify the treatment response in anticancer therapy.
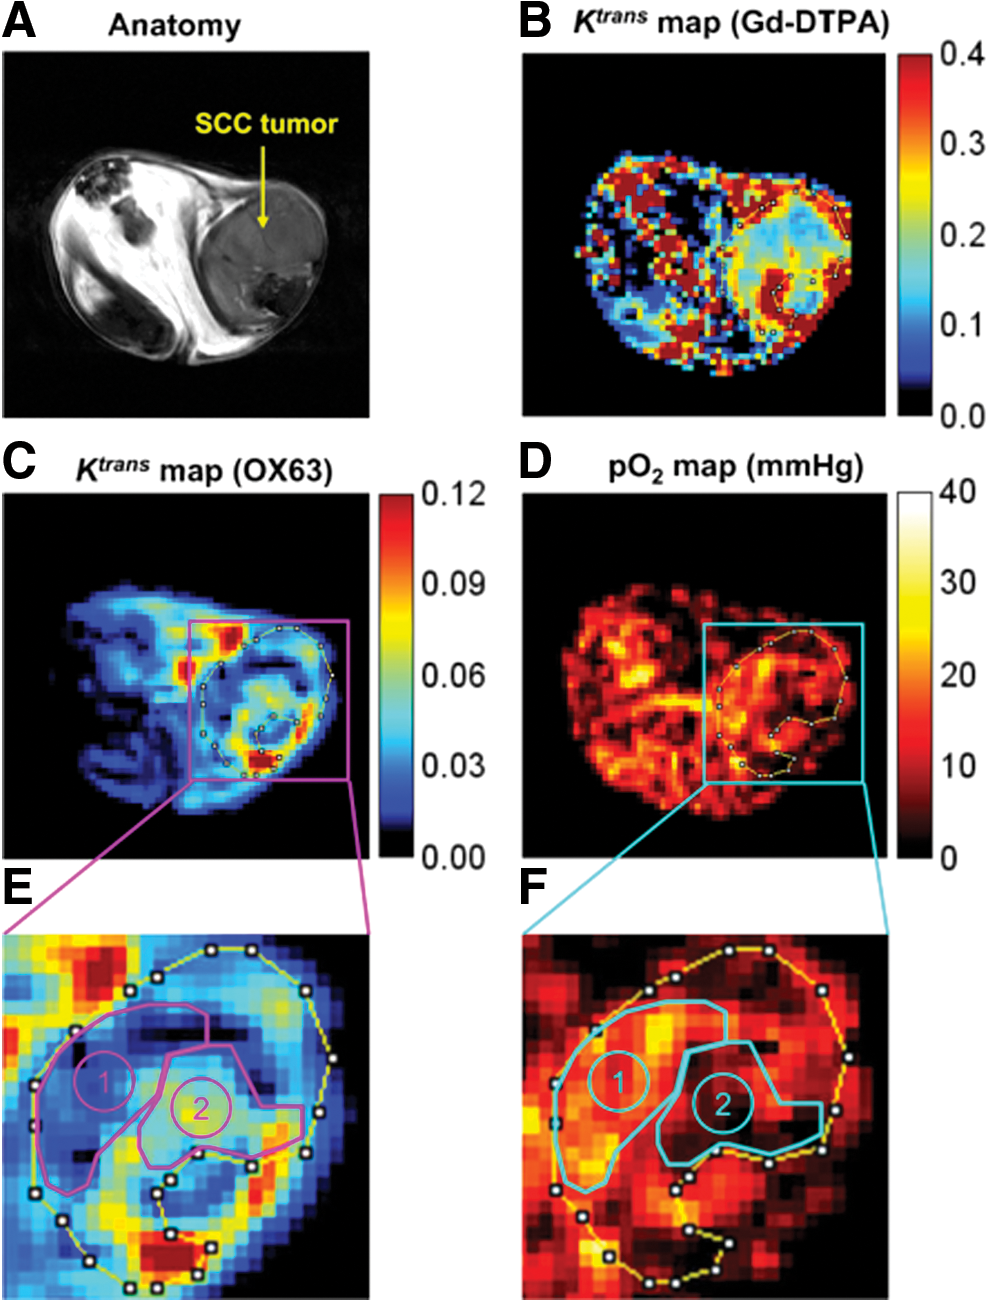
Figure 9 shows the comparison of Ktrans maps of gadolinium-diethylenetriamine pentaacetic acid (Gd-DTPA) and Ox63 with corresponding anatomy images (Fig. 9A) (93). Relatively high Ktrans values were observed globally for Gd-DTPA (Fig. 9B) compared with those for Ox63 (Fig. 9C) in both tumor and normal tissue regions. The result was consistent with its lower molecular mass, making it penetrate easily even through the smaller pores in normal blood vessels (21, 116). Therefore, the Ktrans of Gd-DTPA may have larger contributions from blood perfusion in tissue than vascular permeability as reported (4, 116). Figure 9D is a corresponding pO2 map computed from the same PEDRI images for the Ox63 Ktrans map. The inverse relationship between Ox63 Ktrans and pO2 suggested that the leaky and abnormal tumor vasculature is unable to deliver oxygen efficiently to tissue, in agreement with earlier studies using immunohistochemical analyses or oxygen-sensitive electrodes (28, 66). This study showed that tumor regions with high vascular permeability (Ktrans of Ox63) could be hypoxic regardless of blood perfusion as determined by MRI using Gd-DTPA (Ktrans of Gd-DTPA), suggesting that diffusion-limited hypoxia does not completely determine the oxygen status of tumors (Fig. 9D, F).
Redox Mapping with PEDRI
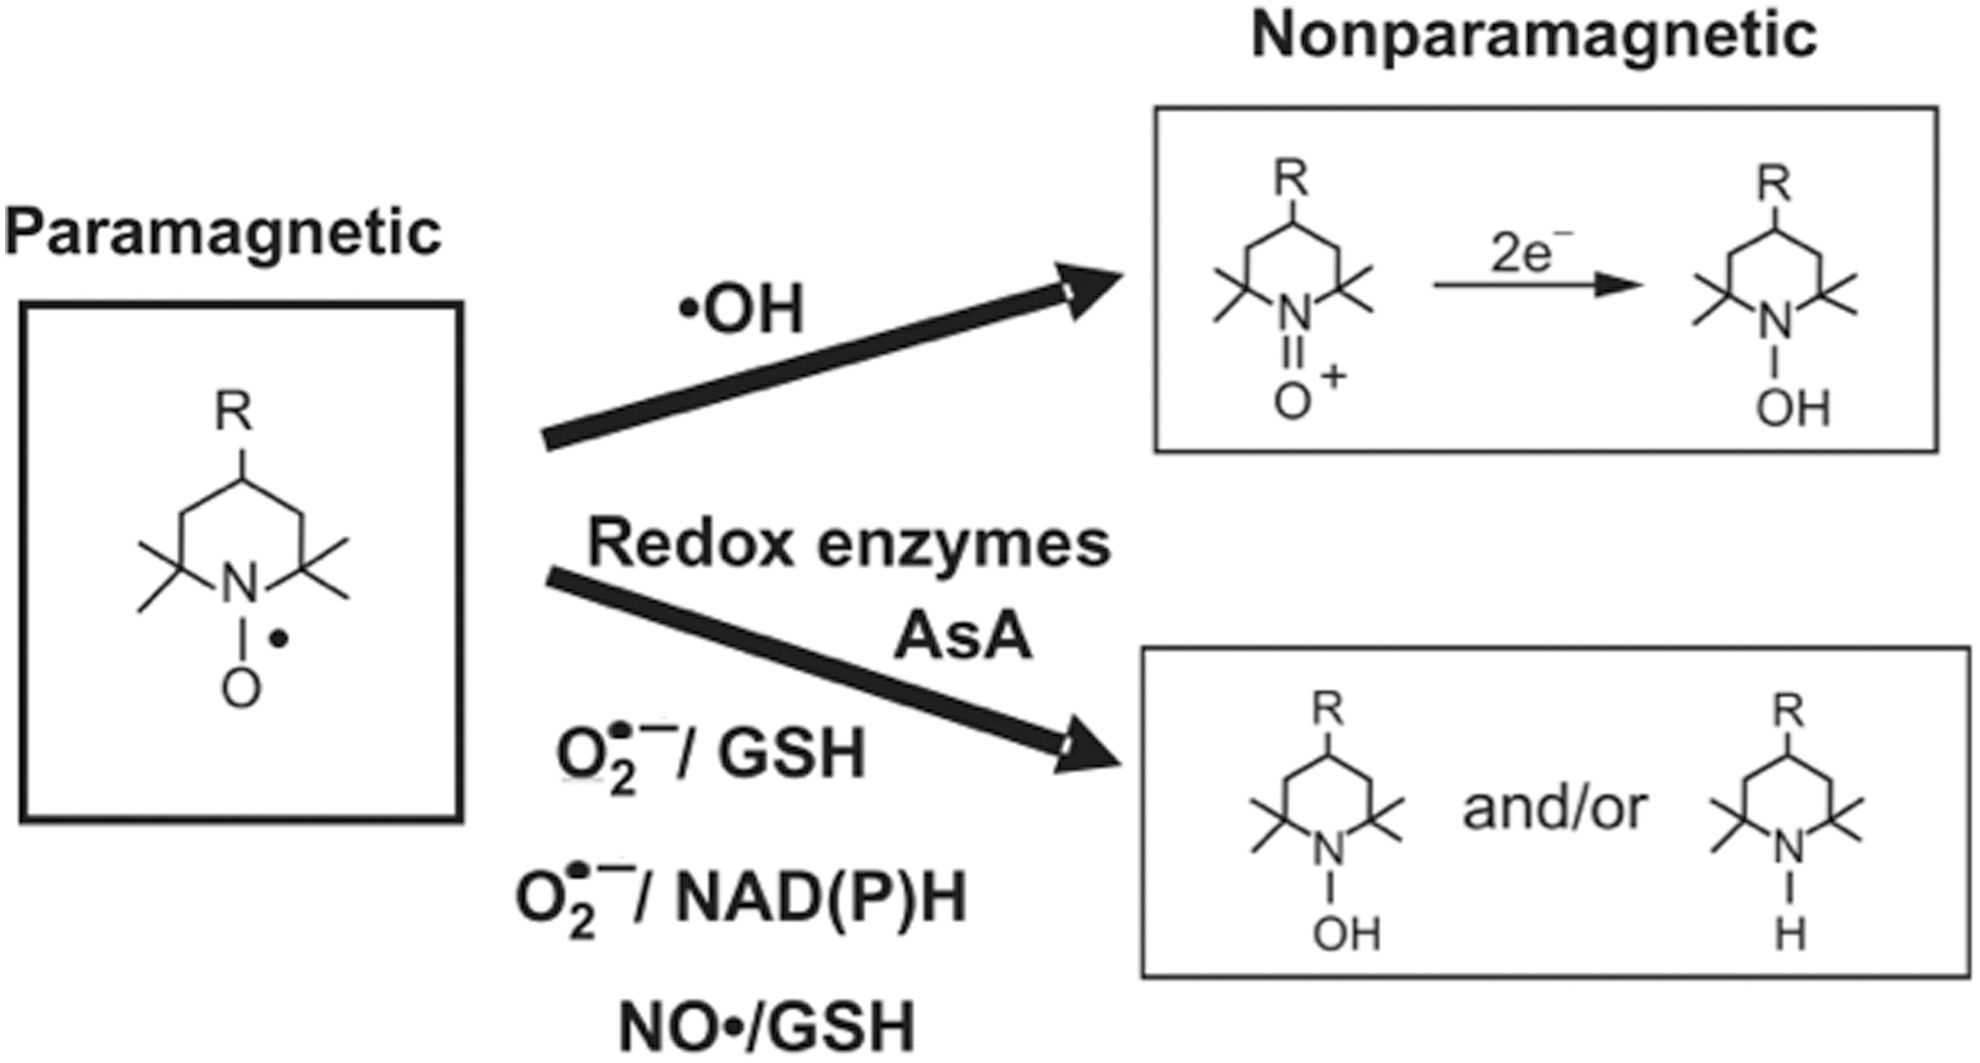
Oxidative stress is associated with various diseases such as cancer, cardiovascular disease, Alzheimer's disease (87), Parkinson's disease (64), diabetes mellitus (86), atherosclerosis (113), ischemia reperfusion injury (18), and chronic inflammatory processes (24). The main causative factors are reactive oxygen species, which also act as essential cellular messengers and redox regulators (30). Therefore, developing in vivo noninvasive redox imaging can shed light not only on these pathologies but also on healthy tissue. Utsumi et al. utilized the PEDRI technique for redox imaging by using redox-sensitive nitroxyl radical probes in vitro and in vivo by using novel isotope-labeled probes (5, 57, 72, 90, 112, 125, 133). Nitroxyl radicals are known to lose their paramagnetic property via a redox reaction with the hydroxyl radical or the superoxide anion radical (Fig. 10) (76, 129). There is a good linear relationship between the generation of hydroxyl radical and the loss of paramagnetism of nitroxyl radical (110). It was also reported that cytochrome P-450, NAD(P)H-dependent cytochrome P450 oxidoreductase in microsomes is associated with the loss of paramagnetism of nitroxyl radical and the reduction of nitroxyl in the mitochondorial electron transport system (58, 59, 103, 124). Glutathione and ascorbic acid are also known to support the reduction of nitroxyl radical (23, 121), and the 2,2,6,6-ethyl substitution of 2,2,6,6-Tetramethyl-1-piperidinyloxy (TEMPO) led to resistance toward the reduction with ascorbic acid (71). In such a manner, the nitroxyl radical directly and indirectly reflects the redox state. Hence, analyzing the in vivo conversion rate of the nitroxyl to the diamagnetic state enables visualization of the redox state. Unlike the chemically stable TAM for oximetry, nitroxyl radicals used for redox imaging need to participate in redox reactions.
To optimize the adaptability of nitroxyl radicals as probes, adequate modifications need to be made. Such chemically modified nitroxyl radicals are preferentially distributed in intracellular, extracellular, and cell membrane (109). A set of redox-responsive probes to simultaneously assess redox reactions in intra- and extracellular regions were reported by Utsumi et al. (125). With the design of 14N- and 15N-labeled nitroxyls, it was possible to distinguish between intra- and extracellular redox processes as demonstrated in a phantom object.
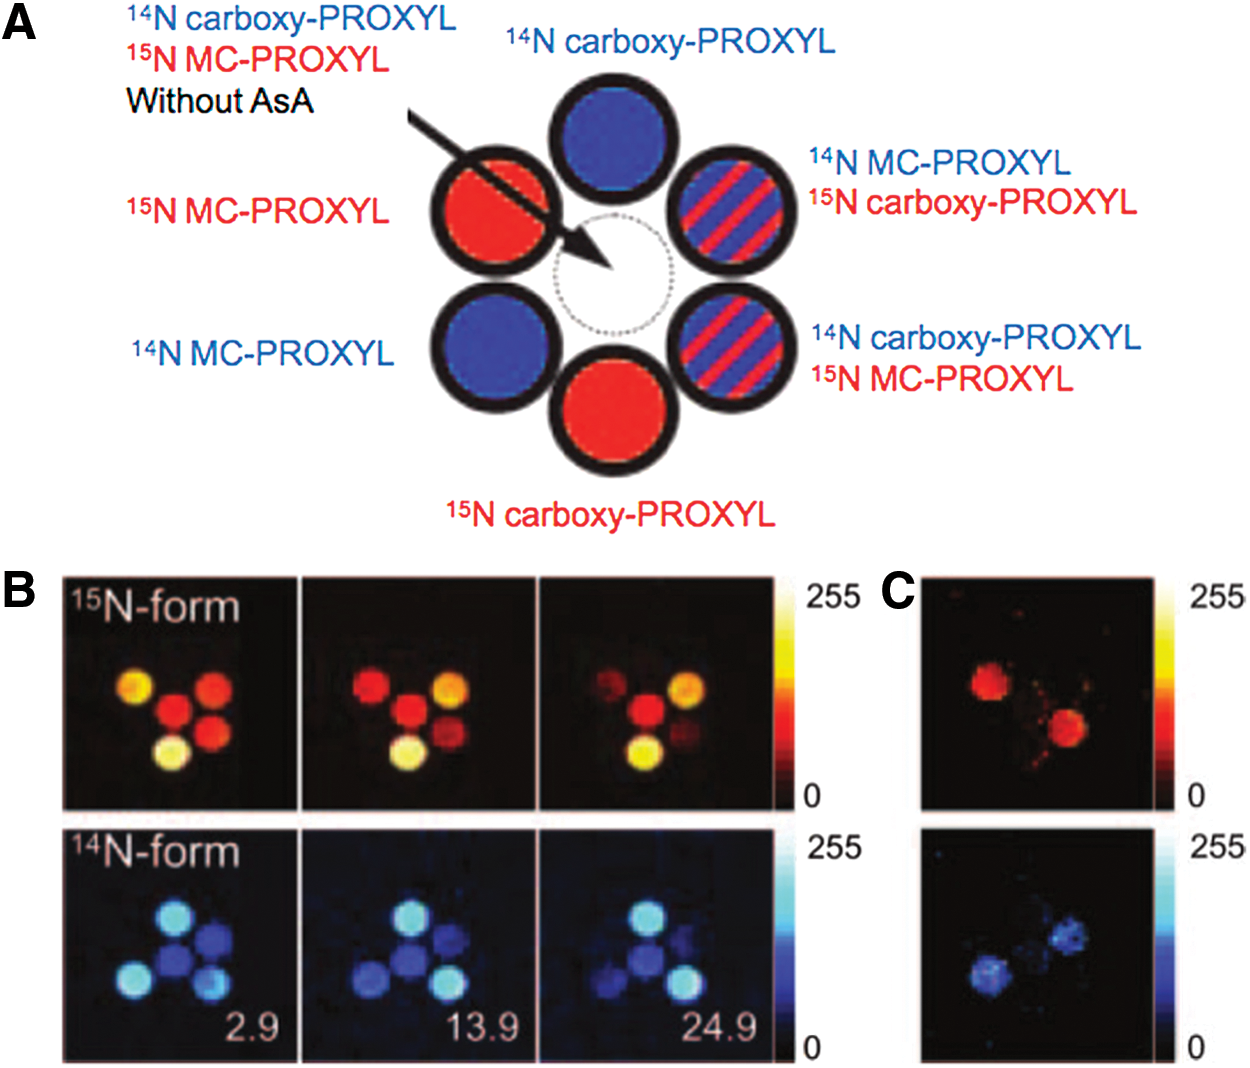
The feasibility of redox imaging using nitroxyl radicals was validated by in vitro experiments (Fig. 11), showing the time-dependent redox reaction of both membrane-permeable 14N/15N-3-methoxycarbonyl-2,2,5,5-tetramethyl-pyrrolidine-1-yloxy (MC-PROXYL) and membrane-impermeable 14N/15N carboxy-PROXYL. Images were acquired separately by changing the external magnetic field for EPR irradiation between 14N and 15N nuclei in FC-PEDRI (125). Figure 11A is a schematic of seven phantom tubes comprising six outer tubes with liposomes encapsulated with 100 mM ascorbic acid: Two containing the 15N compounds are shown with red, two containing the 14N compounds are shown with blue, and two containing both compounds are shown by the red and blue stripes. There was also one central tube, containing both compounds and no liposomes. Carboxy-PROXYL does not penetrate the liposome membrane, whereas MC-PROXYL can permeate freely across the membrane and undergo 1-electron reduction to the corresponding hydroxylamine. Three such PEDRI images taken at 2.9, 13.9, and 24.9 min are shown in Figure 11B. The image data showed that the intensity from the tubes containing MC-PROXYL in the presence of ascorbic acid-encapsulating liposomes gradually decreased with time, whereas the image intensities from tubes containing carboxy-PROXYL were constant. The rate of intensity loss from each pixel represents the differential redox imaging (Fig. 11C). It should be noted that the rate of intensity loss in the tube containing both MC- and carboxy-PROXYL (indicated with stripes in Fig. 11A) was the same as that in the tube containing either MC- or carboxy-PROXYL. Results from these phantom studies suggested that if two nitroxyl radicals with different isotopic substitution and different ring substituents (which direct them to different subcellular regions) lose or gain their paramagnetism, then their oxidation and reduction can be spatially resolved and distinguished. The time-dependent signal loss of the PEDRI images was observed when the nitroxyl radicals, which can permeate the liposomal bilayer, underwent reduction; whereas the nitroxyl agent incapable of crossing the membrane bilayer remained intact, and signal loss of the PEDRI images was not observed. This capability demonstrated that PEDRI combined with dual-labeled nitroxyl spin probes enabled visualization of events occurring at a nanometer scale, regardless of the intrinsic image resolution of 0.1 mm. This capability further exploited the fact that nitroxyl radicals are efficient antioxidants that also provide protection against oxidative stress in several modalities.
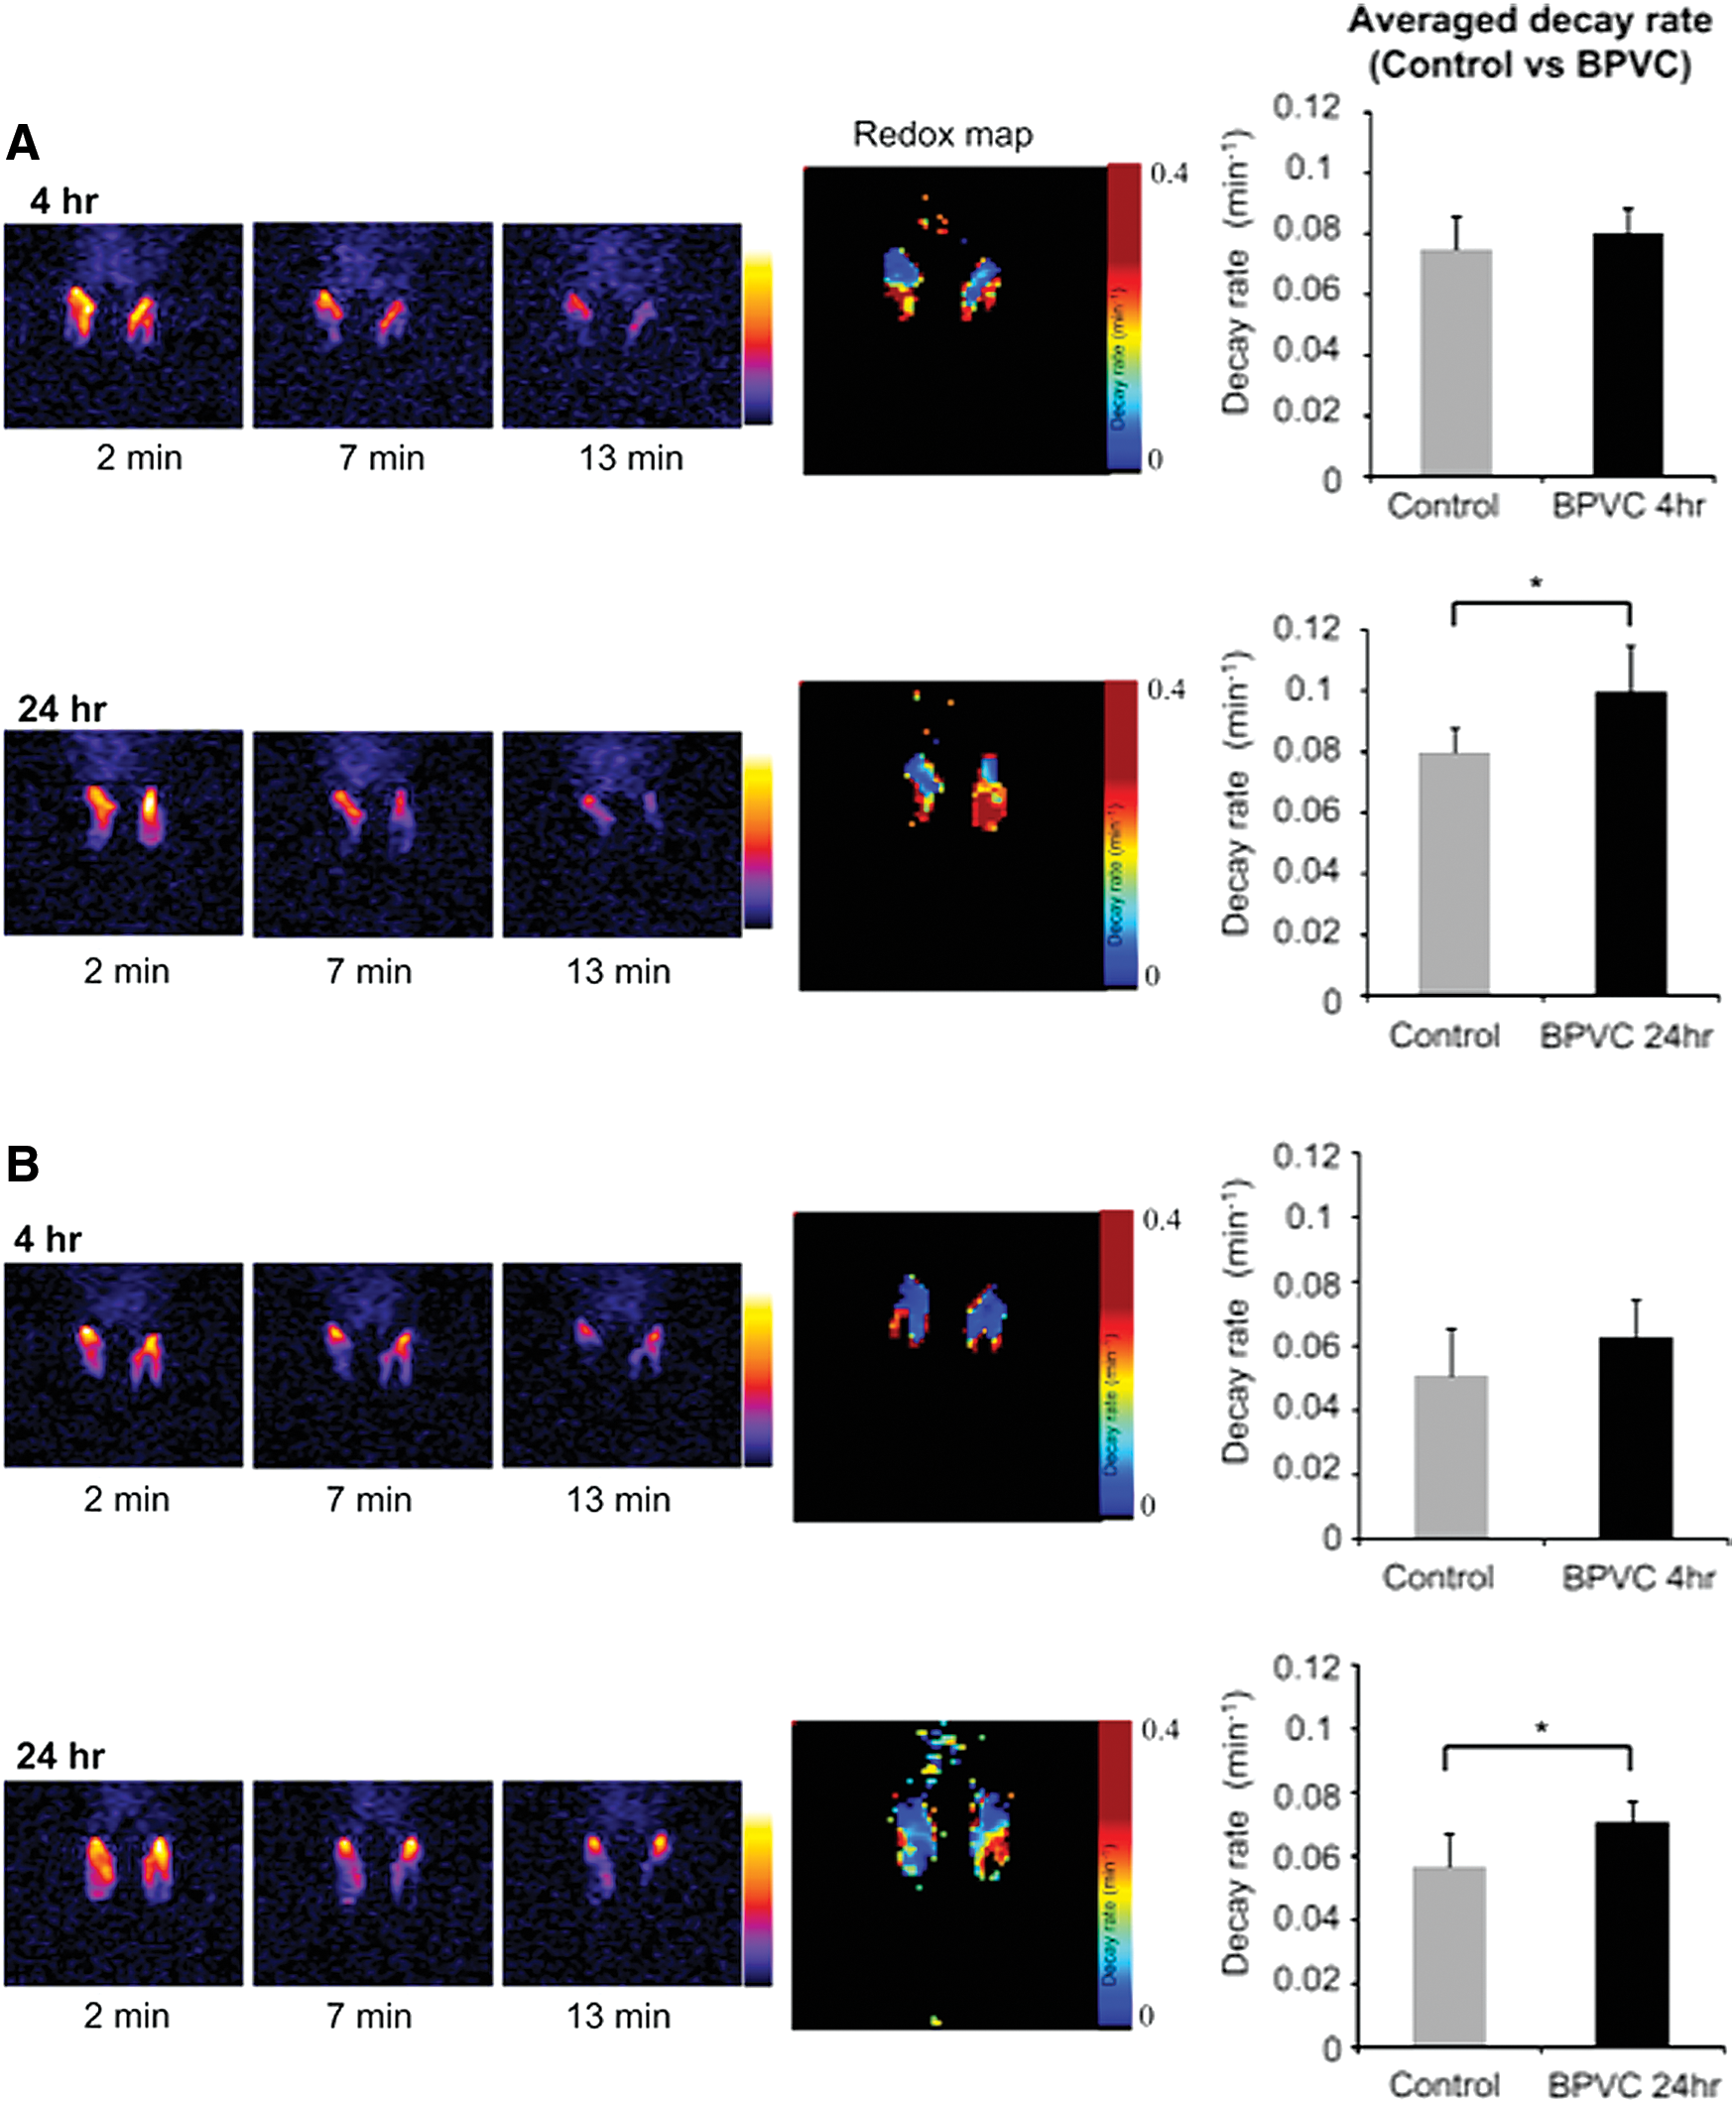
Based on the results from in vitro experiments, in vivo redox imaging using PEDRI was also successfully achieved. Figure 12 shows in vivo redox imaging demonstrated in a bupivacaine (BPVC)-induced local inflammation model in mouse legs (36). BPVC is a clinically used local anesthetic agent. However, it is known to destroy skeletal muscle fibers and cause severe inflammation when injected (7, 77, 106). Within several hours of BPVC-induced muscle transient fiber destruction, inflammatory cells locally infiltrate into treated tissues; the muscle cell itself regenerates within several weeks. Because of this effect, BPVC treatment has been used to create an animal model of muscle inflammation and regeneration. To noninvasively monitor redox status of the muscle, in vivo PEDRI was performed at 4 and 24 h after BPVC treatment in living mice. Two nitroxyl radicals, the cell membrane penetrable (carbamoyl- PROXYL: Fig. 12A) and the cell impermeable (carboxy-PROXYL: Fig. 12B), were used in the in vivo PEDRI experiments to confirm whether the redox reaction mainly occurs in the intracellular or extracellular compartment. Nitroxyl radical solution was carefully injected to the same region of the mouse leg that had received BPVC pretreatment. After an injection of carbamoyl-PROXYL, image intensities of both control and BPVC-treated legs (at 4 or 24 h) were clearly enhanced, and this intensity decreased over time. Although the image intensities of both legs were similarly decreased at 4 h after BPVC treatment, the image intensity of the BPVC-treated leg at 24 h showed faster decay than that of the untreated leg. The redox maps clearly illustrated differences in decay rates and distributions between control and BPVC-treated legs. The average decay rate observed in the BPVC-treated legs of eight mice significantly increased at 24 h but not at 4 h. Differences in decay rates of BPVC-treated and contralateral (nontreated) legs in individual mice were also calculated (Fig. 12A, B, right panels). In these panels, a symbol above the line marked “even” indicates that the decay rate of the BPVC-treated leg was faster than that of the control leg.
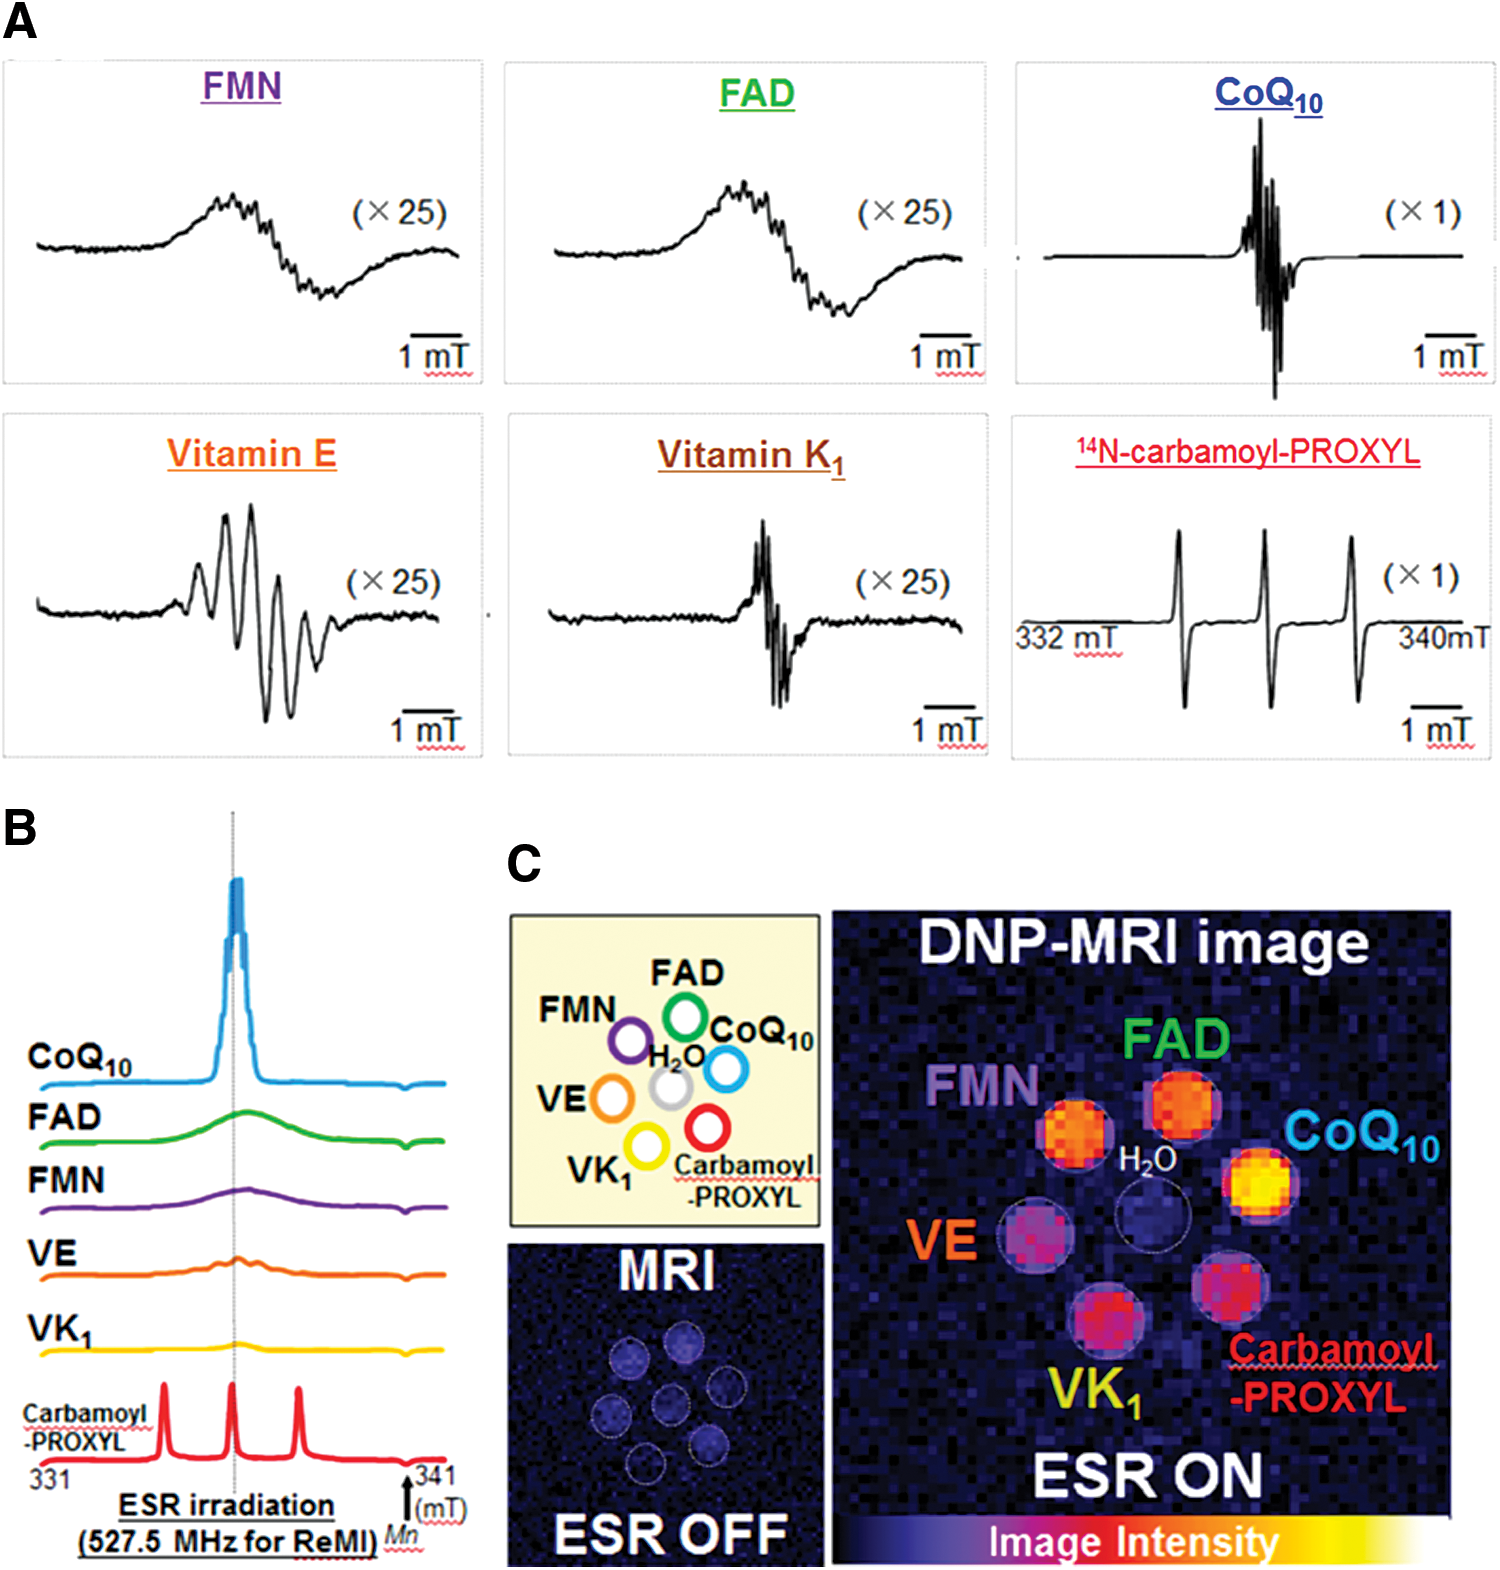
It has been reported that probes that have multiple hyperfine lines can have efficient Overhauser enhancement. When the MRI signal enhancement by saturating electron of such probes is enough to visualize in vivo free radicals, several endogenous antioxidants can be used as redox-responsive PEDRI probes. In contrast to administering the redox-sensitive nitroxyl probe and observing the loss of signal, the attempt to visualize and identify various endogenous free radical intermediates derived from redox transformations was tested (56, 123).
Figure 13 shows the EPR signals of the intermediate of various candidate probes (56). The enhancements due to FADH and FMNH were similar to that induced by carbamoyl- PROXYL (enhancement factor = 3.8, 4.3, and 3.3, respectively), even though the EPR absorption spectra of both FMNH and FADH exhibit a 13-fold broader line width, compared with the spectrum of carbamoyl-PROXYL, and the ratios of enhancement factor to peak height of both FMNH and FADH were four to seven times higher than that of carbamoyl-PROXYL. The line widths varied from 4.2 MHz (carbamoyl-PROXYL) to 58.5 MHz (FMN), which were much larger than the MRI resonance frequency. EPR excitation for PEDRI was carried out under continuous-wave irradiation, and the fluctuation of EPR irradiation was estimated within 1 ppm (corresponding to 0.5 kHz), which probes only a small proportion of the free radical molecules. This allows the electron transitions to be saturated much less completely in FMNH and FADH solutions than in carbamoyl-PROXYL solution. The coenzyme Q10 (CoQ10)H and radicals of vitamins E and K all enhanced the proton signals of the nonaqueous solvent: acetone for CoQ10H, hexane for the vitamin E radical, and CHCl3/EtOH for the vitamin K radical. Compared with carbamoyl-PROXYL, the ratio of enhancement factor to peak height was 38 times higher for the vitamin K1 radical, 5 times higher for the vitamin E radical, and 2 times higher for CoQ10H. Also, the electrons of these probes can be separately saturated and induce DNP by adjusting the EPR irradiation frequency. The result indicates that it is possible to simultaneously visualize various free radical intermediates of endogenous redox molecules (56).
pH Mapping with PEDRI
Aberration of normal tissue pH homeostasis in the human body has been reported for a number of pathological conditions that include cancers (123, 135), myocardial (98) and brain ischemia (73, 132), and chronic pulmonary (60) and kidney diseases (74). The extracellular tumor tissue acidosis, pHe, has been identified as a significant factor in cancer pathophysiology contributing to tumor initiation, progression, and therapy (43). Therefore, in vivo pHe imaging of the tumor tissue microenvironment (TME) may provide an invaluable tool for diagnosis, understanding of disease progression, and treatment optimization. Recently developed variable field (VF) (69) and variable radio frequency (VRF) PEDRI (33) approaches allow for functional mapping using nitroxide or trityl probes while additionally keeping the capability to provide anatomical images. VF (69) and VRF PEDRI (33) approaches allow for mapping the chemical microenvironment by using probes with functionally dependent ratiometric spectral parameters. The valuable spectral parameters at each pixel can be extracted from a limited number of PEDRI acquisitions acquired at preselected EPR excitation fields or EPR excitation frequencies. This allows for functional mapping using specifically designed paramagnetic probes, together with high-quality spatial resolution and short acquisition time. The concept was first verified by using VF PEDRI and a pH-sensitive nitroxide probe (69).
Figure 14 shows typical DNP spectra of the nitroxide NR1 acquired in acid, pH 4.98, and slightly alkaline, pH 7.62, aqueous solutions corresponding to dominant contributions of the protonated, RH+, and nonprotonated, R, forms of the radical, correspondingly, pK a = 6.1 (70). The significantly larger distance between the outer lines of the triplet spectra observed for the alkaline solution of the nitroxide is in agreement with previously reported larger nitrogen hyperfine splitting (hfs) for the R form (70).
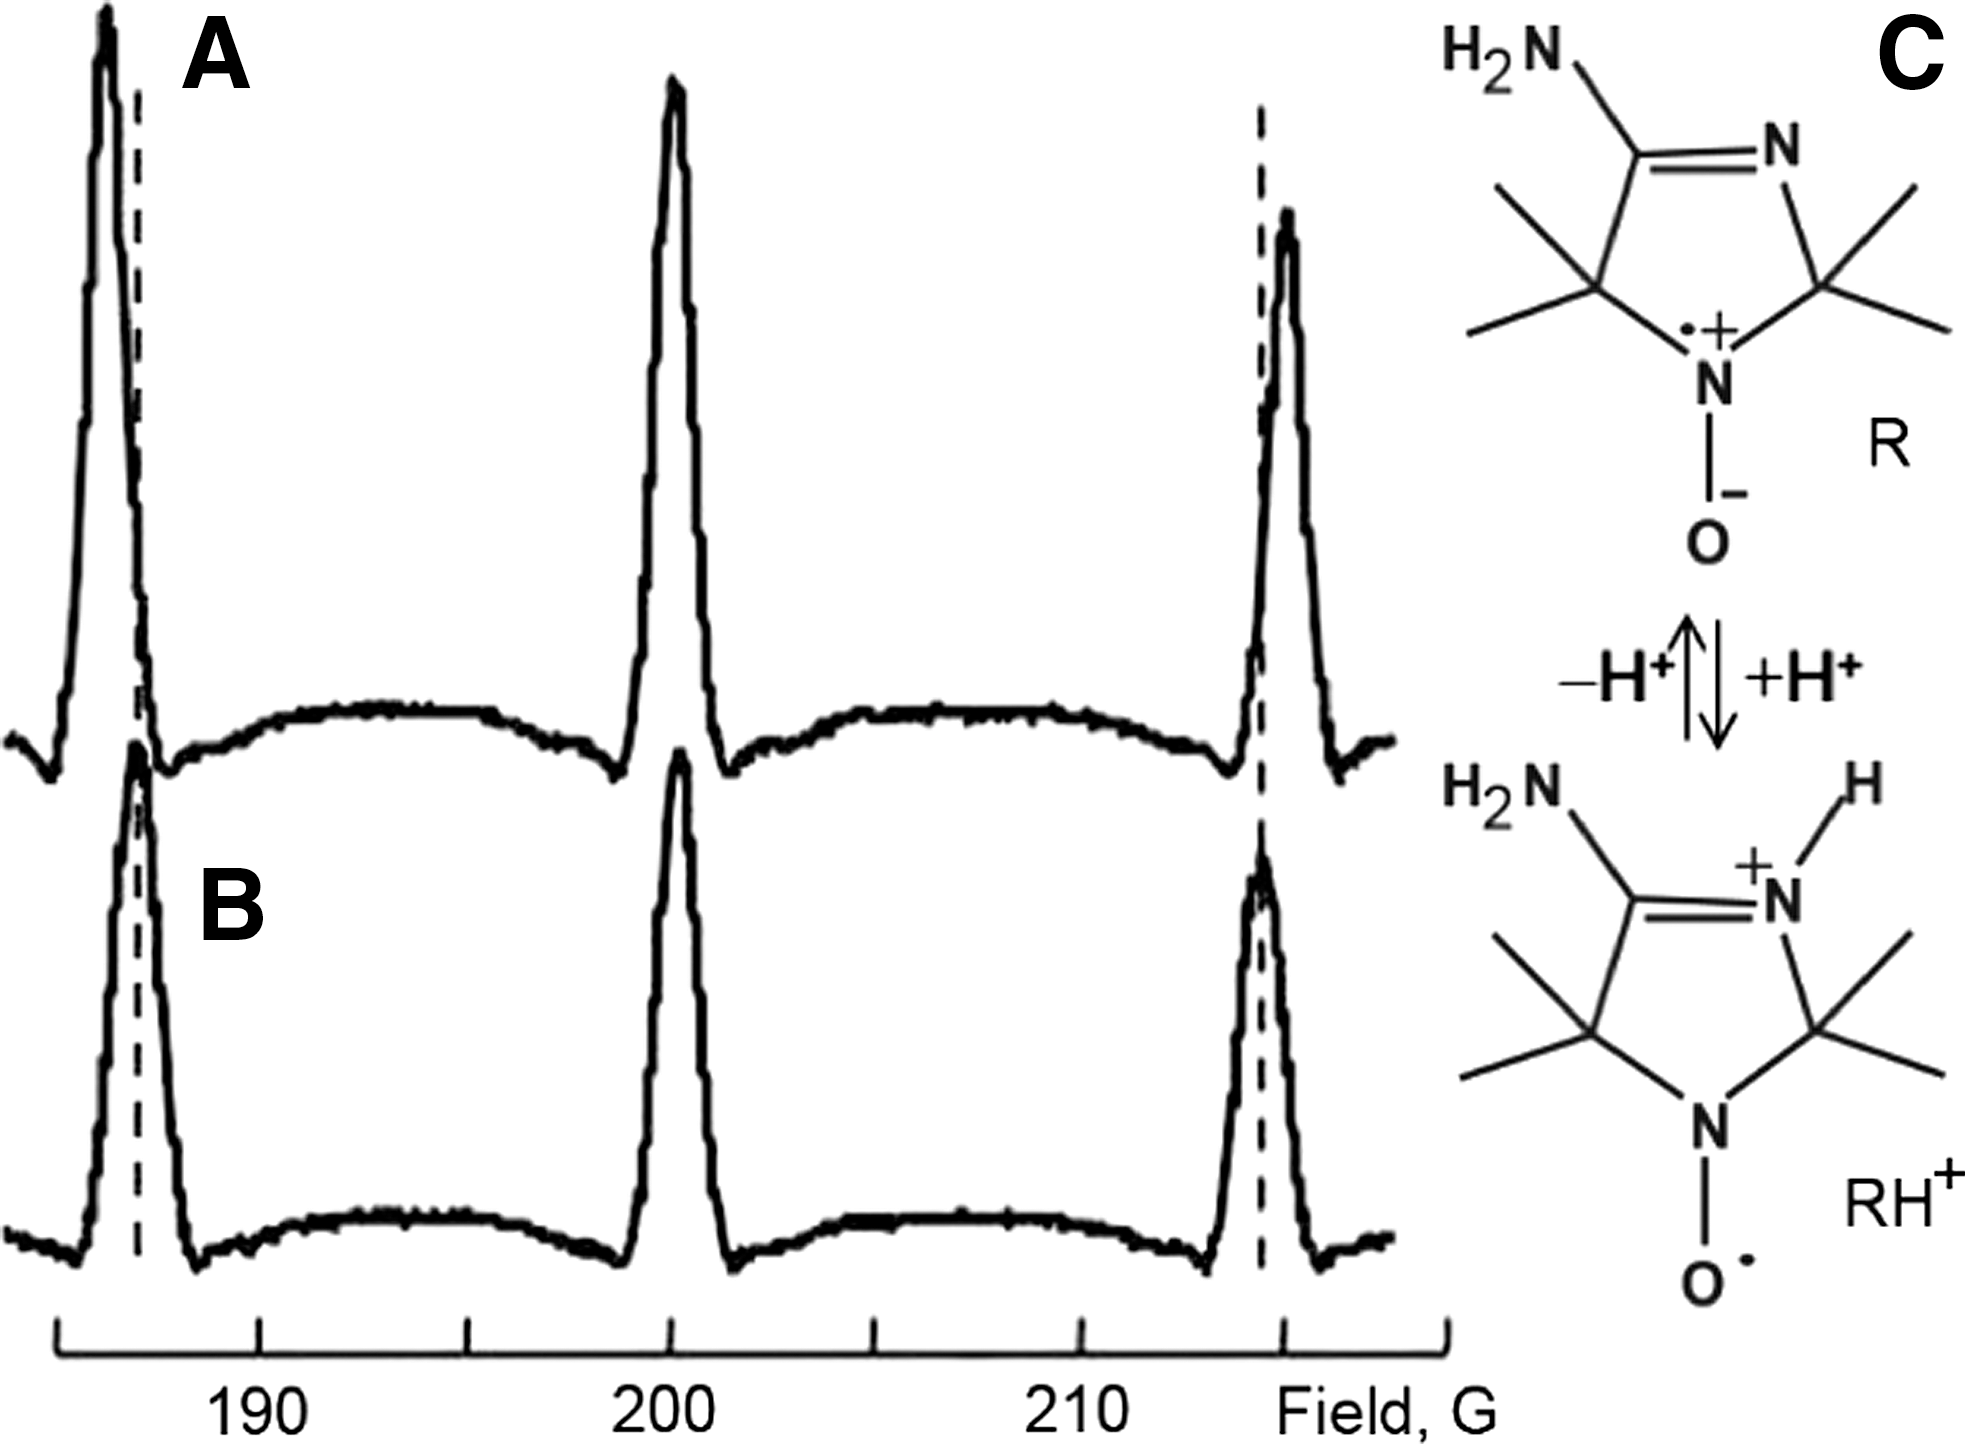
The chemical equilibrium shown in Figure 14 illustrates the effect of protonation of the atom N-3 of the radical heterocycle resulting in decreasing unpaired electron density at the nitrogen nucleus of the N-O fragment, and, as a consequence, in lowered hfs for the RH+ form. Note that at low EPR frequency, 563.2 MHz in Figure 14, the three lines of the spectrum are unequally spaced due to the Breit–Rabi effect (13, 102).
The pH-dependent DNP spectral changes allow for preferable excitation of EPR resonances of R or RH+ forms of the nitroxide NR1 as illustrated in Figure 15 for the phantom sample of the two tubes filled with an aqueous solution of NR1 titrated to alkaline and acidic pH values. The stepped variation of the EPR irradiation field, BEPR , resulted in the subsequent changes in image intensity with the maximal image intensities of alkaline (predominantly R form) and acidic (predominantly RH+ form) solutions when BEPR is equal to 83.2 G and 84 G, respectively. Note that the observed 0.8 G difference in BEPR values between the brightest images of R and RH+ forms is in excellent agreement with the maximal pH-dependent change of hfs shown in Figure 14.
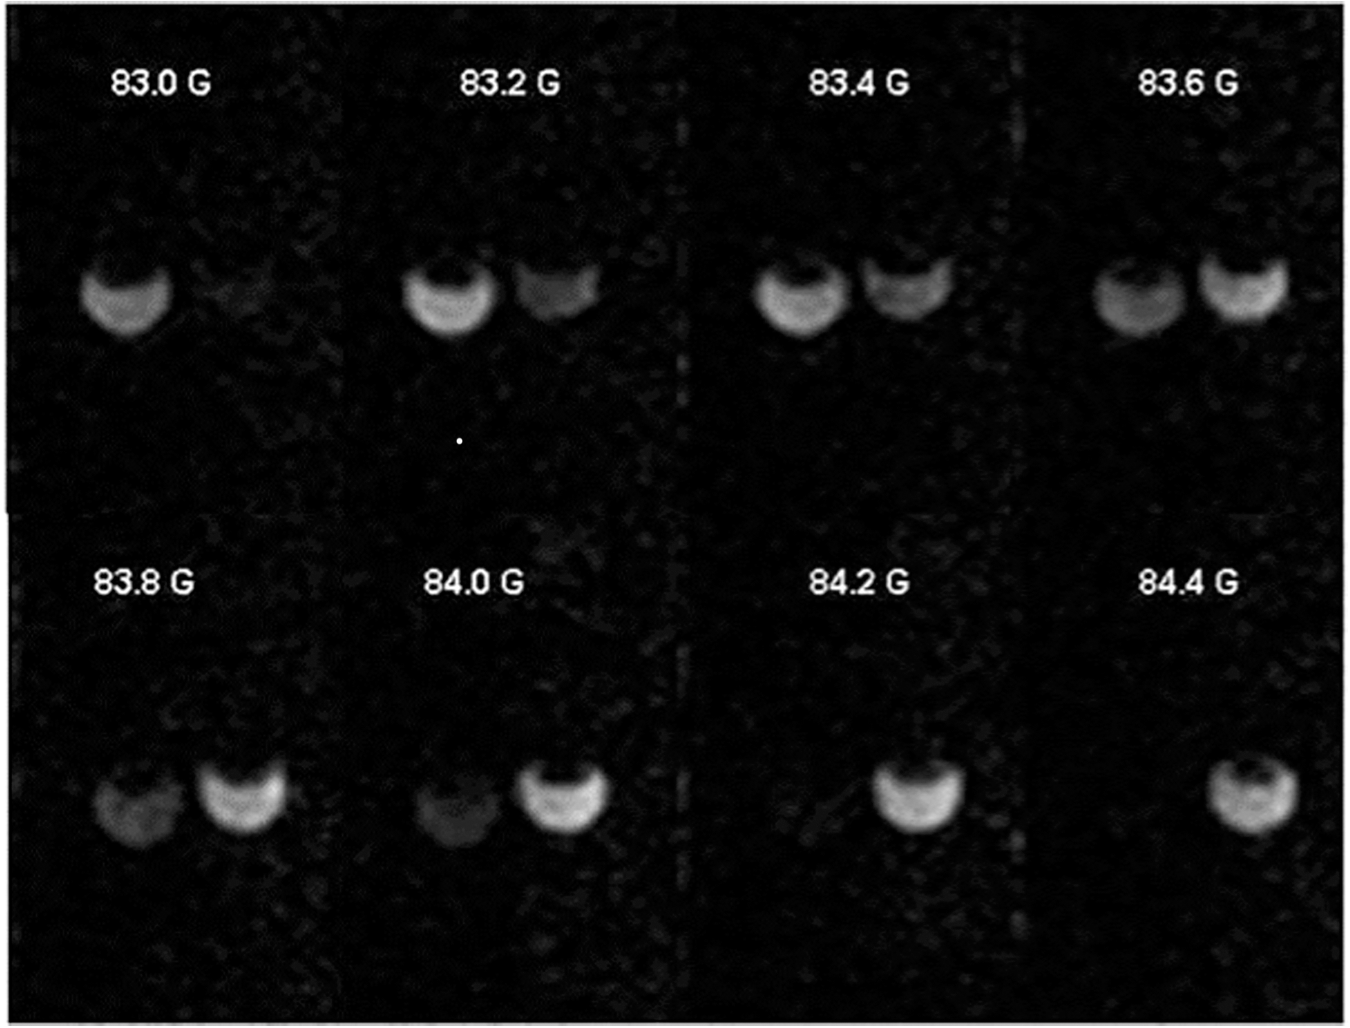
Based on the data shown in Figure 15, EPR excitation at the field values that coincide with DNP spectral peak positions of RH+ and R forms of the probe will generate two PEDRI images with signal intensities that are proportional to the concentrations of the corresponding ionization states of the probe. Taking into account that the ratio of concentrations of protonated and nonprotonated forms of the probe is directly related to pH ([RH+]/R) = ([H+]/Ka), this provides an opportunity to convert these two PEDRI images into a pH map.
Alternatively to VF PEDRI, the VRF PEDRI approach uses a stationary magnetic field but different EPR radio frequencies (RF). The ratio of Overhauser enhancements measured at each pixel at two different excitation frequencies corresponding to the resonances of protonated and deprotonated forms of a pH-sensitive nitroxide is converted to a pH map by using a corresponding calibration curve. Elimination of FC decreased the acquisition time by exclusion of the periods of ramping and stabilization of the magnetic field. Improved magnetic field homogeneity and stability allowed for the fast MRI acquisition modalities such as fast spin echo. In total, about a 30-fold decrease in EPR irradiation time was achieved for VRF PEDRI (2.4 s) (69) compared with VF PEDRI (70 s) (33), as tested with similar aqueous solutions of the NR1 radical. This is particularly important for in vivo applications enabling one to overcome the limiting stability of paramagnetic probes and sample overheating by reducing RF power deposition.
To perform PEDRI pHe mapping of TME, there is a need for paramagnetic pH probes that meet the following requirements: (i) appropriate pKa values in the range from 6.1 to 6.9 that allow pH measurements of slightly acidic TME pH values; (ii) comparatively narrow linewidth to obtain a high enhancement and decreased RF power deposition; (iii) sufficient stability of paramagnetic fragments in a highly reducing tumor microenvironment; and (iv) a hydrophilic structure that ensures extracellular probe localization. The nitroxide NR1 used to prove the concept of VF and VRF PEDRI (33, 69) has a very short life-time in vivo due to its fast reduction to the corresponding hydroxylamine and its applications in vivo are hardly possible.
The nitroxide NR2 represents the structure (Fig. 16a) of a paramagnetic pH probe carefully designed for in vivo monitoring of pHe in TME. The pKa value of the probe has been tuned by a variation of substitute at position 4 of the radical heterocycle, resulting in an optimal range of pH sensitivity centered at slightly acidic pHe of TME (pKa = 6.6 at 37°C). Partial deuteration of the NR2 resulted in the narrowing EPR line (1.2 G for NR2 vs. 2.1 G for undeuterated analog) required for efficient saturation by RF irradiation, which is of critical importance for obtaining higher PEDRI enhancement and allowing for a shorter acquisition time. The bulky ethyl substitutes at positions 2 and 5 of the radical heterocycle of the NR2 serve to protect the paramagnetic NO fragment against bioreduction, significantly enhancing its biostability. Extracellular localization of the probe has been achieved by binding the nitroxide label to hydrophilic tripeptide, glutathione, preventing the resulting NR2 probe from diffusion across the hydrophobic lipid bilayer of the biomembranes and, therefore, enforcing probe localization in extracellular aqueous volumes (108).
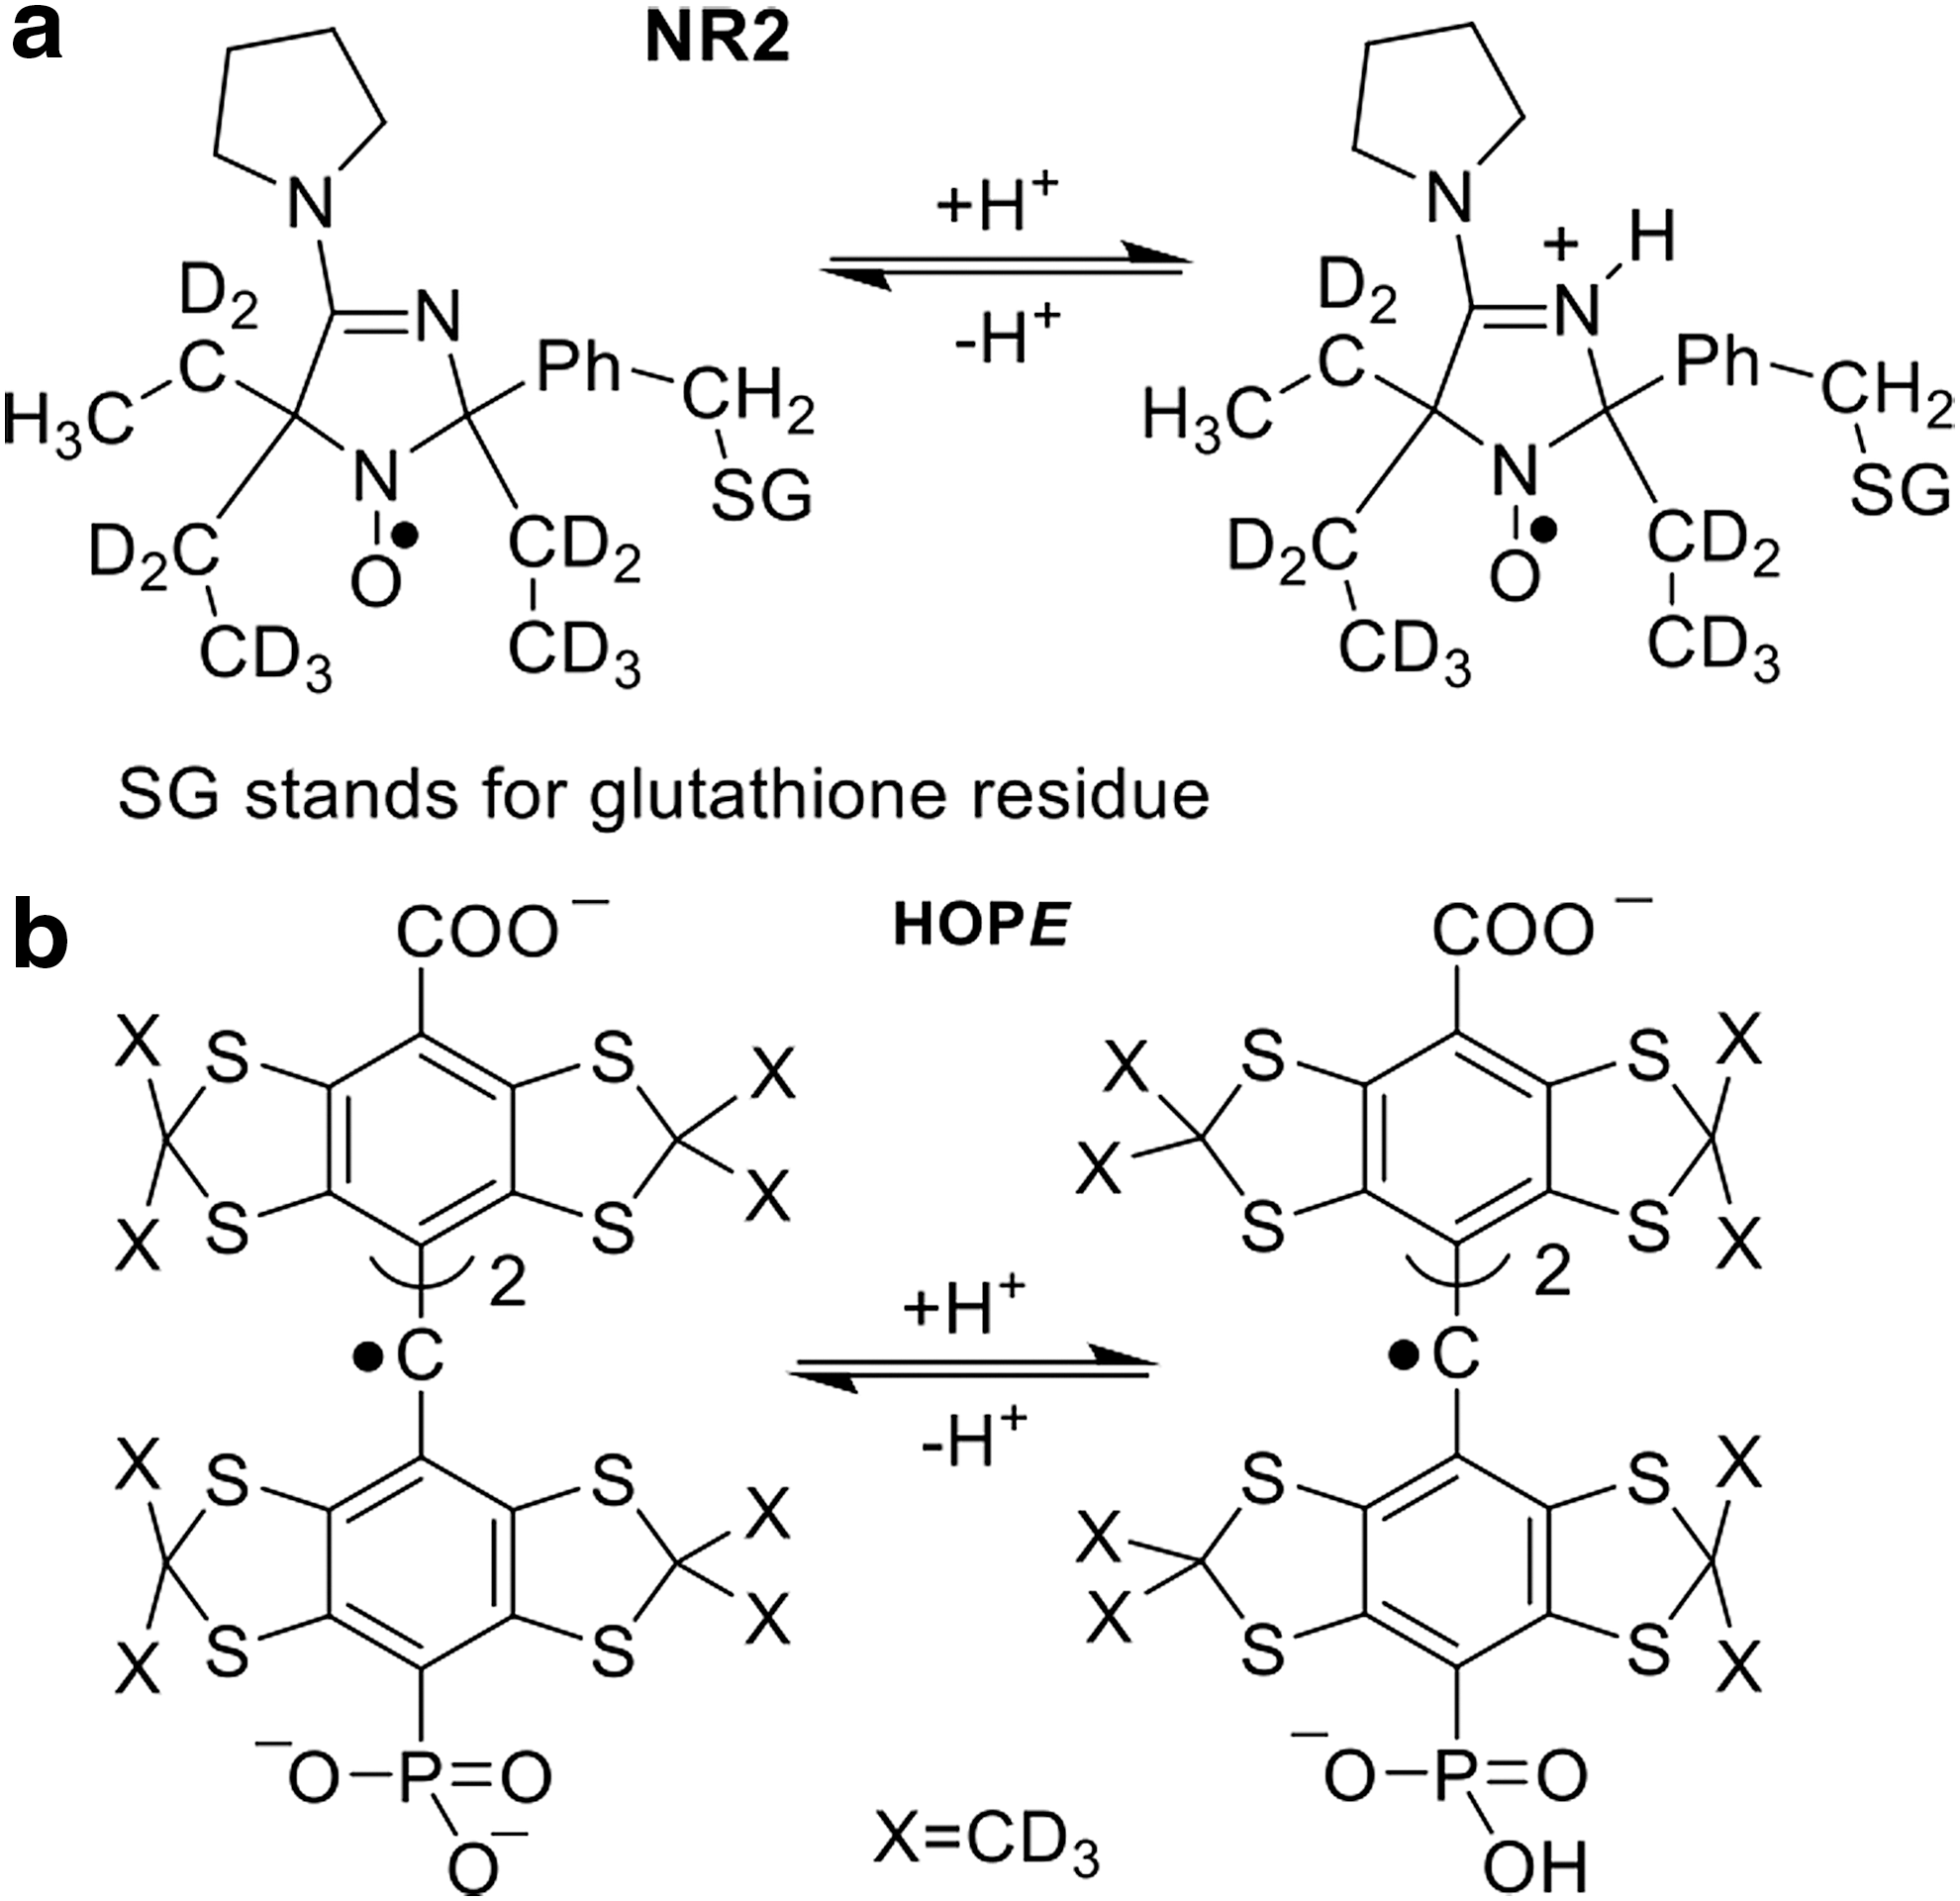
Figure 17A–D shows the pH calibration of the NR2 probe using VRF PEDRI obtained for a 10-tube phantom (Fig. 17a) containing the NR2 solutions of different pH values. EPR frequencies were preselected to correspond to the maximal NMR intensities of R and RH+ forms. A fast spin echo sequence has been applied with an acquisition time of 8.4 s for each image (Fig. 17B, C). The EPR off image was subtracted from both EPR on images acquired at RF1 and RF2, yielding image intensities, I(RF1) and I(RF2), respectively. The pH dependence of intensities ratio I(RF1)/(I(RF1)+I(RF2)) shown in Figure 17D is described by the titration curve with the observed pKa value of NR2 probe equal to 6.75 ± 0.05 in agreement with the EPR-measured pKa value, 6.74 ± 0.05 (108).
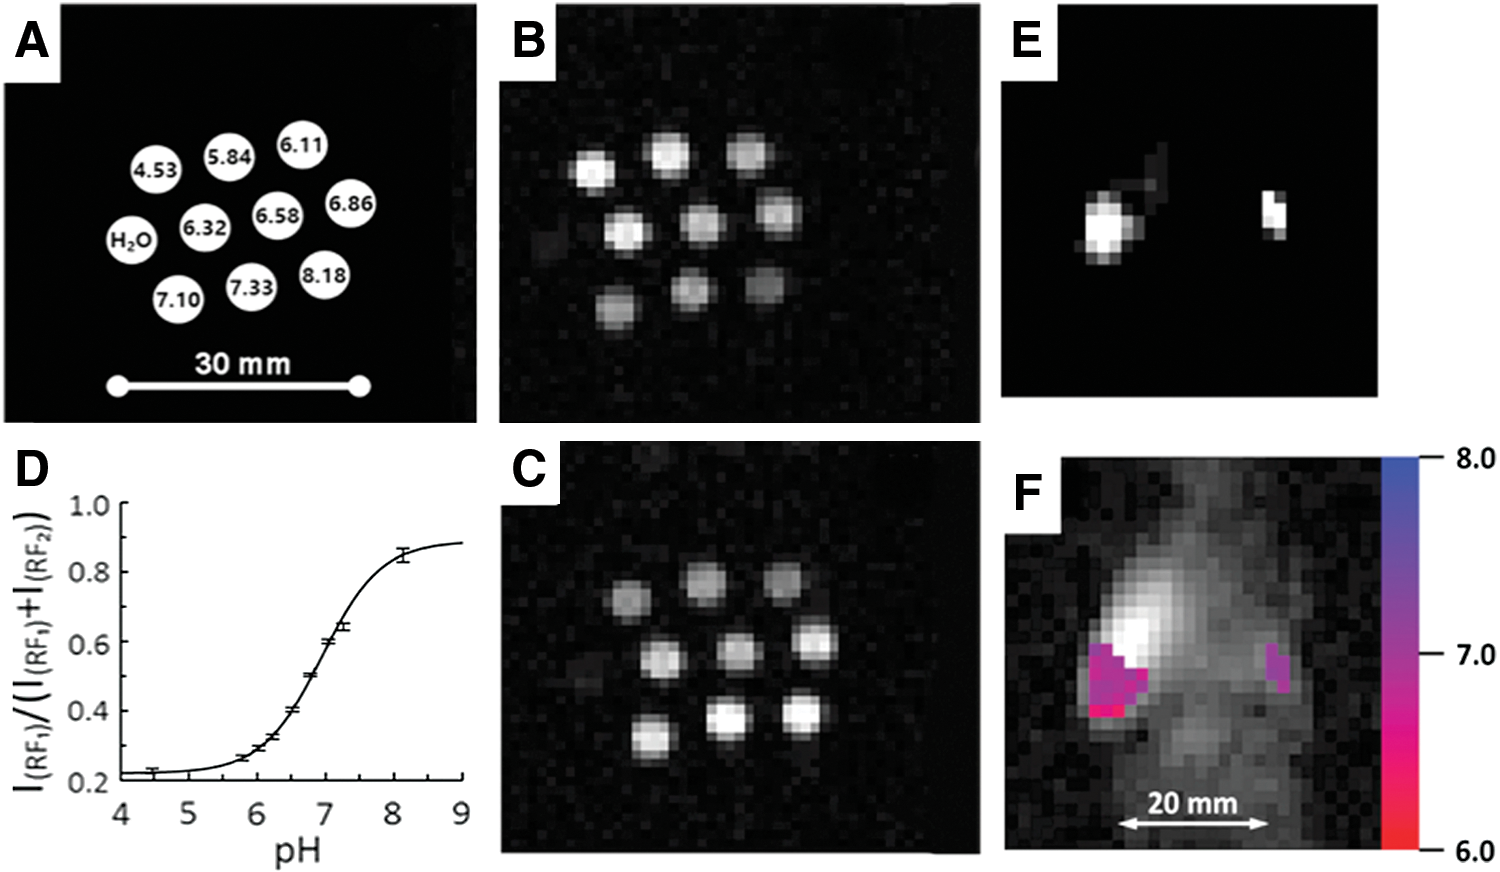
Figure 17E, F demonstrates the application of VRF PEDRI for pHe mapping of living tissue in the tumor-bearing mouse by using the NR2 radical. Two PEDRI images are acquired during 8.4 s EPR irradiation at two preselected EPR frequencies, which correspond to EPR resonances of RH+ and R forms of deuterated NR2 probe. The ratio of the signal intensities of these two images corresponds to the [RH+]/[R] ratio, therefore allowing the conversion of two PEDRI images into a pH map by using the calibration curve shown in Figure 17D. The probe distribution area in tumor (Fig. 17E left) is about 1 cm2, which is close to the value of the tumor cross-sectional area (the measured tumor size is about 1.2 × 0.9 cm), therefore supporting probe localization within the tumor. The probe distribution area in the mammary gland (Fig. 17E right) is less than 0.2 cm2, being close to its size. Figure 17F shows a pH map (in color) superimposed with low-field MRI (gray scale) representing the coronal view of the mouse. The broader pHe distribution in tumor in the range from 6.4 to 7.1 compared with pHe distribution in the mammary gland from pH 7.0 to 7.2 was observed in agreement with high heterogeneity of the tumor microenvironment. Average values of pHe in tumor and mammary gland were found to be 6.8 ± 0.1 and 7.1 ± 0.1, respectively, supporting significant tumor tissue acidosis. Note that a sufficiently slow reduction of the NR2 even in highly reducing tumor tissue (half-life of about 5 min) allowed for quantitative assessment of spatially resolved information on tissue-reducing capacity in complement to pH measurements (12) by mapping decay of the PEDRI signal at each pixel. Therefore, the same pH probe can be used for simultaneous mapping of pH and redox status.
Trityl radicals have advantages over nitroxides for in vivo PEDRI applications due to their extraordinary high stability in living tissues and long relaxation times, allowing for a maximum saturation with limited RF power deposition. These compounds were first developed for biomedical applications by Nycomed Innovation (119) and have been used for in vivo EPR (34) and PEDRI oximetry (75). In addition, trityl derivatives containing amino (27) or phosphono groups (26) demonstrate dual function oxygen and pH spectral sensitivity. Recently, trityl probe with spectral sensitivity to pH, pO2, and Pi (inorganic phosphate) in an extracellular tissue microenvironment (termed HOPE probe, see Fig. 16b) has been synthesized (10, 26) and used for concurrent multifunctional assessment of TME in tumor-bearing mice by using low-field EPR spectroscopy (11). In our opinion, the PEDRI approach in combination with the HOPE probe provides an opportunity for multifunctional mapping of a tissue microenvironment in living subjects.
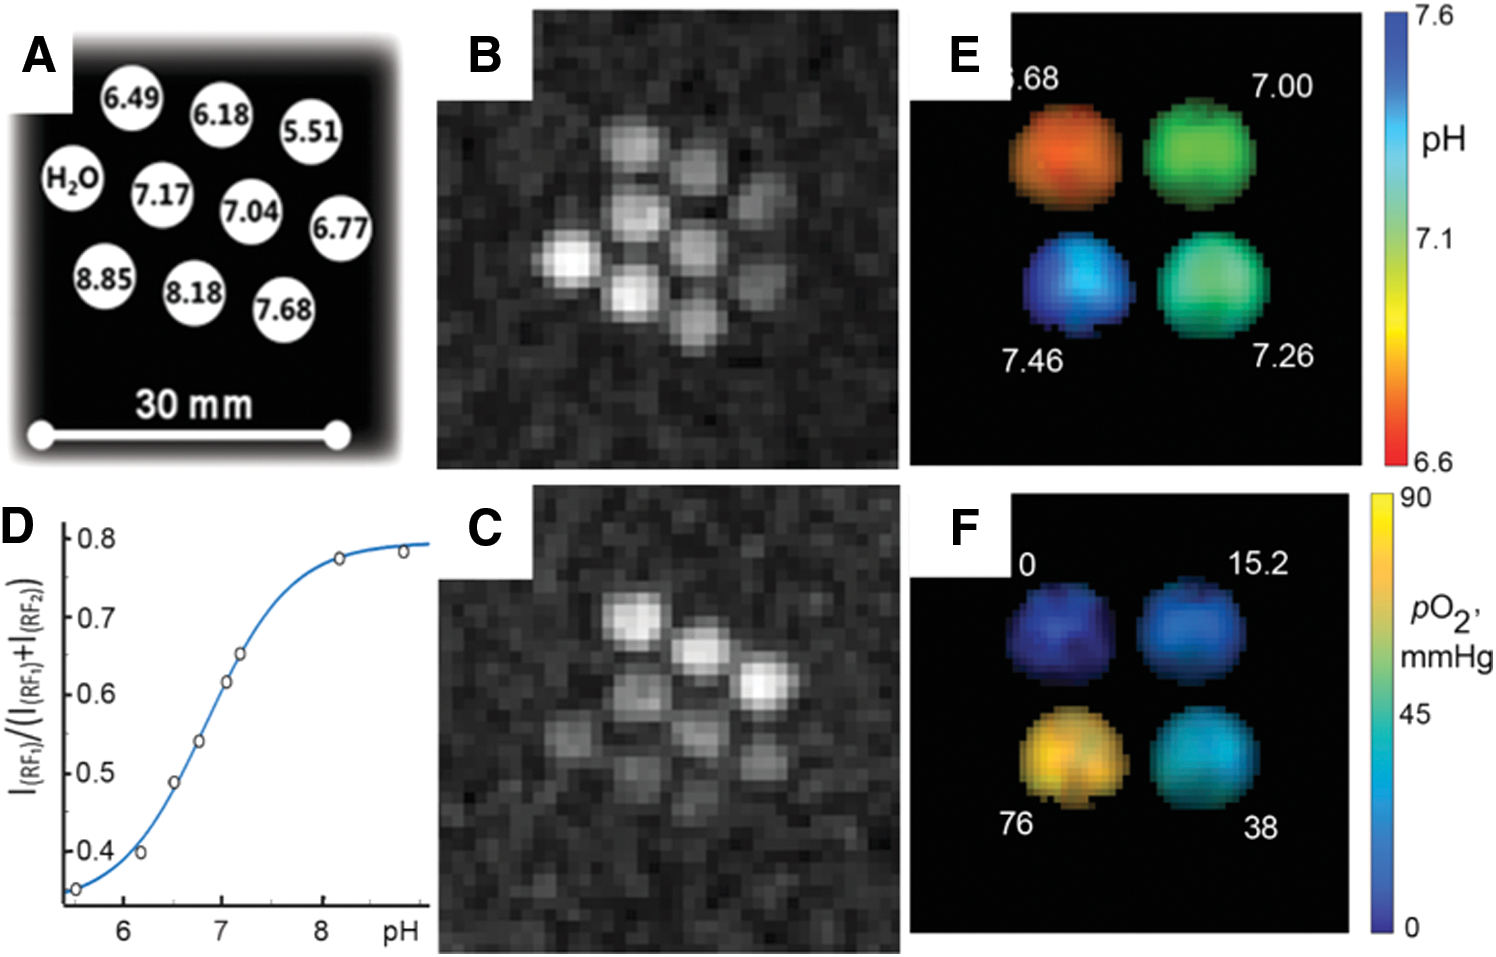
Figure 18A–D shows VRF PEDRI pH calibration performed by using a phantom sample containing anoxic solutions of the HOPE probe at different pH values. Acquisitions of two PEDRI images obtained with EPR irradiations at two preselected EPR frequencies that correspond to maximal NMR intensities of R and RH+ forms of the HOPE probe (Fig. 16) allow one to calculate the pH calibration curve shown in Figure 18D (cf. with Fig. 17A–D for the NR2) (122). In case of dual pH and oxygen mapping, the number of acquisitions has to be extended by the addition of PEDRI images acquired at different RF powers to assess oxygen concentration (75). Figure 18E, F illustrates dual-function pH and pO2 mapping of a phantom consisting of four tubes prepared with different pH and oxygen concentrations and obtained by acquisition of a total of four PEDRI images at different EPR frequencies (x2) and different RF powers (x2). The conversion of these images to pH (Fig. 18E) and oxygen (Fig. 18F) maps with spatial resolution of 0.6 mm and field of view 40 × 40 mm2 provides functional accuracy of about 0.05 pH units of pH and 3–4 mmHg of pO2 for the physiologically relevant pH and oxygen ranges. The calculated mean values of pH and pO2 are in reasonable agreement with the experimental ones. Note that acquisition of additional PEDRI images at intermediate EPR frequency, (RF1+RF2)/2, may provide information on the spatial distribution of phosphate due to the fact that Pi facilitates proton exchange between R and RH+ forms of the HOPE probe, therefore resulting in appearance of EPR signal intensity at the intermediate EPR frequency (see review (68) for details).
In summary, VF and VRF PEDRI techniques in combination with functional paramagnetic probes offer an opportunity for the mapping of specific parameters of a local chemical microenvironment, including measurements in vivo. Application of multifunctional radicals such as HOPE probes can further extend the capability of PEDRI for concurrent mapping of several chemical parameters of a local microenvironment.
Conclusions
PEDRI has been developed since the 1980s as a free radical imaging method based on the Overhauser effect. It has proved to be applicable to in vivo imaging by introducing optimal tracers and pulse sequences. The possibility of generating high-resolution PEDRI images with corresponding anatomical images has realized the quantitative measurement of pO2, tissue permeability, redox status, and pH. Such functional information obtained from PEDRI has been applied to various disease models, preclinically giving insights into the pathology and etiology of human disease.
Footnotes
Acknowledgments
This work was partially supported by NIH grants 1ZIABC010477-14 (MKC), CA194013 (VVK), CA192064 (VVK), and U54GM104942 (VVK); by KAKENHI grant 16H05113 (H.U.) from the Japan Society for the Promotion of Science (HU); and by start-up grant from the WVCTSI (VVK).