
Abstract
Aims:
Circadian rhythms permeate all levels of biology to temporally regulate cell and whole-body physiology, although the cell-autonomous mechanism that confers ∼24-h periodicity is incompletely understood. Reports describing circadian oscillations of over-oxidized peroxiredoxin abundance have suggested that redox signaling plays an important role in the timekeeping mechanism. Here, we tested the functional contribution that redox state and primary metabolism make to mammalian cellular timekeeping.
Results:
We found a circadian rhythm in flux through primary glucose metabolic pathways, indicating rhythmic NAD(P)H production. Using pharmacological and genetic perturbations, however, we found that timekeeping was insensitive to changes in glycolytic flux, whereas oxidative pentose phosphate pathway (PPP) inhibition and other chronic redox stressors primarily affected circadian gene expression amplitude, not periodicity. Finally, acute changes in redox state decreased PER2 protein stability, phase dependently, to alter the subsequent phase of oscillation.
Innovation:
Circadian rhythms in primary cellular metabolism and redox state have been proposed to play a role in the cellular timekeeping mechanism. We present experimental data testing that hypothesis.
Conclusion:
Circadian flux through primary metabolism is cell autonomous, driving rhythmic NAD(P)+ redox cofactor turnover and maintaining a redox balance that is permissive for circadian gene expression cycles. Redox homeostasis and PPP flux, but not glycolysis, are necessary to maintain clock amplitude, but neither redox nor glucose metabolism determines circadian period. Furthermore, cellular rhythms are sensitive to acute changes in redox balance, at least partly through regulation of PER protein. Redox and metabolic state are, thus, both inputs and outputs, but not state variables, of cellular circadian timekeeping. Antioxid. Redox Signal. 28, 507–520.
Introduction
M
Circadian rhythms in primary cellular metabolism and redox state have previously been proposed to play a role in the timekeeping mechanism. We tested this hypothesis, and found that although primary metabolism and redox signaling can function as both an input and an output of the cellular clockwork, they do not determine its period and are, thus, unlikely to constitute essential mechanistic timekeeping components. Importantly, we do find that PER2 stability is acutely sensitive to H2O2 transients, implicating this clock protein as a circadian effector of redox signaling.
Many of the individual “clock genes” and proteins that contribute to the fidelity of cellular timekeeping have been identified, and are believed to function in a delayed gene expression feedback loop whereby complexes containing the transcription factor BMAL1 activate the expression of period (1/2) and cryptochrome (1/2) genes, as well as other “clock-controlled genes,” such as the antioxidant regulator NRF2 (24, 54, 59). The encoded PER and CRY proteins form inhibitory complexes that eventually repress BMAL1-containing complex activity. The kinetics of this feedback inactivation are post-translationally regulated to give rise to persistent oscillations in the expression of clock and clock-controlled genes that occur with a period of ∼24 h. The precise cascade of molecular mechanisms that determines the period of these oscillations is incompletely understood (49), though it certainly involves the regulation of clock protein activity and stability by conserved kinases such as casein kinase 1δ/ɛ (43, 44). Various accessory feedback loops contribute to the fidelity and amplitude of circadian gene expression [e.g., (5, 42, 58)], whereas changes in circadian phase are effected by extracellular cues acting through several different signaling mechanisms (e.g., glucorticoid receptor, growth factor and G-protein receptor signaling) to stimulate acute changes in clock protein expression via intracellular signal transduction cascades (7, 8, 22, 65, 68).
Complicating this picture are recent observations that metabolic and redox pathways continue to exhibit circadian regulation in the absence of rhythmic clock gene expression (50, 51), suggesting the existence of an underlying post-transcriptional timekeeping mechanism [reviewed in ref. (56)]. Most notably, levels of redox co-factors and the abundance of over-oxidized peroxiredoxin (PRX-SO2/3) exhibit circadian regulation in isolated human and mouse erythrocytes (17, 51), which are naturally anucleate and, therefore, cannot be dependent on cycling clock gene transcription. Rhythms of PRX-SO2/3 and redox balance have been reported in vivo, as well as in cultured tissues and cells (27, 37), and also in other phylogenetic groups (4, 12, 32, 34, 46, 80). In addition, although PRX itself plays no timekeeping role (16), the activity of several clock proteins has been suggested to be redox sensitive (47, 57, 70, 81). Moreover, nuclear translocation of the antioxidant regulator NRF2 exhibits ultradian and circadian rhythms (54, 78), and SIRT1-mediated deacetylation of certain clock proteins is reported to be dependent on rhythmic availability of NAD+ (53, 58).
These observations suggest the possibility that redox-based oscillations may constitute a bona fide and conserved mechanism of the cellular clock in eukaryotes: a compelling hypothesis proposing that an as-yet uncharacterized post-translational oscillation in metabolism and redox balance reciprocally regulates clock gene expression to determine the period of the cellular circadian clock (60). Conversely, however, it is equally plausible that redox and metabolic rhythms are simply post-translational outputs of cellular clock function, and thus irrelevant to the timekeeping mechanism. A third possibility is that changes in metabolism and redox balance constitute a non-essential auxiliary cellular clock mechanism. In this case, they would be rhythmically regulated, with transient changes in metabolic activity and/or redox balance being competent to regulate the amplitude and phase of circadian gene expression, but not required to oscillate for the cellular timekeeping mechanism to function.
To distinguish between these three models, we used pharmacological and genetic approaches to perturb primary metabolic pathways and cellular redox balance, thereby assessing the causal relationships between cellular timekeeping and redox/metabolism. We found not only evidence for cell-autonomous circadian regulation of primary metabolism but also that inhibition of glycolysis alone had no major effect on the cellular clock. We further observed that the amplitude and phase of PER protein expression is sensitive to redox balance and oxidative pentose phosphate pathway (PPP) activity, but that the period of oscillation was essentially insensitive to these perturbations. Our data indicate that previously observed oscillations in cellular redox state are not required for the cellular clock to function, since the period of oscillation is robust against severe chronic oxidative as well as reductive stress.
Finally, we found that pulses of physiologically relevant concentrations of H2O2 elicited phase-dependent phase shifts, which strongly correlated with immediate changes in the expression level of the PER2 clock protein, providing a mechanistic basis for understanding how transient redox signals may contribute to cellular clock regulation under more physiological settings. We, therefore, conclude that redox signaling is not essential to the cellular timekeeping mechanism (i.e., it is not a state variable of the oscillation) but that it does function as both an input and an output of the circadian clockwork.
Results
Cell-autonomous rhythms of glucose catabolism drive rhythmic NAD(P)H generation
Circadian rhythms in the levels of several redox co-factors, primary metabolites, and the abundance of over-oxidized PRX have been observed in several cultured mammalian cells and tissues, as well as in vivo (17, 51, 53, 56). Here, we set out to test the relationship between circadian timekeeping, redox balance, and metabolic flux (Supplementary Fig. S1; Supplementary Data are available online at
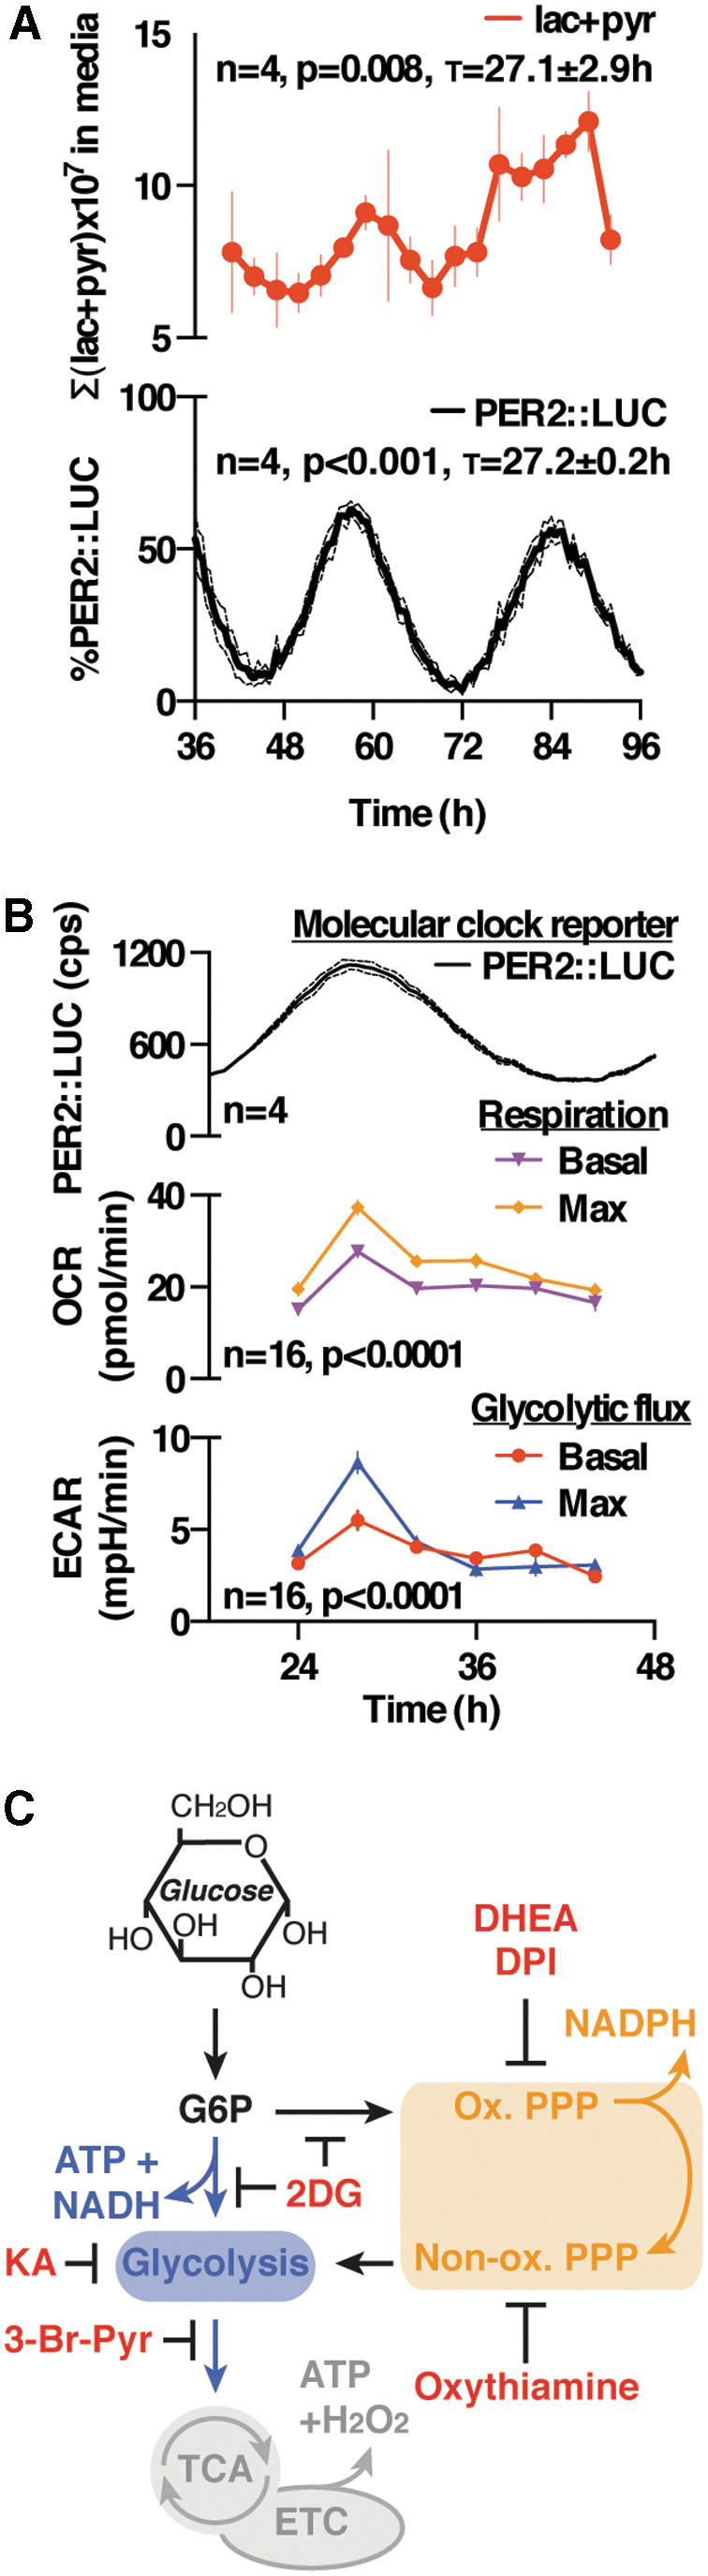
Cytosolic redox homeostasis is a dynamic equilibrium that is ultimately dependent on the rate of production of oxidizing reactive oxygen species (ROS) and reducing equivalents in the form of NADPH (and to a lesser extent NADH), which are primarily determined by rates of primary metabolic flux (23). Isotopic labeling of glucose is a sensitive method for the measurement of metabolic flux, since pathway fluxes can be interpolated from the abundance and label distribution of glycolytic end products, lactate and pyruvate (13, 18, 19, 25). In longitudinal assays of PER2::LUC fibroblasts, continuously perfused with media containing labeled glucose and luciferin, we detected a rhythm in total media lactate and pyruvate production (measured by liquid chromatography coupled to mass spectrometry [LC-MS] analysis) that peaked approximately at the same time as PER2 (Fig. 1A). This correlated with an increase in media acidification (extracellular acidification rate [ECAR]: reporting glycolytic rate) and respiration (oxygen consumption rate [OCR]: reporting respiratory rate) measured by extracellular flux analysis, indicating that primary metabolic flux is, indeed, clock regulated and peaks during what corresponds to the active phase in vivo (Fig. 1B), and in agreement with prior indications in the human U2OS cell line (2).
We then investigated whether circadian glucose catabolism is actively regulated in our PER2::LUC fibroblasts. At the beginning of glucose catabolism, there occurs a branch point that directs glucose-6-phosphate toward glycolysis (producing ATP and NADH), or the PPP, which produces reducing equivalents in the oxidative portion (NADPH) as well as biosynthetic intermediates during the non-oxidative portion (Fig. 1C). Using 13C-based flux analysis (Supplementary Fig. S1), we tested whether dynamic rerouting of metabolic flux occurred between glycolysis and the PPP over the circadian cycle.
We found no significant rhythm in the relative proportion of glucose catabolism between the two pathways (Supplementary Fig. S2A). This suggests that any rhythm in the NADP+:NADPH redox couples (51, 61) must occur passively, as a function of changes in co-factor oxidation and/or overall changes in glucose utilization. We also detected no significant rhythm in the ratio of lactate:pyruvate (Supplementary Fig. S2A), which is reflective of the free NAD+:NADH ratio (19), indicating that previously reported rhythms of NAD+:NADH may not represent the freely available pool. Critically, however, our observations indicate that the rate of production of NADH and NADPH shows a circadian rhythm in these cells, which is the greatest around the same phase as peak PER2 levels. This means that the generation of reductive potential is highest at the same time as maximal mitochondrial activity, based on our OCR measurements.
Glucose catabolism primarily determines the amplitude of circadian gene expression, not its period, via the PPP
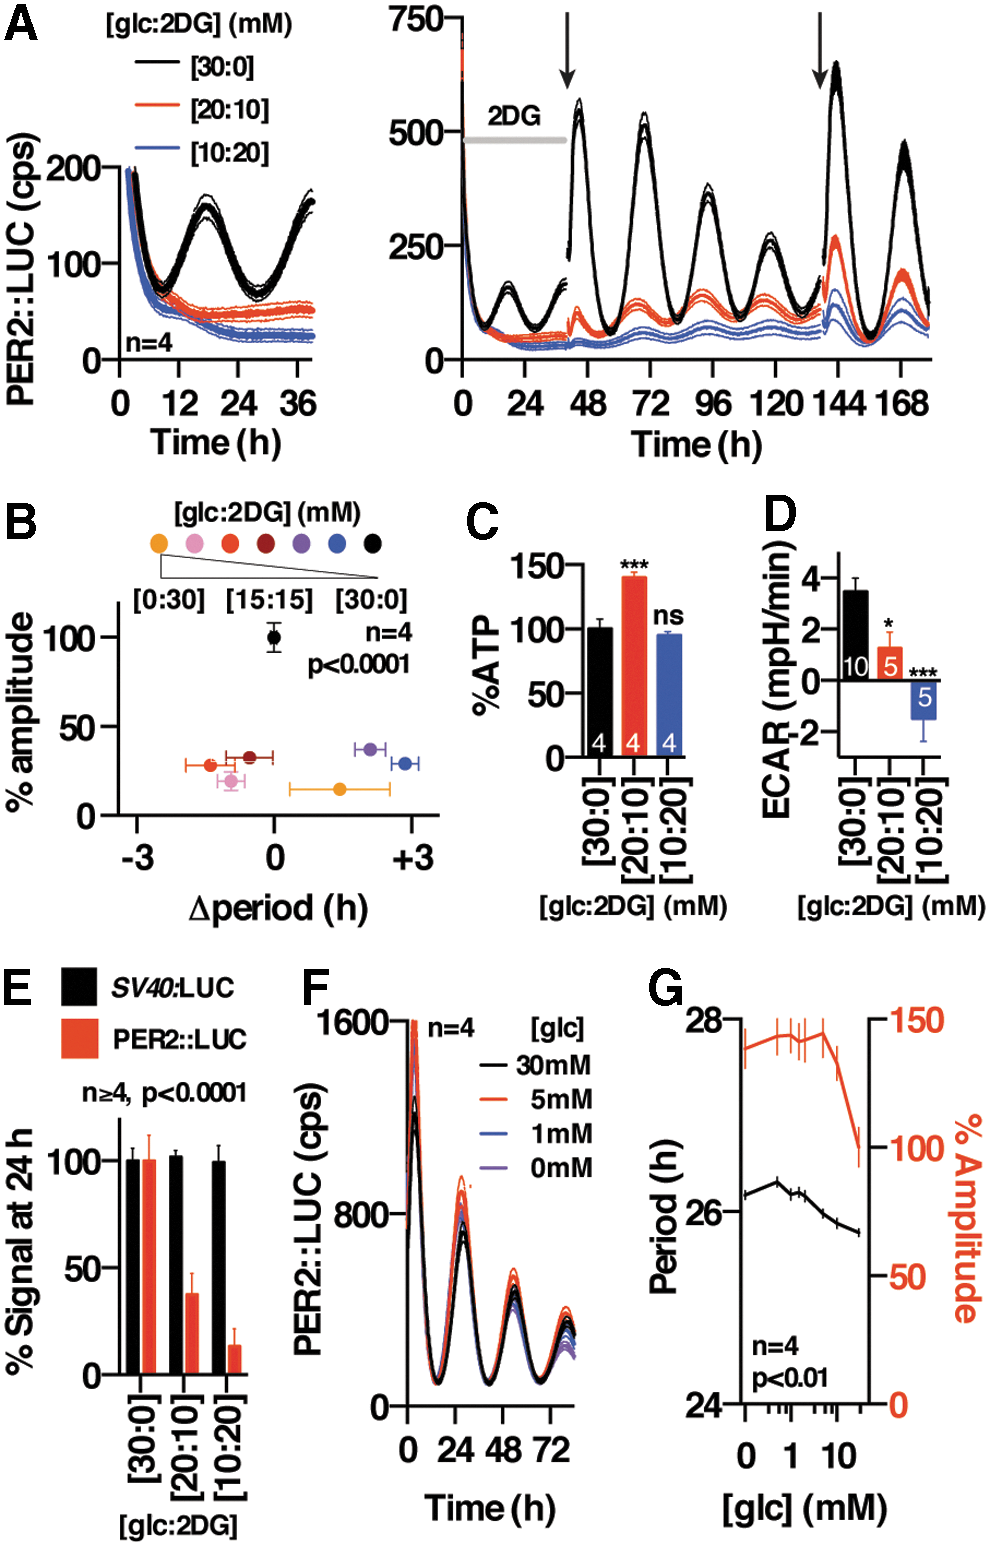
We next asked whether rhythmic glucose catabolism and NAD(P)H production were, in fact, required for cellular timekeeping, or might instead be a consequence of it. We treated cells with 2-deoxyglucose (2DG), an anti-metabolite that is phosphorylated by hexokinase to produce 2DG-6-P, which dose dependently inhibits downstream flux through both glycolysis and the PPP (10) (Figs. 1C and 2D, and Supplementary Fig. S2B–E). We observed that 2DG elicited a profound and dose-dependent suppression of PER2::LUC rhythms (Fig. 2A, B, and E), whereas effects on period were small, inconsistent, and difficult to quantify reliably due to rapid damping. Oscillations recovered gradually on changing cells back into normal (2DG-free) media (Fig. 2A), indicating that the damping of PER2 rhythms was not due to cytotoxicity, with the slow recovery presumably being attributable to intracellular 2DG-6-P accumulation. We observed very similar results in additional cell lines (human U2OS cells and mouse NIH3T3 cells) expressing two different bioluminescent reporters for clock gene transcription (Per2:LUC and Bmal1:LUC, respectively) (Supplementary Fig. S3). Importantly, ATP levels in cells treated with 2DG for 3 days were not decreased (Fig. 2C) and actually increased at one concentration, as also occurs during Mg2+ depletion (28); and 2DG treatment had only a very modest effect on bioluminescence levels in cells expressing firefly LUC under the constitutive SV40 promoter (Fig. 2E and Supplementary Fig. S3B, E). In addition, we observed that depletion of glucose from the media did not phenocopy the effects of 2DG, instead eliciting a slight but significant increase in circadian period (Fig. 2F, G), as previously (40). We, therefore, conclude that 2DG treatment impacts clock gene amplitude through a different mechanism than glucose starvation, and it is not an artifact of LUC inhibition, ATP depletion, or general inhibition of gene expression.
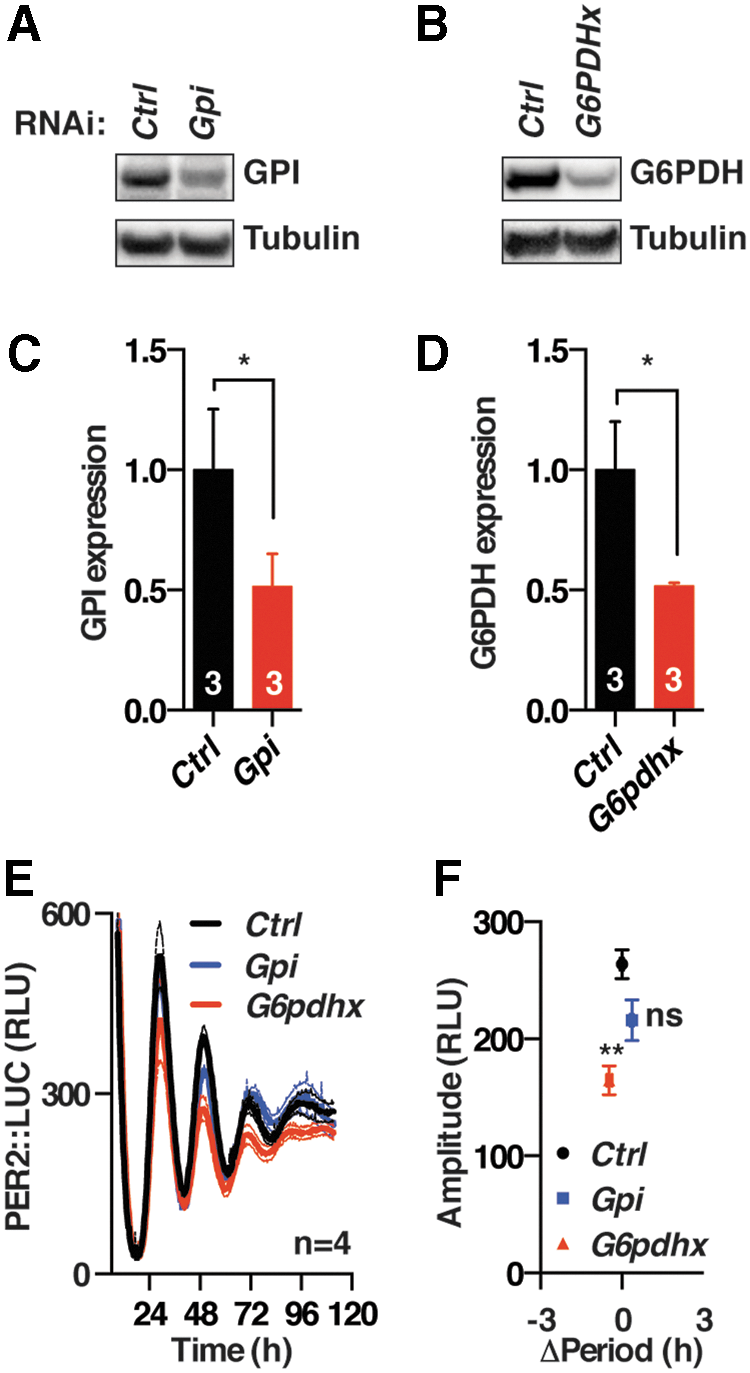
We next asked whether the effect of 2DG treatment might be attributable to its action on the glycolytic pathway or PPP. Genetic knockouts of glycolytic and PPP enzymes are cytotoxic and so to accomplish this we employed transient RNAi knockdown of either glucose-6-phosphate dehydrogenase (G6pdh) or phosphoglucose isomerase (Gpi), the enzymatic gatekeepers of the PPP and glycolytic pathways, respectively. Although cellular levels for both proteins were reduced by ∼50%, we observed that only knockdown of G6pdh elicited a significant reduction in PER2 levels, whereas Gpi knockdown did not (Fig. 3). This was accompanied by a significant but small shortening of period by 0.6 ± 0.1 h (t-test, p = 0.001), which we do not consider to be noteworthy (see the section “Materials and Methods”).
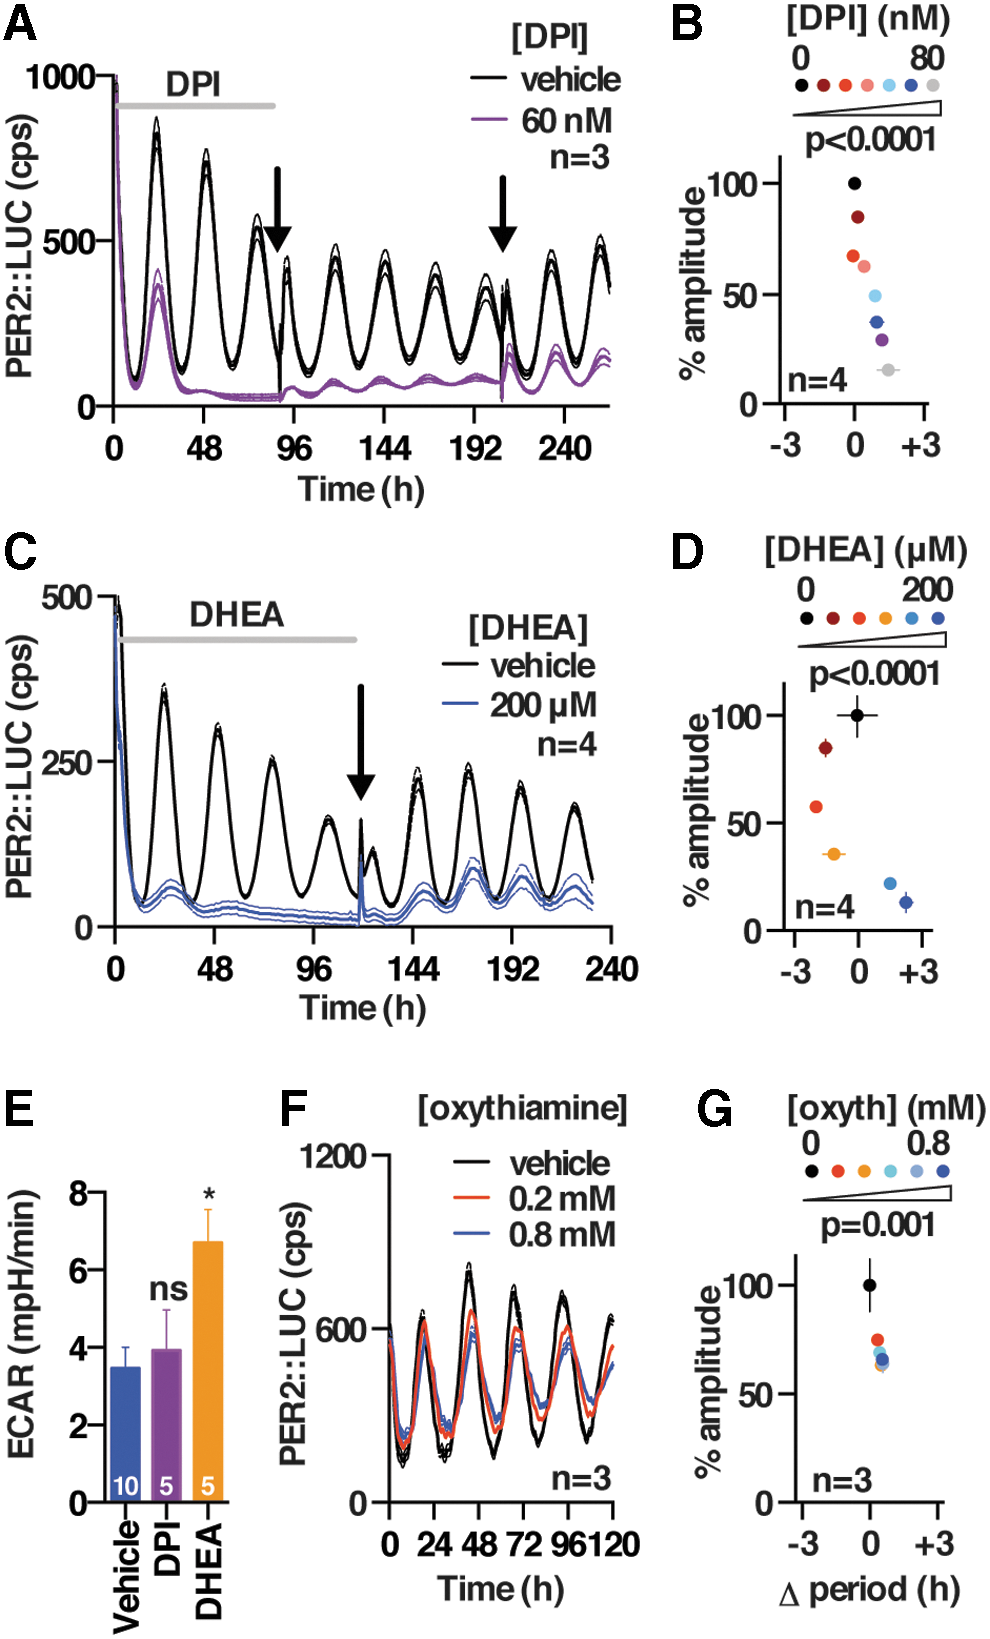
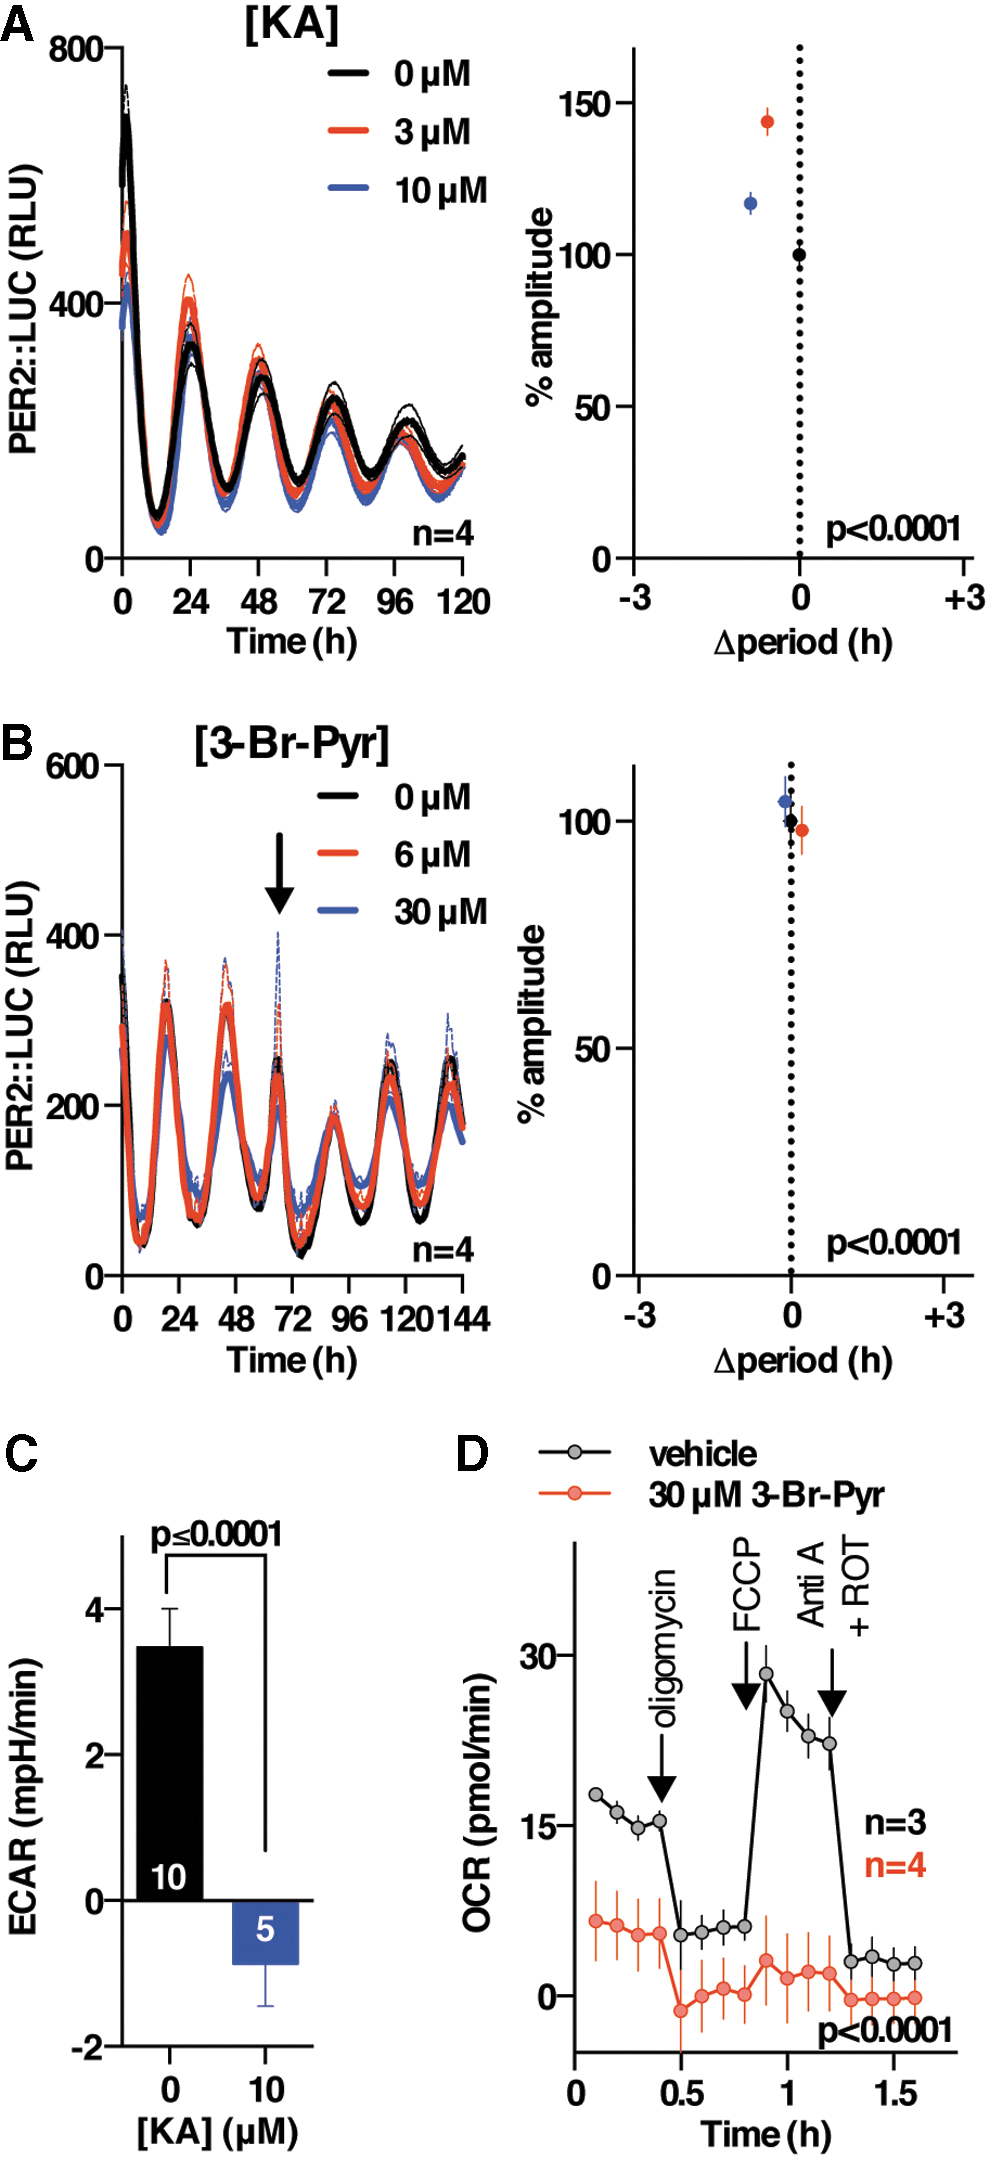
The activity and abundance of essential metabolic enzymes is typically much greater than cellular demand, explaining why reduced enzyme levels might not elicit as strong an effect as 2DG treatment, and we, therefore, sought to test whether the greater sensitivity of PER2 oscillations to PPP over glycolytic activity, indicated by genetic knockdown, could be validated by using pharmacological approaches. We found that inhibitors of the oxidative PPP (flavoprotein inhibitor diphenyleneiodonium [DPI; (62)] and G6PDH inhibitor dehydroepiandrosterone [DHEA; (31)] consistently phenocopied the effect of 2DG in all three cellular models (Fig. 4A–E and Supplementary Fig. S4A, B, F, and G), whereas selective inhibition of the non-oxidative PPP (oxythiamine; Fig. 4F, G, and Supplementary Fig. S4C–E) did not. Since DPI and DHEA belong to different classes of drugs and inhibit PPP flux by different mechanisms, our results suggest that PPP flux can regulate the level of cellular clock gene expression. In contrast, we found that selective, established inhibitors of different glycolytic enzymes (GAPDH inhibitor koningic acid [KA; (66)] and pyruvate analog 3-bromopyruvate (55) did not elicit a decrease in the amplitude of clock gene expression and evoked small, inconsistent effects on circadian period in the three different and independent cellular models that were employed (Fig. 5 and Supplementary Fig. S5). Importantly, the action and selectivity of the glycolytic versus PPP flux inhibitors was confirmed by LC-MS-based metabolic tracing (Supplementary Fig. S2B–E), where we confirmed major effects of each glycolytic and PPP inhibitor on flux through the PPP and glycolysis, respectively, as well as effects on NADH availability and glucose utilization (Supplementary Fig. S2B–E).
Thus, genetic and pharmacological evidence suggests that the amplitude of circadian gene expression oscillations is differentially sensitive to oxidative PPP compared with glycolytic activity. Critically, the effect of severe and chronic metabolic inhibition on circadian period was very modest and also inconsistent between our different cellular models. This is hard to reconcile with models in which metabolic/redox oscillations play essential and conserved roles within the circadian timekeeping mechanism, but it does suggest that PPP activity may have an accessory role in regulating clock amplitude. We, therefore, wondered how PPP inhibition might impact circadian gene expression cycles.
Redox balance primarily affects clock gene expression amplitude, not circadian period
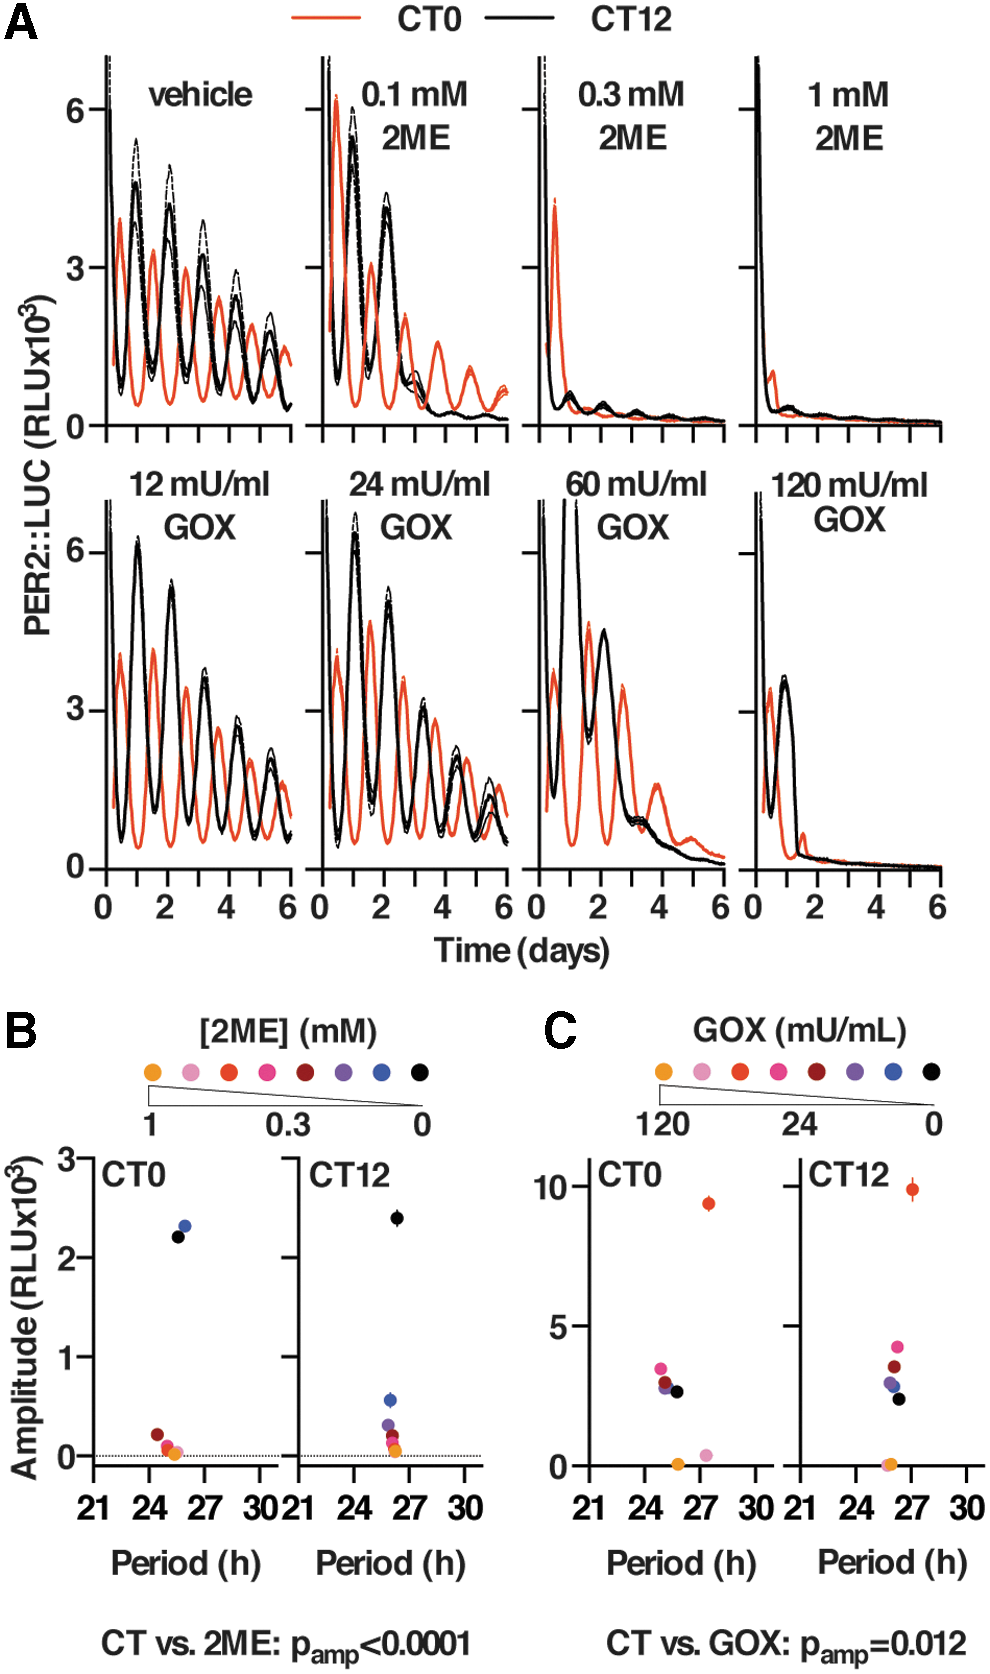
A potential consequence of a sustained reduction in flux through the oxidative PPP flux is a reduction in the rate with which NADPH can be regenerated from NADP+. In turn, this would be expected to induce a sustained oxidation of cellular redox balance. Correspondingly, we found that 24 h treatment with 2DG significantly increased the cellular NADP:NADPH ratio (Supplementary Fig. S6A), indicating a more oxidized cellular environment; and that reducing reagent 2-mercaptoethanol (2ME) transiently attenuated the effect of 2DG on PER2 amplitude (Supplementary Fig. S6B). To test whether chronic perturbation of cellular redox homeostasis might constitute the means whereby PPP inhibition impacts the amplitude of circadian gene expression, we incubated cells with a range of concentrations of 2ME or glucose oxidase (GOX, catalyzing the oxidation of glucose to form
Redox signals regulate the cellular clock via PER2 stability
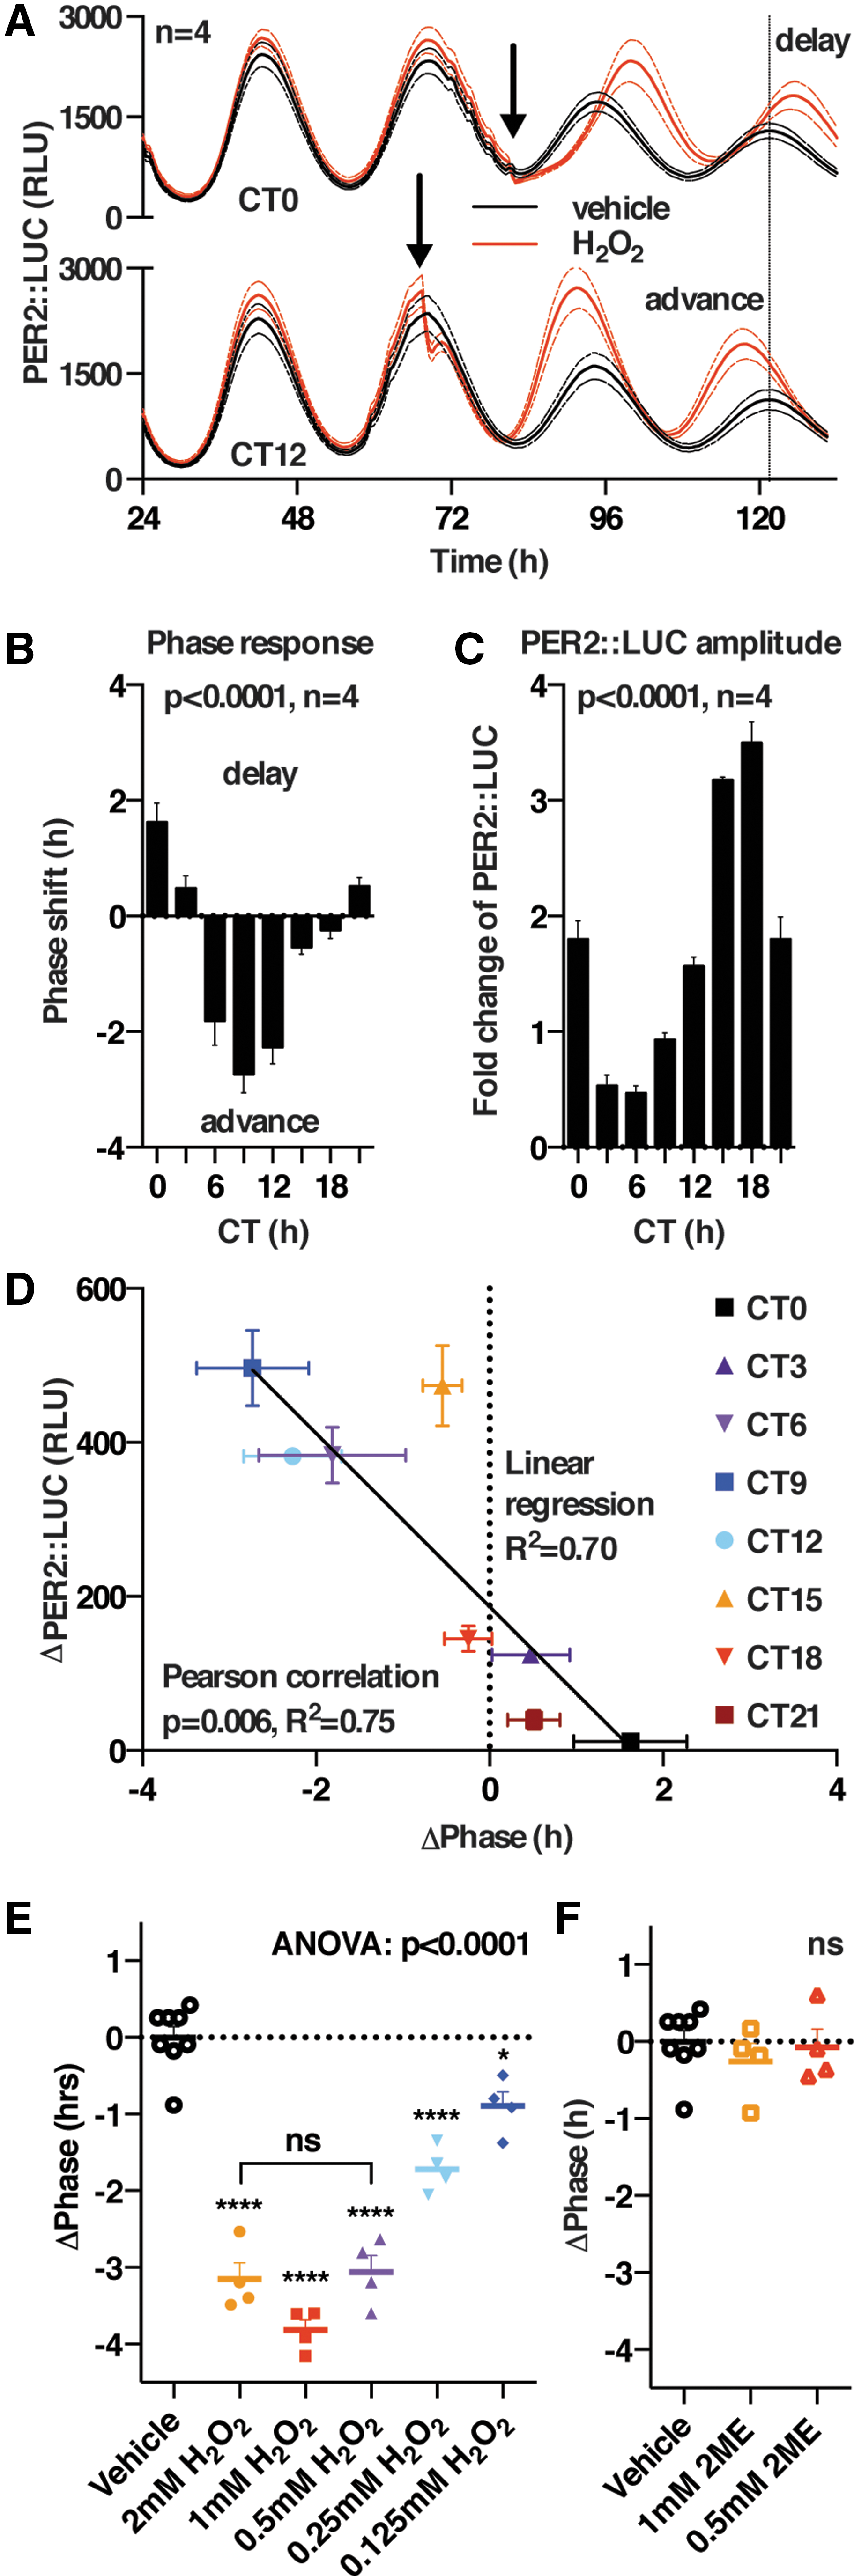
The phase-dependent effects of reducing or oxidizing the cellular redox environment indicated that redox signaling might play a bona fide role in regulating clock protein activity, as has previously been proposed in other model organisms such as Neurospora crassa (80). We tested this hypothesis by using H2O2, the putative second messenger in redox signaling relays (23, 35). Cells were treated with vehicle or a bolus of H2O2, every 3 h over a complete circadian cycle, and the effects on the subsequent rhythm were analyzed (Fig. 7 and Supplementary Figs. S7 and S8). We observed no consistent changes in circadian period, whereas we did observe phase shifts that conformed to a classic circadian phase response curve, with delays of ∼2 h occurring around CT12 (peak PER2) and advances of ∼2 h occurring over a smaller window around CT0 (Fig. 7B). Although we also observed a phase-dependent and significant change in amplitude (Fig. 7C), we observed no correlation between the phase shifts and the subsequent amplitude of PER2 expression (R 2 = 0.05, data not shown). Interestingly, a strong correlation was observed between the acute decrease in total PER2::LUC levels occurring immediately after H2O2 addition and the magnitude and direction of the phase shift elicited (R 2 = 0.75) (Fig. 7D). The phase shift occurred in a dose-dependent manner, with maximum effect occurring at ≥0.5 mM H2O2, and it remained significant at physiologically relevant concentrations of H2O2 (Fig. 7E); whereas control treatments with 2ME elicited no such effect (Fig. 7F). These results suggest a possible physiological role for H2O2 signaling: to relay extracellular (e.g., growth factor) or intracellular (e.g., mitochondrial metabolic) cues to the cellular clock and alter its phase, since PER2 is a bona fide state variable of the cellular clockwork (21).
Acute changes in the expression of PER2 protein abundance are an accepted mechanism by which circadian phase shifts occur (both in cells and in vivo) (1, 6, 8, 9, 21, 72), and our data, thus, suggest PER2 to be a functional circadian effector of redox signaling in mammalian cells. To confirm that the drop in LUC signal was a true report of decreased PER2 protein levels, we used immortalized fibroblasts isolated from knock-in transgenic mice expressing the PER2::VENUS fusion protein (73), as the VENUS-tag allows for clear quantification of PER2 by Western blot using an anti-GFP antibody. At the peak of PER2 expression (i.e., CT12), we treated the cells with H2O2 or the disulfide-inducing reagent diamide and analyzed protein levels by immunoblotting. Similar to the results of our longitudinal assays (Fig. 7A and Supplementary Fig. S7), we observed that PER2 levels were significantly reduced after an acute oxidative insult (Fig. 8A). This reduction was dose dependent and correlated well with the phase shift reported in Figure 7E.
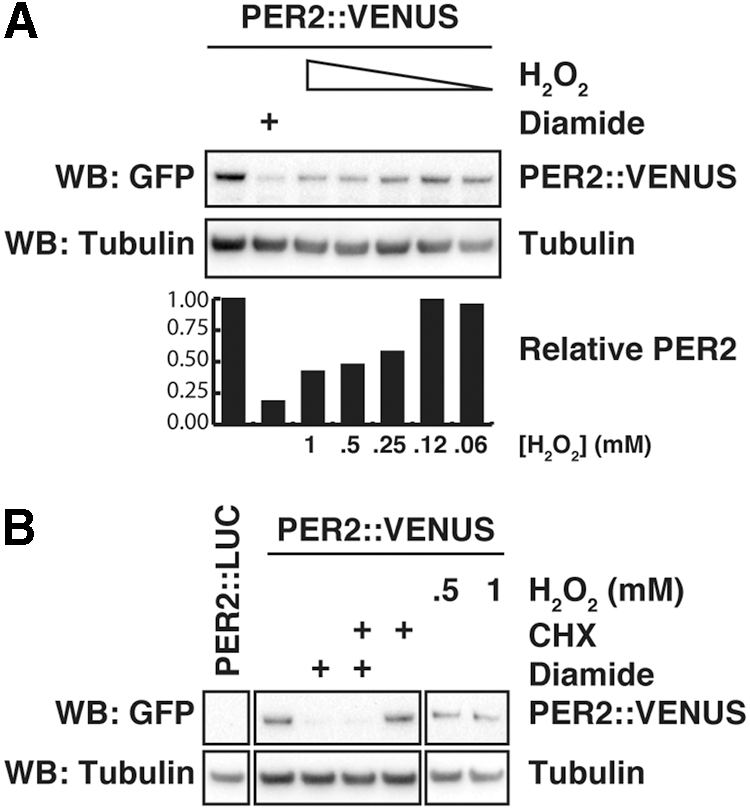
The observed reduction of PER2 protein levels could be either the effect of a temporary inhibition of translation or the result of increased PER2 protein degradation. We therefore compared the rate of PER2 decay on redox stress with that of cells treated with a saturating concentration of translation inhibitor cycloheximide (CHX) and found that both H2O2 and diamide induced a greater decrease in PER2 levels than CHX alone, indicating that PER2 degradation is increased on an oxidative insult (Fig. 8B). This result was recapitulated with PER2::LUC fibroblasts, where we observed that H2O2 decreased PER2 acutely, even in the presence of saturating CHX (Supplementary Fig. S9).
Discussion
We investigated the causal relationships between redox metabolism and circadian gene expression cycles in cultured mammalian cells. In keeping with previous observations, we observed compelling evidence that total glucose catabolism is circadian regulated (2, 30, 38), meaning that the rate of glycolytic NADH production and PPP-mediated NADPH production is also rhythmic. We found no evidence for active cell-autonomous circadian redistribution of metabolic flux between the NADH- and ATP-producing glycolytic pathway and the NADPH-producing PPP, suggesting that this cannot be a general feature of the circadian clock in mammalian cells. It seems more likely that, in the absence of oxidative or reductive stress, any rhythm in steady-state redox co-factor levels arises passively, as a consequence of rhythms in overall glucose catabolism and/or cofactor consumption. We should mention, however, that despite our repeated efforts, we have been unable to find evidence for overt circadian regulation of glutathione redox potential, the NAD+/NADH ratio, or the NADP+/NADPH ratio in any of the cell culture models employed in this study. This indicates that although PRX-SO2/3 rhythms may result from a cell-autonomous oscillation in cellular ROS production and/or redox potential, the oscillation's amplitude lies beneath the threshold of detection in our cell models, it does not appear to have any major role in the determination of circadian period, and it is, therefore, unlikely to constitute an essential timekeeping mechanism. Indeed, it is plausible that PRX-SO2/3 rhythms result from the rhythmic proteasomal degradation of over-oxidized PRX, as has been suggested in mouse erythrocytes (13).
Our data indicate that circadian gene expression is not affected by circadian oscillations in (NADH-generating) glycolytic flux, whereas chronic PPP inhibition and perturbation of redox balance primarily determine the amplitude of oscillation and not its period. This again suggests that circadian oscillations in redox homeostasis and primary metabolism do not play any essential role in the cellular timekeeping mechanism itself, whereas there exists a permissive range of PPP activity and redox state, beyond which clock gene expression rhythms cannot be sustained. We observed that the clock in U2OS cells, in particular, was profoundly resilient to reductive stress, with concentrations of 0.5 mM 2ME eliciting minimal effects on the amplitude and period of circadian rhythms in transcription (Supplementary Fig. S6D). We also observed no effect on circadian rhythms of the NRF2 activator sulforaphane or NRF2 RNAi, nor did NRF2 levels change consistently during PPP inhibition (Supplementary Fig. S10) (54). Again, a timekeeping mechanism that is effectively insensitive to chronic reductive stress is not readily compatible with redox oscillations playing some essential and conserved role in the cellular clockwork.
Because PPP inhibition and chronic redox disruption phenocopied the effect of 2DG on clock gene expression rhythms in three independent mammalian cell lines expressing three different bioluminescent reporters, we think it plausible that PPP/redox regulation of the amplitude of clock gene expression rhythms may reflect a general feature of how redox signals are integrated into the mammalian cellular circadian clockwork. We do note, however, that our findings using three different PPP inhibitors (2DG, DPI, DHEA) differ markedly from the reported effect of the niacin antagonist, 6-aminonicotinamide (6AN), which increases circadian period in (transformed) U2OS cells when employed at millimolar concentrations (61). 6AN becomes incorporated into NAD+ and NADP+ antimetabolites (6ANAD and 6ANADP), and thereby inhibits a wide range of NAD(P)+-dependent cellular processes (74). Unlike in U2OS cells however, we found that 6AN did not elicit period lengthening of PER2::LUC rhythms in non-transformed mouse fibroblasts (Supplementary Fig. S11). It is, therefore, possible either that the clock in these transformed cells, which rely heavily on Warburg metabolism (41), is more sensitive to 6AN or that the action of 6AN on the circadian clock is not specific to inhibition of the PPP.
In (non-transformed) mouse fibroblasts, we observed a phase-dependent and opposite sensitivity to reductive and oxidative stress in terms of the subsequent amplitude of clock gene expression rhythms. Specifically, cells were more tolerant to oxidative stress around the peak of PER2 expression (CT12), when combined glycolytic and PPP flux was greatest, and more tolerant to reductive stress around the nadir of PER2 expression, when the lowest rates of carbohydrate metabolism were observed. This establishes a functional consequence for circadian regulation of primary metabolism and redox balance that could have interesting chronotherapeutic applications (52). For example, in the context of pro-oxidant chemotherapies, one might anticipate that milder side effects will be observed in non-tumor cells (expressing normal circadian rhythms) when treatments coincide with the peak of PER2 expression, that is, occurring around anticipated dawn in humans (3, 20).
Circadian rhythms in the abundance of over-oxidized PRXs have been interpreted to indicate the existence of an underlying “redox oscillator” (60, 76). Our data strongly support the interpretation that redox signaling can elicit phase shifts, that NAD(P)H generation is rhythmic, and that the cellular redox environment appears to regulate the amplitude of circadian gene expression. However, our observations also clearly indicate that cellular timekeeping is remarkably robust against perturbation of redox balance in terms of the period of oscillation. We therefore conclude that our observations are most consistent with the third model that we introduced: that any circadian variations in redox balance are a cellular clock output, likely to result at least partially from rhythmic flux through primary metabolic pathways, but are not essential to cellular timekeeping. Moreover, redox signaling is competent to modulate the level of PER protein expression and thus, acute changes in redox balance can elicit phase-dependent circadian phase shifts. If our interpretation is correct, this would establish redox balance as an auxiliary feedback loop, akin to a zeitnehmer (63), a cellular system that is rhythmically regulated and can regulate the rhythm but is not essential to the timekeeping mechanism itself. Future work will need to test the potential physiological relevance of our findings, and the molecular mechanism that facilitates such rapid PER2 degradation in response to acute increases in intracellular H2O2.
Materials and Methods
Mammalian cell culture
Primary fibroblasts isolated from lung tissue (71) of adult PER2::LUC male mice [kindly provided by J. S. Takahashi (UT Southwestern, United States) (79)] and PER2::VENUS fibroblasts (kindly provided by M. Hastings [MRC LMB, United Kingdom (73)] were cultured as previously described (48) and immortalized by serial passage (77). U2OS and NIH3T3 cells were obtained from ATCC and used to generate transcriptional LUC-reporter cell lines as previously described (15, 48), and they were not passaged above 30 times. All cells were confirmed as being free of mycoplasma.
Silencing experiments
Cells were seeded in 24-well plates at a density of 1 × 10⁵/well and transfected with HiPerFect transfection reagent (Qiagen) by using the manufacturer's recommended reverse transfection protocol. Media were changed after 20 h, and cells were allowed to grow to confluence for a further 48 h. Cells were then synchronized by using 100 nM dexamethasone for 2 h, changed into air medium and bioluminescence was recorded as described later. We observed more rapid damping and increased baseline bioluminescence in recently transfected cells using this protocol than in control cells of other experiments, which was controlled for in our analyses. In light of prior observations, this was most likely associated with an increased rate of intercellular desynchronization (48, 75). To assay for protein expression, parallel plates were lysed (in triplicate) for immunoblotting 96 h after transfection.
Bioluminescence recordings
Bioluminescence recordings under static conditions were performed in 20 mM HEPES-buffered air medium (48) supplemented with 2% B-27 (Life Technologies; 50 × ), 0.3 or 1 mM luciferin (Biosynth AG; 0.3 mM for U2OS cells and 1 mM for fibroblasts), 1 × glutamax (Life Technologies), 100 U/ml penicillin/100 μg/ml streptomycin, and 10% FetalClone™ II or III serum (HyClone™; II for U2OS and III for fibroblasts). Osmolality was adjusted to 350 mOsm with NaCl. Before each experiment, cells were synchronized by using temperature cycles (12 h 32°C–12 h 37°C) for at least 3 days. Experiments were begun immediately after a medium change from culture medium to air medium, with or without drug as indicated (at 0 h). Vehicle treatments were performed with water, dimethyl sulfoxide (DMSO), or ethanol as appropriate, with the final concentration of solvent never being more than 0.3% DMSO or 0.1% ethanol. Bioluminescence activity was measured in a Lumicycle (Actimetrics), an LB962 plate reader (Berthold Technologies), or an ALLIGATOR (Cairn Research). Lumicycle and plate reader measurements are reported as counts per second, whereas ALLIGATOR measurements are reported as relative luminescence units. For technical reasons, the bioluminescence data presented in Figure 1A and Supplementary Figure S2A were normalized to the first peak of PER2::LUC bioluminescence to account for differences in the efficiency of light detection, resulting from variable distances of microfluidic devices from the camera lens.
Metabolic labeling strategy
Classically, either singly or doubly 13C-labeled glucose has been used to investigate flux through the PPP (13, 25). Glucose passing though the PPP loses its first carbon molecule as CO2 during the oxidative phase, after which rearrangements in the non-oxidative PPP produce differently labeled metabolites to those from glucose that has passed solely through glycolysis, allowing for calculation of PPP flux. However, 13C may also be present at additional glucose carbons due to its natural abundance (∼1%) or due to impurities from the enrichment process. This has the potential to introduce error into calculations of the relative fluxes between glycolysis and the PPP by using either the singly or doubly labeled method. To avoid this problem, we utilized 1,2,3-13C-labeled glucose as our labeled substrate. Metabolism of 1,2,3-13C glucose through either glycolysis or the PPP produces fully 13C-labeled or completely unlabeled (12C) 3-carbon metabolites (lactate and pyruvate, Supplementary Fig. S1), which may serve as substrates for mitochondrial respiration or are exported into the cell culture media. 13C and 12C lactate/pyruvate are produced in different ratios depending on which metabolic pathways they have passed through: Flux through glycolysis produces a 1:1 ratio of 13C-labeled to 12C-unlabeled product, whereas flux through the PPP produces a ratio of 2:3 (Supplementary Fig. S1). Analysis of the ratios of these two metabolites allows for accurate determination of the relative metabolic fluxes between the two pathways. This method is not affected by three-carbon metabolites produced by other pathways as a result of impurities in the labeled glucose, as these will be singly or doubly labeled, allowing for more accurate determination of primary metabolic flux. For analysis of perfusion time courses, we only consider samples that were collected after the levels of 1,2,3-13C-glucose in the perfusate had attained a stable baseline, to avoid any potential confounding effects that might otherwise be introduced by unlabeled glucose from the media in which the cells were previously cultured.
Perfusion recordings
Recordings under perfusion were carried out by using cells seeded in micro-slide 0.6 (Ibidi). Immediately before recording, cells were changed into bicarbonate-buffered Dulbecco's modified Eagle medium (DMEM) containing 1 g/L
Pharmacological perturbations
KA was supplied by 2BScientific. All other drugs and chemicals were used in concentrations as indicated, and they were from Sigma. DPI and carbonyl cyanide-4-(trifluoromethoxy)phenylhydrazone (FCCP) were dissolved in DMSO, KA in EtOH, DHEA in MeOH, GOX in phosphate-buffered saline, and 6AN and oxythiamine in air medium. All other drugs were dissolved in H2O. We found that NIH3T3 fibroblast cultures required 1 mM mannose to remain viable in the presence of 2DG [presumably to provide a substrate for protein glycosylation (39)]. Similarly, we found that U2OS cells required 10 mM pyruvate to remain viable in the presence of KA [presumably providing a substrate for mitochondrial respiration to maintain ATP production (26)]. The 3T3 and U2OS experiments and controls reported in Supplementary Figure S3 and S5 only were, therefore, performed with either mannose or pyruvate supplementation, respectively. The non-transformed fibroblasts that were used for experiments reported in main figures were not so supplemented in any case.
ATP measurements
ATP measurements were performed as previously described (28).
Extracellular flux analysis
Measurements of ECAR (a reliable proxy for glycolytic rate) and rate of OCR (which correlates with cellular respiration rate) were performed with a Seahorse XFe96 analyzer (Agilent) by using the Seahorse XF Cell Mito Stress test and Glycolysis Stress Test Kits (Agilent). Cells were seeded in Seahorse XF96 cell culture microplates, grown to confluence, subjected to temperature cycles for 72 h, given a media change, and incubated at constant 37°C. Immediately before each measurement, a plate was removed from the incubator; media were then changed to Seahorse XF Media (Agilent) and warmed to 37°C on a 37°C isothermal pad. Seahorse XF Media were supplemented with 1% glutaMAX, and also 11 mM glucose and 200 μM pyruvate for those cells used with the Mito Stress Test. Plates were calibrated with Seahorse XF Calibrant (Agilent) before every test, as per the manufacturer's instructions. Basal respiration and glycolysis is determined before any drug treatment in cells but in the presence of glucose. Maximal respiration is determined after treatment with the proton ionophore FCCP. Maximal glycolytic capacity is determined after the addition of ATP synthase inhibitor oligomycin.
Metabolic labeling sample preparation
Cells were perfused (as described earlier) with 1,2,3-13C glucose substituted in place of unlabeled glucose. Outflow media were snap frozen. Subsequently, samples were defrosted and centrifuged in a bench-top centrifuge at 4°C, at maximum speed for 5 min. Fifty microliters of the resulting supernatant was resuspended in 750 μl extraction buffer (375 μl methanol, 225 μl acetonitrile +150 μl H2O) and then mixed at 1000 rpm for 15 min at 4°C in a ThermoMixer (Eppendorf). Samples were then centrifuged again at 4°C, at maximum speed in a bench-top centrifuge for 10 min, and the resulting supernatant was transferred to a new vial and stored at −80°C until analysis by LC-MS.
Cell culture medium analysis by LC-MS
The LC-MS analysis was performed on a Dionex U3000 UHPLC system coupled to a Q Exactive™ Hybrid Quadrupole-Orbitrap Mass Spectrometer (Thermo Scientific). The liquid chromatography system was fitted with a SeQuant ZIC-pHILIC column (150 mm × 2.1 mm. 3.5 μm) and guard column (20 mm × 2.1 mm 3.5 μm) from Merck Millipore. The mobile phase was composed of 20 mM ammonium carbonate and 0.1% ammonium hydroxide in water (solvent A), and acetonitrile (solvent B). The flow rate was set at 180 μl/min with the following gradient: 0 min 70% B, 1 min 70% B, 16 min 38% B, 16.5 min 70% B, and a hold at 70% B for 8.5 min. The operator was blinded to the samples, which were randomized to avoid bias due to machine drift. The acquired spectra were analyzed using XCalibur Qual Browser and XCalibur Quan Browser software (Thermo Scientific) by referencing to commercially available compounds and an internal library of compounds.
NADP+:NADPH ratio
Assays to determine NADP+:NADPH ratio were performed by using the NADP+/NADPH-Glo(TM) Assay (Promega) as per the manufacturer's instructions; 250 μM diamide was used as a positive control.
Data analysis
Bioluminescence data were analyzed with Prism Graphpad 6. Baseline subtraction was performed to detrend traces (24-h moving average or polynomial line fitting). Period, phase, and amplitude were determined by least-square fitting to a circadian damped cos wave with a linear baseline:
where m is the gradient of the baseline, c is the y offset, k describes the damping rate, a is the amplitude, r is the phase, and p is the period. The first 24 h of data were omitted from analysis to exclude the transient effects in clock gene expression that frequently occur on a media change. When indicated, the cos wave fit was compared with the straight-line fit; p-value indicates rejection of the straight line.
Recent work has revealed that luciferin itself (non-specifically) lengthens the circadian period by ∼1 h at high concentrations (≤2.5 mM) (29). To distinguish biologically relevant from statistically significant but non-specific effects on the cellular clock, informed by the excellent paper from the Ueda lab (36), we define a biologically relevant effect on period as being >5% and >3 standard deviations different than controls. In practice, this means that only changes in a period of >1 h are considered noteworthy.
Western blotting
Western blots were performed according to standard protocols, using NuPAGE™ Novex™ 4–12% Bis-Tris Protein Gels (ThermoFisher). Transfer to nitrocellulose membranes was achieved by using the iBlot dry blotting system (ThermoFisher). Blots were incubated with blocking buffer consisting of 0.125% bovine serum albumin (Sigma) and 0.125% milk powder (Marvel). PER2::VENUS was detected by using anti-GFP antibody (Sigma), G6PDH (Abcam; ab993), GPI (Abcam; 66340), NRF2 (Santa Cruz; sc-722), actin (Santa Cruz; sc-47778), and PRX-SO2/3 (Abcam; ab16830). Western blots were imaged on a Biorad chemidoc and quantifications were performed in FIJI (69), measuring integrated density of the bands. Protein expression was expressed relative to tubulin expression or Coomaasie stain of the gel, as indicated. Full annotated images for all blots are presented in Supplementary Figures S12 to S15.
Footnotes
Acknowledgments
The authors thank Alessandra Stangherlin, Rachel Edgar, and David Wong for valuable discussions. They would also like to thank all their reviewers for their constructive comments. M.P. was supported by the Dutch Cancer Foundation (KWF, BUIT-2014-6637) and EMBO (ALTF-654-2014). J.S.O. was supported by the Medical Research Council (MC_UP_1201/4) and the Wellcome Trust (093734/Z/10/Z).
Author Disclosure Statement
No competing financial interests exist.
Abbreviations Used
References
Supplementary Material
Please find the following supplemental material available below.
For Open Access articles published under a Creative Commons License, all supplemental material carries the same license as the article it is associated with.
For non-Open Access articles published, all supplemental material carries a non-exclusive license, and permission requests for re-use of supplemental material or any part of supplemental material shall be sent directly to the copyright owner as specified in the copyright notice associated with the article.