
Abstract
Aim:
We investigated the uptake and pharmacokinetics of
Results:
After oral administration, ET is avidly absorbed and retained by the body with significant elevations in plasma and whole blood concentrations, and relatively low urinary excretion (<4% of administered ET). ET levels in whole blood were highly correlated to levels of hercynine and S-methyl-ergothioneine, suggesting that they may be metabolites. After ET administration, some decreasing trends were seen in biomarkers of oxidative damage and inflammation, including allantoin (urate oxidation), 8-hydroxy-2′-deoxyguanosine (DNA damage), 8-iso-PGF2α (lipid peroxidation), protein carbonylation, and C-reactive protein. However, most of the changes were non-significant.
Innovation:
This is the first study investigating the administration of pure ET to healthy human volunteers and monitoring its uptake and pharmacokinetics. This compound is rapidly gaining attention due to its unique properties, and this study lays the foundation for future human studies.
Conclusion:
The uptake and retention of ET by the body suggests an important physiological function. The decreasing trend of oxidative damage biomarkers is consistent with animal studies suggesting that ET may function as a major antioxidant but perhaps only under conditions of oxidative stress. Antioxid. Redox Signal. 26, 193–206.
Introduction
L
Our study details the first administration, to our knowledge, of pure
Although the physiological function of ET is not yet fully established [reviewed in Cheah and Halliwell (10)], numerous in vitro studies have demonstrated multiple potential beneficial properties (summarized in Supplementary Fig. S1; Supplementary Data are available online at
ET has also been shown to protect against UV and gamma radiation by neutralizing radiation-induced ROS and possibly also by the activation of Nrf2 (increased Nrf2 and decreased Keap-1 expression) and downstream antioxidant genes (28, 30, 38, 44). ET has also been demonstrated to chelate divalent metal ions (27, 42), forming complexes with metal cations, including Fe2+ and Cu2+, that prevent their involvement in redox cycling (16, 65). The selective expression of slc22a4 (encoding the ET transporter, OCTN1) and the consequential presence of ET in organs and cells that are prone to oxidative stress and inflammation further hint at a possible cytoprotective physiological role for ET (12, 25).
In addition, studies in various animal models have demonstrated antioxidant and cytoprotective actions of ET, including protection against ischemia-reperfusion injury (6, 50), acute lung injury (48), damage caused by the pro-oxidants ferric-NTA (14) and β-amyloid (63), and
Here, to our knowledge, we report the first placebo-controlled study investigating the pharmacokinetics of pure ET in healthy human volunteers and examining the potential effects on selected biomarkers of oxidative damage and inflammation.
Results
Screening and enrolment of subjects
Of the 57 subjects screened, 47 were enrolled but only 45 successfully completed the study. Two subjects withdrew due to compliance failure. Enrolled subjects met all inclusion criteria and provided full informed consent to participate.
Uptake and clearance of ET in blood and urine
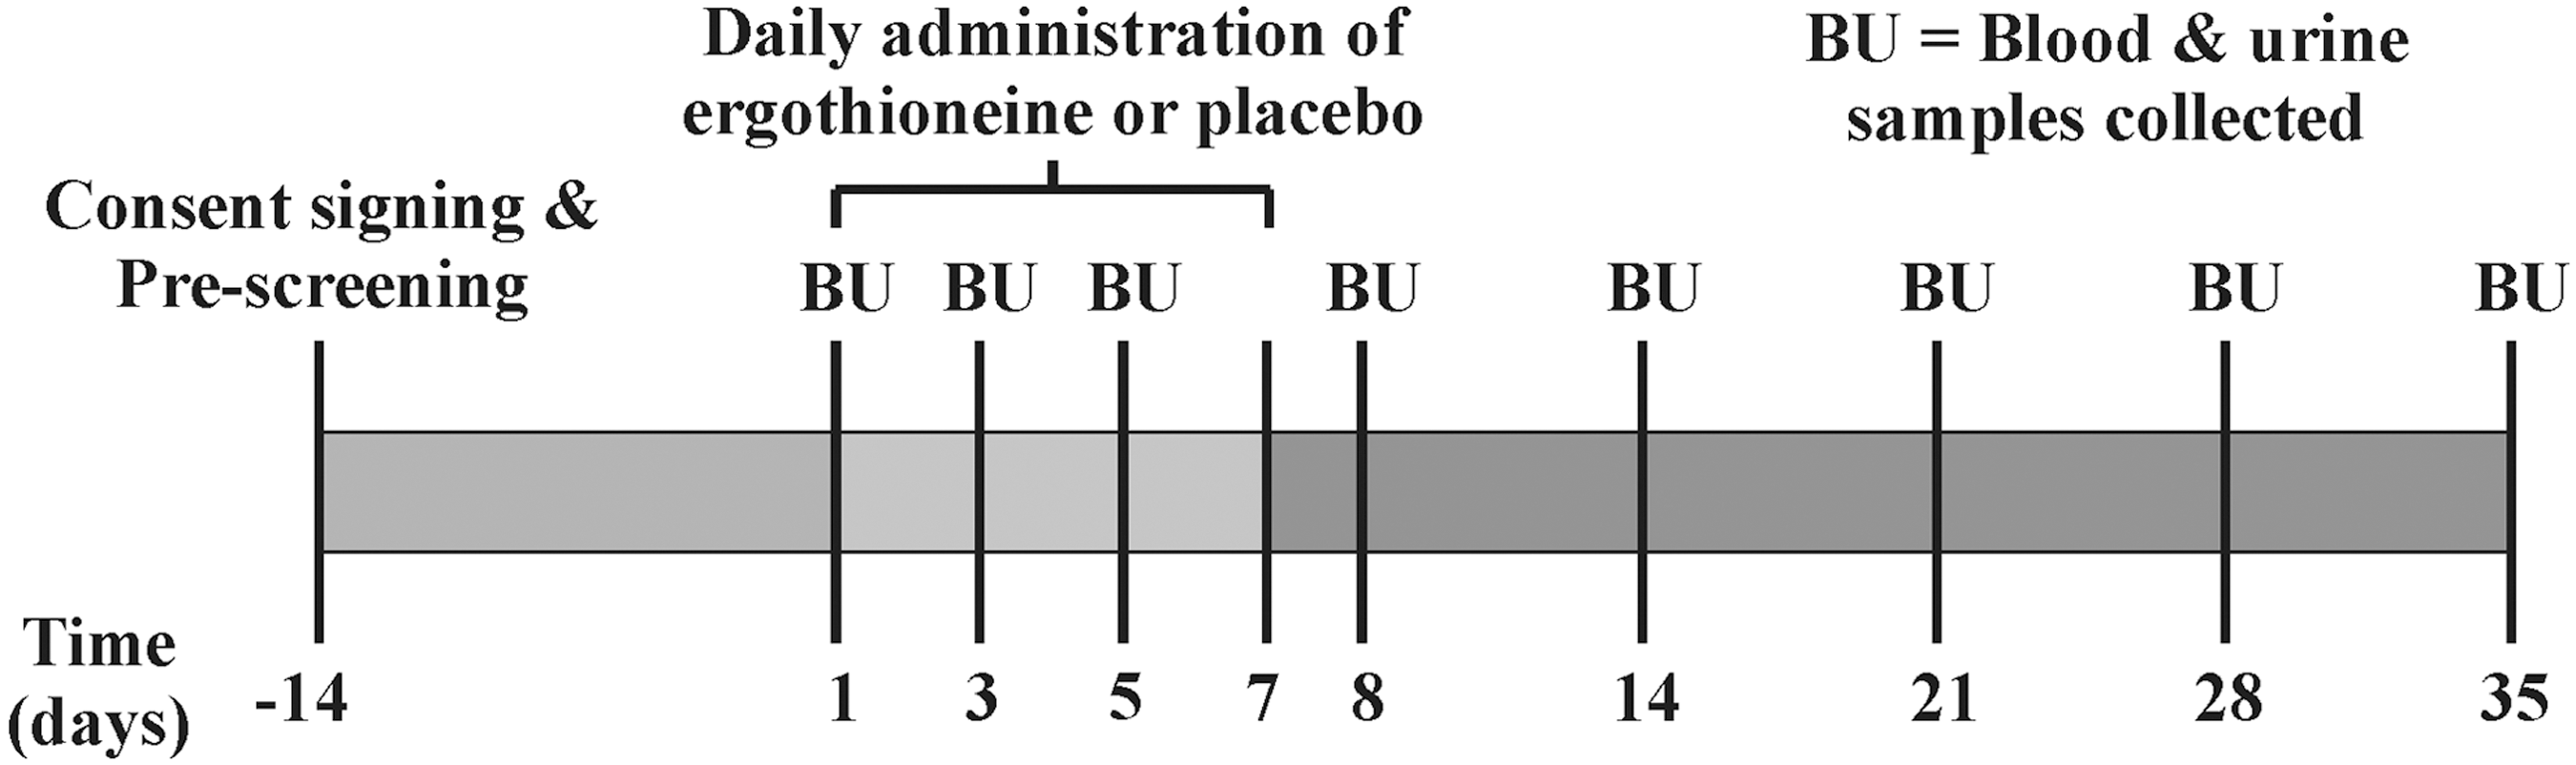
The levels of ET were quantified in whole blood, plasma, and urine samples from each subject both during the ET administration (days 1, 3, 5, and 8) and post-administration (days 14, 21, 28, and 35), to assess uptake and clearance of ET (Fig. 2). Plasma levels (Fig. 3A) dose dependently increased during the administration period (day 1–7) and then gradually declined until day 35, although for subjects on the high dose, these levels remained significantly higher than for controls (p < 0.05). Likewise, excretion of ET (urinary ET levels; Fig. 3C) followed a similar pattern to plasma levels, increasing during the first 8 days and then steadily declining post-administration, although at day 35 the ET levels still tended to be above those in the control group.
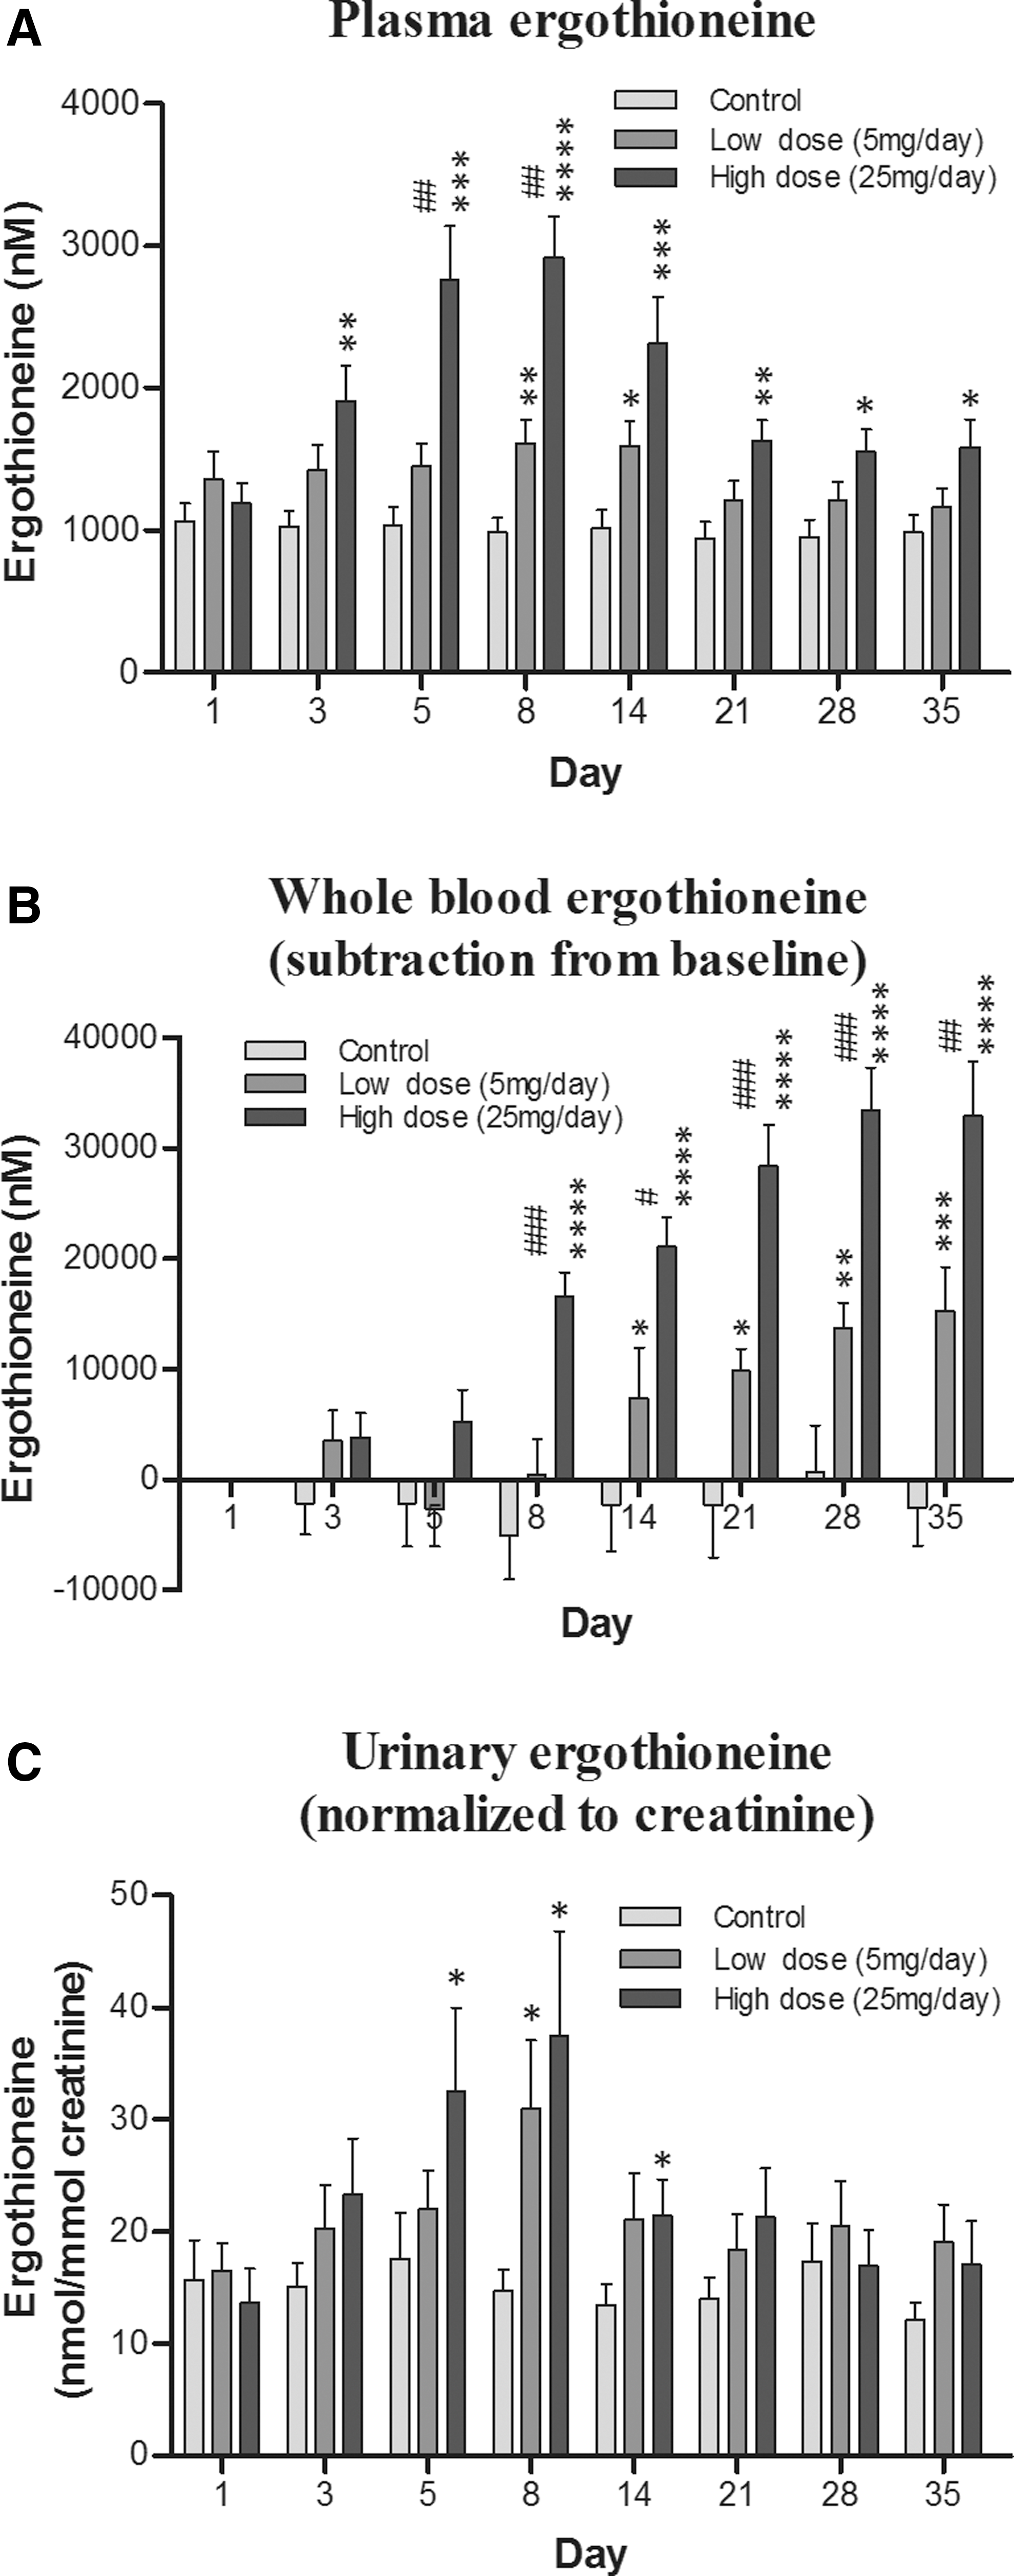
By comparison, plasma and whole blood ET levels increased much more than urine during the ET administration (at day 8, the increase in ET concentration relative to controls was ∼2000 nM and ∼125,000 nM vs. ∼400 nM, for plasma, whole blood, and urine, respectively), indicating a high level of ET retention by the body. In contrast, whole blood ET levels (Fig. 3B) continued to increase gradually over the entire duration of the study, reaching maximal levels around day 28. The levels of ET in plasma, urine, and whole blood demonstrate a dose-dependent increase.
Plasma, whole blood, and urinary levels of hercynine, S-methyl-ET, and ET-SO3H
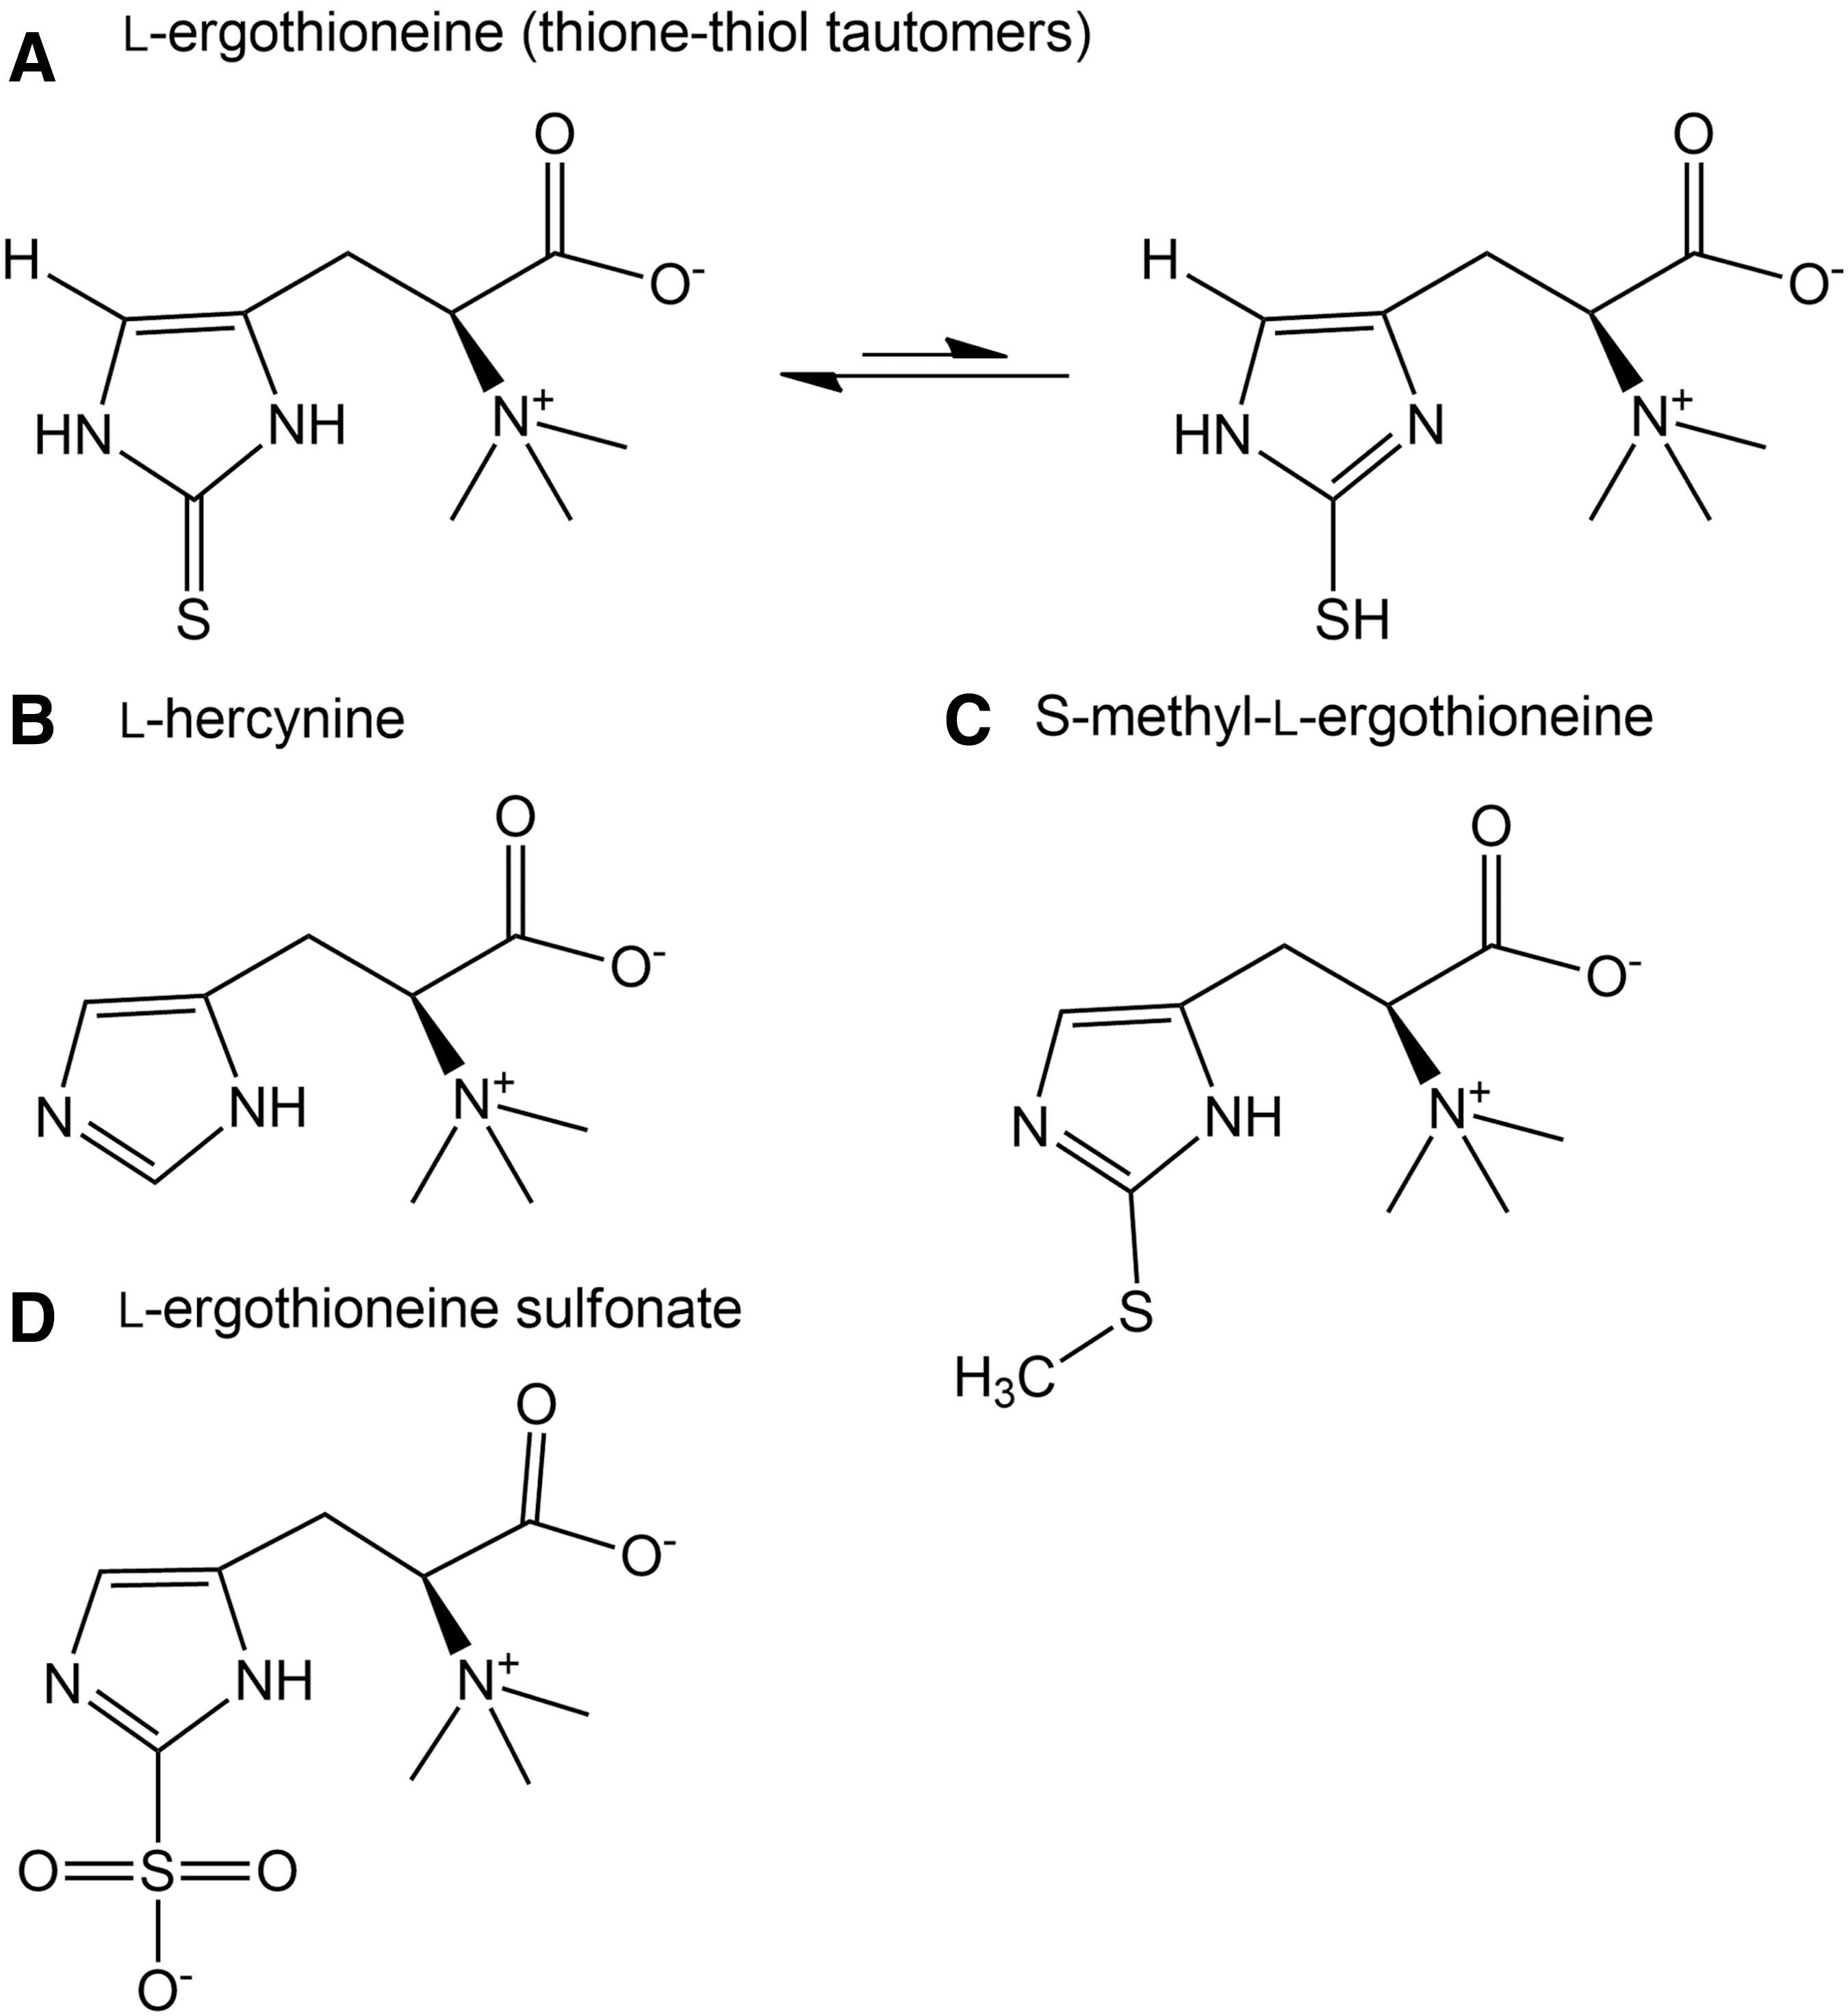
Little is known about the oxidation products of ET in vivo, though some groups (31, 54) have investigated the possible reaction products in vitro. Earlier studies demonstrated the reversible oxidation of ET to the disulfide under certain laboratory conditions, although under physiological conditions ET remains in the thione state (29). However, the nature of the ET-disulfide, if formed in vivo, is vastly different from that of glutathione disulfide, possessing an extremely high redox potential. Depending on the presence or absence of other thiols such as reduced glutathione (GSH), ET-disulfide can be reduced back to ET or may spontaneously disproportionate to ET and its sulfenic acid derivative (ET-SOH), respectively (31). The latter may be oxidized further to the highly unstable ET sulfinic acid (ET-SO2H) or to the very stable sulfonic acid derivative (ET-SO3H) (31, 54).
Decomposition of the unstable ergothioneine sulfinate will generate hercynine (Fig. 1B), which is also an intermediary precursor in ET biosynthesis. Unlike the sulfinic acid, ET-sulfonate (Fig. 1D) is more stable and hence able to be measured as a possible oxidation product of ET. S-methyl-ET (Fig. 1C) could be generated through the methylation of the sulfur.
We thus investigated the levels of hercynine, ET-SO3H, and S-methyl-ET in plasma, whole blood, and urine samples from subjects with and without ET administration. The levels of hercynine in plasma (average basal level 14.6 ± 0.5 nM) and whole blood (average basal level 290.2 ± 12.3 nM) were about 85 and 350 times lower than ET levels (average basal plasma level 1281.8 ± 81.0 nM and whole blood level 101.2 ± 6.0 μM), respectively. On the other hand, urinary hercynine levels (average basal level 44.7 ± 2.4 nM, normalized to creatinine) were about 2.5 times higher than urinary ET levels (average basal level 15.0 ± 0.8 nM, normalized to creatinine). No obvious trends were observed in plasma and urinary levels of hercynine (Fig. 4A, F); however, the whole blood levels of hercynine (Fig. 4C, D) were significantly elevated in subjects administered low- or high-dose ET.
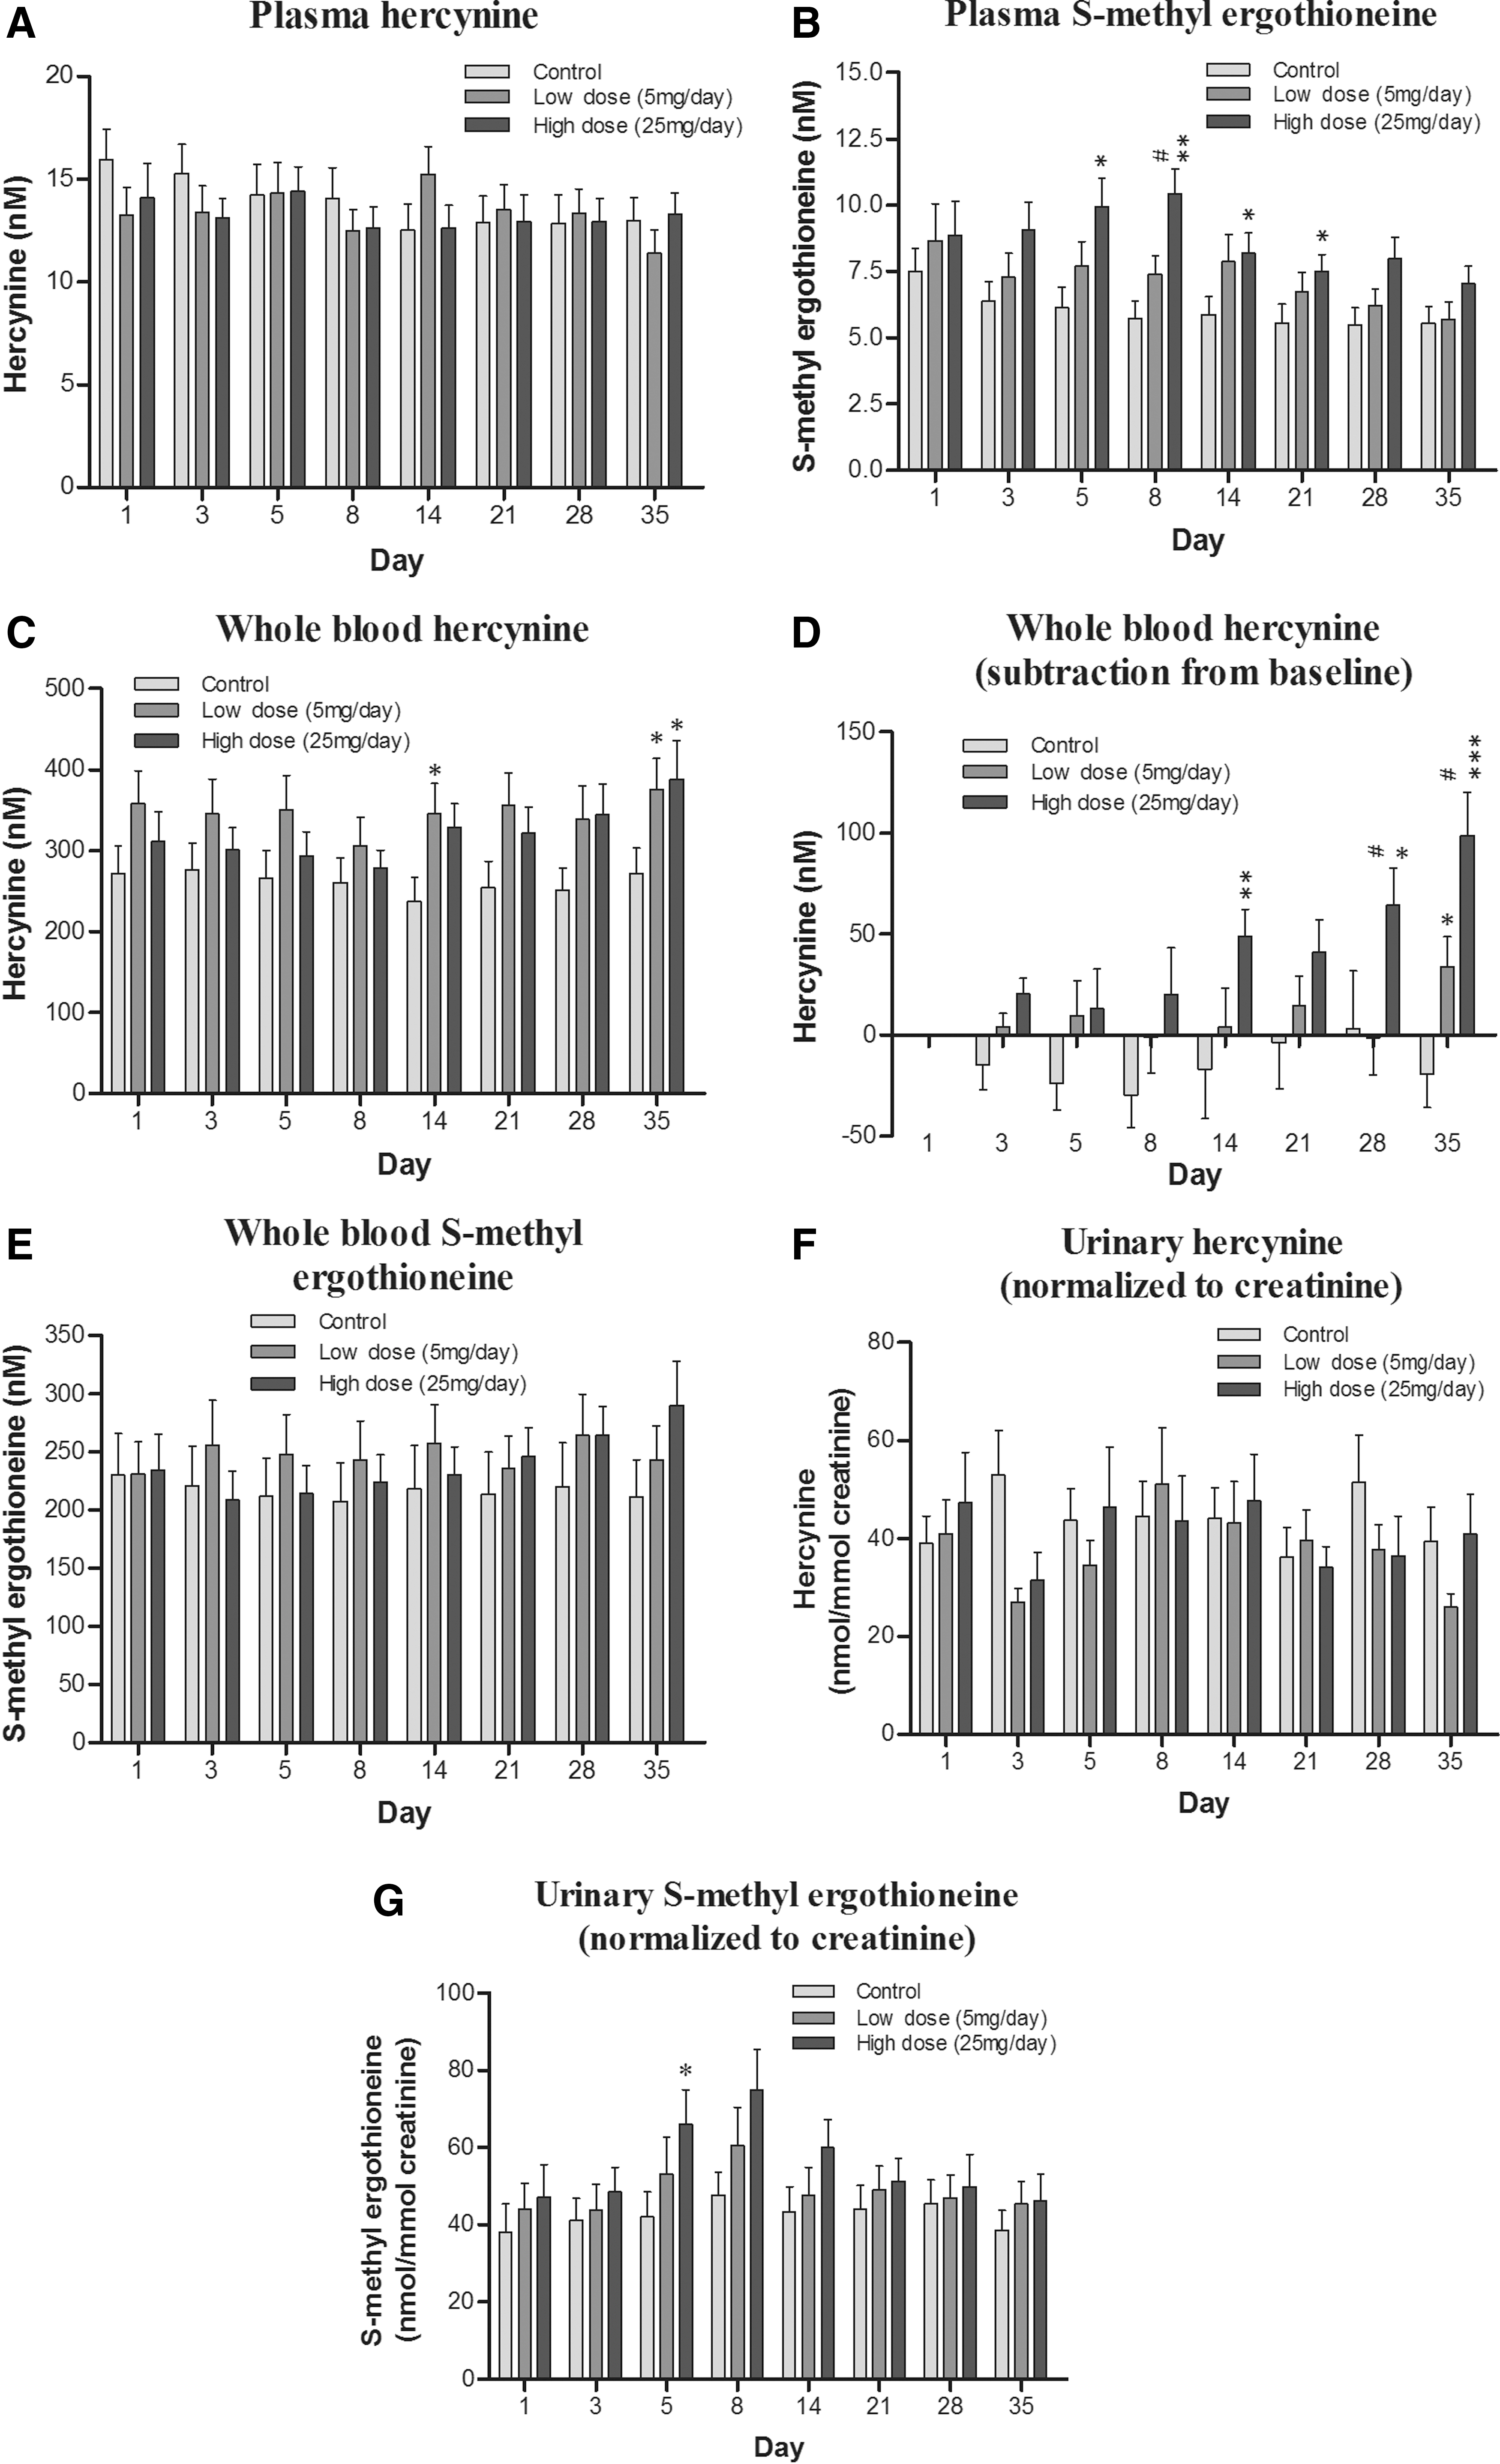
The levels of S-methyl-ET were even lower than hercynine, with plasma (average basal level 7.0 ± 0.4 nM) and whole blood (average basal level 222.7 ± 10.8 nM) levels about 180 and 450 times lower than ET, respectively. Urinary levels of S-methyl-ET were very similar to urinary hercynine, with an average basal level around 42.6 ± 1.9 nM. S-methyl-ET was dose dependently elevated in plasma, whole blood, and urine (Fig. 4B, E, and G) and followed a similar trend to ET levels in the respective samples. That is, plasma and urinary S-methyl-ET increased during the administration period until day 8 and then gradually declined. Meanwhile, whole blood levels continued to increase for the duration of the study. Levels of ET-SO3 in plasma, whole blood, and urine were at the limit of quantification (∼5 nM); hence, analysis was not possible.
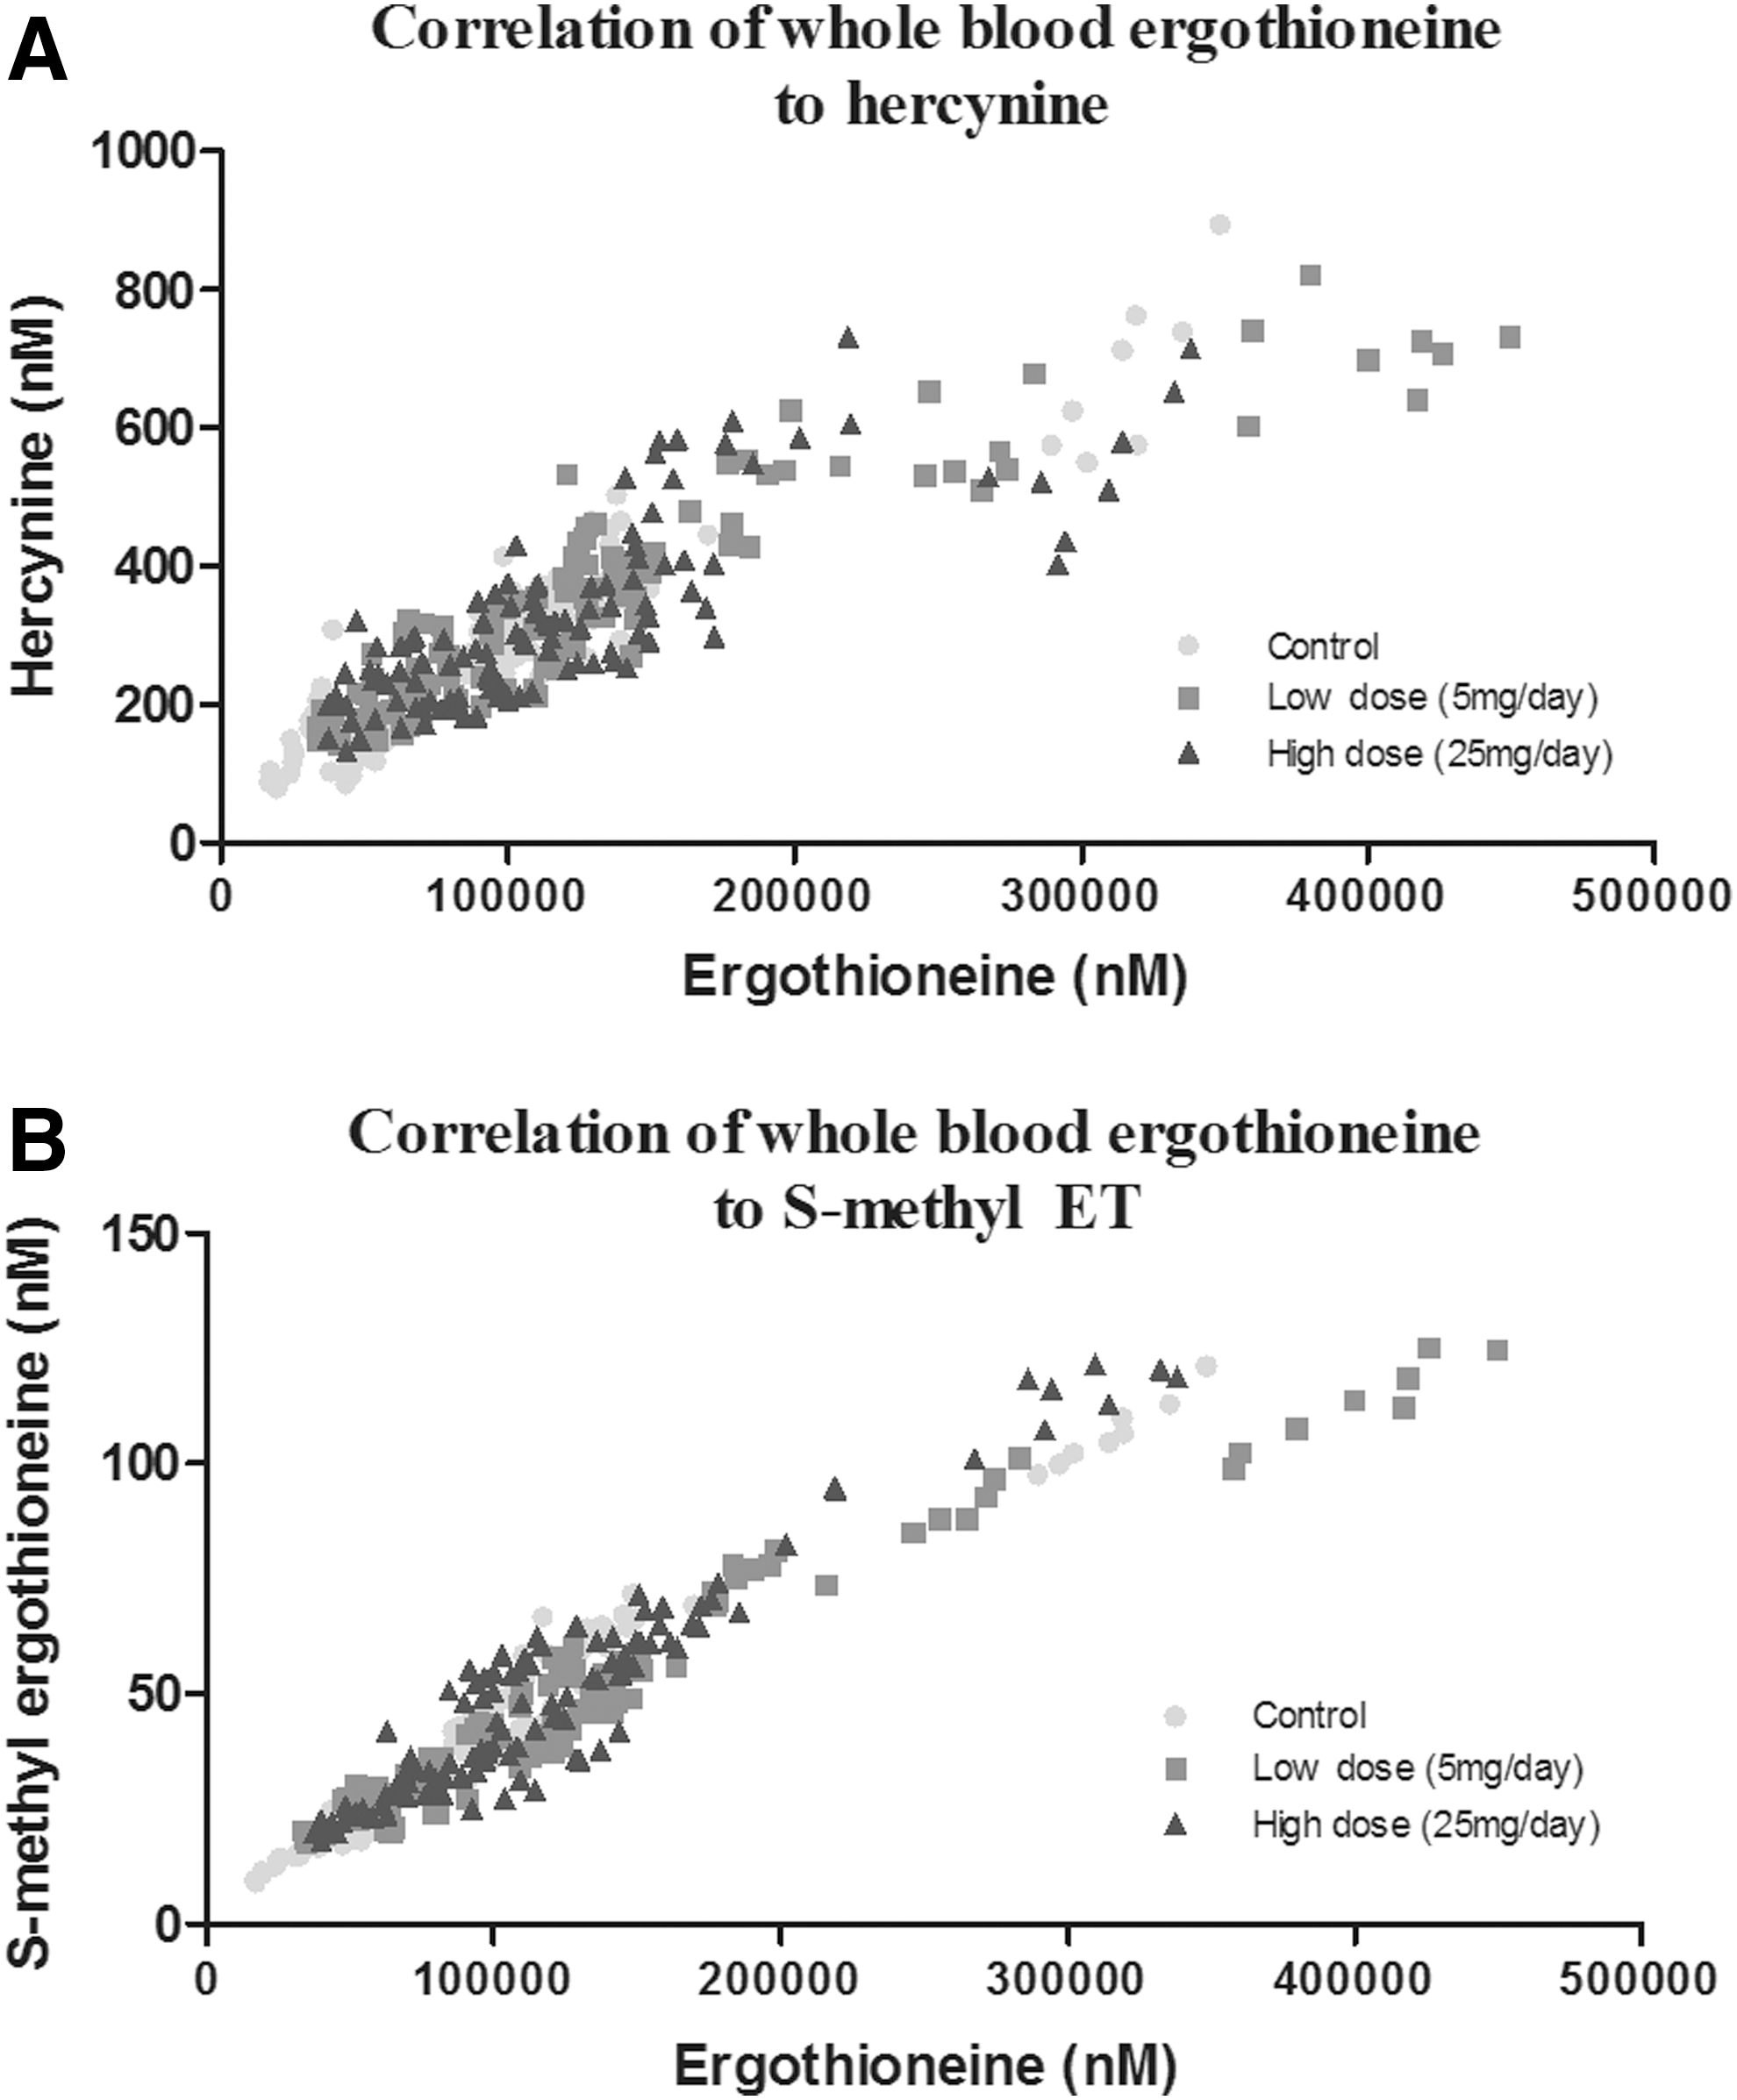
Correlation of ET with hercynine and S-methyl-ET
We noted that the levels of hercynine and S-methyl-ET followed similar trends to the levels of ET in plasma, whole blood, and urine and, therefore, investigated the correlation between them. Using the data from all groups (control, low- and high-dose ET), we identified a highly significant (p < 0.0001) correlation of both whole blood hercynine (Fig. 5A) and S-methyl-ET (Fig. 5B) with ET levels, with Pearson's correlation coefficient (r) being 0.8915 and 0.9614, respectively.
Effect of ET supplementation on the oxidative damage biomarkers allantoin and 8-hydroxy-2′-deoxyguanosine
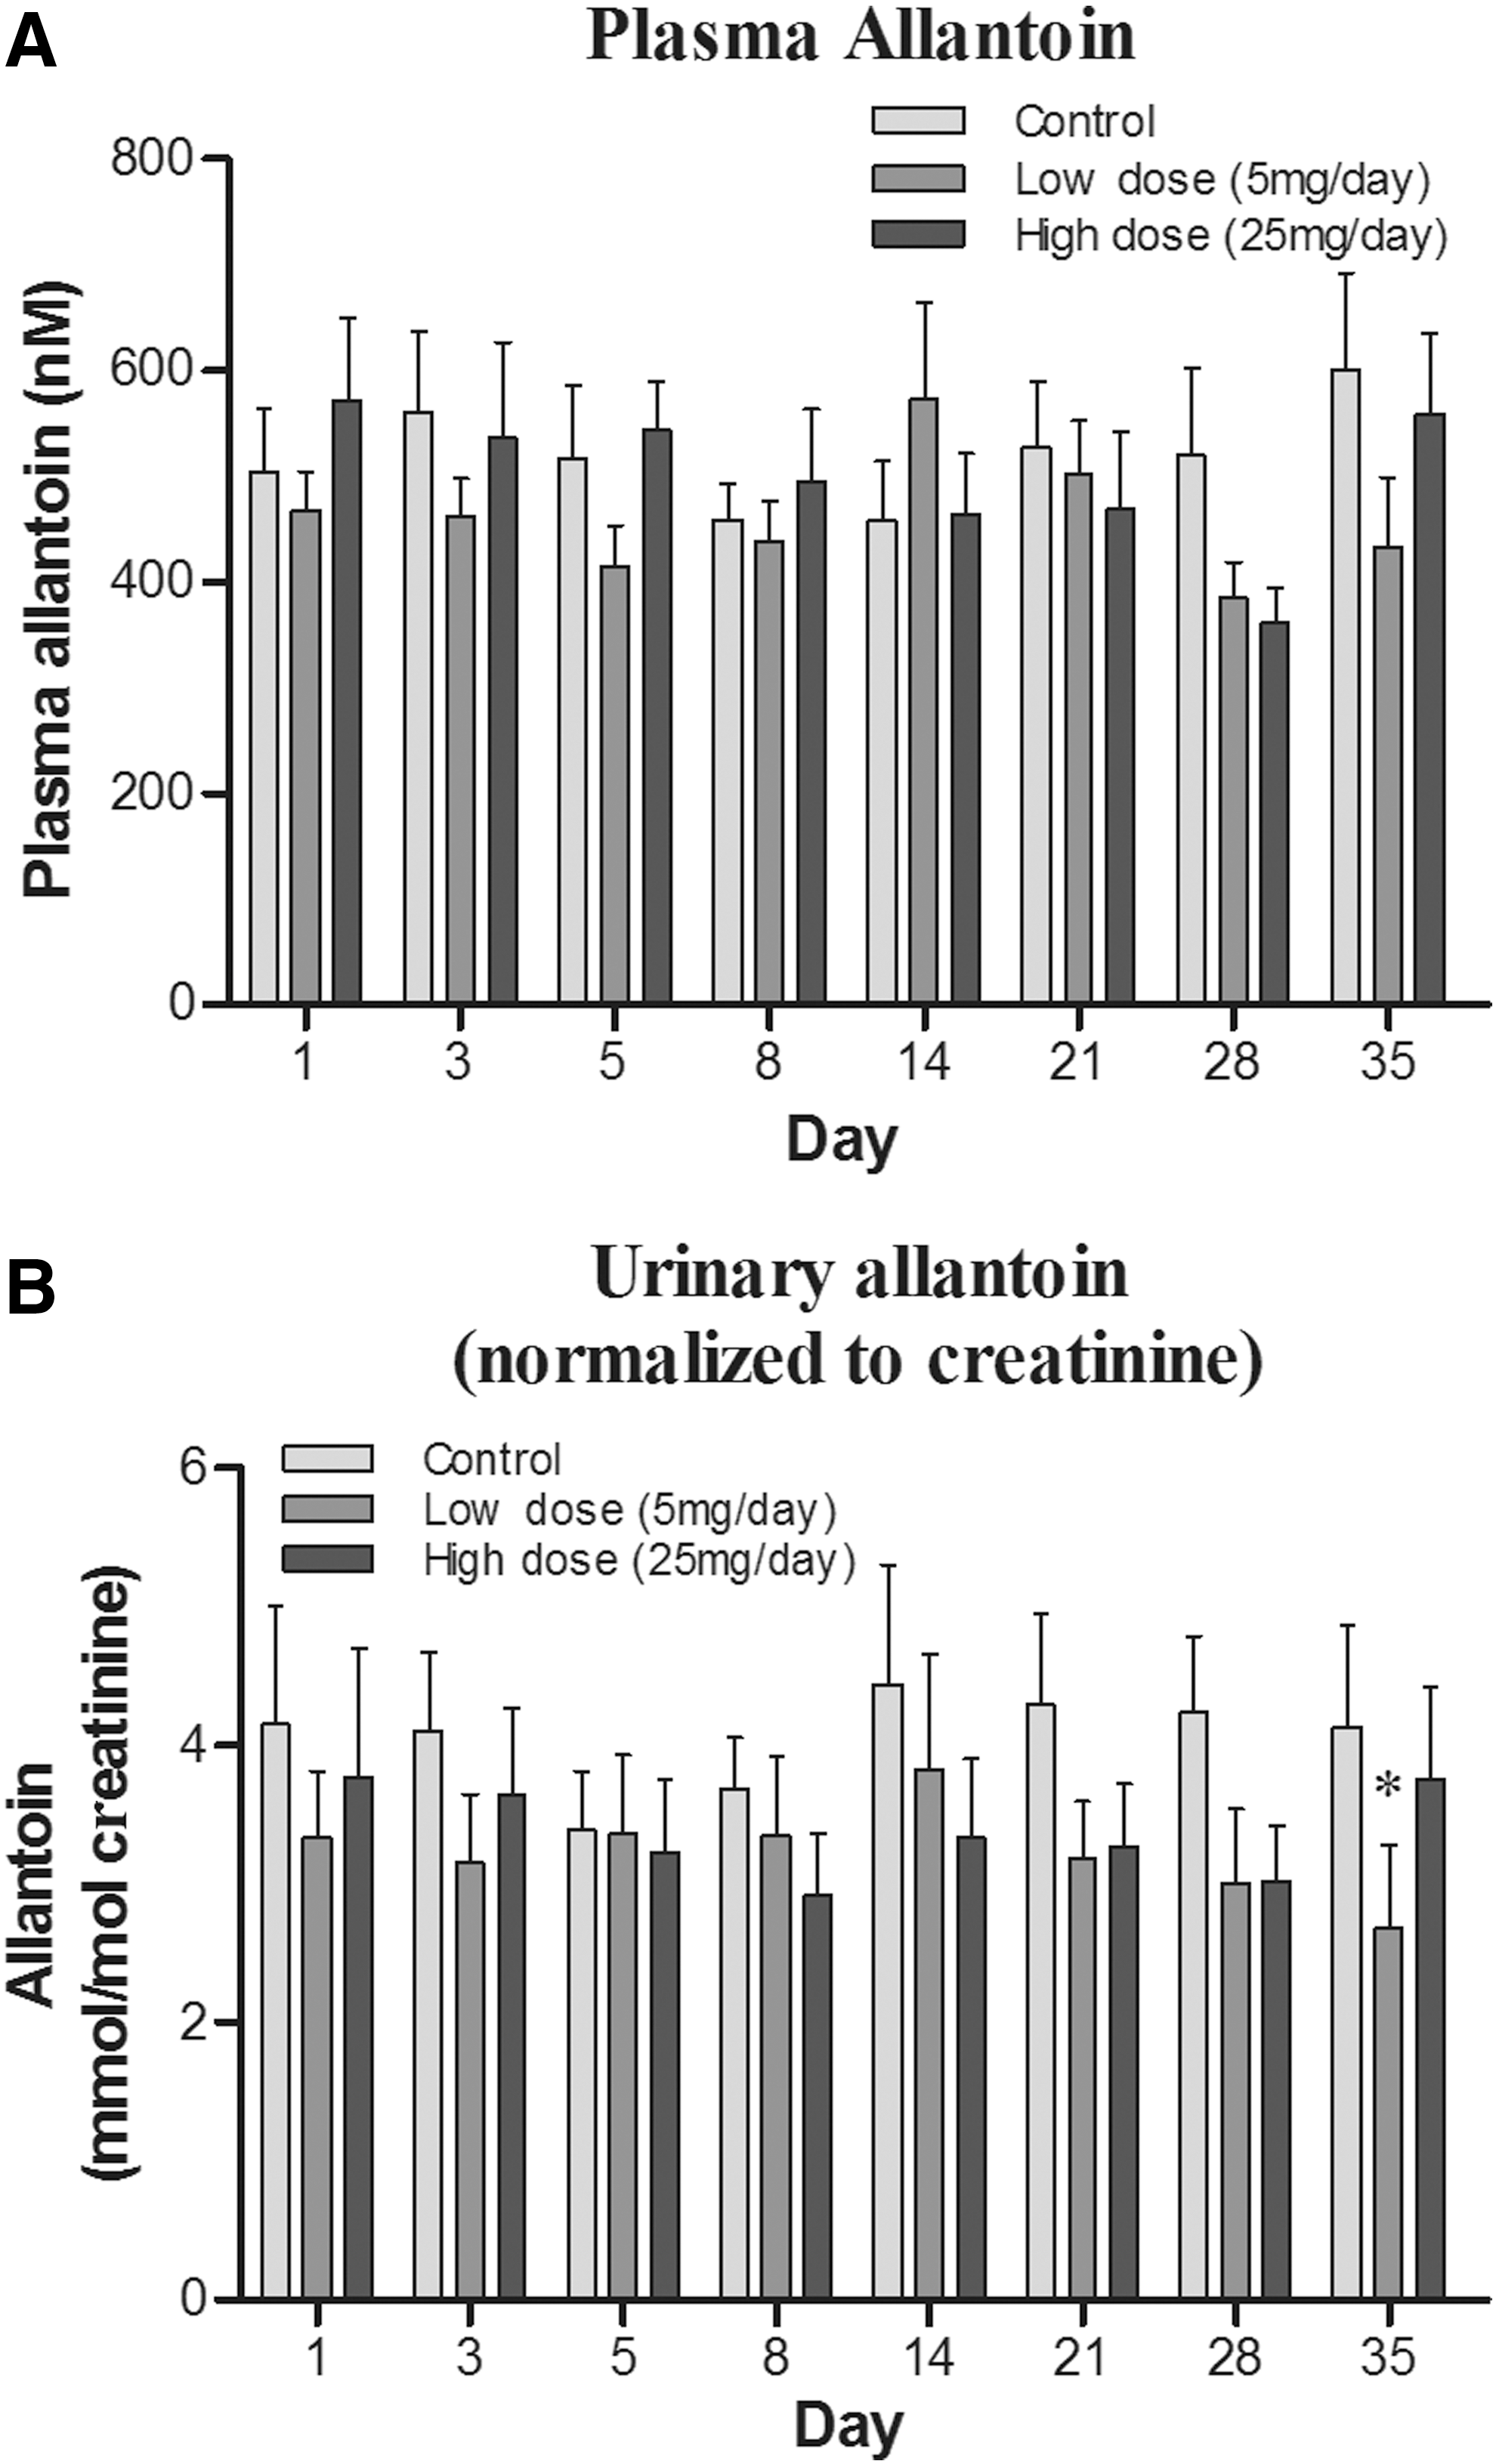
The possible modulation of oxidative damage by ET supplementation was investigated by using the oxidative biomarkers [by-products of oxidative damage to biomolecules (26)], allantoin and 8-hydroxy-2′-deoxyguanosine (8OHdG), which are oxidation products of urate and deoxyguanosine, respectively.
Since humans do not possess a urate oxidase enzyme, urate is the end product of purine catabolism; however, urate can be non-enzymatically converted to allantoin by certain ROS. Allantoin levels can be measured in both plasma and urine and have been widely used as indicators of oxidative stress in vivo (21, 22, 53). Plasma allantoin levels tended to decrease after day 21 with low- and high-dose ET supplementation (Fig. 6A); however, this was not significant. Urinary allantoin levels also demonstrated a clear declining trend with ET supplementation (Fig. 6B). However, allantoin levels were only significantly lower in the low-dose ET group relative to placebo controls at day 35 (p < 0.05).
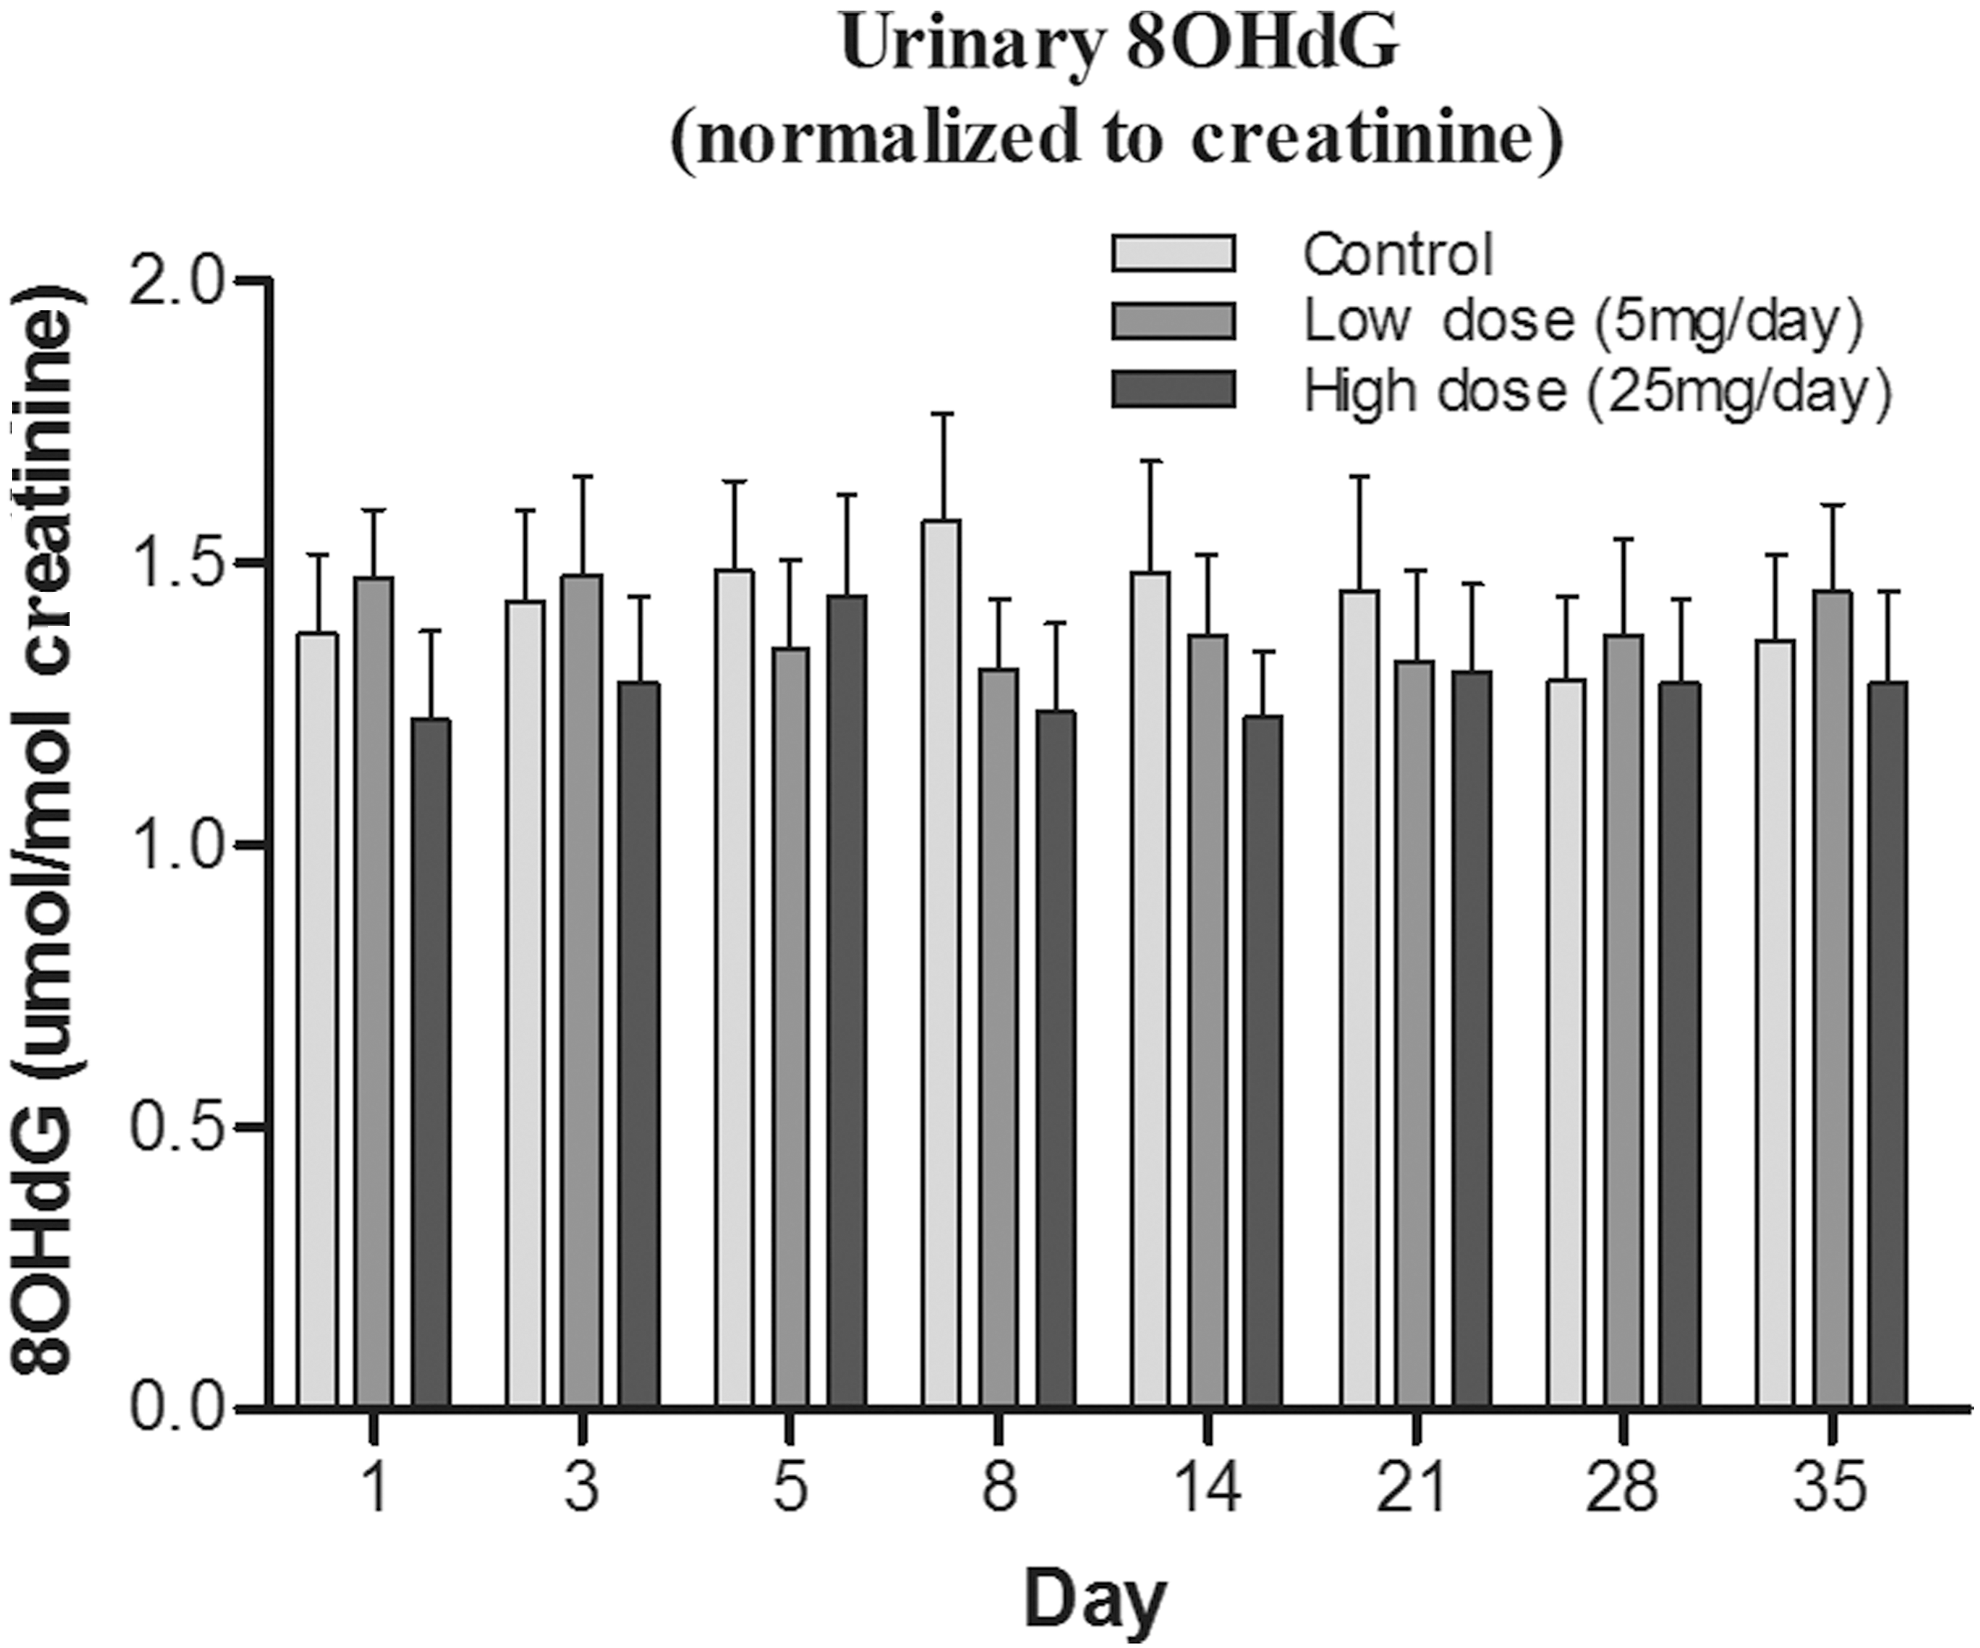
The oxidation of the nucleoside deoxyguanosine in nuclear and mitochondrial DNA, and in the DNA precursor pool, can generate 8OHdG, one of the most frequently measured DNA damage products (24), which can be easily measured in urine (26). Levels of urinary 8OHdG have been suggested to be an “indicator” of oxidative burden; elevated levels are often linked with disorders such as cancer, atherosclerosis, diabetes (62), and neurodegeneration (64) and are also elevated in individuals who are subjected to extraneous toxins, such as smokers (53). The urinary levels of 8OHdG levels (normalized to creatinine) appeared lower in ET-treated groups (Fig. 7), particularly at days 8 and 14; however, this was again not statistically significant.
Effect of ET supplementation on levels of plasma protein carbonyls
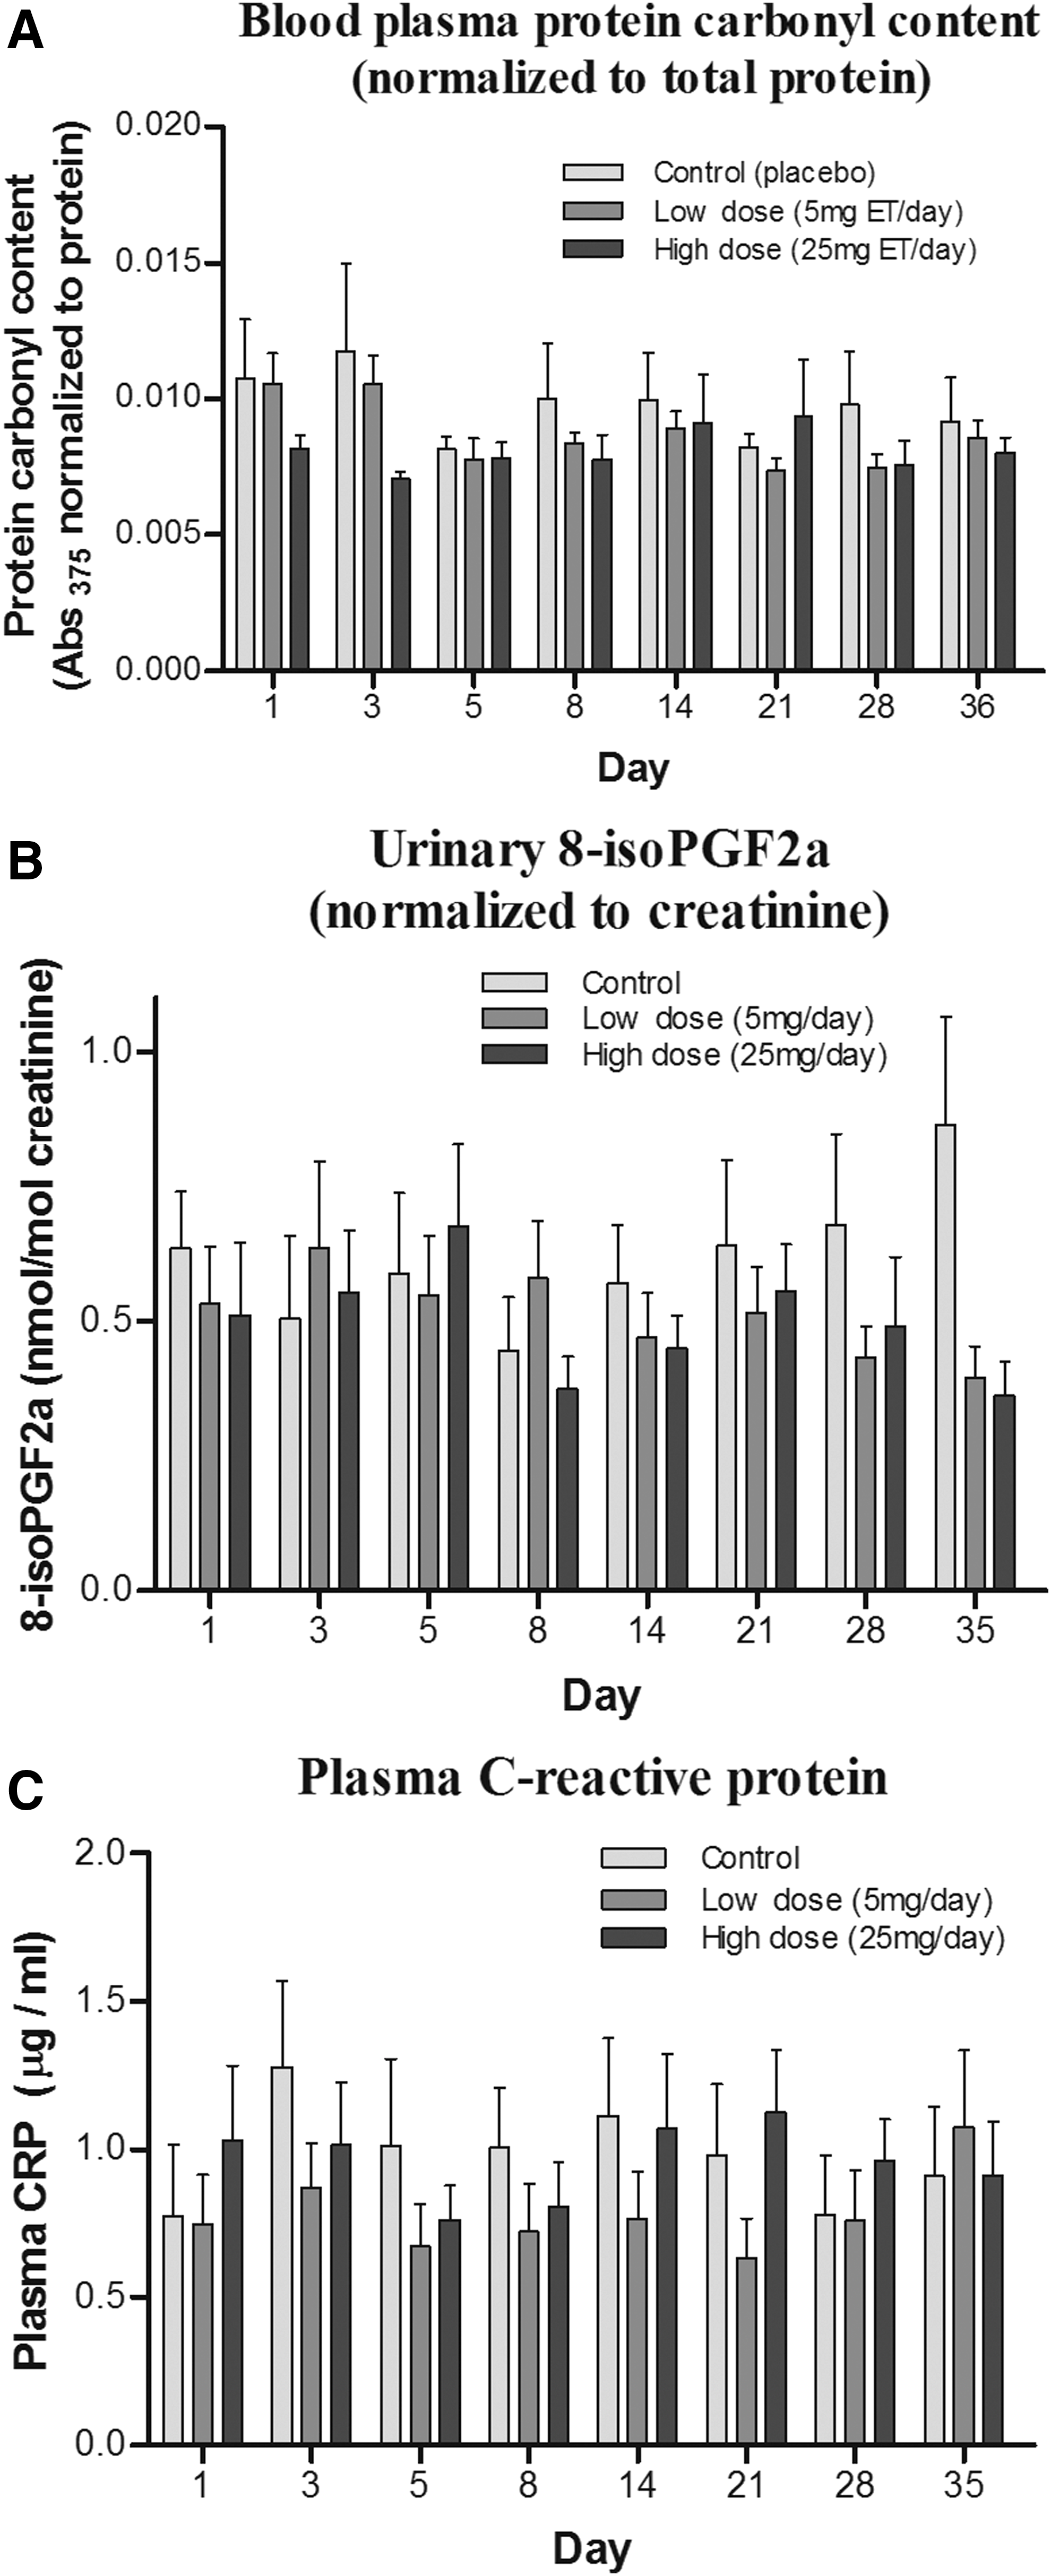
Levels of protein carbonyls [an indicator of oxidative damage to proteins (26)] were measured in the plasma samples. No significant differences were observed in plasma protein carbonyl levels between controls and ET administration groups (Fig. 8A). A large variation between time points was noted.
Effect of ET supplementation on urinary levels of F2-isoprostanes
F2-isoprostanes (8-iso prostaglandin F2α; F2-IsoPs) produced by non-enzymatic peroxidation of arachidonic acid are widely used biomarkers of oxidative damage in humans (41). Urinary F2-IsoPs were extracted by solid-phase extraction [modified from Lee et al. (34)], and levels were measured by liquid chromatography tandem mass spectrometry (LC-MS/MS). Although a decreasing trend of urinary F2-IsoPs was seen with increasing administration of ET (Fig. 8B), this was borderline non-significant (one-way analysis of variance; p = 0.0686). Levels of F2-IsoPs seemed to decrease, especially toward days 28–35 of the study, corresponding to the days with the highest whole blood ET.
Effect of ET supplementation on plasma levels of C-reactive protein
C-reactive protein (CRP) is a sensitive indicator of inflammatory status, and elevated levels of CRP are associated with multiple disorders involving inflammation. We investigated whether administration of ET affected the plasma levels of CRP. No differences were observed between the control and ET-supplemented groups (Fig. 8C); however, the large inter- and intra- (day to day) subject variation in CRP levels could have obscured any trends.
ET tolerance and clinical parameters
No significant differences were observed in both liver function tests and lipid profiles for the duration of the study (clinical parameters were taken at the commencement and conclusion of the study; data not shown). No adverse effects were noted from administration of ET throughout the study. Subjects on routine visits reported no side-effects from administration of ET or placebo.
Discussion
Numerous studies in vitro, and some in vivo, have demonstrated the uptake and accumulation of ET, and its possible antioxidant and cytoprotective benefits (10). A few studies (58, 61) have evaluated the bioavailability of ET after consumption of mushrooms, which contain high levels of ET (16), by humans. No studies to date have evaluated the uptake of pure ET in humans. The present study, thus, sought to evaluate the dose-dependent uptake and accumulation of ET after daily oral administration of 5 or 25 mg ET for 7 days, and its clearance and possible beneficial effects over the subsequent 28 days.
Uptake and accumulation of ET
Our data demonstrate that ET is avidly taken up and retained by the human body. The levels of ET in plasma were significantly elevated during the administration period in a dose-dependent manner and gradually declined in the weeks after the final administration. However, even after 4 weeks, the average plasma ET levels in the high-dose group were still greater than the basal levels at the commencement of the study. In contrast to the plasma levels, the whole blood ET concentrations (presumably consisting of mostly erythrocyte ET) do not appear to be significantly elevated during the administration period, but they steadily increase up to 4 weeks after the administration has ceased.
Levels of ET in urine were seen to increase with dose and time of ET administration. However, the overall excretion of ET remained low compared with the levels of ET in plasma and whole blood, indicating that ET is predominantly absorbed and retained by the body after oral administration. Based on an average urine output of 800–2000 ml/day in adults, we calculated that the estimated percentage ET excretion over the duration of the study was only 1.4–3.7% and 0.7–1.9% of the total ET administered in low- and high-dose subjects, respectively. Since both excreted ET and whole blood levels remain relatively low during the administration phase, this may suggest that ET is primarily accumulated at another tissue or organ in the body. A gradual release of ET from this site(s) could explain the continual steady increase in whole blood for weeks beyond the administration phase.
Studies investigating the uptake of ET in mice demonstrated that liver ET levels increased much faster than in blood (Cheah et al., manuscript in preparation), which may indicate that the liver could be a site for ET accumulation and storage in humans. Another possible site could be the bone marrow, which has a high expression of OCTN1 mRNA (23). Indeed, ET has been suggested to be involved in erythropoiesis (43), possibly leading to the incorporation of higher levels of ET in erythrocytes. In addition, erythrocytes might take up plasma ET; hence, the limited excretion despite the decline in plasma ET after administration ceases.
Variation in basal ET levels
Despite the strict inclusion and exclusion criteria for the study, screening subjects for gender, age, and race and exclusion of subjects with abnormal clinical parameters such as cholesterol and lipid profiles, liver problems, or elevated blood pressure, the variability in basal levels of ET between the subjects was astoundingly different, with up to a 15-fold difference between the highest and lowest basal levels (Fig. 9A). Furthermore, subjects were asked to abstain from ET-rich foods for 2 weeks before the commencement of the study to minimize effects of diet. However, since low levels of ET exist in a wide range of foods (16), this makes it difficult to completely avoid ET uptake. Therefore, these differences could, in part, be due to a long washout period (greater than 4 weeks as shown in these studies) and differences in diet.
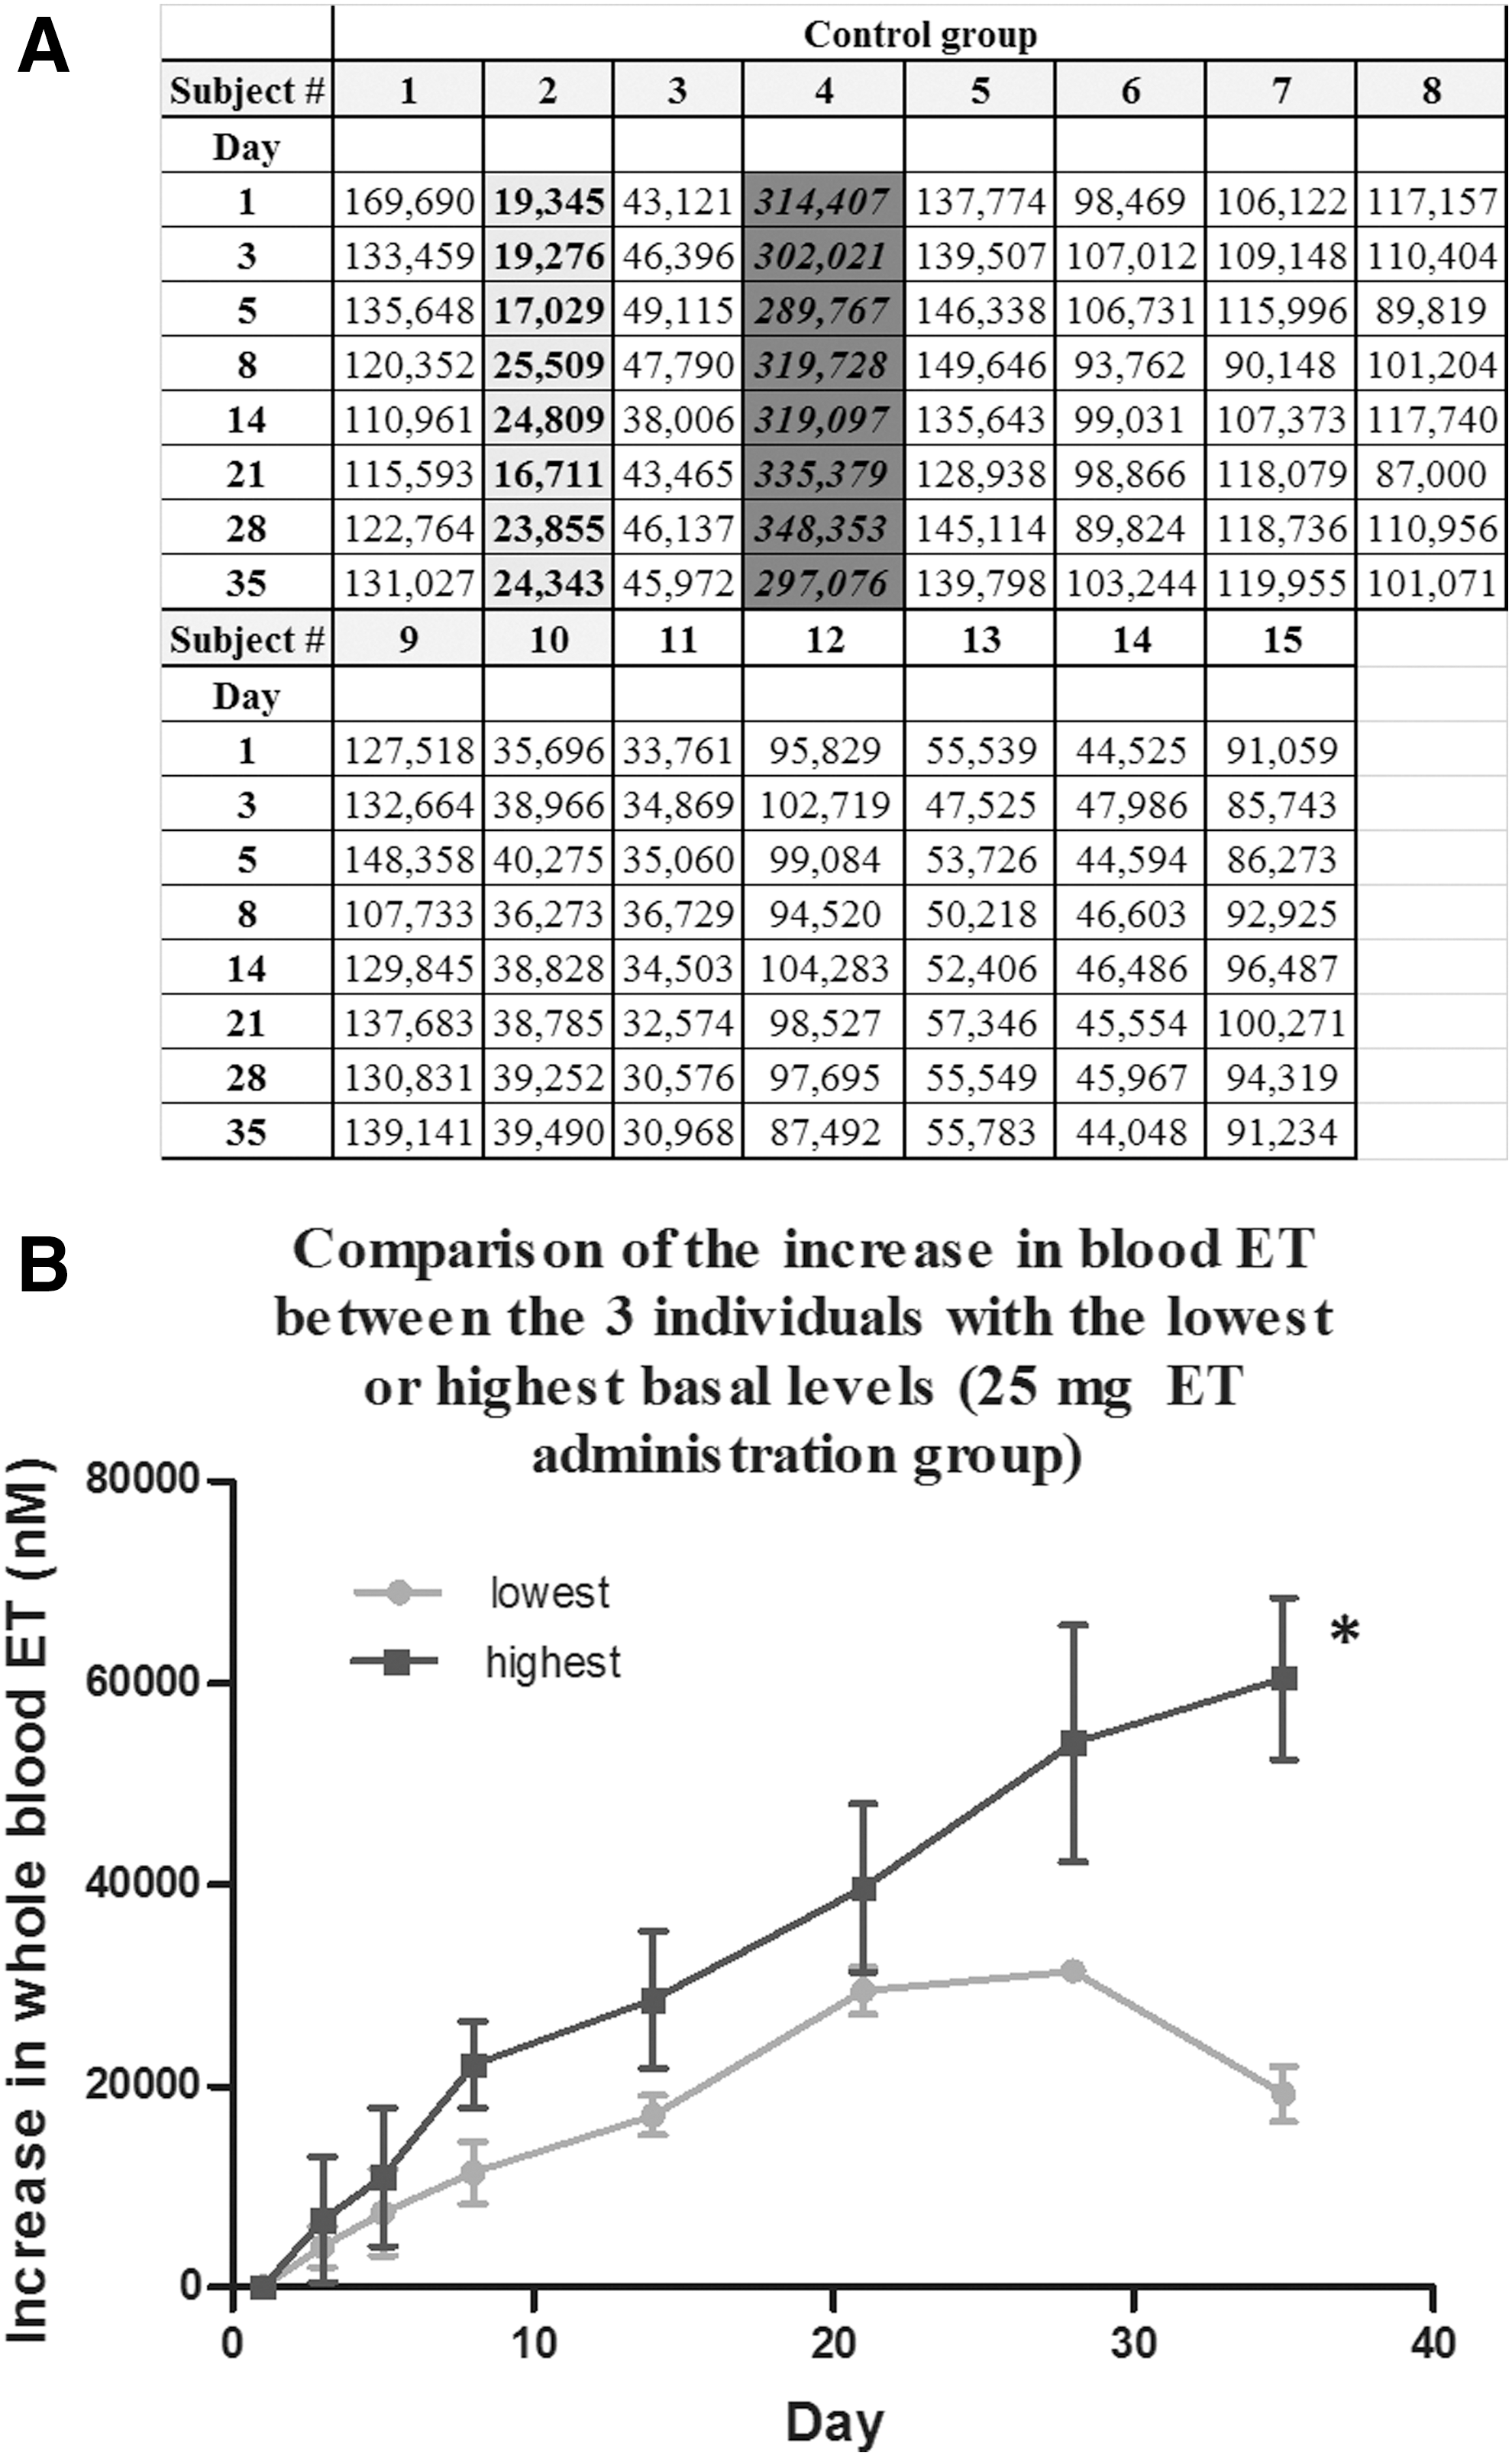
The differences could also be due to polymorphisms of the gene SLC22A4, encoding the ET transporter, OCTN1, which might affect uptake and retention of ET. Indeed, looking more deeply at the uptake between the individuals with the highest and lowest (n = 3; 25 mg administration group) basal whole blood ET levels, we see that there is a significant difference in uptake despite them being administered the same dose (Fig. 9B). Toh et al. (57) demonstrated that single-nucleotide polymorphisms of SLC22A4 can, indeed, alter the transport function of ET.
Metabolites of ET
Although ET sulfonate (ET-SO3) was detectable in some of the blood and urine samples, levels were unfortunately below the limits of quantification (∼5 nM). On the other hand, hercynine and S-methyl-ET were easily quantifiable and were found to very significantly correlate with whole blood ET levels (p < 0.0001), which suggests that these compounds are metabolites of ET. Indeed, studies have shown that hercynine (a precursor in the biosynthesis of ET) is also an oxidation product from the reaction of ET with certain ROS such as hypochlorite, peroxynitrite, hydrogen peroxide, and iron chloride (4, 54). Much less is known regarding the formation of S-methyl-ET; however, methyl halides (e.g., chloromethane, iodomethane) are able to react with GSH to form S-methylglutathione (47), involving glutathione-S-transferase. Although it is not known whether ET could undergo a similar reaction, if it did, it could generate S-methyl-ET.
Alternatively, the hercynine and S-methyl-ET could be derived from the metabolism of ET by gut microflora. However, it may be unlikely that microbiota are a major source of hercynine in the blood since the transport efficiency of hercynine by OCTN1 has been shown to be rather poor (20), and the levels of hercynine in plasma are significantly higher than in urine. On the other hand, levels of S-methyl-ET in urine are far higher than in plasma, suggesting that this compound is a rapidly cleared by-product.
Changes in biomarkers of oxidative damage
Minimal differences (with the exception of F2-isoPs) were observed in the levels of various oxidative damage markers, and also the inflammatory biomarker CRP, between placebo and ET administration groups. The healthy young male volunteers selected for this study were without history of any medical conditions and habits, for example, smoking, which are known to elevate oxidative damage. Thus, our study provides only suggestive evidence that ET administration decreases oxidative damage to lipid, protein, DNA, and urate in these subjects, since for all of them there was a trend to a decrease, but usually not achieving significance.
Nevertheless, despite low levels of urinary F2-IsoPs in the young healthy male subjects, we observed a decreasing trend of F2-IsoPs with ET administration. Although this was borderline non-significant, the differences were the most pronounced toward the end point of the study, which corresponded to the point of the highest ET accumulation in the blood. Possibly, a significant decrease in biomarkers of oxidative stress from ET administration may have occurred if the study duration was longer or if the subjects had elevated oxidative stress, for example, elderly individuals (9), after strenuous exercise or in smokers (53).
Indeed, studies have revealed that when animals are placed under oxidative stress, for example, administration of ferric-nitrilotriacetate (14), ischemia-reperfusion injury (6, 50), induced acute respiratory distress (48), or induced neurodegeneration (55, 63), ET supplementation was able to decrease oxidative stress and inflammation, and to increase survival. In the absence of the ET transporter, OCTN1, the knockout animals devoid of tissue ET also appear normal until placed under stress (11, 32, 45).
Under physiological conditions, ET primarily exists as the thione tautomer. This unique property of ET could mean that under normal healthy circumstances, ET may not be preferentially utilized as an antioxidant when high levels of other basic endogenous antioxidants such as GSH [a primary antioxidant thiol in the body (26)] are present. Instead, it is possible that ET may come into play only when the body is placed under higher oxidative stress. We observed similar outcomes in our ET supplemented mice, where no significant changes in protein carbonyls could be seen in wild-type C57BL6 mice supplemented with high levels of ET, relative to saline-administered controls. However, when the mice were exposed to gamma irradiation, a significant decrease in protein carbonylation was observed in ET-treated animals (Cheah et al., unpublished data).
Indeed, we recently proposed that tissues may deliberately elevate levels of ET by increasing the expression of OCTN1 in response to stress or damage (25). The avid uptake and retention of ET despite the lack of obvious function in healthy individuals suggests that the body may store the ET until it is required, possibly as a defense mechanism. Under pathological conditions, these stores of ET may be activated or utilized at the sites of elevated ROS or tissue injury, as seen in animal studies.
It was previously shown that OCTN1 expression can be transcriptionally activated by RUNX1, inflammatory cytokines, and NFκB (37), and more recently, ET was shown to mediate cytoprotection through induction of Nrf2 and Hsp70 (30, 49). Moreover, ET has been shown to elevate the expression of glutathione reductase, catalase, and superoxide dismutase, while decreasing the expression of NADPH oxidase 1 (NOX), in human brain microvascular endothelial cells (35). Indeed, the upregulation of these “vitagenes” in hormetic pathways has been associated with a reduction in diseases related to oxidative stress, such as cancer and neurodegeneration (7, 8). NOX activity is recognized as a major source of ROS in the body, and these ROS are suggested to play a key role in the generation of F2-IsoPs (60). Hence, if, indeed, ET downregulates NOX, this may, in part, explain the decreasing trend of urinary F2-IsoPs seen with ET-administered subjects, which will be explored in future work.
Safety of ET
Toxicology, studies in animals or bacteria have reported an absence of adverse effects from administration of ET (17, 51, 52). Likewise, in this study, there were no reported adverse effects from the administration of pure ET in humans. In addition, no changes were observed in liver function tests and lipid profiles (measured at commencement and conclusion of the study) from administration of ET.
Conclusion
The current study presents the first data from administration of pure ET supplements to humans. As with prior animal studies, we see that ET is avidly absorbed and retained by the body. Although minimal effects of ET were observed in inflammatory biomarkers and oxidative damage, a trend to a decrease in the latter was clear.
At this stage, it is not known whether ET supplementation in humans will benefit “at risk” individuals by modulation of oxidative stress and inflammation and whether lower basal levels of ET increase risk of disease (9). Further work will be needed to elucidate this.
Materials and Methods
Chemicals, reagents, and investigational compound
ET,
Study design and ethics procedures
The placebo-controlled, double-blinded study was undertaken in healthy human male volunteers (n = 15/group; Investigational Medicine Unit, National University Health System) aged 21–35 years (inclusive) and randomly assigned to placebo, 5 mg ET, or 25 mg ET groups. A 5 mg ET dose was estimated to be equivalent to one serving of mushrooms (61), whereas the higher dose was five times more, to examine the upper limits of ET uptake. A pre-screening was conducted 2 weeks before the commencement of the study to ensure that subjects met a list of parameters to minimize variables. Two weeks before the commencement, and for the entire duration of the study, subjects were requested to abstain from foods containing high levels of ET, for example, mushrooms, liver, beans, etc., to minimize variability in ET levels due to diet, and also from antioxidant tablets or other supplements. All the procedures were approved by the National Healthcare Group, Domain Specific Review Board (protocol number: 2013/01074).
Screening parameters
Healthy male volunteers of Chinese ethnicity, aged 21–35 years (inclusive), were recruited for initial screening. After the briefing and informed consent, the recruited subjects were screened for inclusion criteria to minimize variability. Men were selected, since gender differences in ET accumulation were previously observed in rats (36), probably related to testosterone levels, and furthermore, men have been suggested to have higher oxidative stress levels than women (59). Subjects were required to have a body mass index of between 18 and 25, a blood pressure range of 115–135 systolic and 60–85 diastolic, total cholesterol <240 mg/dl, and low-density lipoprotein-cholesterol <160 mg/dl. Subjects with pre-existing medical conditions (i.e., history of cardiovascular complications, diabetes, hypertension, hypercholesterolemia, anemia or other hematological conditions, chronic inflammatory conditions, or any infectious disease or fever) were excluded from the study. In addition, subjects failing to meet healthy reference values for liver and renal function tests, with a history of cigarette smoking, drug or alcohol abuse, on any prescription medication, or involved in another study requiring compound administration in the 30 days before the screening, were excluded from the study.
ET administration, study compliance, and blood and urine sampling
Subjects were randomly allocated to one of the three administration groups: placebo, 5 mg ET, or 25 mg ET. Placebo or ET capsules (Tetrahedron; GMP certified; identical encapsulation; and blinded by the manufacturer) were orally administered every morning for 7 days. Capsules were administered at the clinic after blood and urine sampling on days 1, 3, and 5. Take-home capsules were provided for days 2, 4, 6, and 7. Subjects returned the empty package, noting consumption time, to verify compliance. Other aspects of study compliance, including review of abstinence from ET-rich foods, and administration of any medications were conducted during study visits. Blood and urine samples were collected on days 1, 3, 5, 8, 14, 21, 28, and 35 (Fig. 2). Venous blood (8 ml) was collected in K2EDTA vacutainers (Becton Dickinson). Aliquots (250 μl) of whole blood were transferred to 1.5 ml tubes and stored at −80°C. Plasma was obtained by centrifugation at 2500 rpm for 15 min, stored in 250 μl aliquots with butylated hydroxytoluene (16 μM) and indomethacin (20 μM), and stored at −80°C. Urine samples were stored in 2 ml aliquots at −80°C.
Sample preparation for ET, S-methyl ET, hercynine, and allantoin measurement
Samples were thawed on ice and vortexed briefly to ensure homogeneity. For whole blood, 20 μl was added to 200 μl of ultrapure water (Sartorius) containing ET-d9 and hercynine-d9. Samples were heated at 80°C for 15 min and centrifuged (14,000 g, 15 min). Two hundred microliters of supernatants were added to 1 ml cold acetone for 2 h at −20°C. Samples were centrifuged, and the acetone in the supernatant was removed by using a vacuum evaporator. The aqueous supernatants were transferred to silanized glass inserts with vials (Agilent CrossLab) for LC-MS/MS measurement.
For plasma, 30 μl of sample was mixed with 127 μl methanol containing ET-d9, hercynine-d9, and allantoin-15N4 internal standards. Samples were vortexed and incubated at −20°C for 2 h. Samples were centrifuged, and supernatants were transferred to silanized inserts for analysis.
For urine, after thawing, samples were centrifuged to remove precipitated debris. Supernatants (15 μl) were mixed with 8 μl of internal standards containing ET-d9, hercynine-d9, and allantoin-15N4 and 285 μl of methanol. Samples were treated as per the plasma samples described earlier.
Urinary, plasma, and whole blood ET, S-methyl-ET, and hercynine measurement by LC-MS/MS
LC-MS/MS was performed by using an Agilent 1200 LC coupled to a 6460-QQQ mass spectrometer (Agilent Technologies). Samples were kept at 10°C in the autosampler. Samples (5 μl) were injected onto a Cogent Diamond-Hydride column (4 μm, 150 × 2.1 mm, 100 Å; MicroSolv Technology Corporation) that was maintained at 30°C. The mobile phase was 100% acetonitrile (solvent A; solvA) and 0.1% formic acid (solvent B; solvB). Chromatographic separation was achieved by using a gradient elution at 0.4 ml/min from 25% solvB at 1 min to 40% solvB over 3 min to elute ET. A further increase to 90% solvB over 3 min was applied to elute S-methyl-ET and hercynine. This was maintained for 1.25 min before re-equilibration of the column at 25% solvB for 2.5 min. The retention times for ET, hercynine, and S-methyl ET were 3.6, 7.1, and 7.2 min, respectively.
MS was carried out under positive ion, electrospray ionization (ESI) mode, using multiple reaction monitoring (MRM) for quantification of specific target ions. Capillary voltage was 3200 V, and gas temperature was 350°C. Nitrogen sheath gas pressure for nebulizing the sample was 50 psi, with a gas flow rate of 12.5 l/min. Ultra-high-purity nitrogen was used as collision gas.
Urinary and plasma allantoin measurement by LC-MS/MS
Five-microliter processed samples were injected onto a Hypercarb column (5 μm, 100 × 4.6 mm; Thermo Scientific) that was maintained at 30°C. Allantoin was separated by gradient elution at 0.6 ml/min from 90% solvB (0.1% formic acid) and 10% solvA (acetonitrile), to 10% solvB over 5 min. This was maintained for 1 min before returning to 90% solvB to equilibrate the column for 2.5 min. Allantoin was eluted at 2.7 min. All MS parameters were the same as for ET analysis, except capillary voltage, which was set at 5000 V.
Urinary 8OHdG measurement by LC-MS/MS
Urine samples were thawed and centrifuged to remove debris before the sample clean-up. Five hundred microliters of urine were mixed with 5 μl of 1 ng/ml 8OHdG-13C15N2 and passed through Clean Screen FASt 96-well 100 mg SPE plates. Twenty-five microliters of the resulting samples were injected onto a Synergi Polar Reverse-Phase column (80 Å, 4 μm, 100 × 2.0 mm; Phenomenex). Chromatographic separation was achieved by using isocratic elution at 0.6 ml/min using 95% of solvB (0.1% formic acid) and 5% of solvA (acetonitrile) for 2 min, after which the column was washed using 10% of solvB for 2.5 min, before returning to 95% of solvB to equilibrate the column for 3.5 min. 8OHdG was eluted at 1.55 min. All MS parameters were the same as for ET analysis, except capillary voltage, which was set at 3000 V.
Urinary F2-IsoP measurement by LC-MS/MS
F2-IsoP (8-iso-PGF2α) and F2-IsoP-d4 (IPF2α-VI-d4) were obtained from Cayman. Standards were dissolved in 1:1:2, acetonitrile:methanol:water with 0.01% acetic acid. A standard curve was generated from 5 to 200 ng/ml by serial dilution in elution buffer.
Three milliliters of urine were mixed with 25 ng internal standards (F2-IsoP-d4), and cleaned by SPE using Oasis MAX 3cc mixed-mode cartridges. Briefly, urine samples were passed through Oasis MAX columns, and they were pre-conditioned with 2 ml methanol and 2 ml 0.1% formic acid by gravity elution. Columns were washed with 2 ml 2% ammonium hydroxide followed by 2 ml methanol. The columns were dried under negative pressure before washing with 2 ml of 33:2:65, methanol:formic acid:water, then 2 ml 80:18:2, hexane:ethyl acetate:formic acid, and finally eluted with 1.5 ml 53:45:2, ethyl acetate:hexane:formic acid. The eluents were dried under a stream of N2 gas and resuspended in 0.01% acetic acid.
Twenty-five microliters of the resulting samples were injected onto a PFP reversed-phase Accucore column (2.6 μm, 100 × 2.1 mm; Thermo Scientific). Chromatographic separation was achieved by gradient elution at 0.4 ml/min from 70% solvB (0.01% acetic acid), 30% solvA (1:1 acetonitrile: methanol with 0.01% acetic acid) at 2 min to 68% solvB in 10 min, after which the column was washed by using 95% of solvA for 2.5 min, before returning to 70% of solvB to equilibrate the column for 2.5 min. F2-IsoPs were eluted at 7.25 min.
MS was carried out under negative ion ESI and MRM mode, with a capillary voltage of 5000 V. All other parameters were as previously described for ET analysis.
Transitions and MS parameters
Precursor to product ion transitions and fragmentor voltages (V)/collision energies (eV) for each compound were as follows: ET; 230.1 → 186, 103 V/9 eV, ET-d9; 239.1 → 195.1, 98 V/9 eV, and hercynine; 198.1 → 95.1, 94 V/21 eV, and hercynine-d9; 207.2 → 95.1, 97 V/21 eV, and S-methyl-ET; 244.1 → 141, 92 V/17 eV, and allantoin; 159 → 116, 70 V/2 eV, and allantoin-15N4; 161 → 118, 70 V/2 eV, and 8OHdG; 284 → 161, 80 V/10 eV, and 8OHdG-13C15N2; 287 → 171, 80 V/10 eV, and F2-IsoP; 353.2 → 193.2, 143 V/24 eV, and F2-IsoP-d4; and 357.2 → 197.2, 143 V/24 eV.
Urinary creatinine assay
The Jaffe method was used. Briefly, 15 μl diluted urine were mixed with 125 μl creatinine color reagent (0.6% picric acid in water, 0.2 M phosphate buffer pH 7.4, 1.6% sodium dodecyl sulfate) and 25 μl 1 M NaOH. Samples were mixed for 10 min before measuring absorbance at 500 nm (initial) by using a microplate reader (Synergy BioTek). Then, 5 μl of 60% acetic acid was added and samples were mixed for 5 min before measuring absorbance at 500 nm (final). The absorbance was recorded as a difference between the initial and final reading and quantified relative to creatinine standards (20–100 μg/ml).
Protein carbonyl assay
Protein carbonyl contents in the plasma samples were analyzed by using a commercial assay kit according to the manufacturer's protocol with modifications (Sigma-Aldrich). Briefly, three samples from the same group were pooled together and diluted 1:7 with phosphate-buffered saline (PBS). Total protein of the diluted samples was quantified (DC protein assay; BioRad) to ensure that concentrations were between 15 and 20 mg/ml. One hundred microliters of diluted plasma samples were added to 2,4-dinitrophenylhydrazine solution and incubated at 25°C for 15 min; then, 30 μl of 100% w/v trichloroacetic acid solution were added to precipitate proteins. Samples were incubated on ice for 5 min and centrifuged at 13,000 g for 5 min at 4°C. Supernatants were removed, and the pellets were washed with cold acetone and incubated at −20°C for 10 min before centrifugation. The acetone was removed, and the resultant pellets were resolubilized in 200 μl of 6 M guanidine hydrochloride. One hundred microliters of the samples was transferred to a microtiter plate, and the absorbance at 375 nm was measured. Protein carbonyl contents were normalized to total protein.
CRP enzyme-linked immunosorbent assay
Microtiter plates (96-well; Nunc-Immun; Nalgene) were coated with 100 μl 5 μg/ml anti-human CRP monoclonal antibody (ab8278; Abcam) in carbonate buffer (pH 9.6), overnight at 4°C. Wells were washed twice with PBS-T (0.1% v/v) and 100 μl of diluted (1:500 or 1:4000) plasma samples or CRP standards were added. Plates were incubated for 2 h at 25°C on an orbital shaker (200 rpm); then, they were washed thrice with PBS-T. One hundred microliters of horseradish peroxidase-conjugated anti-human-CRP antibody (0.5 μg/μl; ab24461) were added, and plates were incubated at room temperature for 1 h. The plates were washed four times with PBS-T, and 100 μl of 3,3′,5,5′-tetramethylbenzidine substrate were added to each well. Plates were incubated in the dark for 15 min, and 100 μl 2 M H2SO4 were added to stop further color development. Plates were read at 450 nm after subtracting reference readings at 570 nm, and concentrations were calculated from a calibration curve.
Clinical parameters
Blood samples (∼4 ml venous blood in K2EDTA and NaF vacutainers) during screening and final visits were sent to National University Hospital Referral Laboratory for analyses. Samples were analyzed for liver function (albumin, bilirubin, alanine transaminase, aspartate transaminase, alkaline phosphatase, and lactate dehydrogenase), fasting glucose, cholesterol (low/high-density lipoprotein), triglycerides, and gamma-glutamyl transpeptidase (GGT). Blood samples from the final visit were again monitored for liver function, cholesterol, triglycerides, and GGT.
Statistical analysis
Data were tabulated by using Microsoft Excel (Microsoft Corporation). Graphs and statistical analyses were created/performed by using Graphpad Prism version5 (Graphpad). Data are expressed as mean ± standard error of the mean, with p < 0.05 considered statistically significant. Pearson's correlation coefficient was used to calculate associations between variables with p < 0.05, indicating significance of the correlation coefficient.
Footnotes
Acknowledgments
The authors wish to thank Tetrahedron (14 avenue de l'Opera, Paris, France) for providing the encapsulated
Author Disclosure Statement
No competing financial interests exist.
Abbreviations Used
References
Supplementary Material
Please find the following supplemental material available below.
For Open Access articles published under a Creative Commons License, all supplemental material carries the same license as the article it is associated with.
For non-Open Access articles published, all supplemental material carries a non-exclusive license, and permission requests for re-use of supplemental material or any part of supplemental material shall be sent directly to the copyright owner as specified in the copyright notice associated with the article.