
Abstract
Aims:
Microglial cells are brain-resident macrophages engaged in surveillance and maintained in a constant state of relative inactivity. However, their involvement in autoimmune diseases indicates that in pathological conditions microglia gain an inflammatory phenotype. The mechanisms underlying this change in the microglial phenotype are still unclear. Since metabolism is an important modulator of immune cell function, we focused our attention on glutamine synthetase (GS), a modulator of the response to lipopolysaccharide (LPS) activation in other cell types, which is expressed by microglia.
Results:
GS inhibition enhances release of inflammatory mediators of LPS-activated microglia in vitro, leading to perturbation of the redox balance and decreased viability of cocultured neurons. GS inhibition also decreases insulin-mediated glucose uptake in microglia. In vivo, microglia-specific GS ablation enhances expression of inflammatory markers upon LPS treatment. In the spinal cords from experimental autoimmune encephalomyelitis (EAE), GS expression levels and glutamine/glutamate ratios are reduced.
Innovation:
Recently, metabolism has been highlighted as mediator of immune cell function through the discovery of mechanisms that (behind these metabolic changes) modulate the inflammatory response. The present study shows for the first time a metabolic mechanism mediating microglial response to a proinflammatory stimulus, pointing to GS activity as a master modulator of immune cell function and thus unraveling a potential therapeutic target.
Conclusions:
Our study highlights a new role of GS in modulating immune response in microglia, providing insights into the pathogenic mechanisms associated with inflammation and new strategies of therapeutic intervention. Antioxid. Redox Signal. 26, 351–363.
Introduction
M
Recently, metabolism has been highlighted as an important mediator of immune cell function through the discovery of mechanisms that (behind these metabolic changes) strongly impact on immune function potentially modulating pathological events associated with inflammation. The present study shows for the first time a metabolic mechanism mediating microglial response to a proinflammatory stimulus, pointing to glutamine synthetase activity as a master modulator of immune cell function. Unraveling this mechanism is fundamental for both the understanding of the mechanisms, by which oxidative stress translates into inflammatory signals, and for setting up new diagnostic tools and strategies of therapeutic intervention.
GS activity is evidently an element connecting glutamate metabolism to inflammation. Indeed, we have shown that GS expression desensitizes mature adipocytes to proinflammatory stimuli through the elevation of intracellular glutamine levels (50). This highlights a novel mechanism by which glutamine acts as signal molecule, leading to suppression of certain aspects of inflammation. A similar regulatory role of GS and glutamine has been noted in B cells, in which GS inhibits the mTOR pathway by raising intracellular glutamine (68). This novel function of GS in modulating the immune response through metabolism could be important in brain due to its expression in microglial cells. Important in this regard is the fact that brain GS, at variance with the liver and muscle isoform, is not feedback inhibited by glutamine (20). Furthermore, a strong body of evidence demonstrates that GS is highly sensitive to oxidants and therefore a fundamental redox target. Brain GS is a recognized target of oxidative stress in neurodegenerative disorders (8, 9) and in models of immune diseases through redox proteomic studies, and oxidative damage has been associated with reduced protein function (9).
Based on these data, we sought to investigate the role of GS expression and activity in lipopolysaccharide (LPS)-activated N9 and primary murine microglia to unravel the significance of its function with respect to microglial response to proinflammatory stimuli. Our results demonstrate that GS inhibition potentiates the microglial response to proinflammatory stimuli, leading to neuronal toxicity. In addition, the increased microglial inflammatory response is related to a reduced insulin-mediated glucose uptake. These data are translated in vivo, in which the response to LPSs of the microglial-specific GS conditional knockout (GScKO) mouse is strongly enhanced compared with the WT animal. GS function is also impaired in the spinal cord of mice with experimental allergic encephalomyelitis (EAE), in which microglia cells are known to play a role. These results unravel a novel mechanism by which the inflammatory response is endogenously controlled by GS expression and activity in microglia. The present findings also highlight a potential mechanism that through GS inhibition might lead to brain insulin resistance.
Results
GS is expressed in N9 activated with LPSs
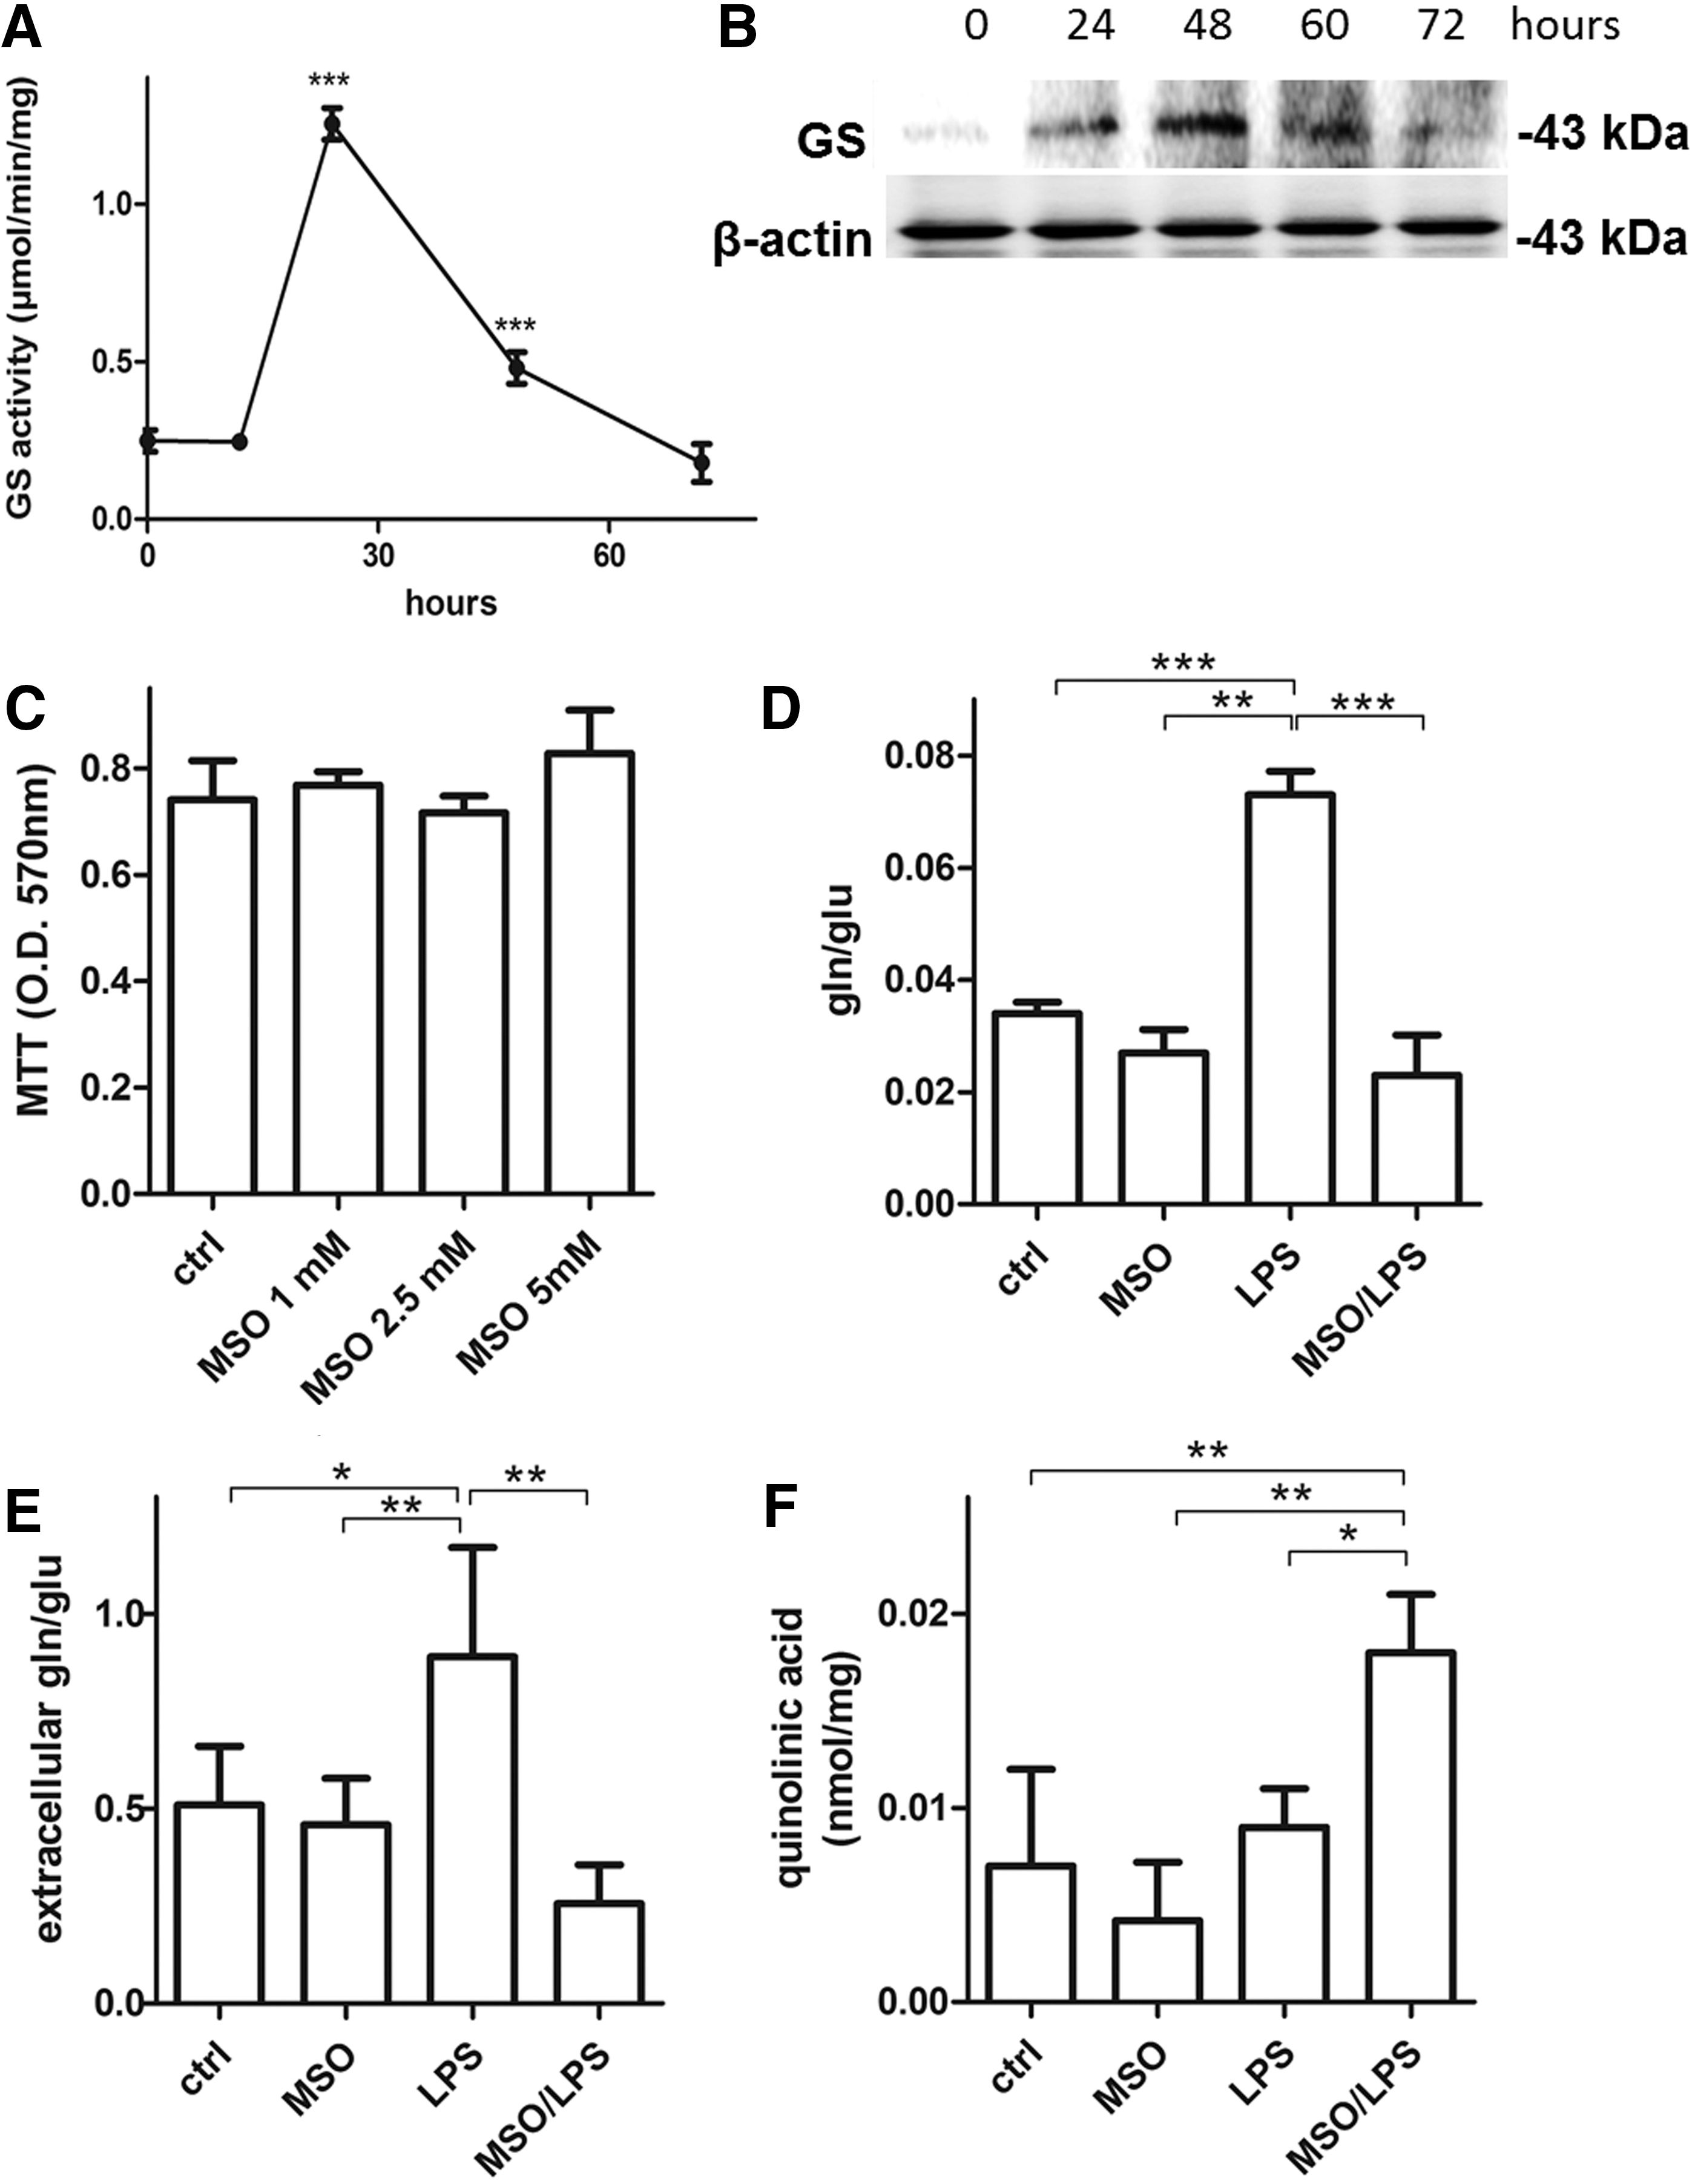
To assess whether LPS can induce GS in N9 microglia in a time course manner, cells were incubated with LPSs (100 ng/mL) for 12, 24, 48, and 72 h. LPSs significantly increased GS activity strongly at 24 h after LPS treatment, then the enzyme activity decreased to reach control levels at 72 h (Fig. 1A). At variance with GS activity, the highest GS protein levels were reached only at 48 h after LPS treatment (Fig. 1B). These data demonstrate that microglial GS activity and expression are increased following LPS treatment. However, GS activity responds earlier after induction of a proinflammatory stimulus and this is not synchronized with GS protein expression, which increases at a later time point as similarly described by others (48).
GS inhibition enhances the inflammatory response of N9 microglia
To establish the role of GS in activated microglia, we treated N9 cells with LPS for 24 h in the presence of the GS inhibitor, methionine sulfoximine (MSO), which does not influence cell viability at a concentration up to 5 mM (Fig. 1C). In line with induction of GS activity, LPSs significantly increased the intracellular glutamine-to-glutamate ratio by 114%, which was promptly reversed by treatment with MSO (Fig. 1D). We also measured the levels of glutamate and glutamine in the microglial media following an LPS or LPS/MSO stimulation for 24 h. As expected, in media harvested from LPS-treated microglia, the glutamate/glutamine ratios were 63% higher (Fig. 1E) compared with resting microglia. However, MSO treatment strongly reverted this effect as the ratio decreased by 51% and by 70% compared with control and LPS-treated cells, respectively. These data demonstrate that extracellular glutamate levels are affected by GS inhibition. We then wanted to ascertain whether increased medium glutamate was also accompanied by an increase in the N-methyl-
GS inhibition enhances the inflammatory response of N9 and primary microglia
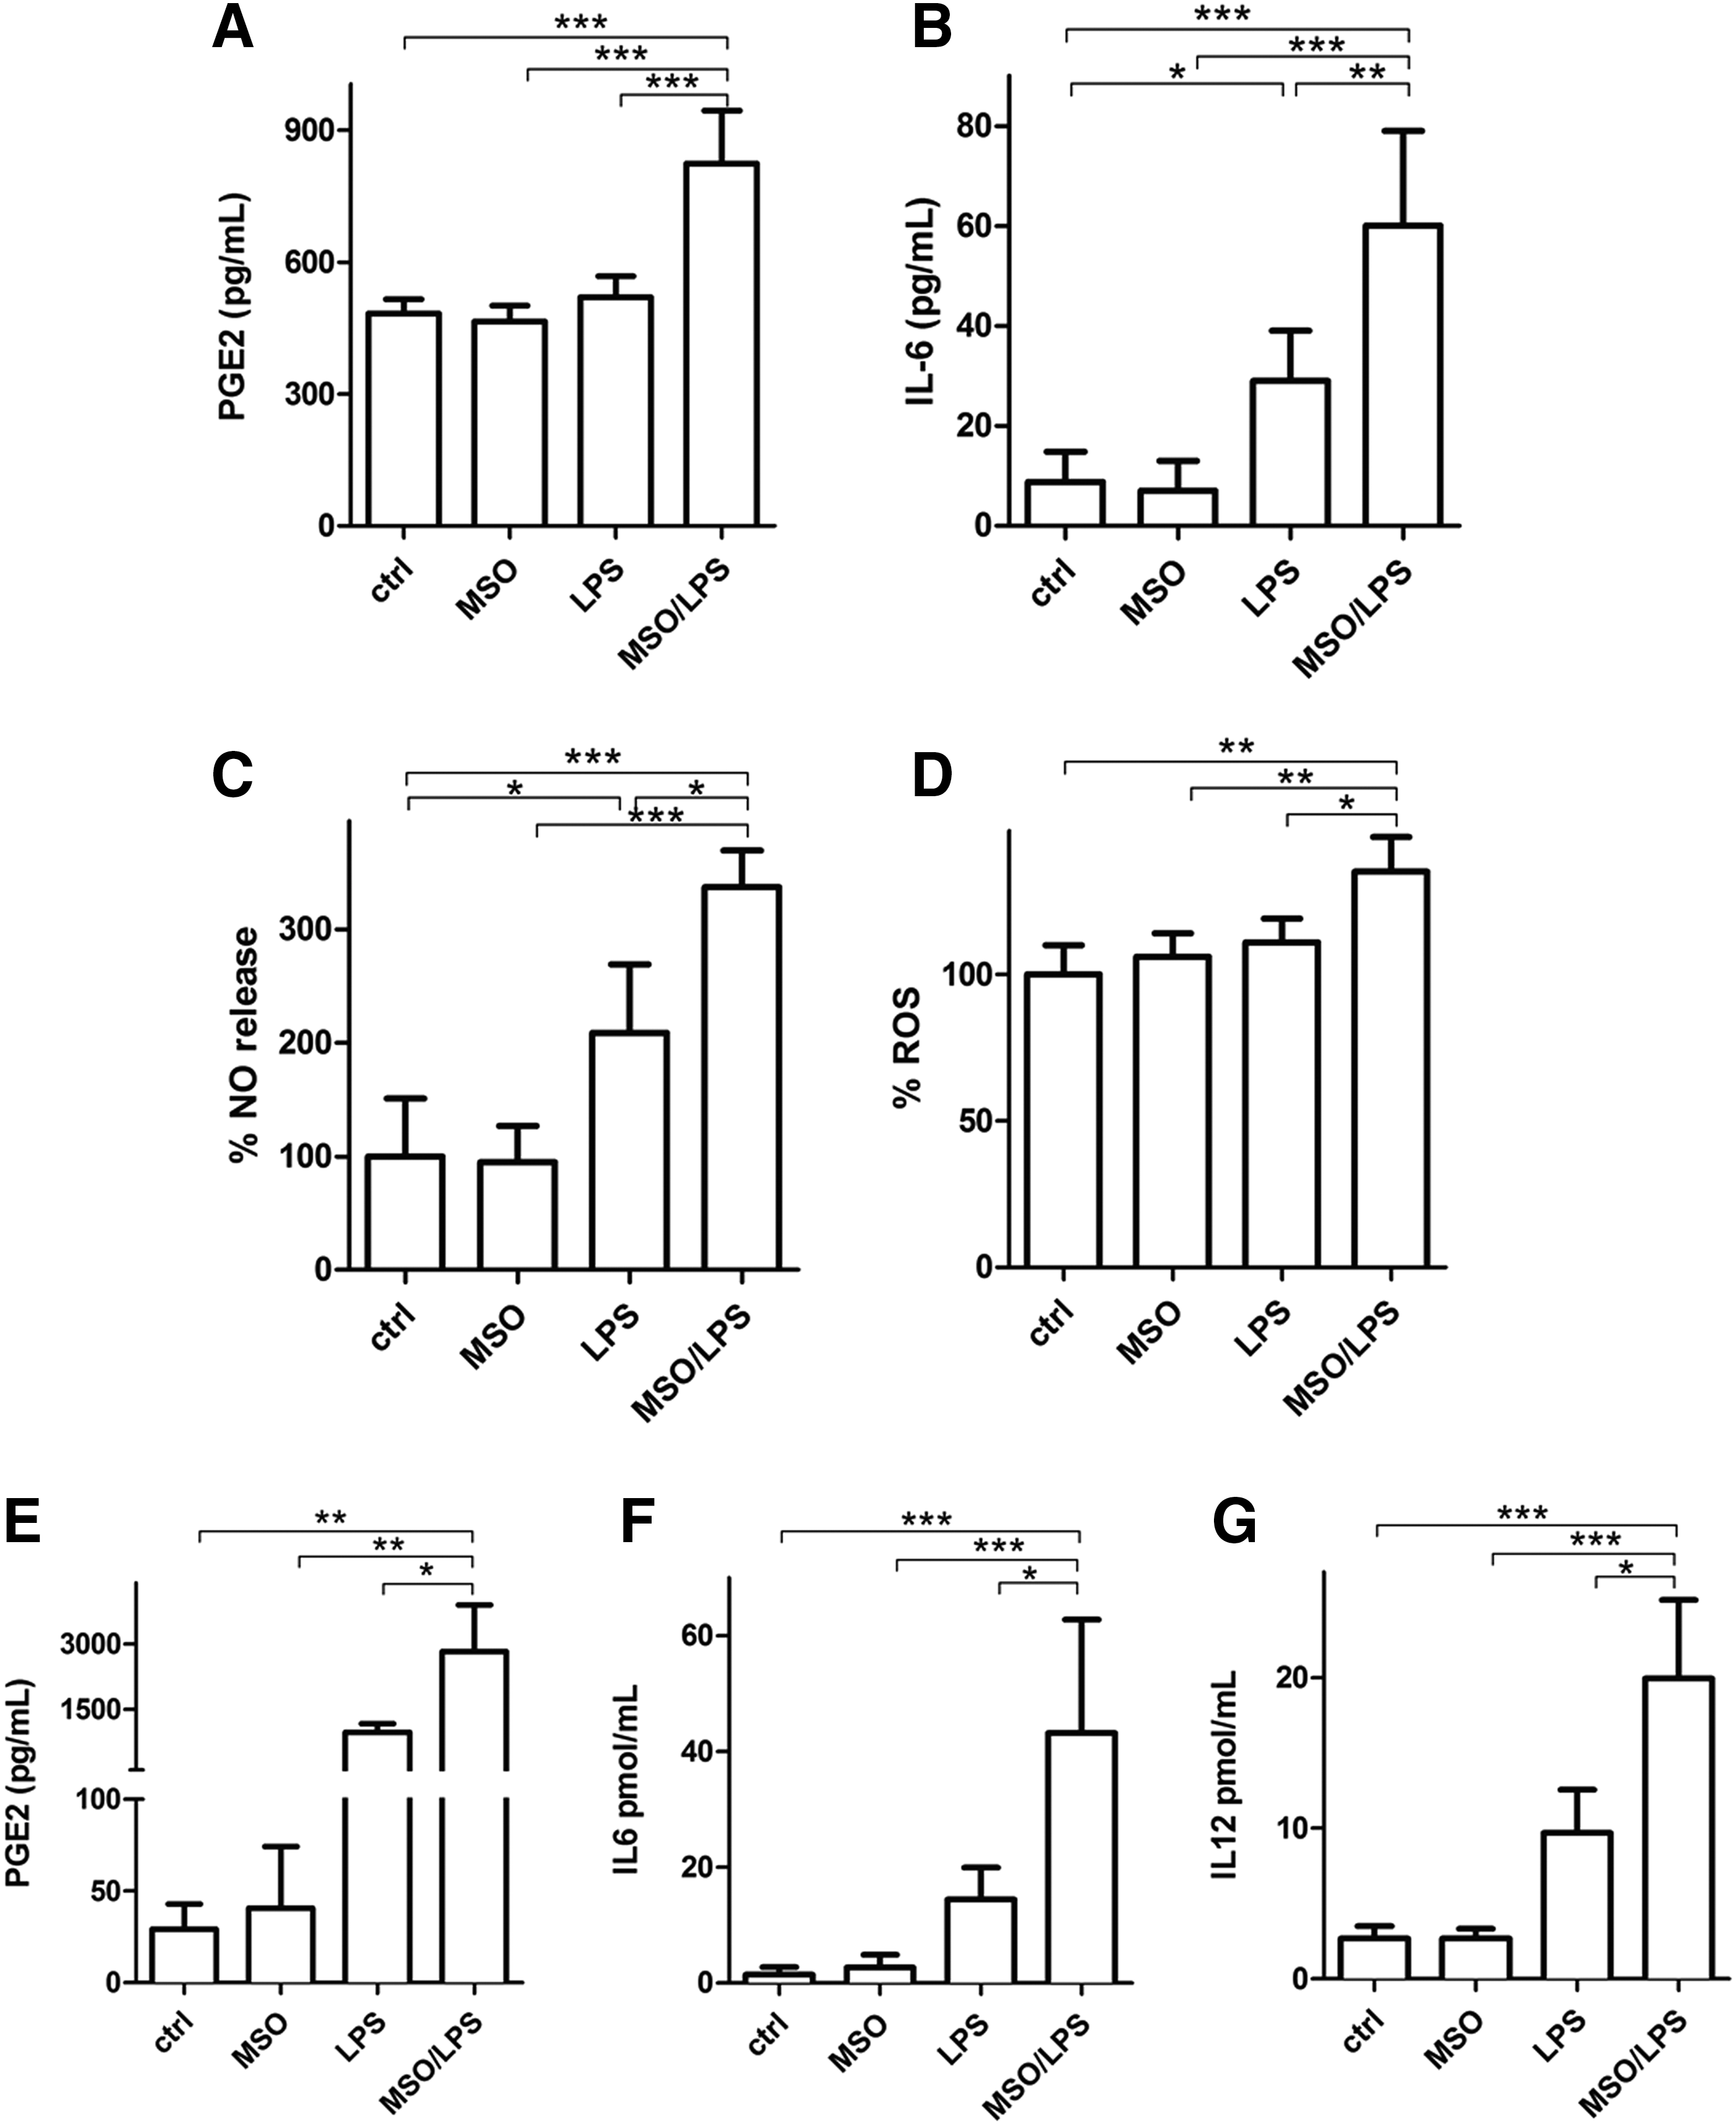
We then evaluated extracellular release of different mediators of the inflammatory response such as PGE2, IL-6, nitric oxide (NO), and reactive oxygen species (ROS) in N9 cells under LPS stimulus. LPS treatment produced a significant increase of IL-6 (Fig. 2B) and NO (Fig. 2C). GS inhibition substantially enhanced the proinflammatory effects of LPS-activated cells evaluated by a 58% increase of PGE2 (Fig. 2A), 106% increase of IL-6 (Fig. 2B), and 65% and 22% increase of NO (Fig. 2C) and ROS (Fig. 2D), respectively, compared with those observed after treatment with LPS alone. A similar effect was measured in primary murine microglia, in which LPS treatment in the presence of MSO induced 189%, 206%, and 104% increase in the release of PGE2 (Fig. 2E), IL-6 (Fig. 2F), and IL-12 (Fig. 2G), respectively, compared with LPSs alone. In all cases, treatment with MSO alone (no LPSs) did not produce any change in the evaluated parameters. These data together indicate that the inflammatory capacity of both N9 and primary microglia under LPS stimulus is greatly enhanced by GS inhibition.
GS inhibition impairs insulin-mediated glucose uptake in activated microglia
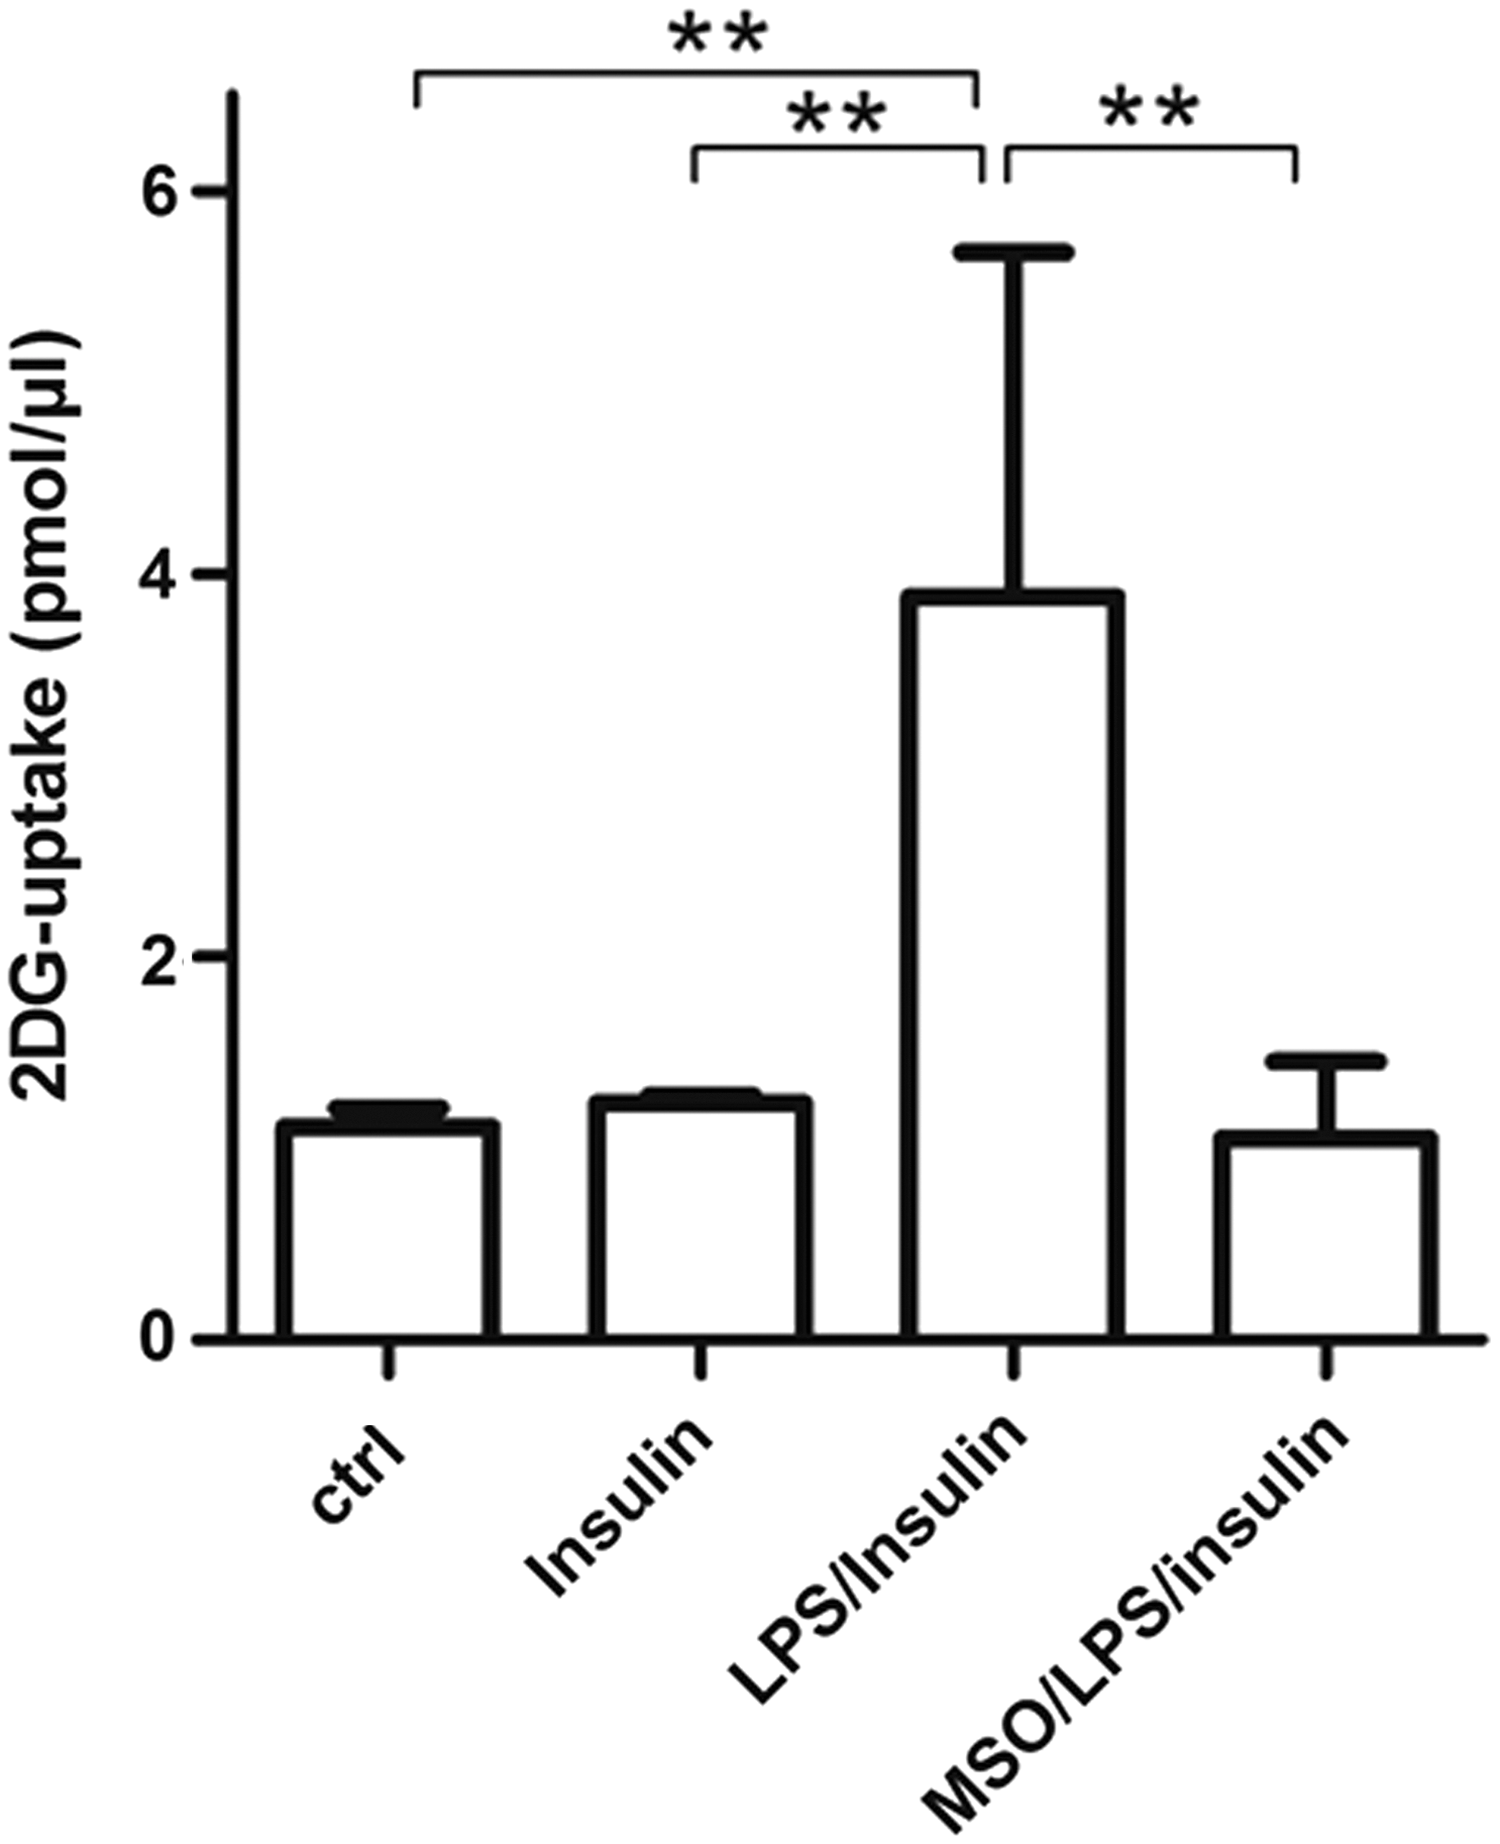
Based on our data on the role of GS in adipocytes, in which GS inhibition during LPS-induced activation reduces insulin-mediated glucose uptake (unpublished observation), we investigated if also in microglia GS inhibition during LPS activation induces insulin resistance by reducing glucose uptake. Unexpectedly, MSO treatment impaired insulin-mediated glucose uptake in microglia by 72% compared with LPS-treated cells (Fig. 3), suggesting that GS function is much more than a simple metabolic glutamine-synthesizing enzyme as it might recapitulate control of inflammatory response and sensitivity to insulin.
Inhibition of GS in activated microglia mediates neuronal injury
To determine if inhibition of GS in microglia translates into an enhanced ability of these cells to mediate neuronal injury, we focused our attention on murine neuronal N2a cells cultured with LPS and LPS/MSO microglia-conditioned medium.
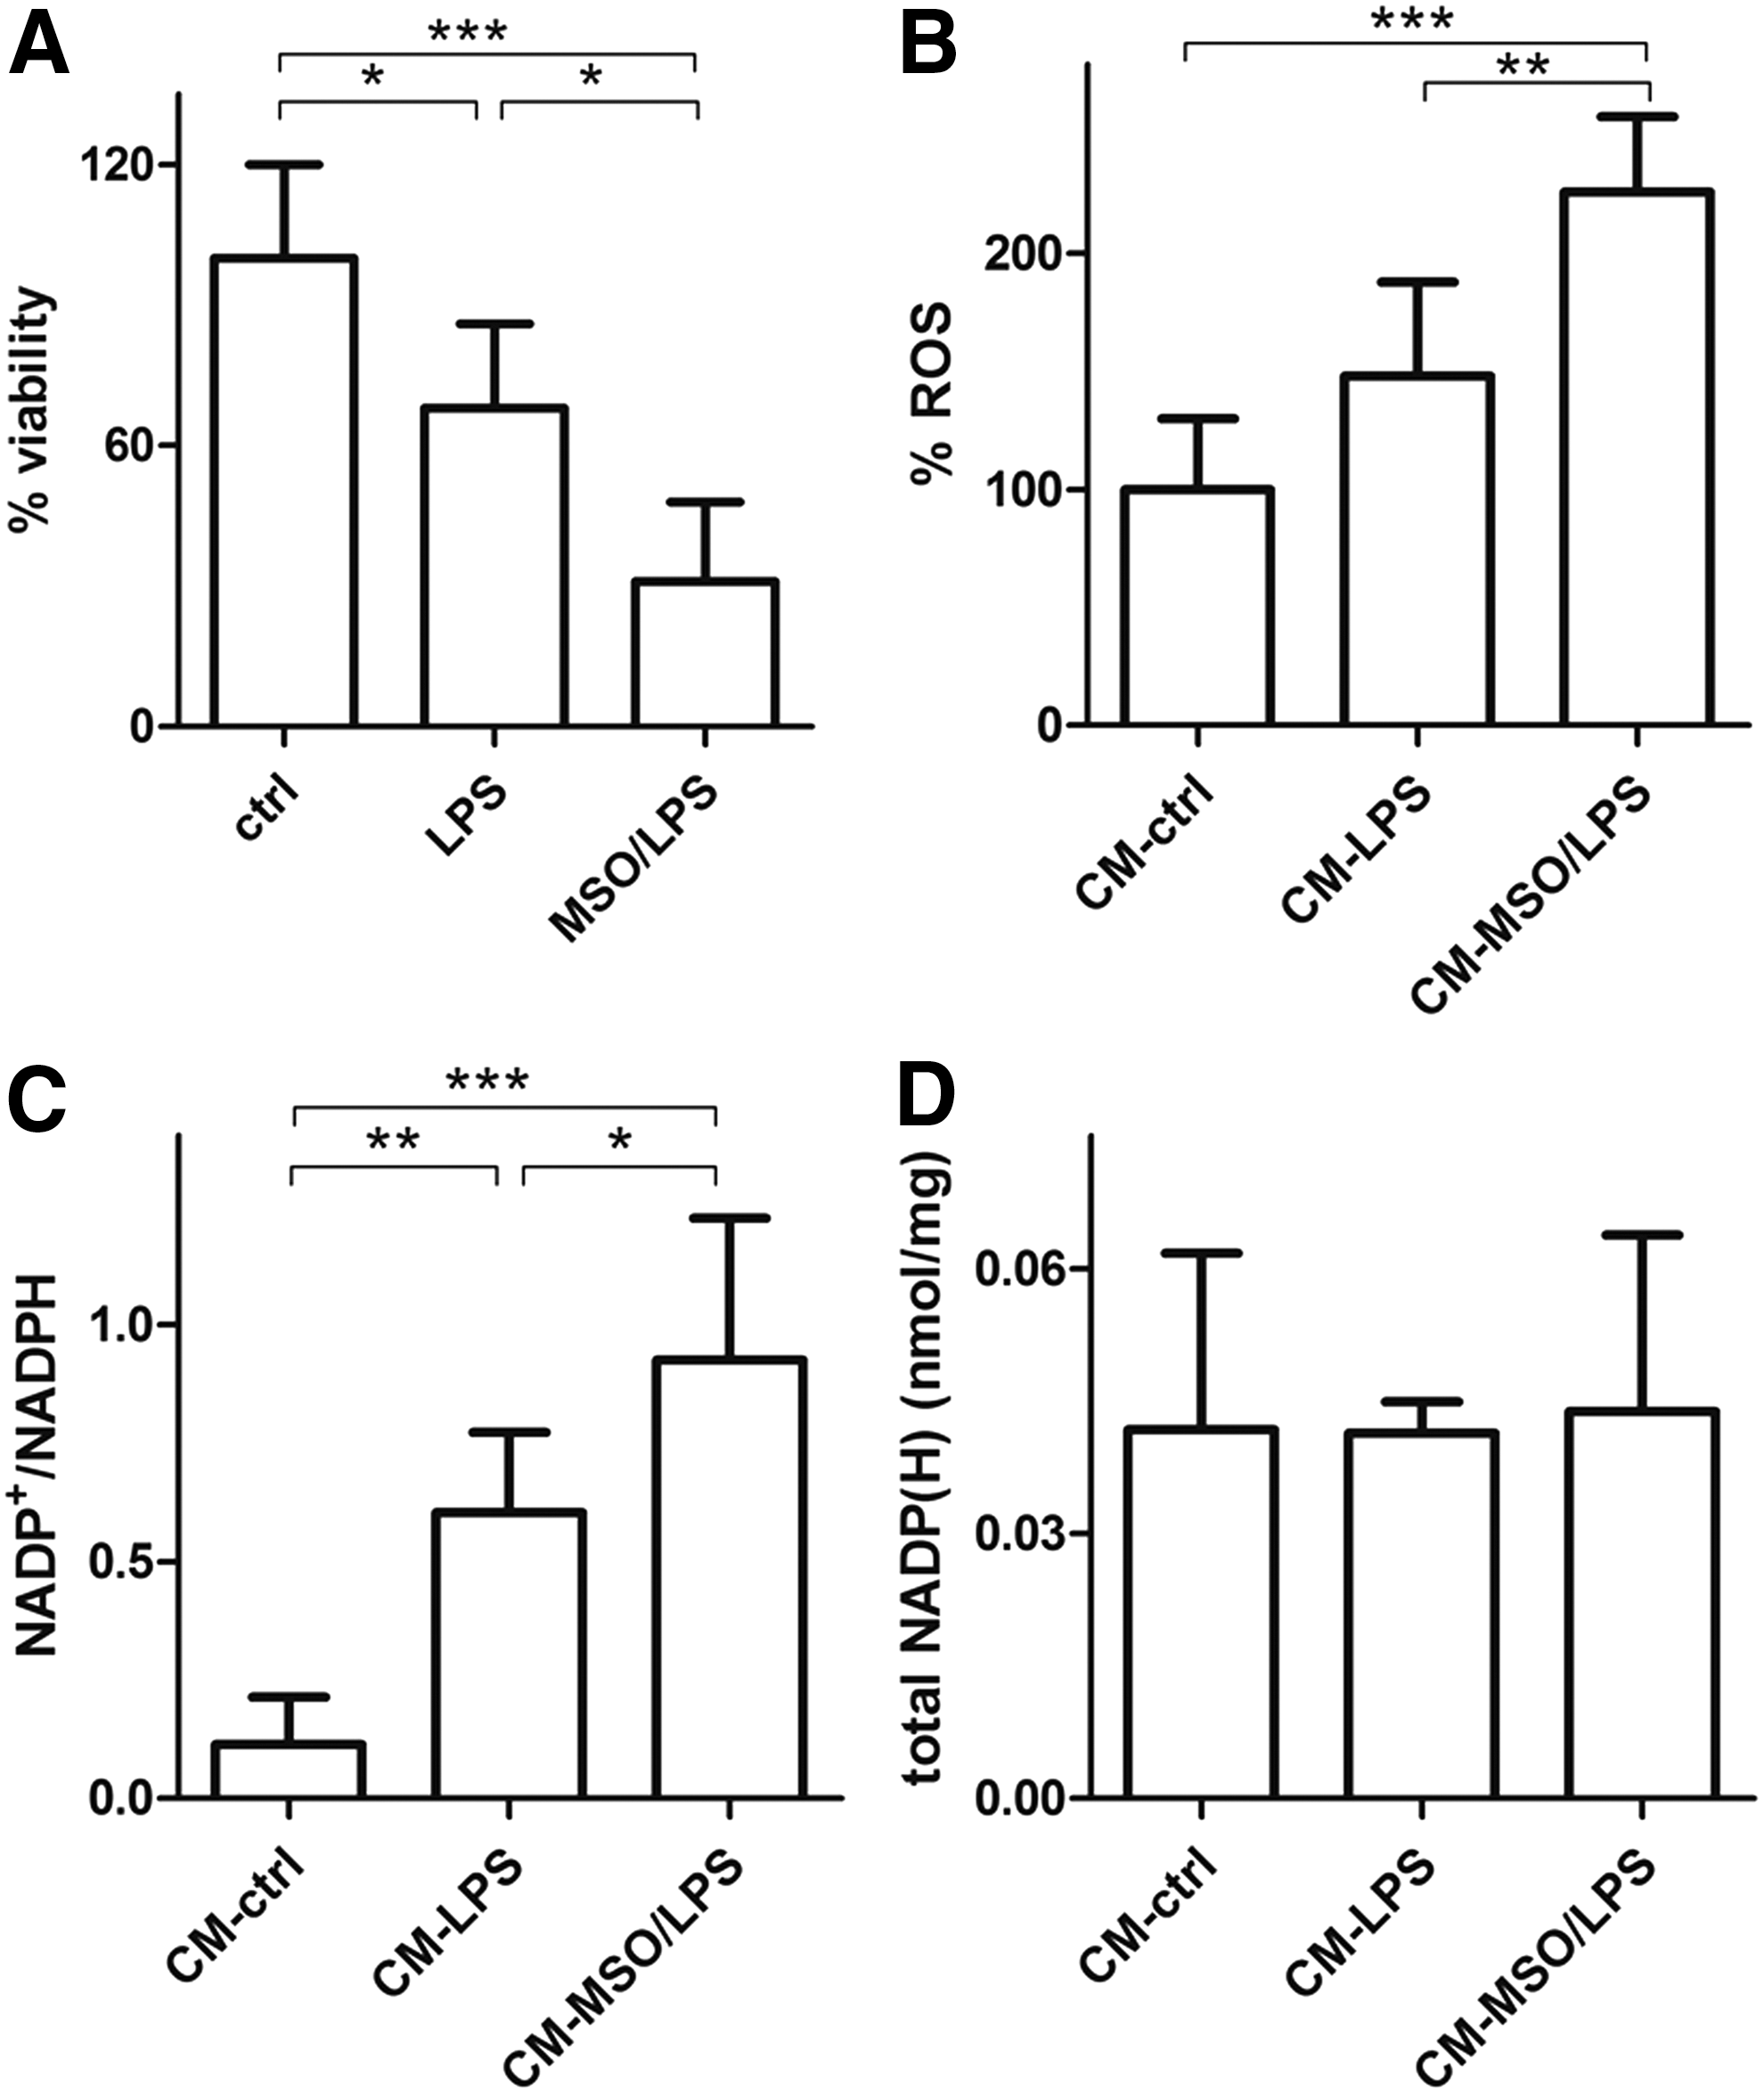
First of all, we assessed survival of N2a cells exposed to growth media from LPS- and LPS/MSO-treated microglia. Our results demonstrate that microglial-mediated toxicity in neurons exposed to media from LPS/MSO microglia was more pronounced compared with those exposed to media from resting and LPS-treated microglia (Fig. 4A), respectively. Next, we verified if this could be associated with changes of the neuronal redox state. We first measured the ROS levels produced by N2a cells exposed to growth media of LPS- and LPS/MSO-treated microglia. N2a cells grown in LPS/MSO-microglial medium displayed higher levels of ROS (+52%) compared with those grown in LPS-treated microglia-derived medium, respectively (Fig. 4B). In line with this finding, N2a intracellular NADP+/NADPH ratios were significantly higher (0.92) compared with those measured in cells grown in LPS-microglial medium (0.58) and also with those from cells grown in resting microglial medium (0.11) (Fig. 4C) with no change of the total NADP++NADPH pool (Fig. 4D). These data together indicate that the enhanced secretion of proinflammatory and toxic mediators by GS-inhibited activated microglia significantly challenges the neuronal antioxidant endogenous defense, leading eventually to ROS-mediated cell damage and death.
In vivo microglia-specific genetic ablation of GS strongly enhances inflammatory response to LPSs
To translate our findings in vivo, we obtained a murine model in which GS is specifically knocked out in microglia, which is clearly evident from the GS blot obtained from microglial extracts (Fig. 5). Following gene deletion, we injected LPS to assess the influence of GS on genes upregulated during an inflammatory response. As expected, LPS treatment significantly upregulated the expression of all the tested genes in microglia from both GScKO and control mice. However, in the absence of GS, the induction of M1 markers (except for CXCL9) by LPS was at least twice stronger compared with that measured in microglia from control mice undergoing the same LPS treatment (Fig. 5).
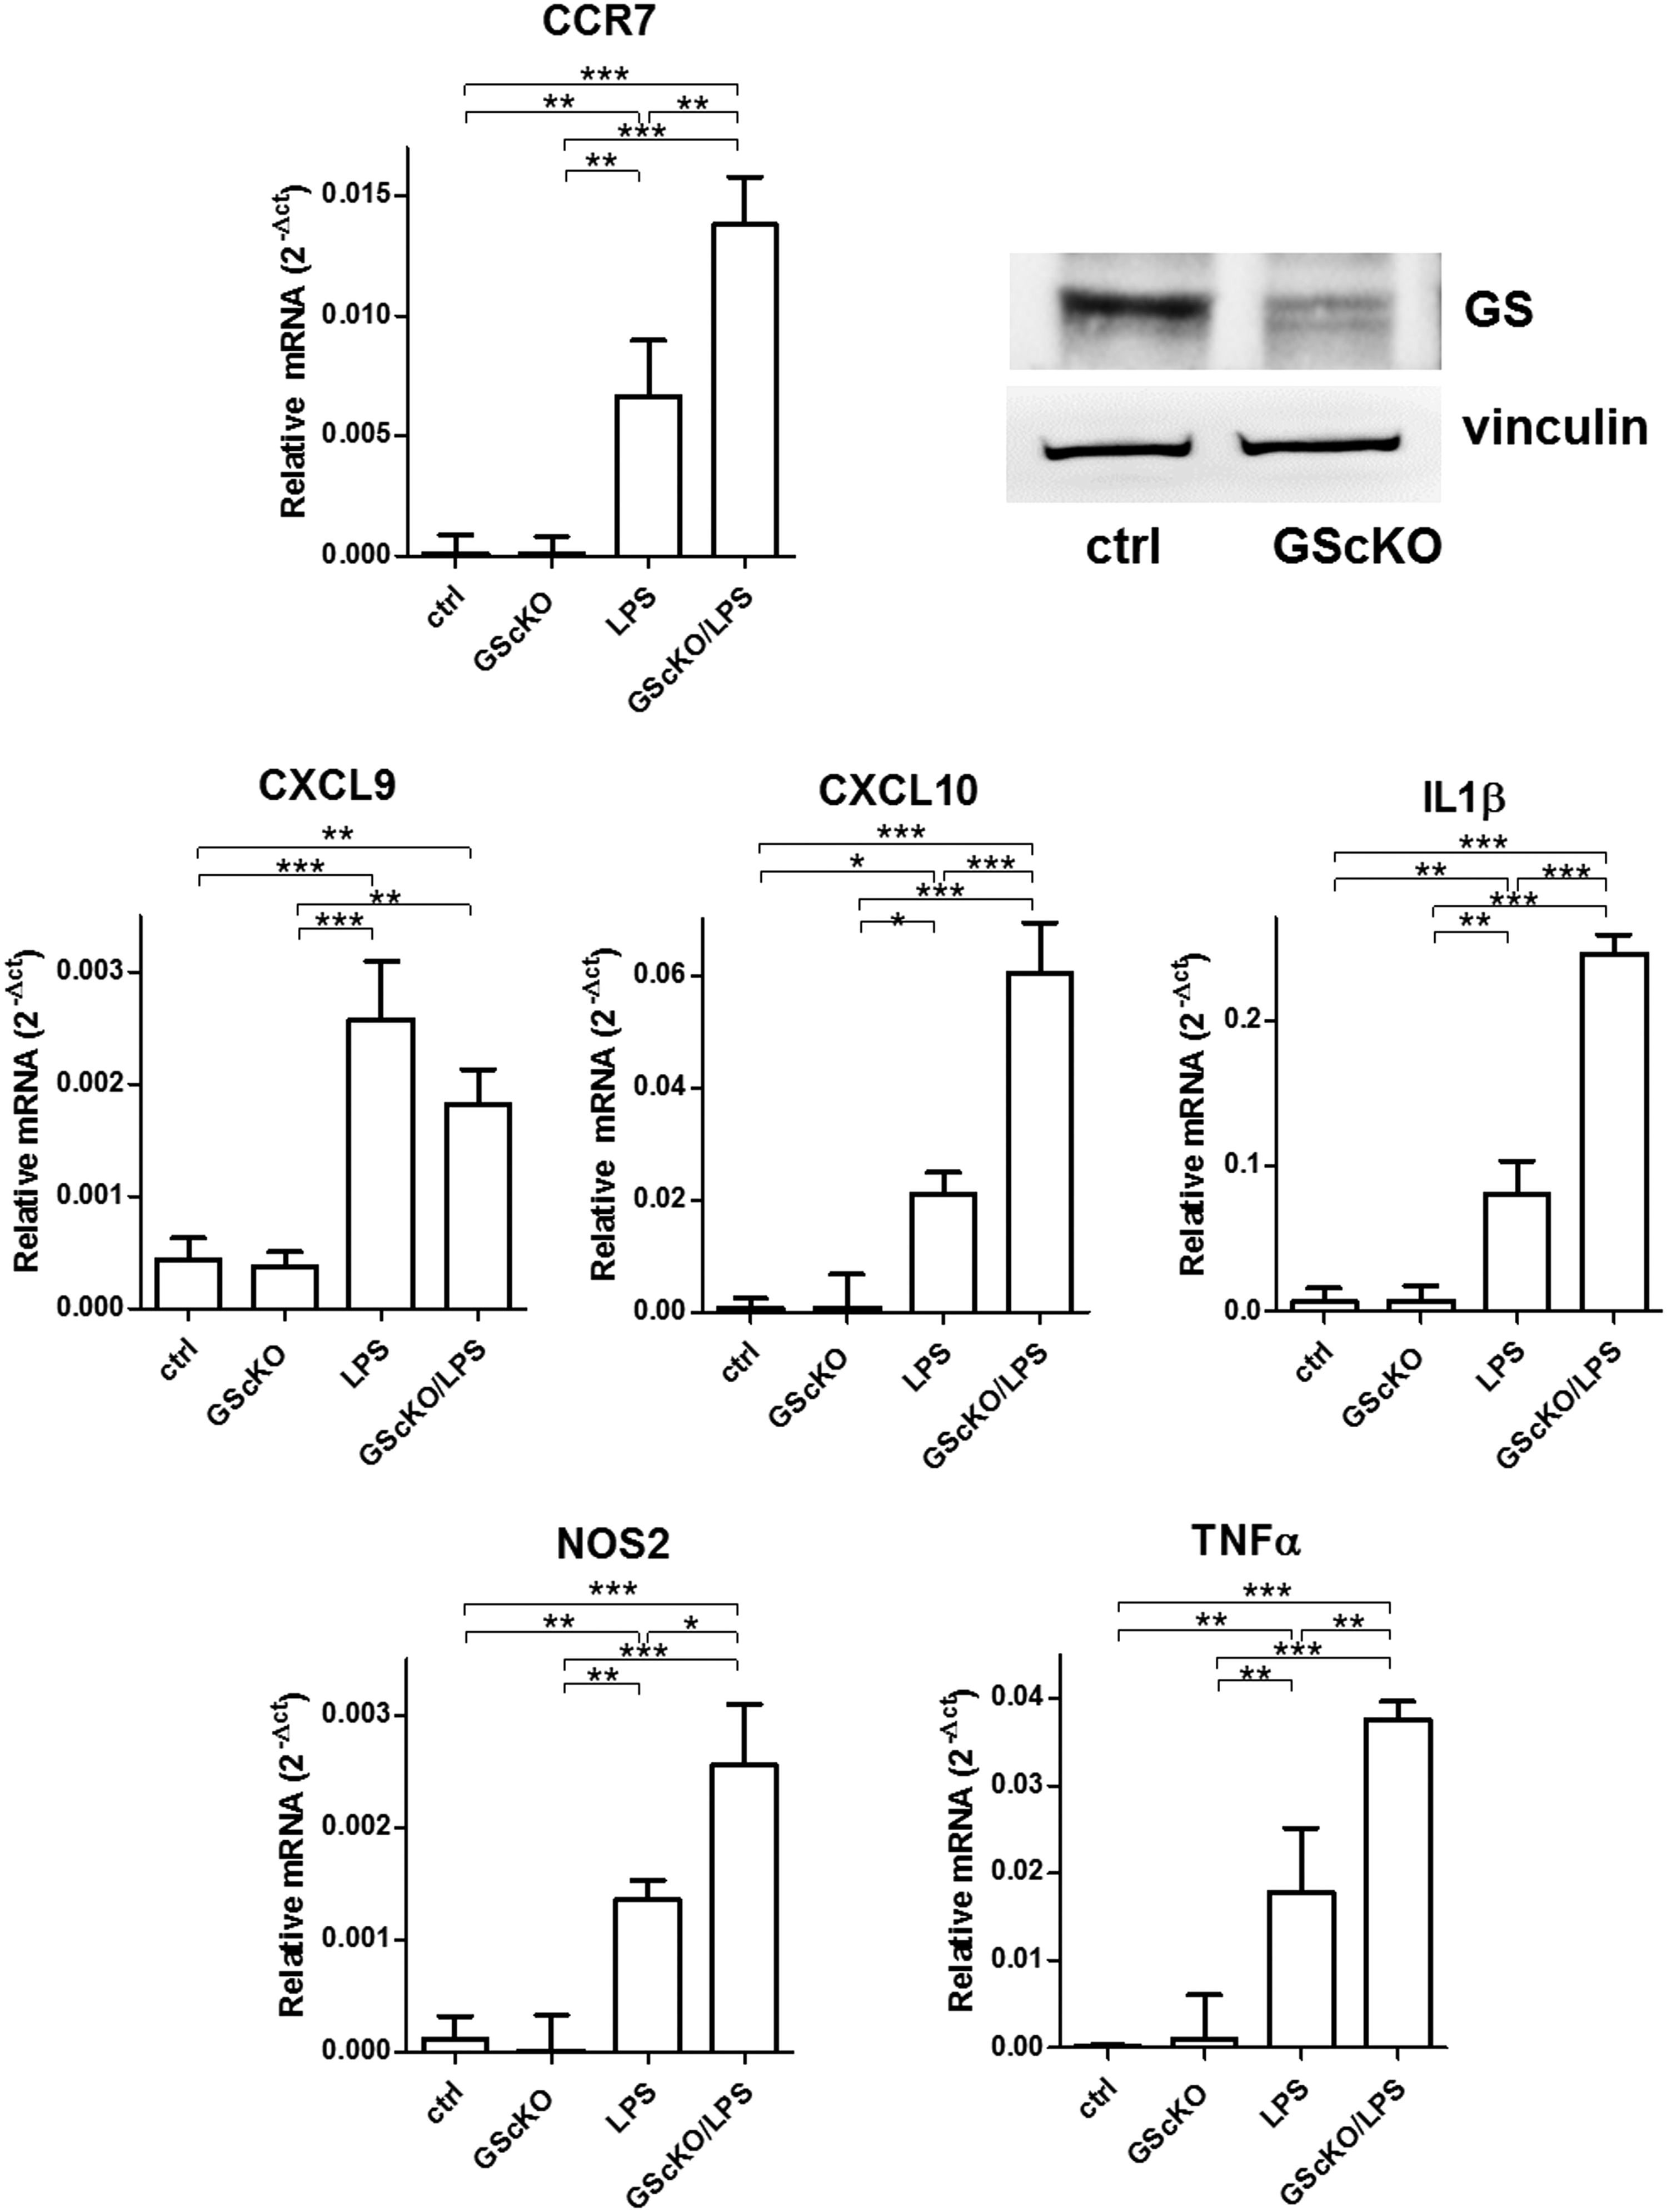
These data clearly confirm that GS plays a role in modulating the response to LPS, and GS gene ablation in microglia exacerbates this inflammatory response.
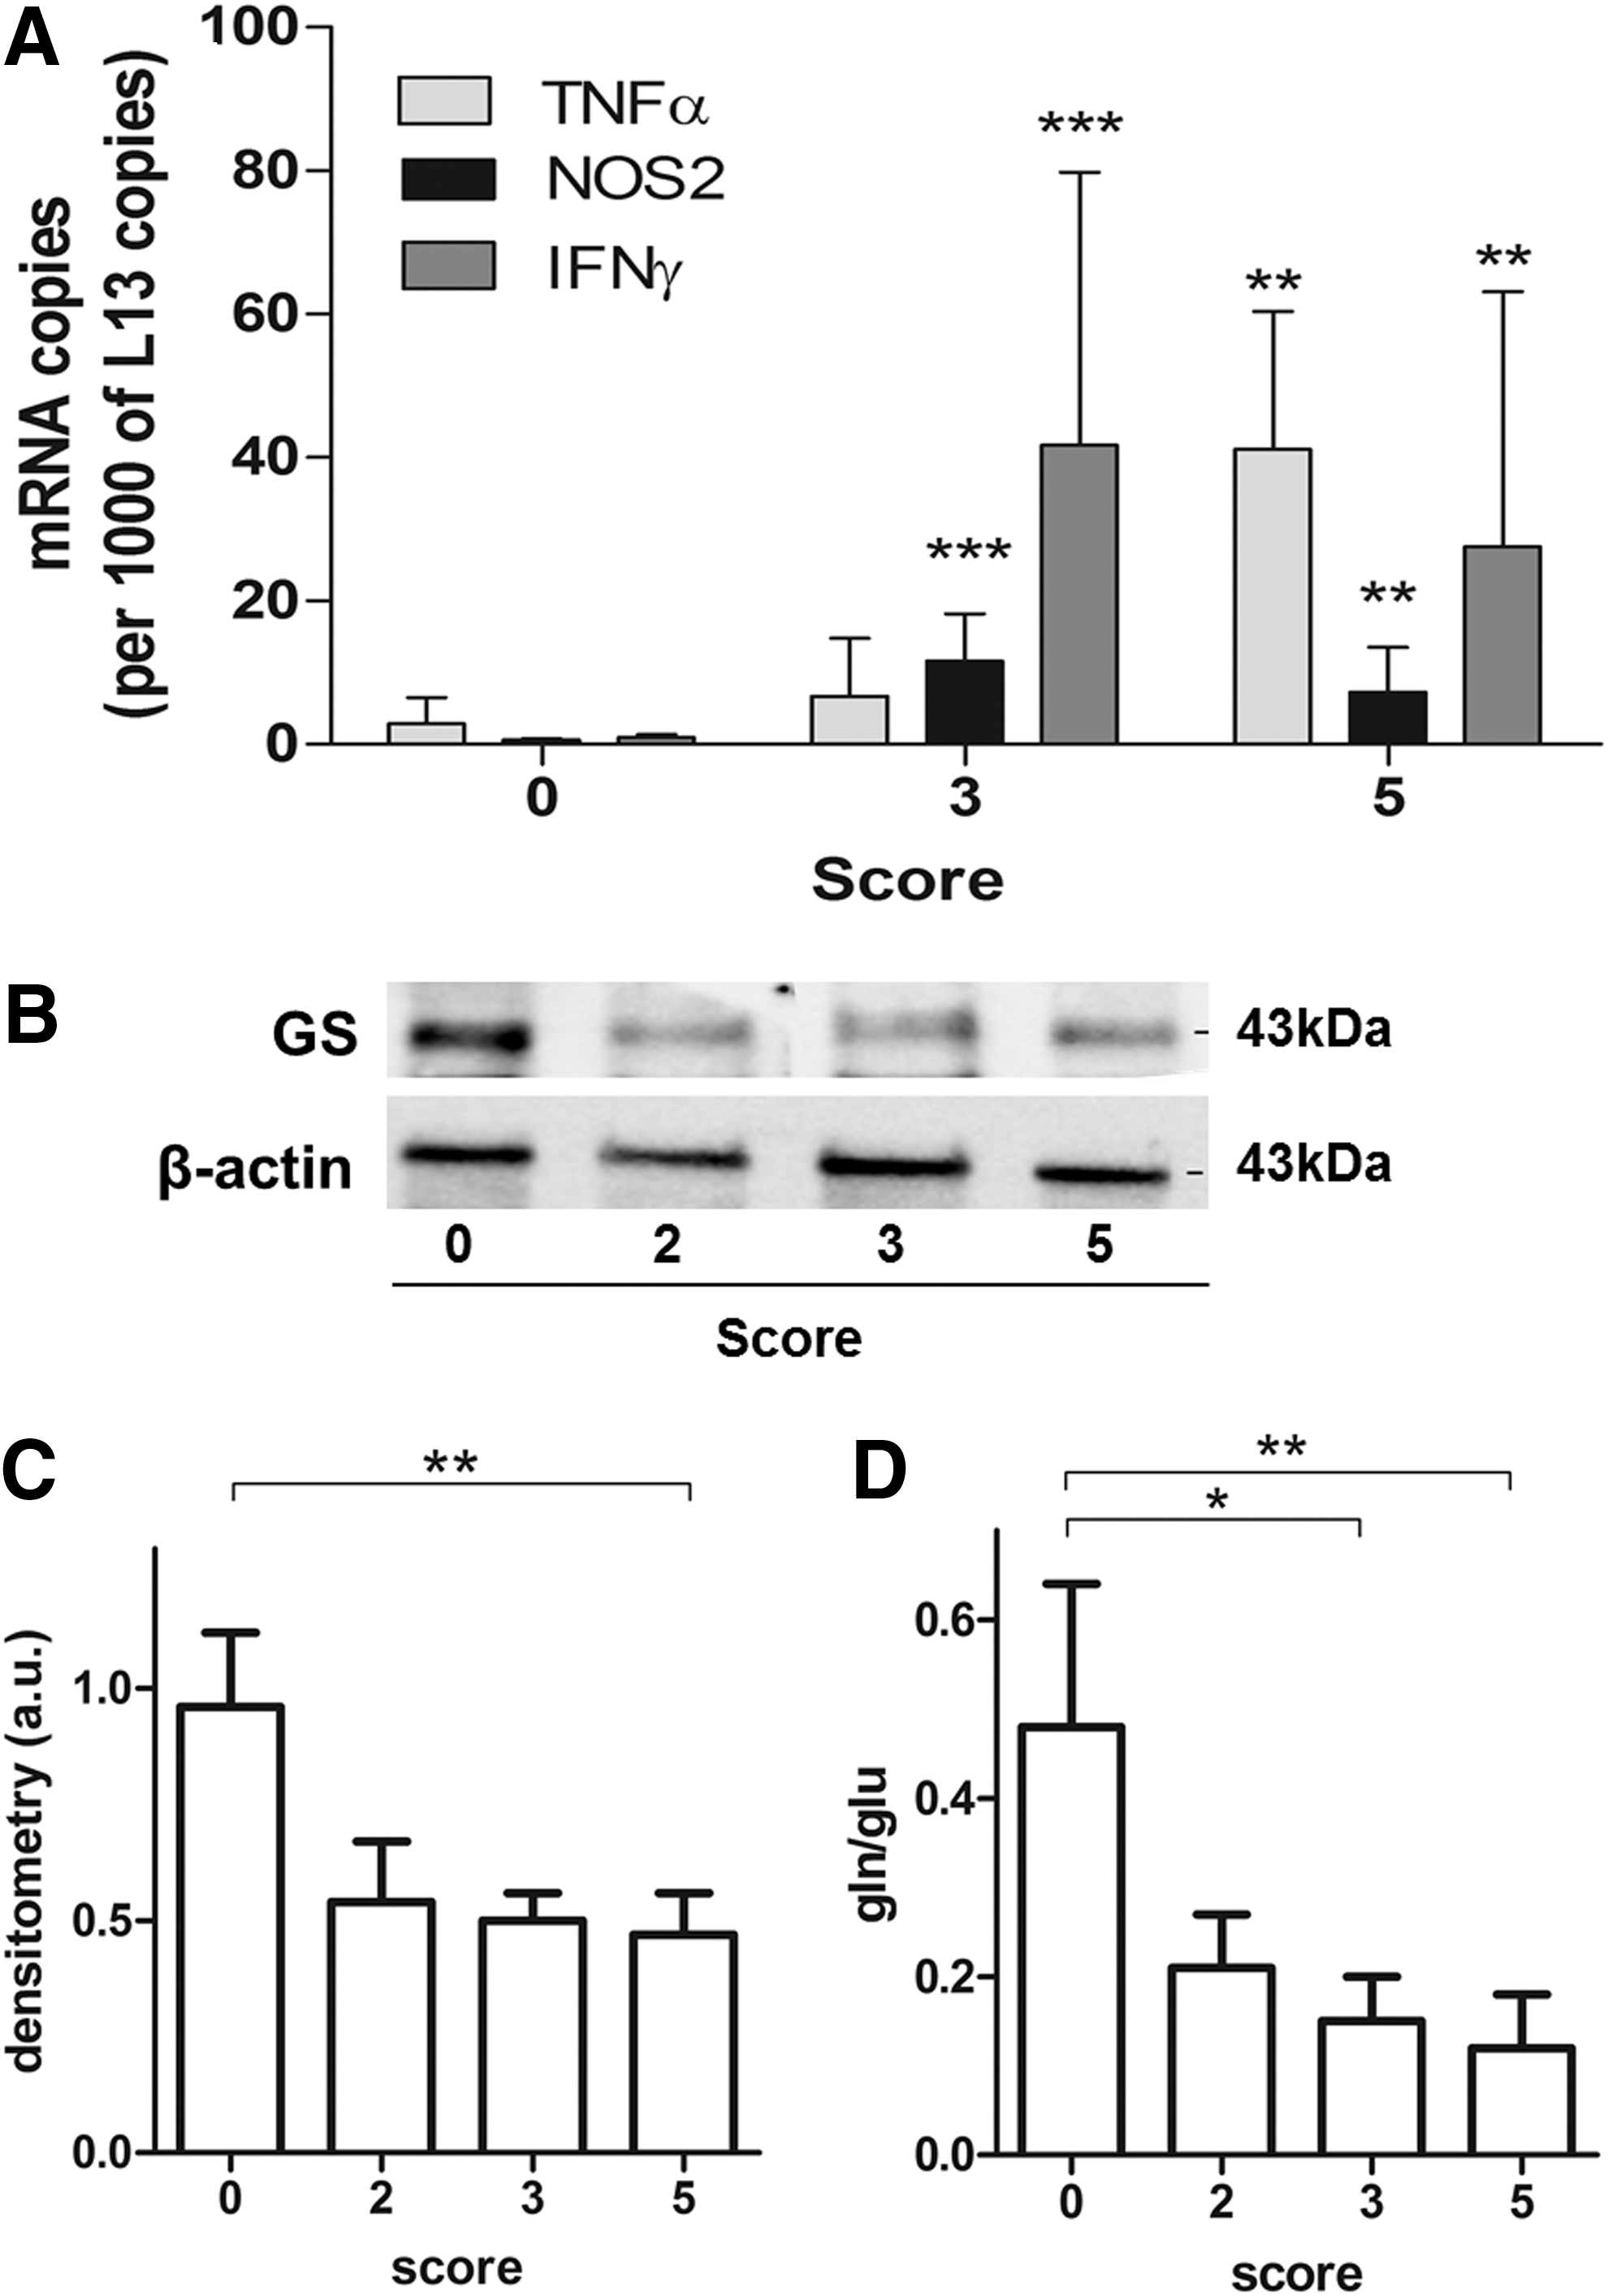
GS expression is reduced in the spinal cord of the EAE mouse
Having established both in vitro and in vivo the role of GS in modulating the inflammatory response in activated microglia, we sought to evaluate the relevance of this enzyme in the spinal cords of the EAE mouse, a model of inflammatory autoimmune disease, in which microglia activation is known to play a role. Clinical deficits in these animals are associated with inflammation, as evidenced by the expression of TNF-α, NOS2, and IFNγ in the spinal cords of diseased mice (Fig. 6A). Decrease in GS expression was evident already in the spinal cords of mice with clinical scores of 2 and 3, but significantly only in score 5 (57%) (Fig. 6B, C). Glutamine/glutamate levels were also significantly decreased by 66% in score 3 and 75% in score 5 spinal cords (Fig. 6D). Taken together, these data suggest that the loss in GS function might occur with progression of the disease and contribute to the development of inflammatory pathology in the spinal cord of EAE.
Discussion
It is well established that brain microglia express the glutamate scavenging system known to be present in astrocytes, namely the cellular glutamate transporter GLT-1 and GS (12, 44, 69), not only in physiological but also in pathological conditions (11, 28, 65). This expression of GLT-1 and GS by microglia has been explained in two different ways. Microglia may possess a similar mechanism of glutamate scavenging for trophic and protective purposes. Additionally, glutamate uptake from the extracellular spaces might represent a way to enhance GSH production through the coexpression of GLT-1 and the cystine/glutamate antiporter (29, 52, 53).
The present work highlights for the first time the role of glutamate conversion to glutamine in modulating the ability of microglia to respond to the inflammatory stimulus.
In normal conditions, microglia are maintained in a constant state of relative inactivity. At variance with macrophages, basal microglia express low levels of CD45 and major histocompatibility complex class I and II antigens. This can be ascribed to the CNS microenvironment, which is rich in immunomodulatory factors such as TGFβ and is protected against potentially stimulatory serum proteins by the blood–brain barrier (BBB) (2). Other resident cells of the CNS are known to modulate microglial phenotype. Principally, not only neurons (66) but also astroglia (40, 55 –57) provide inhibitory signals. In this study, we provide evidence of a metabolic mechanism by which microglia control their response to a proinflammatory stimulus. When glutamate conversion to glutamine is inhibited in microglia, their production and release of inflammatory mediators and effectors are elevated, ultimately leading to greater neuronal oxidative stress and injury. Our hypothesis that GS activity might represent an endogenous mechanism controlling the response of microglia to activation, following a given stimulus, is substantiated by the finding that GS activity peaks in the immediate 24 h after LPS treatment before evidence of enhanced expression of GS. Our finding that the increase of GS activity is not perfectly synchronized with GS expression actually confirms previous data, the explanation of which has not been provided (48). It is well known that GS activity is sensitive to oxidative modifications since oxidation-driven loss in protein activity has been associated with many pathological conditions. Due to its particular sensitivity to inactivation by oxidant agents (6, 22, 42, 54), the activity of GS is often used to monitor ROS-mediated brain damage. In a number of conditions, including aging and Alzheimer's disease, as well as in the experimental CNS inflammatory condition, EAE, GS in brain tissues has been found to convert glutamate to glutamine less efficiently than in age-matched normal controls (6, 32, 58), and this event has been linked to its specific oxidation (8). In light of the present findings, it is possible that GS sensitivity to redox balance, which has supported the use of GS as a redox proteomic target in many conditions, represents a physiological mean by which several mechanisms relevant to the inflammatory response are modulated. In this way, GS oxidation might have a functional significance rather than being a marker of ROS-mediated brain damage.
Our data support a beneficial role of GS in controlling the activation of microglia in response to proinflammatory stimuli. GS activity is increased following LPS treatment and its inhibition drives a greater inflammatory response by the cells. This is confirmed in vitro both in stimulated N9 and primary microglia, in which pharmacological inhibition of GS during LPS activation significantly increases release of inflammatory mediators. These effects are translated in vivo, in which an inducible, microglial-specific GS-deficient mouse expresses to a greater extent inflammatory markers compared with the WT mouse.
Besides sustaining immune response, which is associated with many neurodegenerative disorders (1, 38), the abnormal extracellular environment generated by GS-inhibited activated microglia is destined to strongly impact neuronal function. N2a neuronal cells grown in conditioned media from GS-inhibited microglial cells display decreased viability and increased ROS production at the expense of the intracellular redox balance. Neuronal cell loss might occur through multiple mechanisms. The most conceivable one could be NMDA excitotoxicity and abnormal Ca2+ uptake. The excessive Ca2+ input to neurons induces neuronal death and, in accordance with our findings in N2a cells, generates excessive ROS that disrupt glutamate transport in neighboring cells (24, 72). With dying neurons, the activation mechanism that maintains microglia in an inflammatory state perpetuates itself, releasing more PGE2, TNF-α, ROS, and so on (62 –64, 73). The present evidence on the abnormalities found in the media of GS-inhibited activated microglia points to these mechanisms in different ways. The decreased glutamine/glutamate ratio due to GS inhibition might interfere with glutamate influx through GLT-1, leading to higher levels of extracellular glutamate, which we measured in the media from LPS-treated microglia upon GS inhibition. In this way, loss of microglial GS activity might impair the described glutamate scavenging system in microglia. Together with glutamate, the NMDA receptor agonist, quinolinic acid, also might perpetuate continuous stimulation on NMDA receptors as its degradation system is rapidly saturated (31, 45, 76). PGE2 might also contribute to neuronal toxicity by increasing Ca2+ uptake by neurons (15). TNF-α is also known to activate AMPA and NMDA receptors while decreasing inhibitory GABAA receptors on neurons (25, 49). Additionally, our finding that GS inhibition reduces insulin-related glucose uptake might shed light into one of the unifying mechanisms controlling insulin resistance, inflammation, and metabolism. Microglial IL-1, IL-6, and TNF-α are known to activate insulin receptor sustrate-1 (IRS-1) serine kinases (IKK, JNK, and Erk2), leading to increased IRS-1 phosphorylation at Ser-307, decreasing its activity (60) as seen in Alzheimer disease (AD) (61). Insulin is known to antagonize the deleterious effects of oxidative stress in the CNS. By stimulating glucose uptake and pyruvate formation, insulin restores intracellular ATP formation, reduces oxidative stress (17), and, more importantly, limits glutamate accumulation in the extrasynaptosomal space, reducing excitotoxicity (18). GS activity might then represent a unifying mechanism being at the interface between inflammation, insulin resistance, and glutamate excitotoxicity.
In the spinal cord of the EAE mouse, GS protein levels decrease together with the glutamine/glutamate ratio. The involvement of microglia in autoimmune pathology is commonly accepted (4, 7, 36) as microglia ablation results in suppression of EAE development and severity (33). Our in vivo findings on GScKO mice clearly demonstrate that GS loss represents one of the mechanisms skewing microglia to a more inflammatory phenotype, which might contribute to the progression of autoimmune-mediated damage. Although evaluated in whole tissue, our EAE findings are relevant in the fact that an experimental neurodegenerative condition with a strong inflammatory component, in which microglia play a fundamental role in the progression of the disease, is associated with a loss in the expression of GS. The cause of the loss of GS expression in the EAE spinal cords might be related to oxidative stress, which is known to play a role in several aspects of the pathogenesis of multiple sclerosis (MS) and EAE, including demyelination, axonal injury, and general tissue damage (26, 67), as well as the loss of BBB integrity that allows immune cells to infiltrate CNS tissues (34). ROS production is increased in the CNS inflammatory lesions of EAE and MS (27). Furthermore, GS is known to be oxidized in EAE CNS (9) and in AD brain (8), leading to loss of function (6, 9). In light of the present findings, we propose that inflammatory neurodegeneration is mediated by a sustained inflammatory response with contributions from activated microglia that have lost the anti-inflammatory contribution from GS.
How GS function modulates the cell's ability to respond to a proinflammatory stimulus is of particular interest, but not yet fully resolved for microglia. The fact that GS inhibition interferes with this ability clearly points at cellular glutamine production as a key player. We have recently found that in adipocytes GS activity desensitizes adipocytes to a proinflammatory stimulus by raising intracellular glutamine levels (50), suggesting the role of glutamine as a signaling molecule. This is supported by a strong body of evidence pointing at the intracellular accumulation of glutamine as a mediator regulating many different pathways, such as autophagy, inflammation, mTOR activation, and others (3, 5, 13, 41, 68, 74).
In conclusion, this work unravels a novel mechanism of endogenous modulation of brain inflammation by activated microglia, in which GS activity controls immune response. The consequences of GS inhibition are multiple, ranging from increased release of inflammatory mediators and demise of surrounding cells to modulation of insulin sensitivity. These findings help us to reexamine the significance of GS function and the mechanisms of its activity loss, such as oxidative stress, pointing to a new role of the protein for both the understanding of the pathogenic mechanisms, in which oxidative damage and inflammation occur, and, in perspective, for setting up new strategies of therapeutic intervention.
Materials and Methods
Reagents
Dulbecco's modified Eagle's medium (DMEM), fetal bovine serum (FBS) insulin, bacterial LPSs, MSO, protease inhibitors, phenylmethanesulfonyl fluoride (PMSF), heptafluoro-n-butyric acid (HFBA), and glutamine were obtained from Sigma-Aldrich (St. Louis, MO). Bradford protein assay was obtained from Bio-Rad (Hercules, CA).
Anti-GS primary antibody and the Immobilon Western Chemiluminescent horseradish peroxidase (HRP) substrate were purchased from Millipore (Billerica, MA). Antiactin antivinculin antibodies were purchased from Santa Cruz Biotechnology (Dallas, TX). The HRP-conjugated secondary antibody was obtained from Thermo (Waltham, MA).
Animal models
Experiments with control and GScKO mice were obtained from about 8 weeks old, gender- and age-matched C57Bl/6 littermates raised in a strictly controlled environment. Colony-stimulating factor receptor 1 (CSF1R)-CreERT transgenic mice (CSF1R-CreERTtg/wt), provided by J. Pollard (University of Edimbourg, United Kingdom), in which a tamoxifen-induced Cre is under the transcriptional control of human CSF1R promoter, were crossed with GS floxed mice (GSL/L) obtained from W. Lamers (University of Amsterdam, The Netherlands). The colony was bred by intercrossing GSL/L;CSF1R-CreERTtg/wt with GSL/L;CSF1R-CreERTwt/wt mice. Mice with macrophage and microglia-specific GS deficiency (GSL/L;CSF1R-CreERTtg/wt treated with i.p. injected tamoxifen) are designated as GScKO mice, whereas GSL/L;CSF1R-CreERTwt/wt mice (also treated with tamoxifen) are control mice. Construction of targeting vectors and pup genotyping were performed as reported (31a). Acute deletion of GS was obtained by i.p. injection of tamoxifen (1 mg/mouse/day) on both GScKO and control mice for 5 consecutive days. Then, GScKO and control mice received an intraperitoneal injection of LPSs (1 mg/kg) or sterile saline vehicle in a total volume of 100 μl. Twelve hours later, mice were sacrificed and brains were collected for microglia isolation. All procedures were conducted in accordance with federal guidelines under animal protocols approved by the U.K. Leuven Institutional Animal Care and Use Committee.
As detailed previously (21), female 10- to 11-week-old PLSJL mice (Jackson Laboratories, Bar Harbor, ME) were either left untreated (controls) or immunized s.c. at three sites with 200 μl of an emulsion containing 100 μg of guinea pig myelin basic protein (MBP) in complete Freund's adjuvant supplemented with 4 mg/ml mycobacterium tuberculosis H37RA (BD, Franklin Lakes, NJ). Immunized mice also received 400 ng of pertussis toxin (List Biological Laboratories, Campbell, CA) i.p. on days 0 and 2. The animals were scored daily for clinical signs of EAE. Animals assessed in this study had scores assigned as follows: 0, immunized, but appearing normal; 3, tail paralysis and hindlimb weakness or ataxia; and 5, hindlimb paralysis, but without forelimb involvement, alert, and capable of eating and drinking. Tissue samples were obtained from nonimmunized animals and MBP-immunized mice that had shown clinical signs for at least 3 days with a clinical score of 2, 3, or 5, as well as MBP-immunized mice that did not develop signs of disease (clinical score 0) over the same period of time after immunization. All procedures were conducted in accordance with federal guidelines under animal protocols approved by the Thomas Jefferson University Institutional Animal Care and Use Committee.
Microglial isolation by fluorescence-activated cell sorter sorting
Microglia were isolated from brains of GScKO and WT mice, injected or not with LPSs as previously described (70). In brief, after transcardiac perfusion with ice-cold phosphate-buffered saline (PBS), brains were quickly dissected and mechanically homogenized with a tissue homogenizer in ice-cold Hank's balanced salt solution containing 15 mM HEPES and 0.5% glucose (70). Cells were filtered over a 70-μm strainer and pelleted at 220 g for 10 min at 4°C. Contaminating myelin was removed by resuspending the pellet in 25 ml ice-cold 22% Percoll buffer, overlaying with 5 ml ice-cold PBS, followed by centrifugation in a swinging bucket rotor at 950 g for 25 min at 4°C. The cells were incubated with mouse antiCD45-FITC (eBiosciences, Santa Clara, CA) and mouse anti-CD11bAPC (eBiosciences) for 30 min at 4°C in the dark. CD11bhigh/CD45mid cells were isolated using an Aria III fluorescence-activated cell sorter (BD Biosciences, San Jose, CA).
Microglial cells obtained from LPS-injected GScKO and WT mice were collected in RNA lysis buffer provided with the RNeasy microkit (Qiagen) for RT-PCR analysis. Cells from untreated mice were cultured for LPS challenge.
Cell culture
The murine microglial cell line, N9, was cultured in DMEM supplemented with 2 mM glutamine, 10% FBS, 100 U/ml penicillin, and 100 mg/ml streptomycin. Cells were grown at 37°C in a saturated humidified incubator in 95% air and 5% CO2 and were passaged every 3 days. For culturing with various stimulants, N9 cells were distributed into 24-well plates at the density of 1.5 × 10⁵ cells per well in medium, and different stimuli were applied. Cell viability following MSO treatment alone was evaluated with the MTT assay. Cells were stimulated with 100 ng/ml bacterial LPSs from 20 h up to 72 h as described (43). To inhibit GS activity, 1 mM MSO was added to cells right before LPS treatment.
N2a cells (ATCC, Manassas, VA) were grown using the same culture conditions above except for the substitution of 50% Opti-MEM +50% Dulbecco's minimal essential medium in place of the simple DMEM.
Primary microglia isolated from untreated mice were resuspended in DMEM, 10% FBS, 100 U/ml penicillin, 100 μg/ml streptomycin, and N2 supplement and plated at a density of 2.5 × 10⁵ cells per well in a 96-well plate. Once adherent, cells were treated with 100 ng/ml LPSs from 24 h up to 48 h. To inhibit GS activity, 1 mM MSO was added to cells 1 h before LPS treatment.
qRT-PCR analysis
Isolation of mRNA from snap-frozen spinal cords and quantification of specific mRNA levels were performed on tissue samples from nine mice per group by quantitative real-time PCR (qRT-PCR) using previously described primers, probes, and methodologies (9) and a Bio-Rad iCycler iQ real-time detection system (Bio-Rad). Data were calculated based on the threshold cycle (Ct), the PCR cycle at which the fluorescent signal becomes higher than that of the background (cycles 2–10) plus 10 times the SD of the background. Synthetic cDNA standards were used to determine copy numbers. Data are expressed as the fold increase in mRNA copy numbers in test tissues over levels in control tissue samples from naive mice, with all values normalized to the mRNA content of the ribosomal housekeeping protein, L13, in each sample.
RNA isolation and subsequent qRT-PCR analysis from GScKO and WT mice were performed as described (51), with some modifications. The efficiencies of amplification of targeted genes were very near to 100%. Data are expressed as relative mRNA levels (as 2−Δct) in GScKO and control microglia, with all values normalized to the average mRNA content of two different housekeeping genes (β-actin and glyceraldehyde-3-phosphate dehydrogenase [GAPD]) selected after a survey within a housekeeping gene set.
Western blot analysis
Whole cell lysates were prepared by treating pelleted microglia with ice-cold RIPA buffer (1% Nonidet P-40, 50 mM Tris-HCl pH 7.4, 150 mM NaCl, 0.1% SDS, 2 mM EDTA, 0.5% sodium deoxycholate) containing 1 × protease inhibitors and 1 mM PMSF for 30 min at 4°C.
Homogenates were derived from spinal cord samples and processed as previously described (9, 39). Protein concentration of both lysates was determined by the modified Bradford protein assay and 10 μg of proteins was electrophoresed in a 12% SDS-PAGE under reducing conditions and transferred to nitrocellulose using standard procedures. Anti-GS (Millipore) was used to immunodetect proteins. Western blots were processed also for actin with a specific antibody as an equal total protein loading control. Following incubation with an HRP-conjugated secondary antibody, the immunoreaction was detected by using the Immobilon Western Chemiluminescent HRP Substrate (Millipore).
Metabolite quantification by LC-MS/MS
A total of 2 × 10⁵ cell pellets (0.5 mL cellular medium) were extracted as described (50). Spinal cord tissue was homogenized and extracted as indicated (9). A Quattro Premier mass spectrometer interfaced with an Acquity UPLC system (Waters, Milford, MA) was used for ESI-LC-MS/MS analysis as described (9). Calibration curves were established using standards and processed under the same conditions as the samples, at five concentrations. The best fit was determined using regression analysis of the peak analyte area. The multiple reaction monitoring transitions in the positive ion mode were m/z 148.2 > 83.9 for glutamate, m/z 147.2 > 83.9 for glutamine, m/z 744.1 > 507.8 for NADP+, and m/z 746.0 > 729.0 for NADPH, and the chromatographic resolution was obtained as indicated. Chromatographic resolution was achieved as indicated (9, 35, 50, 51, 75) with a flow rate set at 0.3 ml/min. Quinolinic acid was monitored at m/z 168.0 > 78.2 and the chromatographic resolution was obtained with an HT3 column (Waters).
GS activity assay
GS activity was followed as indicated (9). Briefly, 900 μl of reaction cocktail (final concentration in the reaction mix: 34.1 mM imidazole, 102 mM glutamate, 8.5 mM ATP, 60 mM MgCl2, 18.9 mM KCl, 45 mM NH4Cl, pH 7.1) was placed into a quartz cuvette. Phosphoenolpyruvate (final concentration 1.1 mM), freshly prepared NADH (final concentration 0.25 mM), pyruvate kinase (EC 2.7.1.40, 28 U), lactate dehydrogenase (EC 1.1.1.27, 40 U), and 200 μg of cell proteins were added to a 1 ml final volume. NADH levels were followed for 10 min in a Varian Cary 50 spectrophotometer (Agilent Technologies, Santa Clara, CA) (A 340 nm, T 37°C).
Enzyme-linked immunosorbent assays for PGE2 and IL-6 and IL-12
To measure cytokines, either 1.5 × 10⁵ N9 or 2.5 × 10⁵ primary microglial cells were treated with LPSs and LPS plus 1 mM MSO, as indicated above. After 48 h, 100 μl of the cellular media supernatants from N9 cells were assayed for PGE2 with a DetectX High Sensitivity PGE2 Enzyme Immunoassay Kit (Arbor Assays, Ann Arbor, MI), as indicated (50). For IL-6 and IL-12p40 detection, medium supernatants from primary microglia were tested with mouse enzyme-linked immunosorbent assay (ELISA) kits from eBioscience (San Diego, CA). Experimentation was performed following the manufacturer's protocol.
NO and ROS detection
Nitrite, the oxidation product of NO, was measured using the Griess reaction (30). For ROS analysis, the cells were incubated with 10 μM DCFH-DA (2′,7′-dichloro-dihydro-fluorescein diacetate; Molecular Probes, Eugene, OR) for 30 min. The fluorescence was measured by a Victor3 plate reader (PerkinElmer, Whaltam, MA) at 485 nm excitation and 530 nm emission wavelengths (71).
Glucose uptake assay
Glucose uptake assay was determined as previously described with modifications. After treatments, N9 microglia cells were starved in low-glucose DMEM with 0.5% serum for 16 h (46); cells were washed twice with 37°C Krebs-Ringer phosphate (KRP) buffer (pH 7.4) (128 mM NaCl, 4.7 mM KCl, 1.65 mM CaCl2, 2.5 mM MgSO4, and 5 mM Na2HPO4). Cells were either left untreated or treated with insulin (1 μM) for 20 min in KRP buffer. Glucose uptake was started by addition of 1 mM 2-deoxy-
Conditioned medium and neuronal viability assay
N9 cells were seeded into 24-well plates and then switched to a serum-free medium. Cells were then exposed to 100 ng/ml of LPSs for 4 h with or without 1 mM MSO, after which cells were rinsed to remove LPSs, and then allowed to incubate for an additional 24 h in fresh serum-free medium. This conditioned medium was then collected and applied immediately to N2a cells for 18 h, after which N2a cell viability was determined using MTT (16). Neuronal cells and the conditioned media were processed for mass spectrometry analysis.
Cell viability
Cell viability was evaluated by 3-(4,5-dimethylthiazol-2-yl)-2,5-diphenyltetrazolium bromide (MTT) assay; 1 × 10⁴ cells were seeded in a 96-well plate, then 25 μl of MTT solution (2.5 mg/ml) was added to each well and incubated for 4 h. Media were removed and 200 μl DMSO was added to each well and incubated for 30 min at room temperature with shaking to dissolve the Formazan crystal completely. The optical density was measured in a 96-well plate reader (PerkinElmer) at 570 nm.
Statistical analyses
Data entry and all analyses were performed in a blinded manner. Results are shown as mean ± S.D. Statistical significance was calculated by ANOVA test with Tukey's post hoc test, whereas EAE data were analyzed with Kruskal–Wallis test with Dunn's multiple comparison test. Data were considered statistically significant as follows: *p < 0.05, **p < 0.001, and ***p < 0.0001.
Footnotes
Acknowledgments
The authors are very grateful to W.H. Lamers for providing the GSL/L mouse and J. Pollard for providing the CSF1R-CreERTtg/wt mouse. E.M.P. was short-term EMBO fellow. This research received funding from the Italian Ministry of Education, University and Research (MIUR), the University of Bari “Aldo Moro”, and from the European Research Council.
Author Disclosure Statement
No competing financial interests exist.