
Abstract
Introduction
T
Chemical imaging agents are well placed to contribute much to the understanding of biological systems, but to ensure maximum impact of probe development, tools must be designed to interrogate pertinent biological questions and new chemical tools must be demonstrated to have utility in novel biological studies. This work addresses the lack of fluorescent redox sensors that are ratiometric, reversible, and mitochondrially targeted through the design of two novel probes. Probe utility was demonstrated through visualization of daily changes in the reactive oxygen species production of erythroid cells, emphasizing the value of these probes in contributing to the understanding of mitochondrial oxidative bursts.
Mitochondrial number, structure, function, and ROS levels vary broadly across cell type, although perhaps no lineage shows a greater range of mitochondrial variety than blood (hematopoietic) lineages. Indeed, we have recently demonstrated that populations of hematopoietic cells can be distinguished by their mitochondrial ROS levels (28).
Mature circulating blood cells arise from hematopoietic stem cells. Mitochondrial ROS levels play a critical role in the differentiation of hematopoietic stem cells (22). Terminally differentiating erythrocytes must proceed through mitophagy to become fully functional (41). Mitophagy in erythrocytes is regulated by the Bcl-2 family member Nix (13). Mice lacking both copies fail to clear mitochondria from their maturing reticulocytes and therefore develop reticulocytosis, leading to fatal anemia (13). Flavin–rhodamine redox sensor 2 (FRR2) effectively revealed the distinct forms of mitochondrial ROS activity from the first emerging erythroid populations in the embryo through the mature adult erythrocytes lacking mitochondria.
In contrast, neutrophils show unusually shaped mitochondria that play a role in apoptosis (35). Hypoxia plays a critical role in regulating hematopoietic stem cells in the adult bone marrow (39). Mammalian embryogenesis takes place in utero in a highly hypoxic environment, and hypoxia-inducible factors are therefore also critical in the regulation of embryonic hematopoiesis. Previously, we have observed very rapid changes in the expression of genes regulating the response to hypoxia, as well as genes controlling mitochondrial function and mitophagy in the first embryonic red blood cells (7).
Currently, there is a lack of tools to study mitochondrial ROS. In particular, there is a paucity of tools that can reversibly monitor redox state changes over time, providing the potential to sense changes in oxidation and reduction events and to distinguish between transient oxidative bursts and chronic oxidative stress. Redox-responsive fluorescent proteins have been designed to achieve these aims, as summarized elsewhere (15, 34, 36). There is, however, interest in the provision of small-molecule probes, where the invasive genetic modification of the system required of genetically encoded sensors is not practical. Fluorescent small-molecule-responsive probes facilitate imaging and flow cytometric experimental approaches.
A number of elegant strategies for the preparation of reversible fluorescent sensors that operate at biologically relevant potentials have been recently reported (11, 30, 33). Among these probes, only a few exhibit mitochondrial localization, and there is a distinct lack of reversible probes of mitochondrial ROS (14, 31). To monitor living cells over time, or to draw conclusions about populations of cells, it is crucial to assess redox state, independent of probe concentration. This can be effectively achieved by the use of a ratiometric probe, in which two or more emission or excitation peaks respond differently to the analyte of interest (4, 21). By measuring the ratio of fluorescence change rather than the absolute intensity, background effects can be minimized.
Results and Discussion
In this work, we aimed to develop a reversible, ratiometric, and mitochondrially localized ROS sensor targeted to the mitochondria. We have previously demonstrated that synthetic flavins can act as redox-reporting groups in sensors (28, 29, 46). Here, we have designed a class of flavin–rhodamine redox (FRR) sensors bearing a flavin redox-responsive group and a second fluorophore, rhodamine, which acts as a Förster resonance energy transfer (FRET) acceptor (Fig. 1). Rhodamine derivatives commonly localize in the mitochondria due to their delocalized cationic nature, so there was no need to engineer an additional mitochondrially localizing group. This localization is dependent on the negative mitochondrial membrane potential (6, 26, 27, 40).
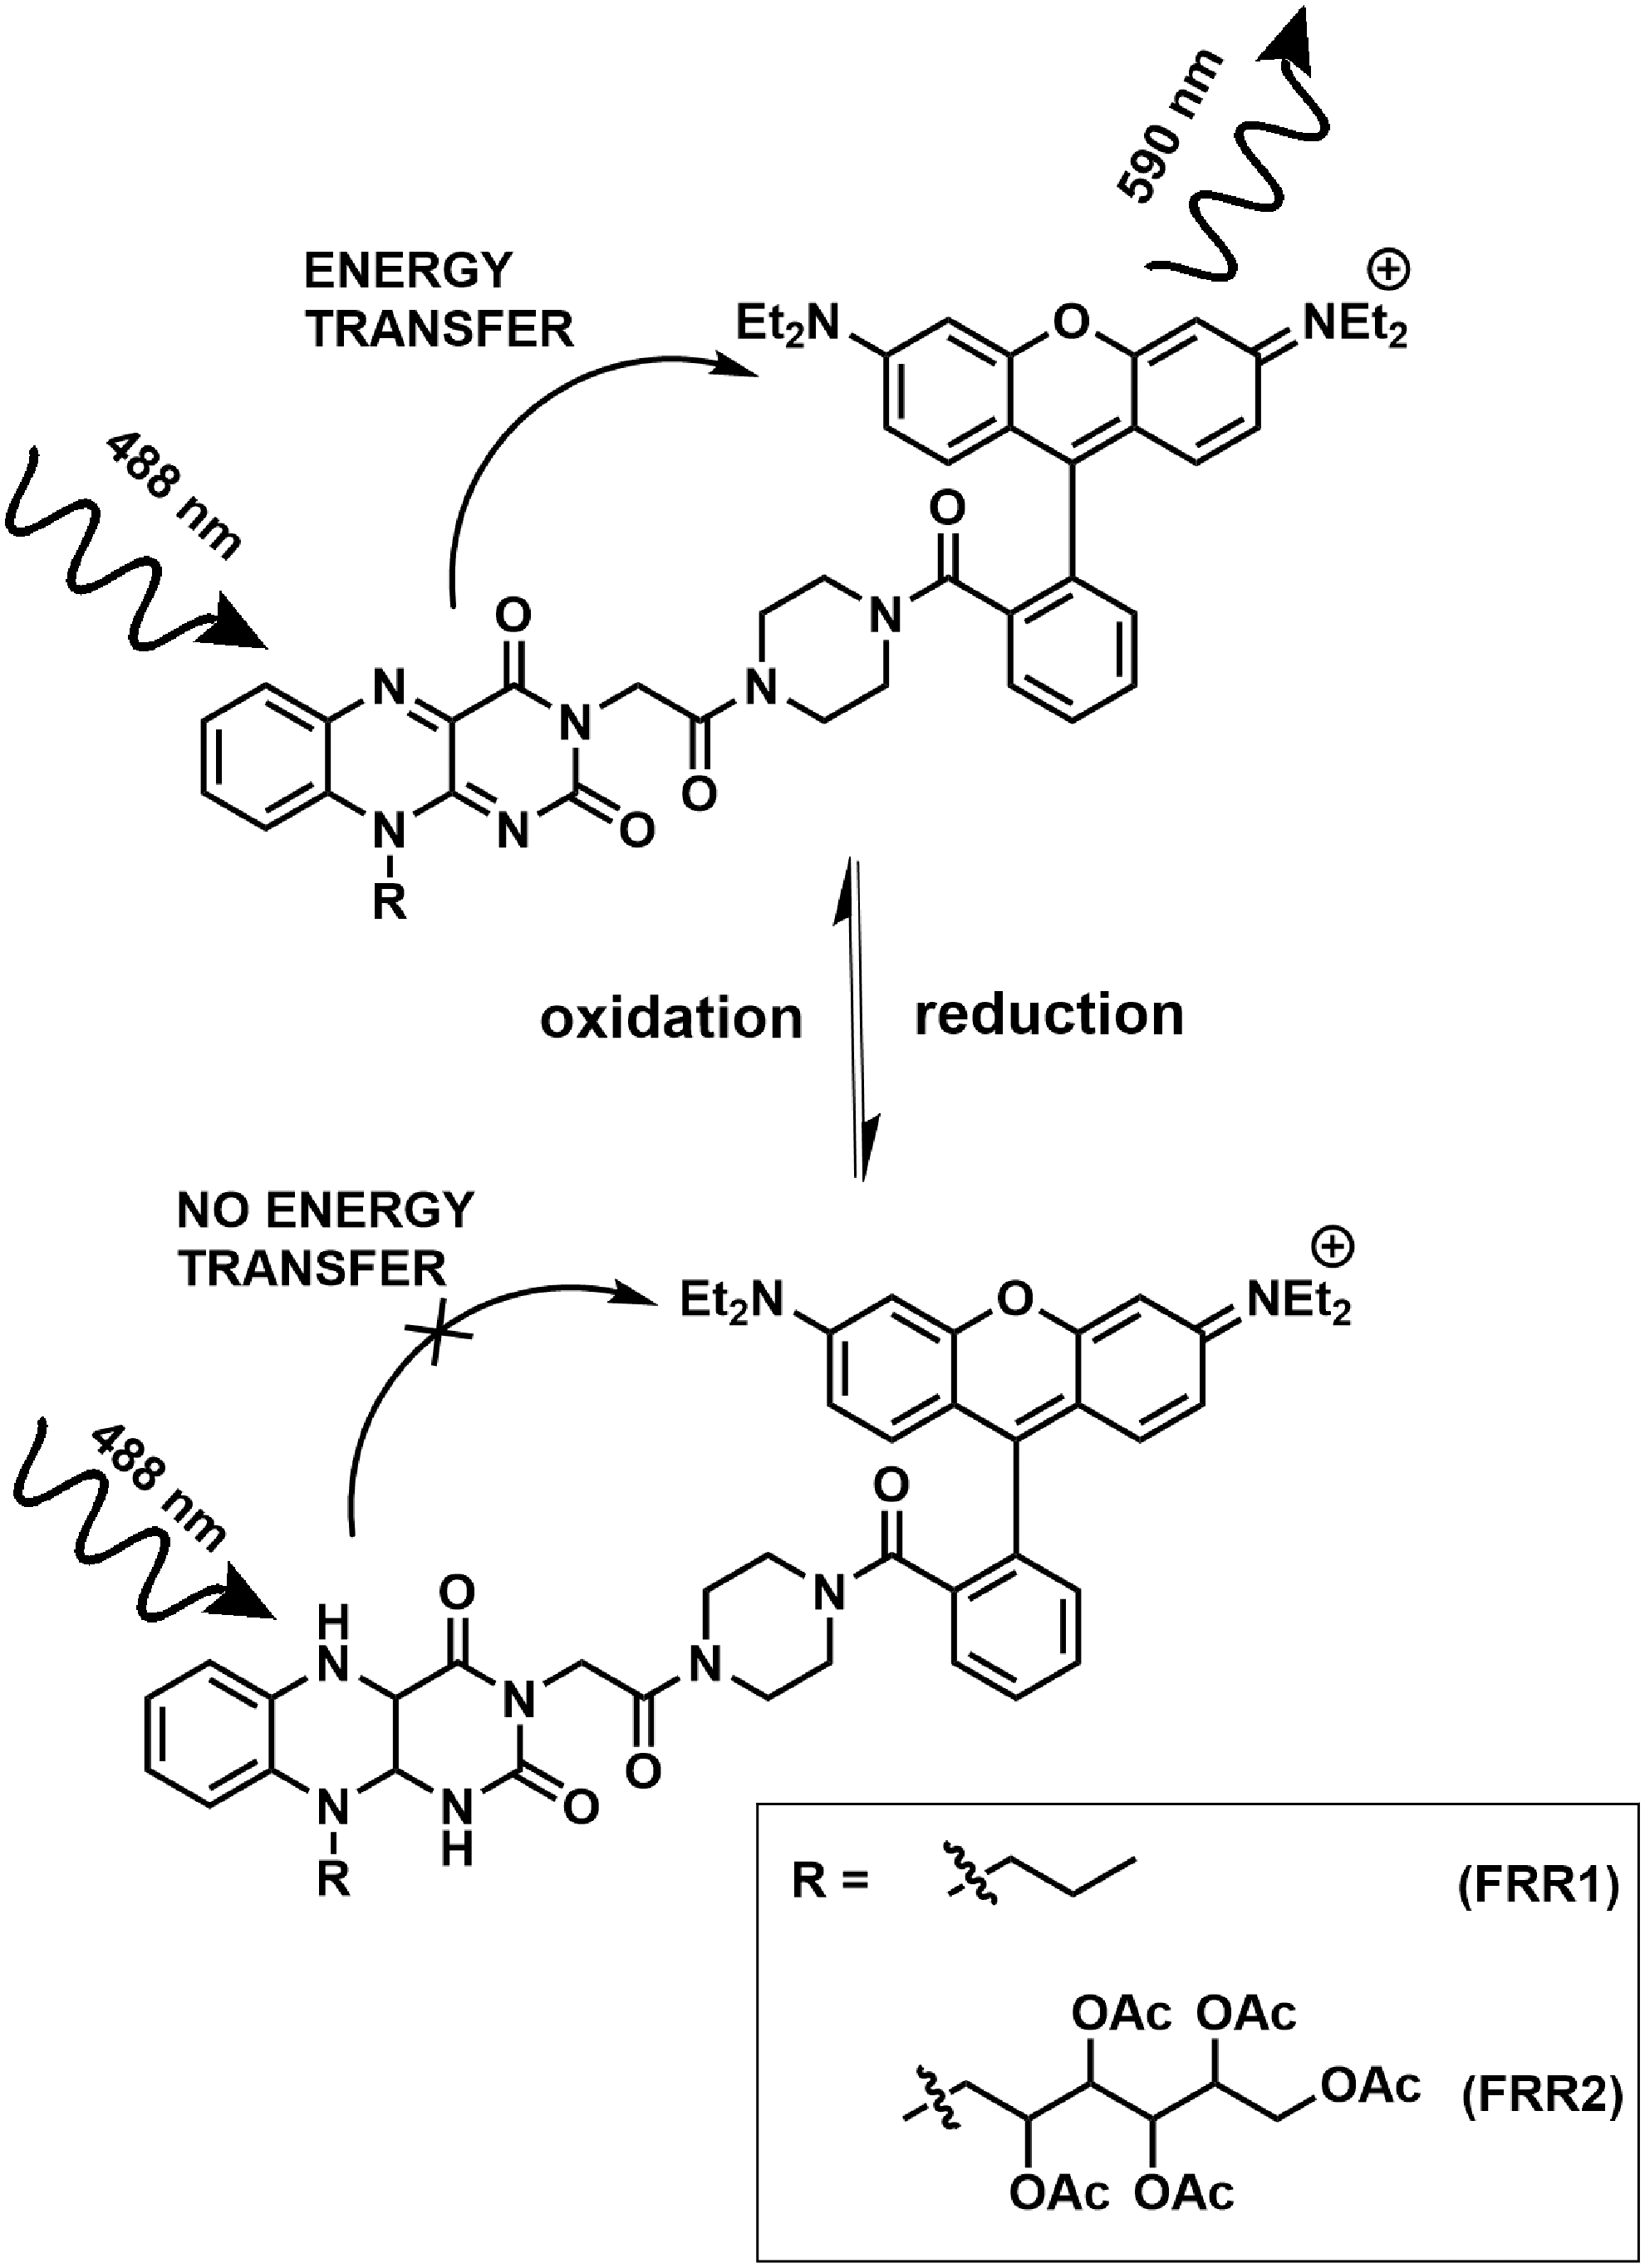
Here, we outline the synthesis, characterization, and biological application of two probes of this family, flavin–rhodamine redox sensor 1 (FRR1) and FRR2. FRR1 uses a synthetic flavin group, N-ethyl flavin, as adopted in previous probes. We also sought to investigate the use of a naturally occurring flavin derivative, tetraacetylriboflavin, which can be synthesized directly from riboflavin (vitamin B2), in the design of FRR2. Tetraacetylriboflavin has been reported to have a higher quantum yield and longer excitation and emission wavelengths than N-ethyl flavin, and we therefore aimed to investigate the influence of this structural change on the photophysical properties of the final probes. Furthermore, it was anticipated that the tetraacetylribose group could enhance cellular retention (45).
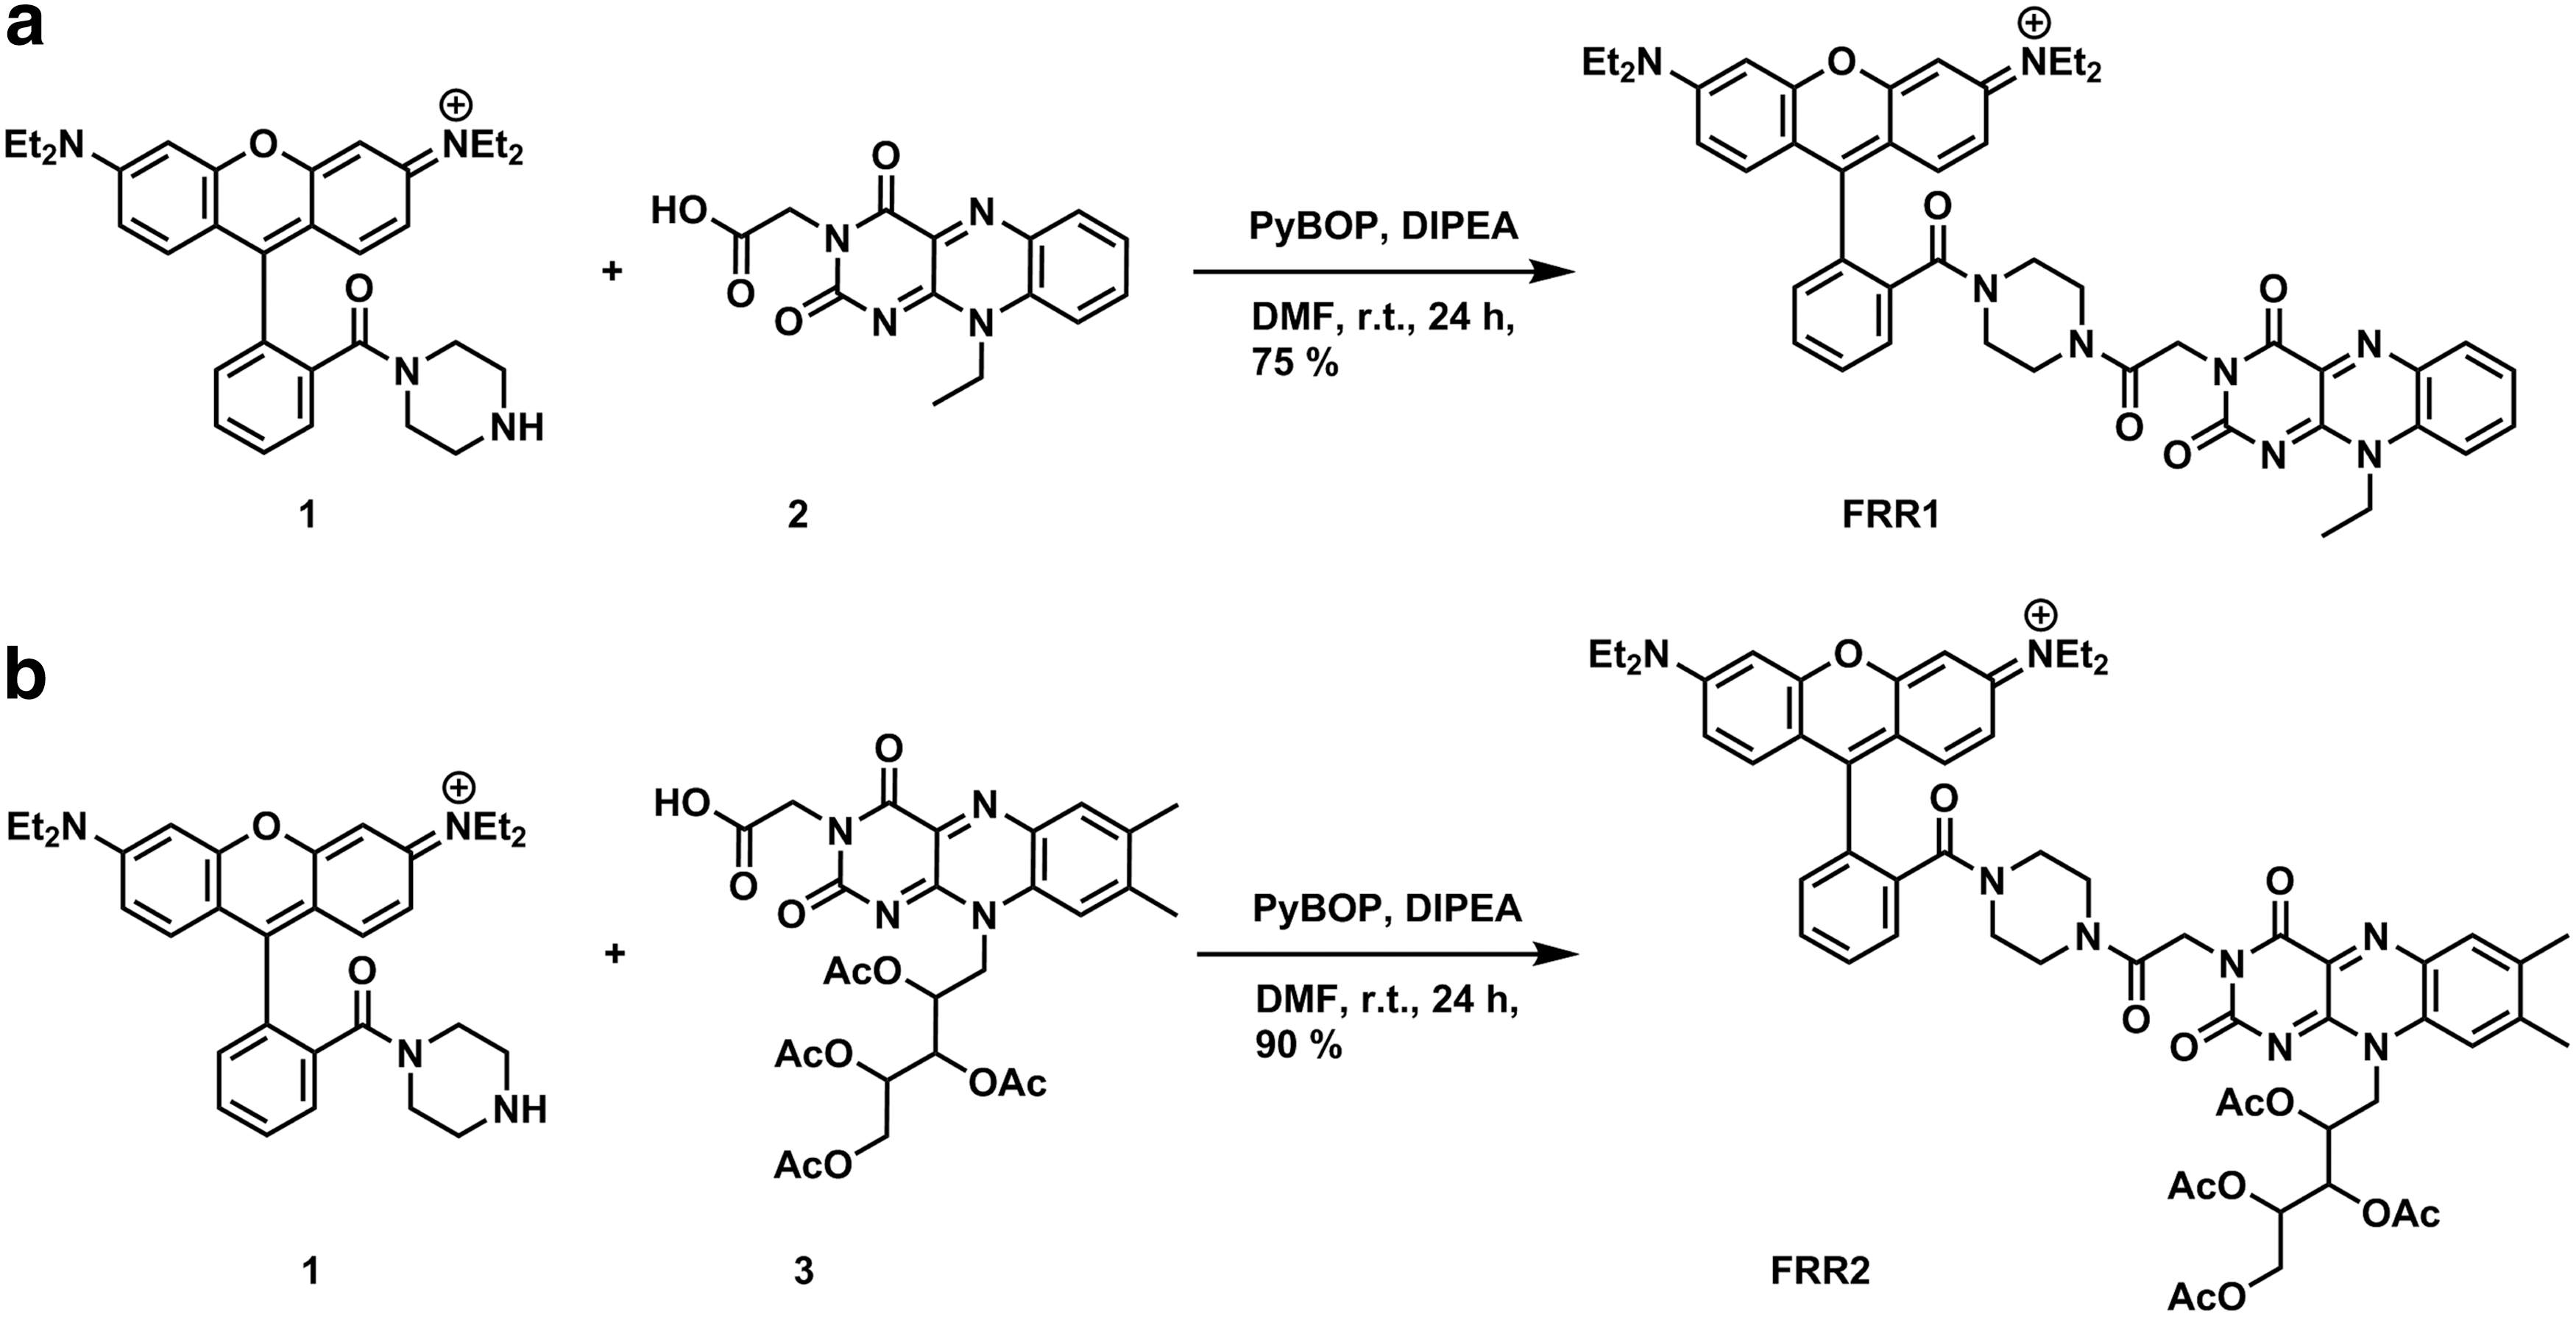
Rhodamine B-piperazine conjugate 1 was prepared according to previously published procedures (38), and subsequent coupling to N-ethyl flavin acetic acid 2 (29) gave FRR1 in 75% yield (Fig. 2). FRR2 was synthesized in similar manner, with tetraacetylriboflavin acetic acid 3 (5) coupled to secondary amine 1 to give FRR2 in 96% yield.
Consistent with the good overlap of flavin emission and rhodamine absorption peaks (Supplementary Fig. S1; Supplementary Data are available online at
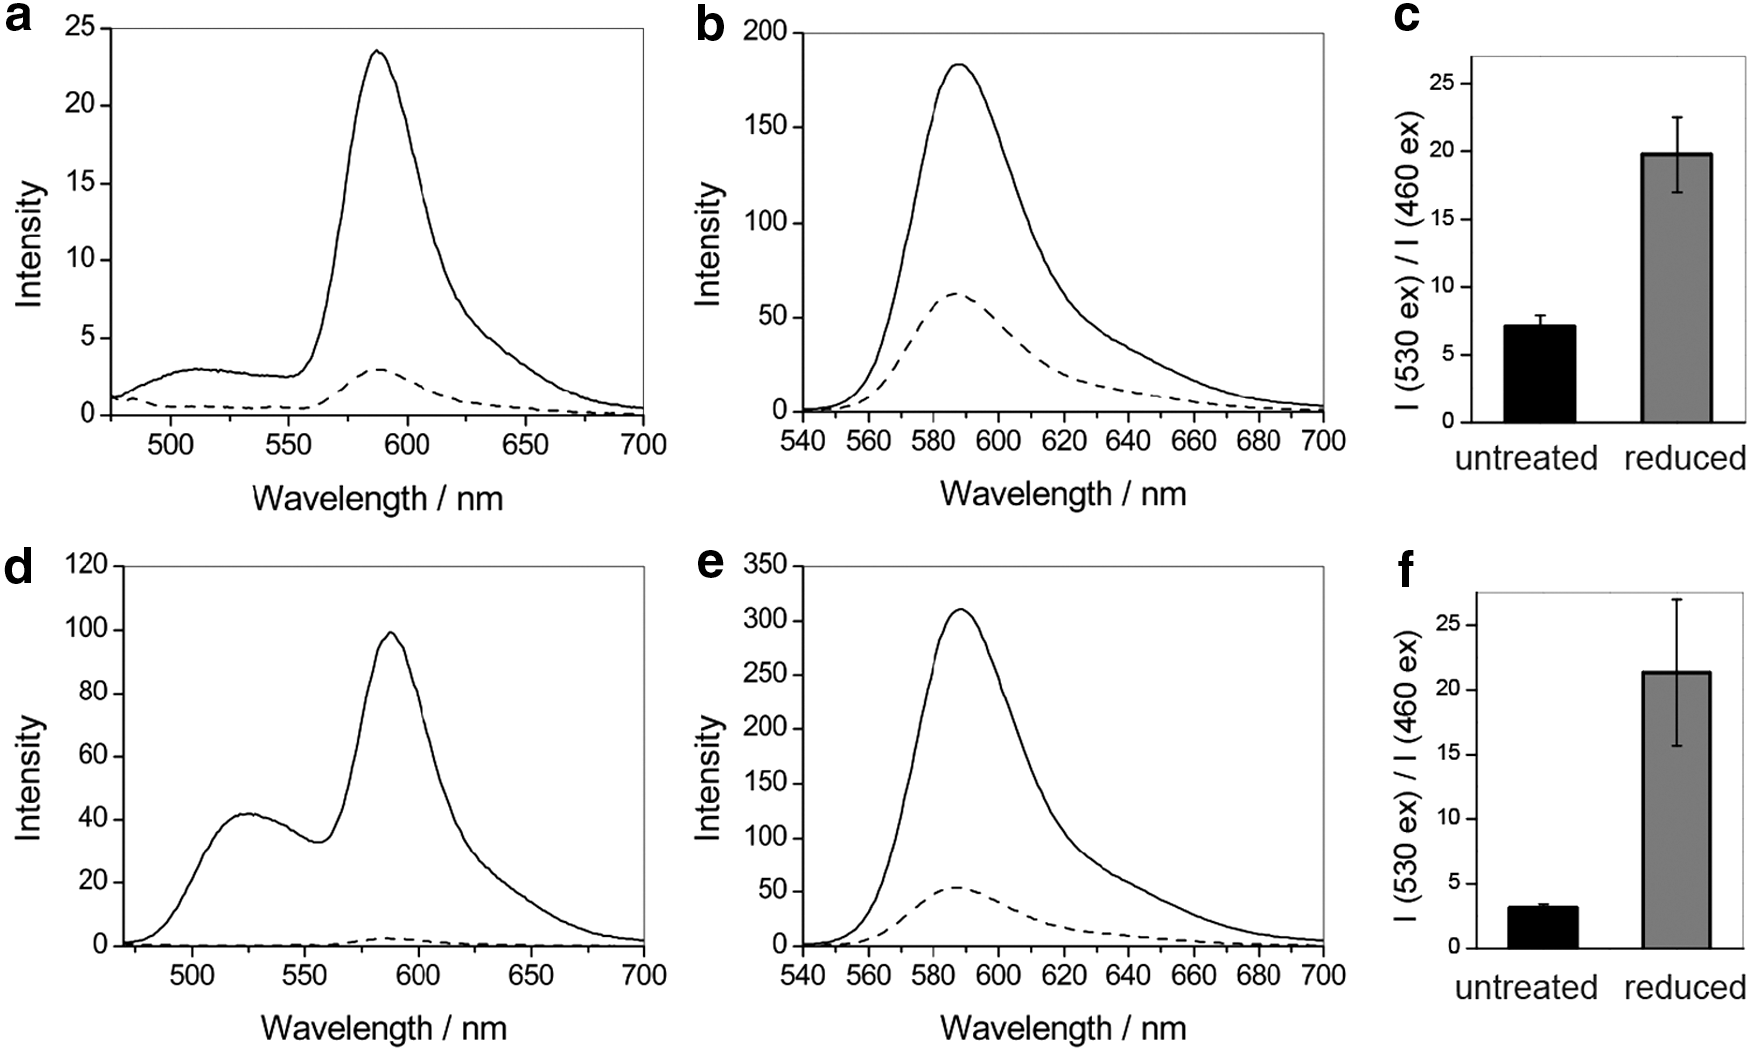
We sought to evaluate both the probes for their response upon reduction and re-oxidation. On treatment with the reductant sodium dithionite, the integrated emission intensity upon excitation at 460 nm of both probes decreased due to a reduction of the flavin donor to its nonfluorescent form, leading to an interrupted FRET mechanism. Furthermore, the ratio of emission upon excitation at 460 and 530 nm therefore decreases with reduction (Fig. 3). The fluorescence change upon reduction (Supplementary Fig. S3) could be reversed by the addition of the oxidant hydrogen peroxide (Supplementary Fig. S4).
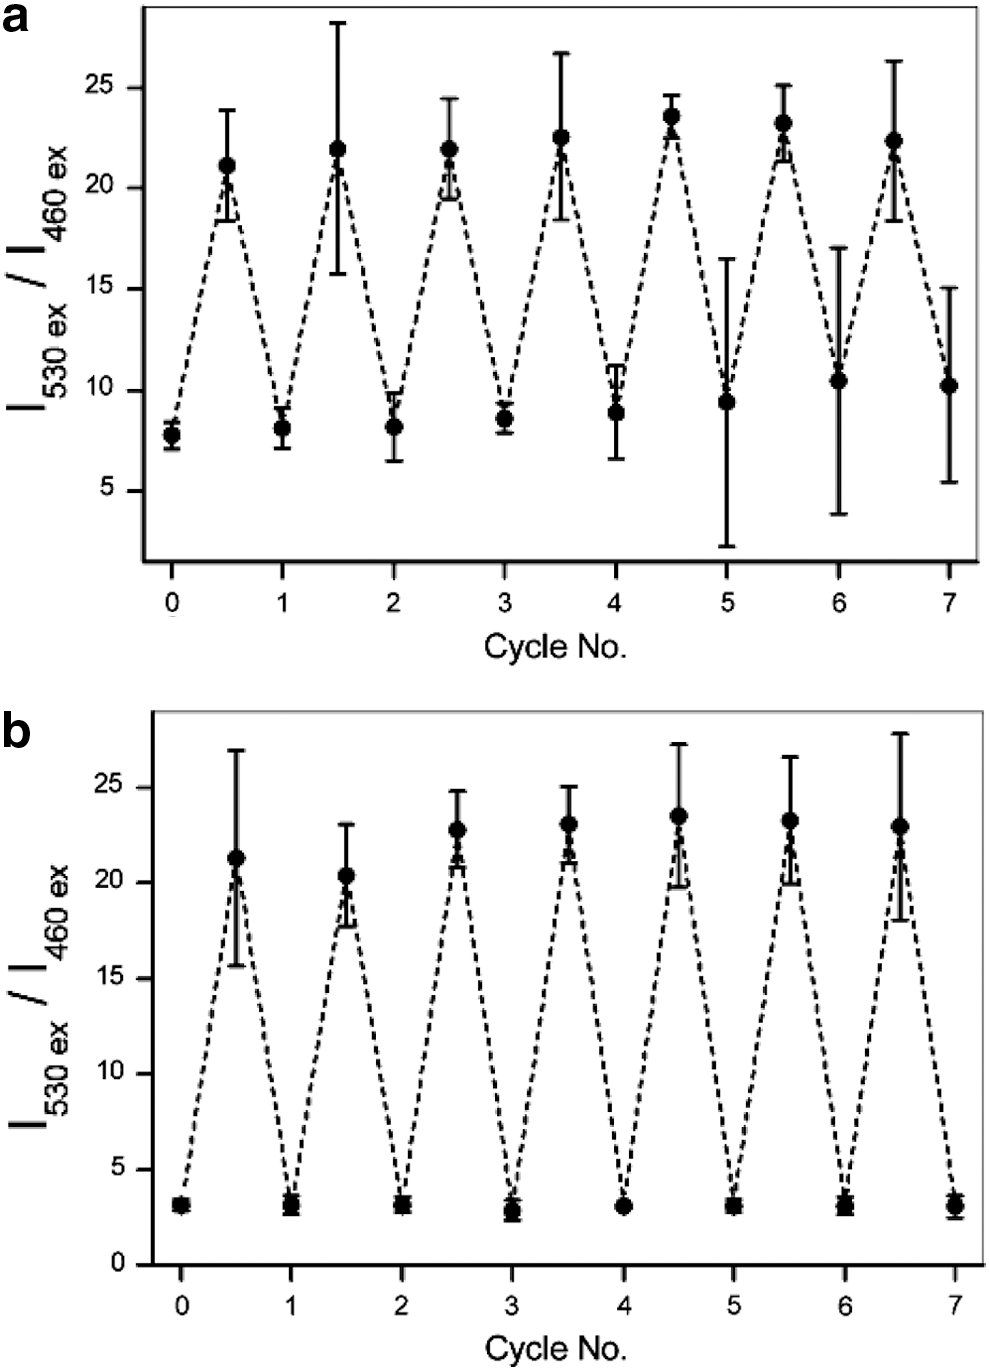
Next, we investigated the performance of both probes under multiple cycles of reduction and re-oxidation with sodium dithionite and hydrogen peroxide, respectively. For FRR1, a three-fold increase in the I530 ex/I460 ex ratio was observed with reduction of the probe (Fig. 4a). The ratio of emission intensities remained unchanged over five cycles (Fig. 4a). FRR2 exhibits a more pronounced seven-fold change in the I530/I460 ratio upon subsequent reduction and re-oxidation, with the ratio remaining constant for up to seven cycles (Fig. 4b).
Additionally, analytical high-performance liquid chromatography (HPLC) traces of both FRR1 and FRR2 confirmed stability of the probes over a cycle of reduction and re-oxidation. While the chromatogram of untreated FRR1 shows two peaks, consistent with two isomers of the piperazine, this chromatogram matches that of the probe treated with sodium dithionite followed by hydrogen peroxide (Supplementary Fig. S5a), confirming a lack of decomposition of FRR1 over this cycle. In the case of FRR2, we could peak at retention times between 10 and 18 min, which can be attributed to cleavage of acetyl groups from the ribitol chain under the HPLC conditions to form more hydrophilic fragments. However, the major peak at retention time of 20 min was maintained upon reduction and re-oxidation (Supplementary Fig. S5b), providing evidence that neither sodium dithionite nor hydrogen peroxide degrades the core structure of FRR2.
To investigate the generality or specificity of the oxidation process, reduced FRR1 and FRR2 were treated with a range of ROS and reactive nitrogen species (RNS). Both probes could be effectively oxidized by all oxidants tested, with complete re-oxidation observed within 30 min in all cases (Fig. 5a, d), demonstrating the utility of these probes as sensors for mitochondrial ROS. FRR1 and FRR2 could also be oxidized by RNS (Fig. 5a, d). Studies of FRR1 and FRR2 in the presence of biologically relevant metal ions confirmed no significant changes in fluorescence intensity of FRR1 or FRR2 when excited at either 460 or 530 nm, leaving the I530/I460 ratio intact (Fig. 5c, f). Furthermore, the I530/I460 ratio for both the probes remained unaltered in the presence of high concentrations of metal ions (100 mM, Supplementary Fig. S6).
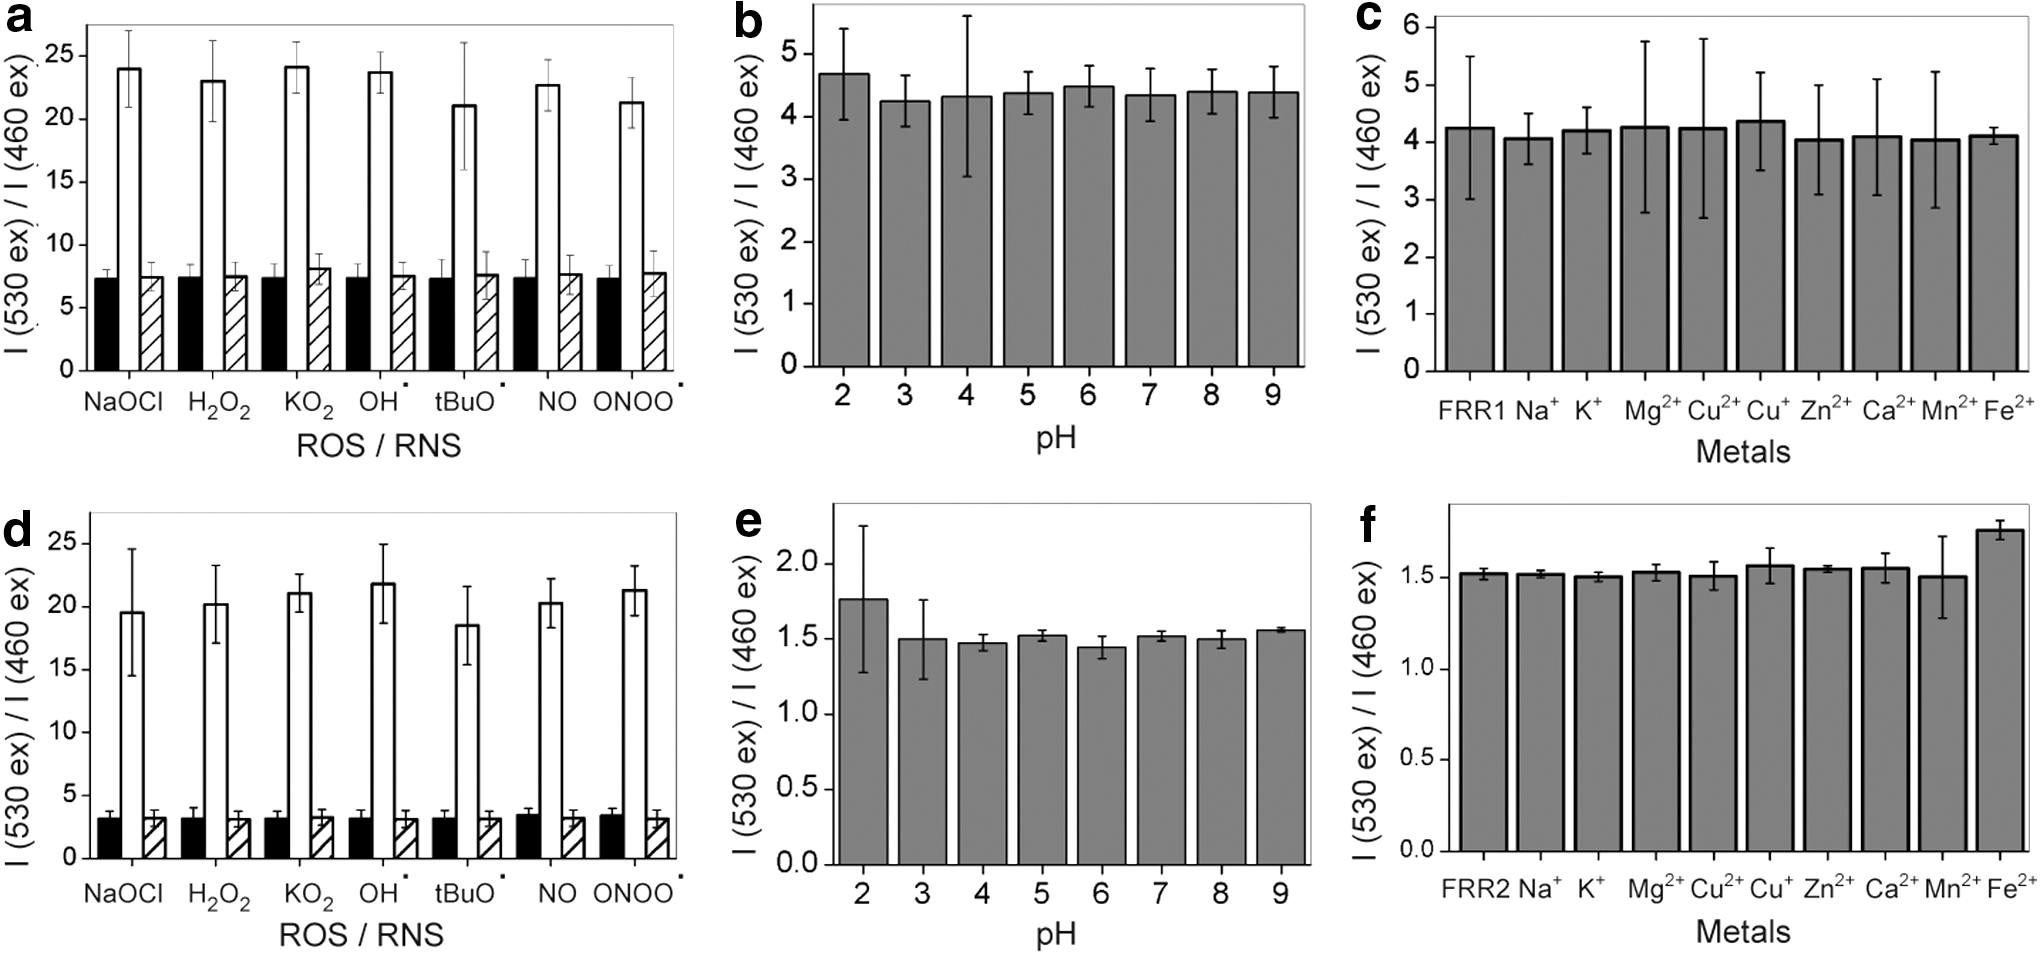
Finally, we investigated the effect of pH on the fluorescent emission of FRR1 and FRR2 (Fig. 5b, e). FRR1 exhibits good pH tolerance between pH 3 and 8. At pH 2 and 9, there was a decrease in fluorescence emission upon excitation at both 460 and 530 nm, but the ratio of emission intensities remained consistent. FRR2 exhibits higher pH tolerance, with consistent emission between pH 3 and 9. This pH insensitivity confirms the utility of both FRR1 and FRR2 for the study of biological systems. Furthermore, a concentration-based fluorescence assay showed that FRR1 and FRR2 follow the Beer–Lambert law for concentrations ranging from 5 to 80 μM, indicating that quenching does not occur at concentrations below 80 μM (Supplementary Fig. S7).
Cyclic voltammetry of FRR1 and FRR2 revealed two sets of peaks with half-wave potentials of −544 mV from rhodamine B (42) and −259 and −290 mV (vs. normal hydrogen electrode) corresponding to N-ethyl flavin in FRR1 and riboflavin in FRR2, respectively (32) (Supplementary Fig. S8). The electrochemical studies confirm that the ribose tail in FRR2 has modulated the reduction potential to a more biologically relevant value than FRR1. While the rhodamine reduction peak could also be observed in the cyclic voltammogram, it is far outside the biologically relevant range. The profiles of the cyclic voltammograms further confirm the chemical reversibility of reduction and oxidation processes.
After establishing the redox-responsive properties and reversibility of FRR1 and FRR2, we sought to test their subcellular localization in cultured cells using the mouse macrophage cell line RAW 264.7. Under excitation by a 488 laser, control cells untreated with the probe showed negligible fluorescence, while cells treated with FRR1 or FRR2 (20 μM, 15 min) showed significant fluorescence. Cells were costained with FRR1 or FRR2 (20 μM, 15 min) and the commercially available MitoTracker Deep Red FM (100 nM, 15 min) and fluorescence images obtained in green and red channels, respectively. As shown in Figure 6, the fluorescence of FRR1 and FRR2 from the costained cells overlaps well with that of the MitoTracker Deep Red, as indicated by the yellow regions in the merged image (Fig. 6 and Supplementary Fig. S9), and the high Pearson's colocalization coefficients of 0.68 and 0.92, respectively. Furthermore, co-staining of RAW 264.7 cells with FRR1 or FRR2 and LysoTracker Deep Red (100 nM, 15 min) revealed significantly different localization profiles regions (Supplementary Fig. S10), accompanied by poor Pearson's colocalization coefficients of 0.25 and 0.13, respectively.
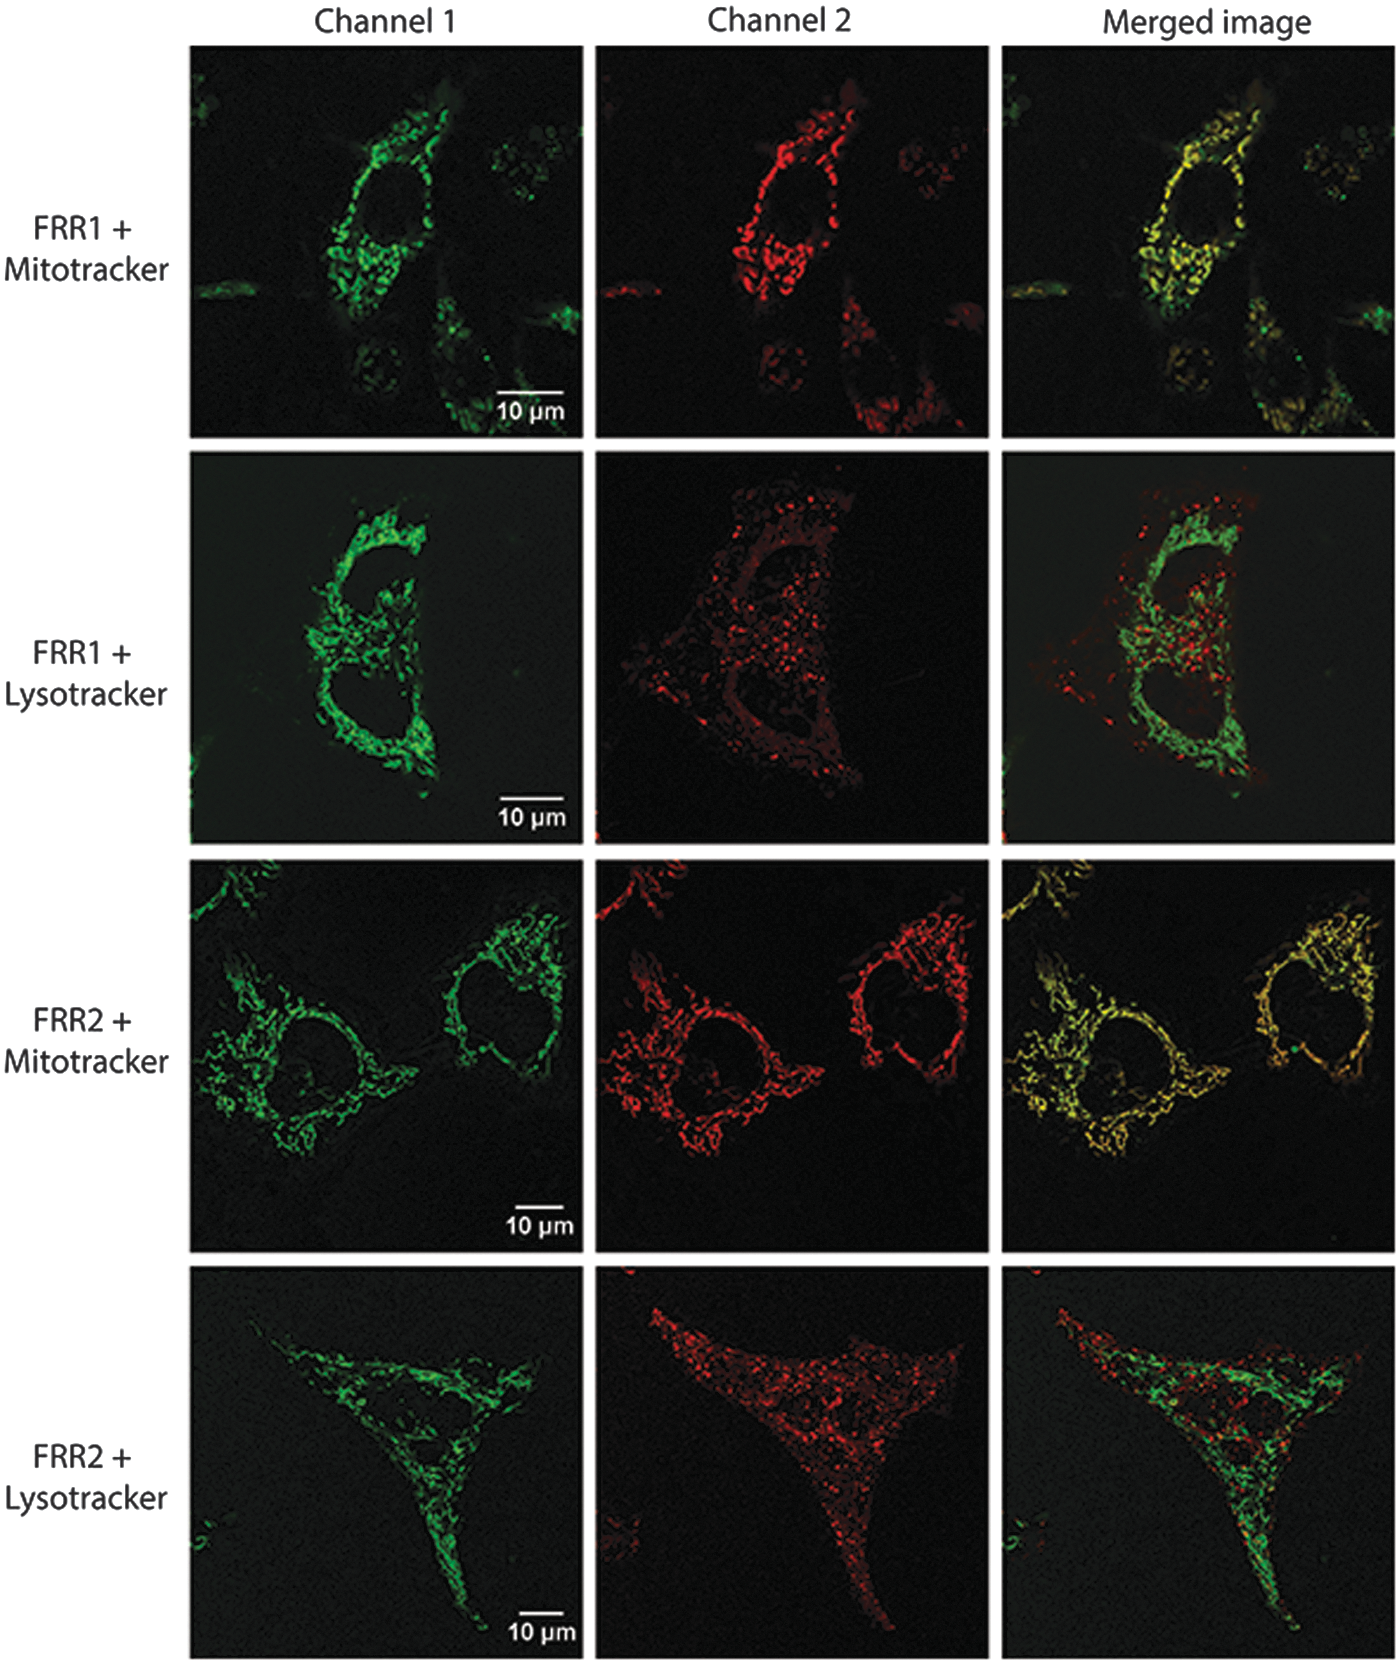
Finally, images obtained from cells singly stained with FRR1 or FRR2, MitoTracker or LysoTracker, confirmed that no emission leaked from one channel into the other (Supplementary Fig. S10). To further confirm the mitochondrial localization of the probes, we sought to perform colocalization experiments with CellLight® Mitochondria-GFP, BacMam 2.0. As this technology cannot be applied to macrophages or hematopoietic cells (2), DLD-1 (human colorectal carcinoma) cells were instead studied. Cells transduced with CellLight Mitochondria-GFP and then with FRR1 or FRR2 showed excellent colocalization, indicated by the yellow regions in the merged image (Supplementary Fig. S11).
The cytotoxicity of FRR1 and FRR2 was evaluated using the MTT assay, with IC50 values over 24 h measured at 38 (±1) μM and 41 (±2) μM, far higher in terms of both concentration and dosage times than we used in imaging experiments. Furthermore, time-lapse imaging experiments were performed to investigate the effect of longer laser exposure on probe behavior and cell viability. These studies confirmed that neither FRR1 nor FRR2 exhibit any self-amplification of fluorescence emission, even over 25 min (Supplementary Fig. S12). In addition, the cell morphology remained unchanged over this period, indicating a lack of phototoxicity. While the probes showed excellent localization to the mitochondria, this will be membrane potential dependent, affecting the localization and retention of the probes under depolarizing conditions. Furthermore, while the probes show linear emission increases with concentration up to 80 μM (Supplementary Fig. S7), there is a possibility that local concentrations of probe within mitochondria may exceed this value, leading to some quenching effects.
Brighter green fluorescence was observed from FRR2 than FRR1, consistent with its higher quantum yield, aiding image analysis, so further biological experiments were performed with FRR2. While we have demonstrated that both FRR1 and FRR2 exhibit ratiometric behavior, their use requires two excitation sources, which is not available in many standard imaging or cytometry instruments.
To demonstrate the broader applicability of FRR2 in such protocols, we also investigated its ability to report on changes in ROS with a single excitation. Using the common excitation wavelength of 488 nm, we could observe a reversible fluorescence decrease upon reduction (Supplementary Fig. S13a), although with weaker emission from the flavin group than at 460 nm excitation (Fig. 3d). The ratiometric response shows a similar trend with excitation at 488 nm as for 460 nm (Supplementary Fig. S13b), but importantly, the absolute (nonratiometric) intensity of emission (560–590 nm) also shows clear changes (Supplementary Fig. S13c). As a result, subsequent flow cytometry experiments were performed with excitation at 488 nm, with a higher red fluorescence indicating more oxidized probe.
The reversibility of FRR2 response was tested by treating RAW 264.7 macrophages with the probe followed by their stimulation with lipopolysaccharide (LPS) over different time periods from 0 to 2 h. Following excitation with a 488 nm laser, the red fluorescence emission (585/42 nm) was measured using the BD FACScan flow cytometer, with a higher red emission indicative of higher ROS levels. As shown in Figure 7, the fluorescence increased five-fold by 30-min timepoint, suggesting that a burst in the production of ROS occurs 30 min after LPS stimulation, initiating the downstream signaling of other immune responses, as previously observed (20).
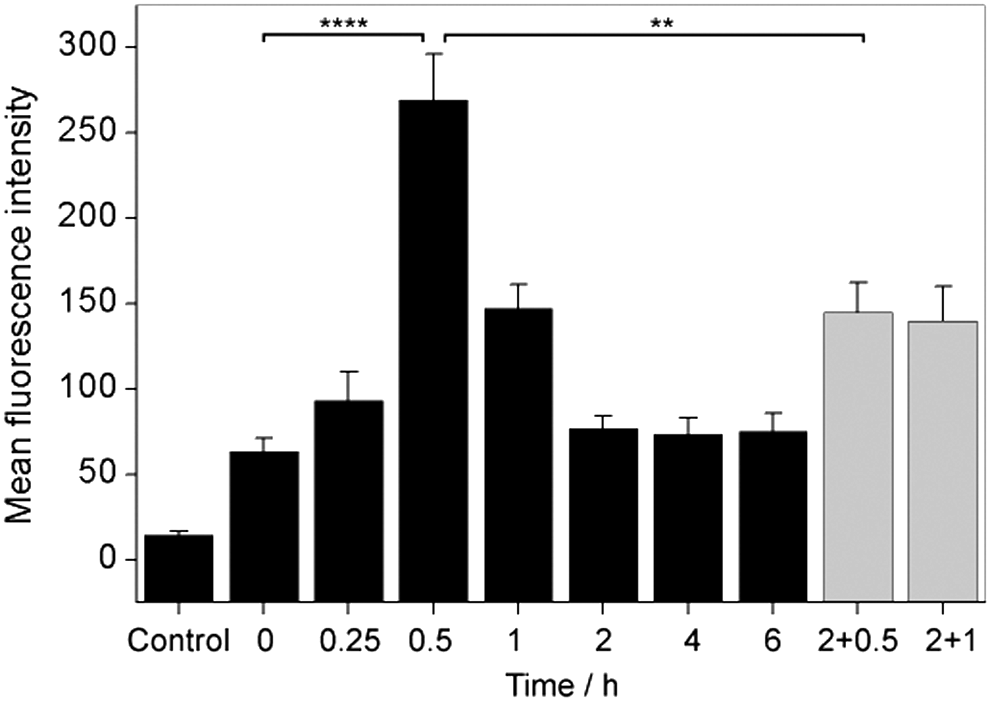
For longer treatment timepoints, the emission decreased, and after 2 h had returned to levels observed in unstimulated cells (Fig. 7 and Supplementary Fig. S14). Furthermore, restimulation of macrophages with LPS 2 h after initial stimulation resulted in an increase in probe emission after 0.5 and 1 h. However, this increase was less drastic than the initial response (Fig. 7 and Supplementary Fig. S14). This clearly demonstrates that FRR2 can reversibly respond to changes in mitochondrial ROS over time.
Similar trends were observed from live cell imaging experiments of macrophages treated with FRR2 followed by LPS stimulation (Supplementary Fig. S15). The ratiometric and reversible redox-responsive properties make FRR2 a valuable tool for obtaining temporal information cellular redox while nullifying any concentration or other background effects compared to existing irreversible and intensity-based probes, such as MitoSOX (13).
Having established the utility of FRR2 as a reversible probe for imaging mitochondrial redox state, the probe was then used to monitor the changes in mitochondrial ROS in cells of a similar biological origin and function in distinct redox environments. To this end, we examined FRR2 fluorescence in developing erythroid (red blood) cells from the mouse embryo, which is in a hypoxic environment compared to erythroid cells generated in the adult mouse. Erythropoiesis (red blood cell production) takes place in several waves, leading to the generation of at least five distinct oxygen-transporting erythroid cell types (18).
Single-cell suspensions of embryonic blood, fetal liver, adult blood, adult bone marrow, and adult spleen at 9.5, 11.5, 12.5, 14.5, and 15.5 days post-coitum (dpc) were incubated with a combination of FRR2 (20 μM) and Ter-119 (antibody marker for erythroid cells) for 15 min and then assessed for fluorescence using a flow cytometer. The earliest erythroid cell is the primitive erythroid (EryP) cell, which appears in the mouse embryo from 7.5 dpc and is the predominant circulating red blood cell until 14.5 dpc (17, 25). Analysis of embryonic blood with FRR2 (Fig. 8) showed uniform FRR2 fluorescence in the circulating EryP cells containing a nucleus and metabolically active mitochondria. By 11.5–12.5 dpc, two distinct populations (labeled 1 and 2) can be seen in the circulating blood, as identified by FRR2 (Fig. 8). Population 1 shows higher FRR2-red fluorescence than population 2.
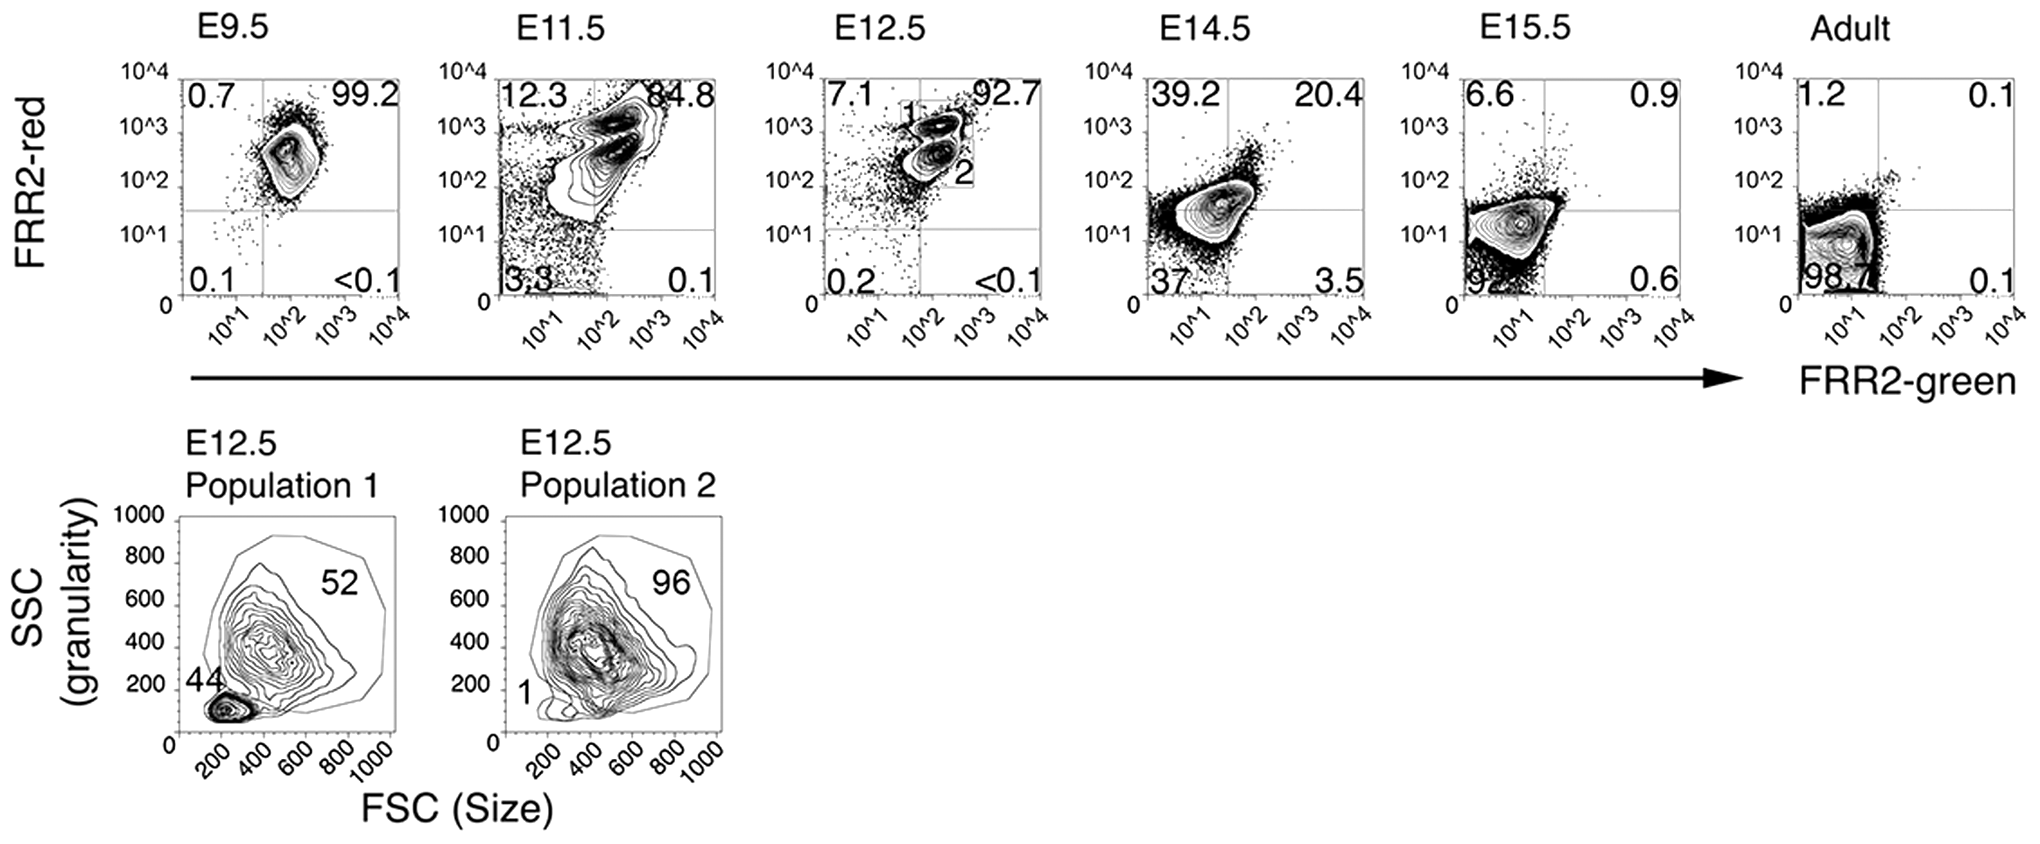
When the size and granularity of the former population was assessed, cells were found to comprise a population of larger cells, the yolk sac-derived definitive erythroblasts, and a population of smaller cells, the matured enucleated erythrocytes. In contrast, population 2 cells are larger and typical of EryP cells. FRR2 fluorescence in circulating embryonic blood cells showed a pronounced decrease at 14.5 dpc, and by 15.5 dpc, fluorescence was almost at the levels seen in circulating adult erythrocytes that lack nuclei and mitochondria.
Having observed differences between circulating embryonic and adult blood cells, we next investigated whether this was due to distinct erythropoietic (red blood cell production) environments or due to differences arising in the embryonic and adult blood streams. To address this, we assessed FRR2 fluorescence specifically in the developing erythroid cells in the fetal liver just as it starts to operate as a hematopoietic organ (12.5 dpc), at the time when red blood cell production peaks (14.5 dpc), comparing these results to the adult bone marrow and the adult spleen.
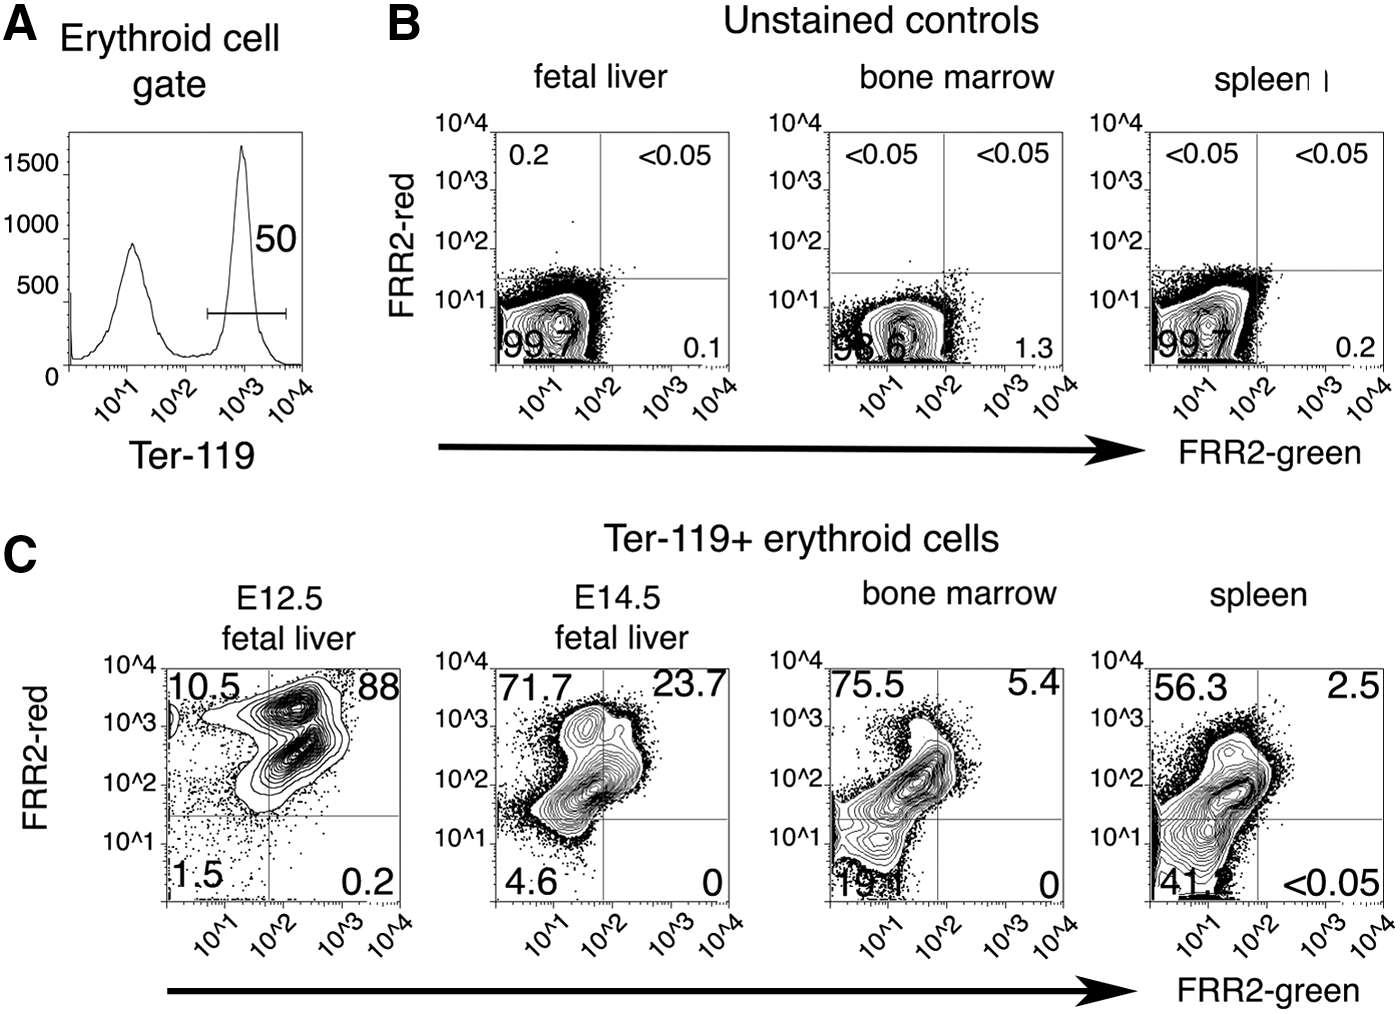
To specifically identify erythroid cells in these complex hematopoietic environments, we combined FRR2 with antibody staining for multiparameteric flow cytometric analyses. Ter-119 is an antibody recognizing an antigen specific for developing and mature mouse erythroid cells. Samples from fetal liver, bone marrow, and spleen were stained with a cocktail of FRR2 and Ter-119 conjugated to Alexa Fluor™ 647. Ter-119-expressing cells were gated (Fig. 9A) and assessed for FRR2 fluorescence. No fluorescent signals were detected in unstained samples from the fetal liver, bone marrow, or spleen (Fig. 9B). In the 12.5 dpc fetal liver, essentially all erythroid cells showed FRR2 fluorescence (Fig. 9C) and can be identified as two distinct populations, similar to the circulating blood at this stage (Fig. 8). By 14.5 dpc, FRR2 fluorescence had dropped significantly in the fetal liver. In particular, the FRR2-bright population was significantly reduced. Within the adult bone marrow, FRR2 fluorescence was further reduced or restricted to the FRR2-red signal. FRR2-negative erythroid cells comprised close to half of all erythroid cells in the adult spleen. These data suggest that red blood cell production in the early embryo is profoundly different compared to the steady-state erythropoiesis found in the adult tissues.
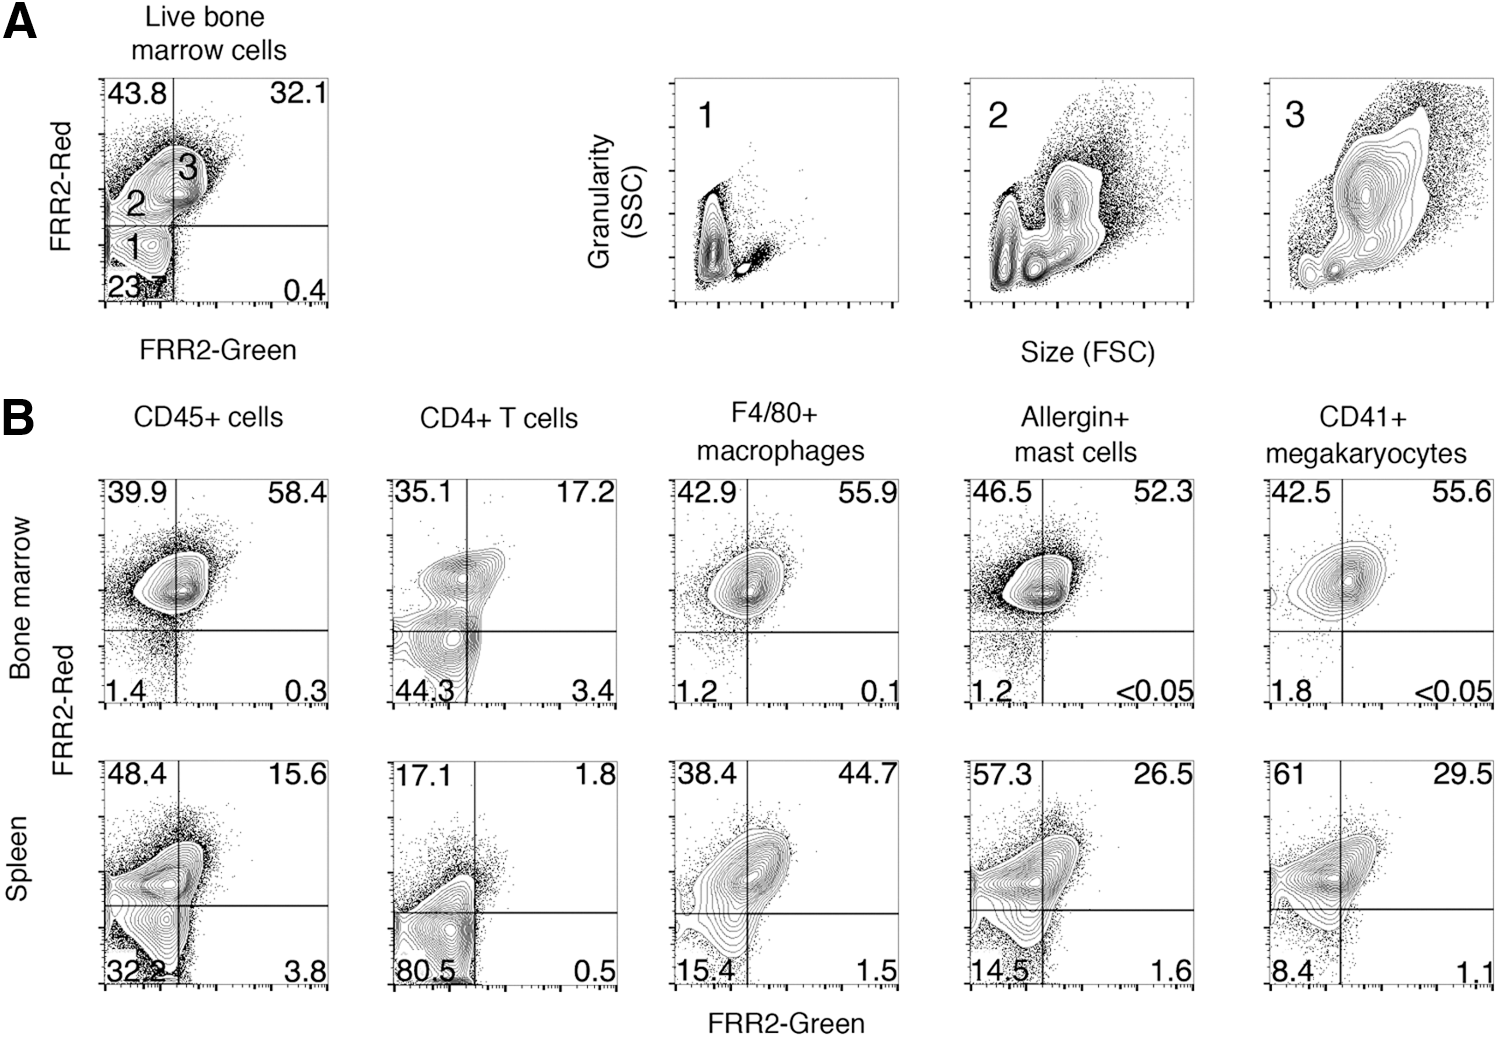
To complete the analysis of mitochondrial ROS in hematopoietic cell types, we assessed FRR2 fluorescence in developing and mature T lymphocytes, macrophages, megakaryocytes, and mast cells. We first assessed FRR2 fluorescence in all hematopoietic cells of the adult mouse bone marrow (Fig. 10A). Three populations could be observed (labeled 1, 2, and 3 in Fig. 10A). When gated for further analysis, each population showed distinct size and granularity profiles. Population 1, which showed no FRR2 fluorescent signal, consisted of very small nongranular cells and are therefore most likely erythrocytes. Population 2, which showed low levels of FRR2-red fluorescence and no FRR2-green signal, composed of a range of cells including some showing the size and granularity profiles of erythrocytes, erythroblasts (developing red blood cells), and myeloblasts (early myeloid cells). Population 3, which showed both FRR2-red and FRR2-green signal simultaneously, consisted largely of granular myeloid cells.
To better define the mitochondrial ROS in specific lineages, we combined FRR2 fluorescence with antibodies against specific hematopoietic lineages. Adult mouse bone marrow and spleen were analyzed to determine changes between hematopoietic cells where they develop (bone marrow) and where they mature and function (spleen).
All hematopoietic cells, except for enucleated red blood cells, express the hematopoietic-specific surface marker CD45. CD45-expressing cells were gated (Fig. 10B) and analyzed for FRR2 fluorescence. Bone marrow CD45+ showed uniform levels of FRR2-red and green fluorescence, but a significant population of CD45+ cells in the spleen had lost all FRR2 fluorescence. We therefore assessed which CD45+ cell type lost FRR2 fluorescence once mature. CD4 is expressed by T-helper lymphocytes. Bone marrow CD4+ cells showed a population with mostly FRR2-red fluorescence and a second population lacking FRR2 fluorescence. This second population (FRR2-negative) consists of the CD4+ cells in the spleen. In contrast, F4/80+ macrophages, Allergin+ mast cells and CD41+ megakaryocytes showed uniform FRR2-fluorescence in the bone marrow and only moderate reduction in FRR2 in the spleen. These data suggest that CD4+ T-helper lymphocytes in the spleen exhibit very low levels of mitochondrial ROS.
These experiments demonstrate the valuable information that can be derived using small-molecule probes, such as FRR2. Ex vivo studies, such as this, are particularly well suited to the use of small-molecule probes like FRR2 over genetically encoded sensors.
Conclusions
In summary, we have presented FRR1 and FRR2, two new ratiometric reversible fluorescent sensors for biological redox state. With their ratiometric output, FRR1 and FRR2 show great promise as tools that report on mitochondrial oxidative stress without any interference from the background or environment. We have been able to evaluate the reversible redox response of FRR2 by monitoring the dynamics of oxidative changes within LPS-stimulated macrophages. Furthermore, we have demonstrated that FRR2 is capable of reporting on the mitochondrial oxidative capacities of hematopoietic cells during different stages of embryonic development and in the adult.
Materials and Methods
General experimental methods
All solvents used were laboratory grade and were dried over appropriate drying agents when required. Milli-Q water was used to prepare all aqueous solutions. Merck 230–400 mesh Kieselgel 60 was used for column chromatography, and Merck Kieselgel 60 0.25 mm F254 precoated sheets were used for analytical thin layer chromatography. Chemicals were obtained from Sigma-Aldrich, Alfa Aesar, and Combi Blocks and used as received.
Spectroscopic methods
1H NMR and 13C NMR spectra were collected in commercially available deuterated solvents (Cambridge Isotope Laboratories) at 25°C on a Bruker Ascend 400 and 500 spectrometer at the School of Chemistry NMR Facility in the University of Sydney. 13C NMR spectra were recorded at frequencies of 100 and 125 MHz, respectively. All chemical shifts are reported in the standard δ notation of parts per million using the peak of the residual solvent proton signals as an internal reference. J values are given in Hertz. High-resolution mass spectrometry was performed on a Bruker Apex-Ultra spectrometer operating on ESI using an Apollo II ESI/MALDI dual source. Spectroscopic measurements were performed in 100 mM HEPES, pH 7.4. Fluorescence measurements were collected using a bench-top Varian Cary Eclipse fluorimeter and PerkinElmer EnSpire Multimode Plate Reader at 5-nm slit widths.
Synthesis
Compounds 1 (38), 2 (29), and 3 (5) were synthesized according to the published procedures.
FRR1 3-(2-(4-(2-(3-(diethyl-l4-azanylidene)-6-(diethylamino)-3H-xanthen-9-yl)benzoyl)piperazin-1-yl)-2-oxoethyl)-10-ethylbenzo[g]pteridine-2,4(3H,10H)-dione: 1 (0.1 g, 0.196 mmol) was added to a mixed solution of 2 (0.094 g, 0.313 mmol), benzotriazol-1-yl-oxytripyrrolidinophosphonium hexafluorophosphate (PyBOP, 0.163 g, 0.313 mmol), N,N-diisopropylethylamine (DIPEA, 0.205 ml, 1.175 mmol), and dry N,N-dimethylformamide (DMF, 5 ml) under inert atmosphere. The reaction solution was stirred at room temperature for 31 h, and then, DMF was distilled off under reduced pressure. The resulting red oil was dissolved in chloroform (100 ml), washed four times with water (50 ml), and subsequently once with saturated sodium chloride (50 ml). Chloroform layer was dried over anhydrous sodium sulfate and volatiles removed under reduced pressure. The obtained red residue was purified by column chromatography (dichloromethane [DCM]: methanol [MeOH] = 95:5) to afford the final FRR1 (0.117 g, 75% yield).
1H (500 MHz) (MeOH-d4) δ (ppm): 7.83 (d, 3H, J = 8.2 Hz); 7.75–7.66 (m, 6H); 7.53–7.43 (m, 6H); 7.25–7.23 (m, 1H); 7.03 (m, 1H); 6.87 (m, 1H); 4.87 (s, 1H); 4.77–4.75 (m, 1H); 3.65–3.34 (m, 13H); 1.46 (m, 2H); 1.28–1.27 (m, 10H); 1.12 (m, 2H).
13C (125 MHz) (MeOH-d4) δ (ppm): 168.4; 166.4; 160.2; 157.9; 155.9; 155.6; 149.1; 141.5; 136.9; 136.2; 135.2; 132.7; 132.2; 131.9; 131.0; 130.6; 128.3; 127.7; 127.1; 126.8; 126.0; 117.3; 116.2; 114.2; 113.6; 110.2; 96.1; 45.7; 42.5; 41.4; 40.5; 11.7; 11.4.
high-resolution mass spectrometry (HR-MS) calc for C46H48N8O5 [M]+ 793.3820 found 793.38178.
FRR2 5-(3-(2-(4-(2-(3-(diethyl-l4-azanylidene)-6-(diethylamino)-3H-xanthen-9-yl)benzoyl)piperazin-1-yl)-2-oxoethyl)-7,8-dimethyl-2,4-dioxo-3,4-dihydrobenzo[g]pteridin-10(2H)-yl)pentane-1,2,3,4-tetrayl tetraacetate: acid 3 (0.10 g, 0.17 mmol) was dissolved in dry DMF (3 ml) under inert atmosphere. DIPEA (0.11 ml, 0.62 mmol) followed by PyBOP (0.09 g, 0.17 mmol) were added. The solution was stirred at room temperature for 30 min and 1 (0.05 g, 0.10 mmol) in dry DMF (2 ml) was added dropwise. The reaction mixture was stirred for 48 h. Then, DMF was distilled off under reduced pressure. The resulting red oil was dissolved in chloroform (100 ml), washed four times with water (50 ml), and subsequently once with saturated sodium chloride (50 ml). Chloroform layer was dried over anhydrous sodium sulfate and volatiles removed under reduced pressure. The obtained red residue was purified by column chromatography (DCM:MeOH = 95:5) to give FRR2 as purple solid (0.11 g, 96% yield).
1H δ (400 MHz) (acetone-d6) (ppm): 7.92 (d, 2H, J = 10.5 Hz); 7.82 (s, 3H); 7.61 (m, 1H); 7.38 (d, 2H, J = 9.5 Hz); 7.23–7.21 (m, 2H); 6.99 (m, 2H); 5.74–5.71 (m, 1H); 5.59–5.56 (m, 1H); 5.45–5.41 (m, 1H); 5.24 (m, 1H); 5.05–5.02 (m, 1H); 4.81 (s, 2H); 4.49 (dd; 1H; J = 2.9 Hz, J = 12.2 Hz); 4.32–4.14 (m, 2H); 3.81 (q, 9H, J = 7 Hz); 3.70–3.65 (m, 6H); 3.59 (m, 4H); 2.26 (d, 7H, J = 7.2 Hz); 2.07 (quintet, 15 H, J = 2.2 Hz); 1.36 (m, 13H, J = 7.1 Hz).
13C δ (125 MHz) (acetone-d6) (ppm): 170.1; 169.9; 165.2; 159.2; 158.0; 156.7; 156.0; 154.4; 150.0; 147.4; 136.4; 134.8; 132.4; 131.9; 130.6; 130.0; 129.9; 127.9; 116;6, 114.4; 113.8; 96.2; 75.4; 75.3; 75.2; 74.9; 73.2; 73.0; 70.1; 61.8; 46.3; 45.9; 44.4; 42.3; 37.0; 31.9; 27.0; 26.3; 26.2; 22.5; 20.5; 20.4; 20.1;19.9; 19.6; 18.5; 17.1; 13.6; 12.1.
HR-MS calc for C59H67N8O13 [M]+ 1095.48221 found 1095.48146.
Quantum yields
The quantum yield (Φ) of the FRR1 and FRR2 was calculated using fluorescein and rhodamine 6G as references. For calculation of quantum yield, three concentrations of the probe (in HEPES buffer), fluorescein (0.1 M NaOH), and rhodamine 6G (water) standards were prepared. Their fluorescence spectra were recorded at the same excitation of 460 and 530 nm. The integrated fluorescence intensities (excited at 460 and 530 nm) were plotted against the absorbance (at 460 and 530 nm) for both the standards and the probe. The quantum yield was calculated using the following equation: Φx = ΦS (D x/D S), where Φ is the quantum yield, D is the slope, and S and X represent the standard and the sample, respectively.
Photophysical studies
All fluorometric measurements were performed in 100 mM HEPES buffer, concentration of probes ranging from 5 to 10 μM. Both FRR1 and FRR2 were excited at 460 and 530 nm and emission intensities at 585 nm for FRR1 and 590 nm for FRR2 were measured.
Reduction and oxidation capacity of FRR1 and FRR2 were examined using sodium dithionite (0.5 M in water) and 3% H2O2.
The fluorescence properties of FRR1 and FRR2 at different pH values were investigated using 100 mM buffers. Performance of both the probes in the presence of biologically relevant metal ions (Na+, K+, Mg2+, Cu2+, Cu+, Zn2+, Ca2+, Mn2+) at 100 μM concentration in 100 mM HEPES buffer (pH 7.4). ROS were tested at a final concentration of 200 μM. Superoxide (O2−•) was added as solid KO2. Hydrogen peroxide (H2O2) and hypochlorite (OCl−) were delivered from 30% and 4% aqueous solutions, respectively. Hydroxyl radical (•OH) and tert-butoxy radical (•OtBu) were generated by reaction of 1 mM Fe2+ with 200 μM H2O2 or 200 μM tert-butyl hydroperoxide, respectively.
Electrochemistry
Electrochemical measurements were performed using a BAS 100B/W Electrochemical Analyzer. Cyclic voltammograms were collected at room temperature at a scan rate of 100 mV/s using glass carbon working electrode, a platinum auxiliary electrode, and a silver/silver chloride reference electrode. Compounds were dissolved in acetonitrile containing 0.1 M tetrabutylammonium bromide to a final concentration of 5 mM. Solutions were degassed with argon for 10 min before measurement.
High-performance liquid chromatography
Analytical HPLC traces of FRR1 and FRR2 were acquired on Waters Sunfire C18 column (2.1 × 1.5 mm, 5 μm particle size) using Waters Aliance 2965 pump and Waters 2996 Photodiode Array Detector. Data acquisition and processing were performed using the Empower 3 Workgroup FR2 software.
HPLC grade MeOH was purchased from Merck, and Milli-Q H2O was prepared using Merck Synergy UV-R Milli-Q water system with Millipak Express 20 filter. HPLC solvents were buffered with 0.1% trifluoroacetic acid (v/v).
The method used to obtain the HPLC traces is shown in Supplementary Table S1.
Cellular Experiments
Cell culture
All experiments involving cultured cells used the RAW 264.7 murine macrophage cells. Cells were maintained in exponential growth as monolayers at 37°C in 5% CO2 advanced Dulbecco's modified Eagle medium (DMEM) supplemented with 2.5 mM glutamine, 10% fetal calf serum (FCS), and antibiotics as per supplier's instructions.
Cytotoxicity
Cytotoxicity assays were performed using the standard MTT assay to determine their IC50 value. In a 96-well plate, ∼1 × 10⁴ RAW 264.7 cells in 100 μl complete medium (Adv. DMEM supplemented with FCS, glutamine and antibiotic-antimycotic) were seeded into each well and allowed to adhere overnight in an incubator. One and ten millimolars of stock solutions of FRR1 and FRR2 were prepared in dimethyl sulfoxide (DMSO). The stock solutions were diluted into the wells containing cells to final concentrations ranging from 0 to 160 μM. Control wells were treated with corresponding volumes of DMSO. Each treatment was performed in triplicates. After a 24 h incubation period, 20 μl of MTT solution (2.5 mg/ml in phosphate-buffered saline [PBS]) was added to each well and the cells were incubated for additional 4 h. The medium in the wells was then replaced with 150 μl of DMSO and the plates were shaken for 1 min. The absorbance of each well was recorded at 600 nm using a plate reader, wherein the intensity of absorbance correlates to cell viability. The IC50 value represents the minimum concentration of the probe necessary for 50% reduction in cell viability. Each MTT assay was performed three times.
Imaging experiments
RAW 264.7 cells were grown in glass bottom plates (MatTek Corporation), as described previously. For the control imaging experiments, cells were stained separately with DMSO stock solutions of FRR1 and FRR2 (20 μM, 15 min), MitoTracker Deep Red FM (100 nM, 15 min), and LysoTracker Deep Red FM (100 nM, 15 min) such that the final concentration of DMSO in cell media was <1%. After 15 min, the cells were washed thrice with PBS and maintained in DMEM (without phenol red) supplemented with 2.3 mM glutamine and 10% FCS for the duration of imaging. Confocal images were acquired using a Leica SP5 II confocal and multiphoton microscope and an UPLSAPO 100× oil-immersion objective lens. Excitation light of 488 and 633 nm was provided by the argon and HeNe lasers, respectively. For colocalization experiments with CellLight Mitochondria-GFP BacMam 2.0, DLD-1 cells were transfected with 10 particles per cell for 16 h followed by staining with FRR1 and FRR2 (20 μM, 15 min). LPS stimulation experiments were performed by staining adhered macrophages with FRR1 and FRR2 (20 μM, 15 min) followed by treatment with LPS (1 μg/ml) for indicated timepoints. Time-lapse experiments were performed by acquiring images every 30 s over a period of 25 min at an imaging speed of 400 Hz. Images were collected and processed using the Leica Application Suite Advanced Fluorescence lite Version: 2.8.0 build 7266 viewer software. Colocalization analyses were performed using Fiji-ImageJ-Coloc2 plugin.
LPS stimulation and flow cytometry
RAW 264.7 murine macrophages were treated with FRR1 and FRR2 (20 μM) followed by their stimulation with LPS (a final concentration of 1 μg/ml) for 0, 15, 30, 60, and 120 min. Cells were then washed with PBS and resuspended in FACS buffer (PBS +0.5% bovine serum albumin [BSA] +1 μM propidium iodide). Cells were immediately analyzed using the BD FACScan 4-color flow cytometer. Data were analyzed using the FlowJo software package (Treestar).
Animals, cell isolation, and flow cytometry
All animal studies were performed in accordance with animal ethical guidelines as approved by the Animal Ethics Committee at the University of Sydney. Timed matings were established, as described previously (3). Adult bone marrow single-cell suspensions were prepared by flushing the femora with 5 ml of PBS with a 22G needle and syringe, and spleen single-cell suspensions were prepared by passing the tissues through a 40-μm mesh with the plunger of a 5-ml syringe. Fetal blood was obtained by exsanguination of individual conceptuses, as described previously (19). Fetal liver was dissected and dispersed into a single-cell suspension, as described previously (24). Single-cell suspensions were then further filtered through 40-μm nylon mesh to remove clumps, centrifuged, and resuspended in 1 ml of FACS buffer (PBS +0.5% BSA). Cells were aliquoted and incubated with antibody (Biolegend) and either FRR1 or FRR2 (to a final concentration of 20 μM) for 15 min at room temperature. Cells were then washed with PBS and resuspended in FACS buffer containing propidium iodide (final concentration 1 μg/ml) for dead cell exclusion. Cells were immediately analyzed using the BD FACScan 4-color flow cytometer. Data were analyzed using the FlowJo software package (Treestar).
Statistical analysis
Data are expressed as mean ± standard deviation or mean ± standard error of mean, as indicated. Biological experiments were performed in triplicate, and statistical analysis was performed using a one-way analysis of variance (GraphPad Prism). p < 0.05 was considered to be significant.
Footnotes
Acknowledgments
We gratefully acknowledge the support of the University of Sydney for a World Scholars Scholarship and the John A. Lamberton Research Scholarship (A.K.), the Australian Research Council for a Discovery Early Career Researcher Award (E.J.N.), and the Ramaciotti Foundation for an Establishment Grant. We acknowledge Mr. Henry Williams, Mr. Kurt Brigden, and other members of the Laboratory for Blood Cell Development for assistance with these studies, and Associate Professor Paul Witting (Discipline of Pathology) for helpful discussion. We also acknowledge the support of the Bosch Institute Live Cell Analysis Facility and the facilities and the scientific and technical assistance of the Australian Microscopy and Microanalysis Research Facility at the Australian Centre for Microscopy and Microanalysis at the University of Sydney.
Author Disclosure Statement
No competing financial interests exist.
Abbreviations Used
References
Supplementary Material
Please find the following supplemental material available below.
For Open Access articles published under a Creative Commons License, all supplemental material carries the same license as the article it is associated with.
For non-Open Access articles published, all supplemental material carries a non-exclusive license, and permission requests for re-use of supplemental material or any part of supplemental material shall be sent directly to the copyright owner as specified in the copyright notice associated with the article.