
Abstract
Introduction
P
Anticancer effects elicited by polyphenols and correlation with their bioavailability remain unclear. Pterostilbene (Pter) (administered i.v.) decreases human melanoma and pancreatic cancer growth (50–70%, xenografts) in vivo (not in vitro) and weakens its antioxidant defense. This report demonstrates a novel systemic link between Pter-induced inhibition of pituitary adrenocorticotropin hormone production, lower levels of circulating glucocorticoids, and the downregulation of glucocorticoid receptor- and nuclear factor (erythroid-derived 2)-like 2 (Nrf2)-dependent cancer antioxidant defense system, thus facilitating identification of molecular targets to sensitize aggressive cancers to oncotherapy.
Different PFs have been shown to inhibit cancer growth in vivo (5, 41, 61). Nevertheless, it is unclear how potential underlying mechanisms can be correlated with bioavailable concentrations and biological half-life. In the present report, we have addressed this question using different human melanomas and pancreatic cancers, growing in mice as xenografts, and pterostilbene (trans-3,5-dimethoxy-4′-hydroxystilbene; Pter), a natural dimethoxylated analog of resveratrol, but with higher biological half-life (23). Our results indicate that Pter-induced melanoma or pancreatic cancer growth inhibition involves an indirect mechanism where physiological glucocorticoids play a key role.
Results
Effect of Pter on melanoma growth
Three different human melanoma cell lines [see Supplementary Table S1 for their genetic background; Supplementary Data are available online at
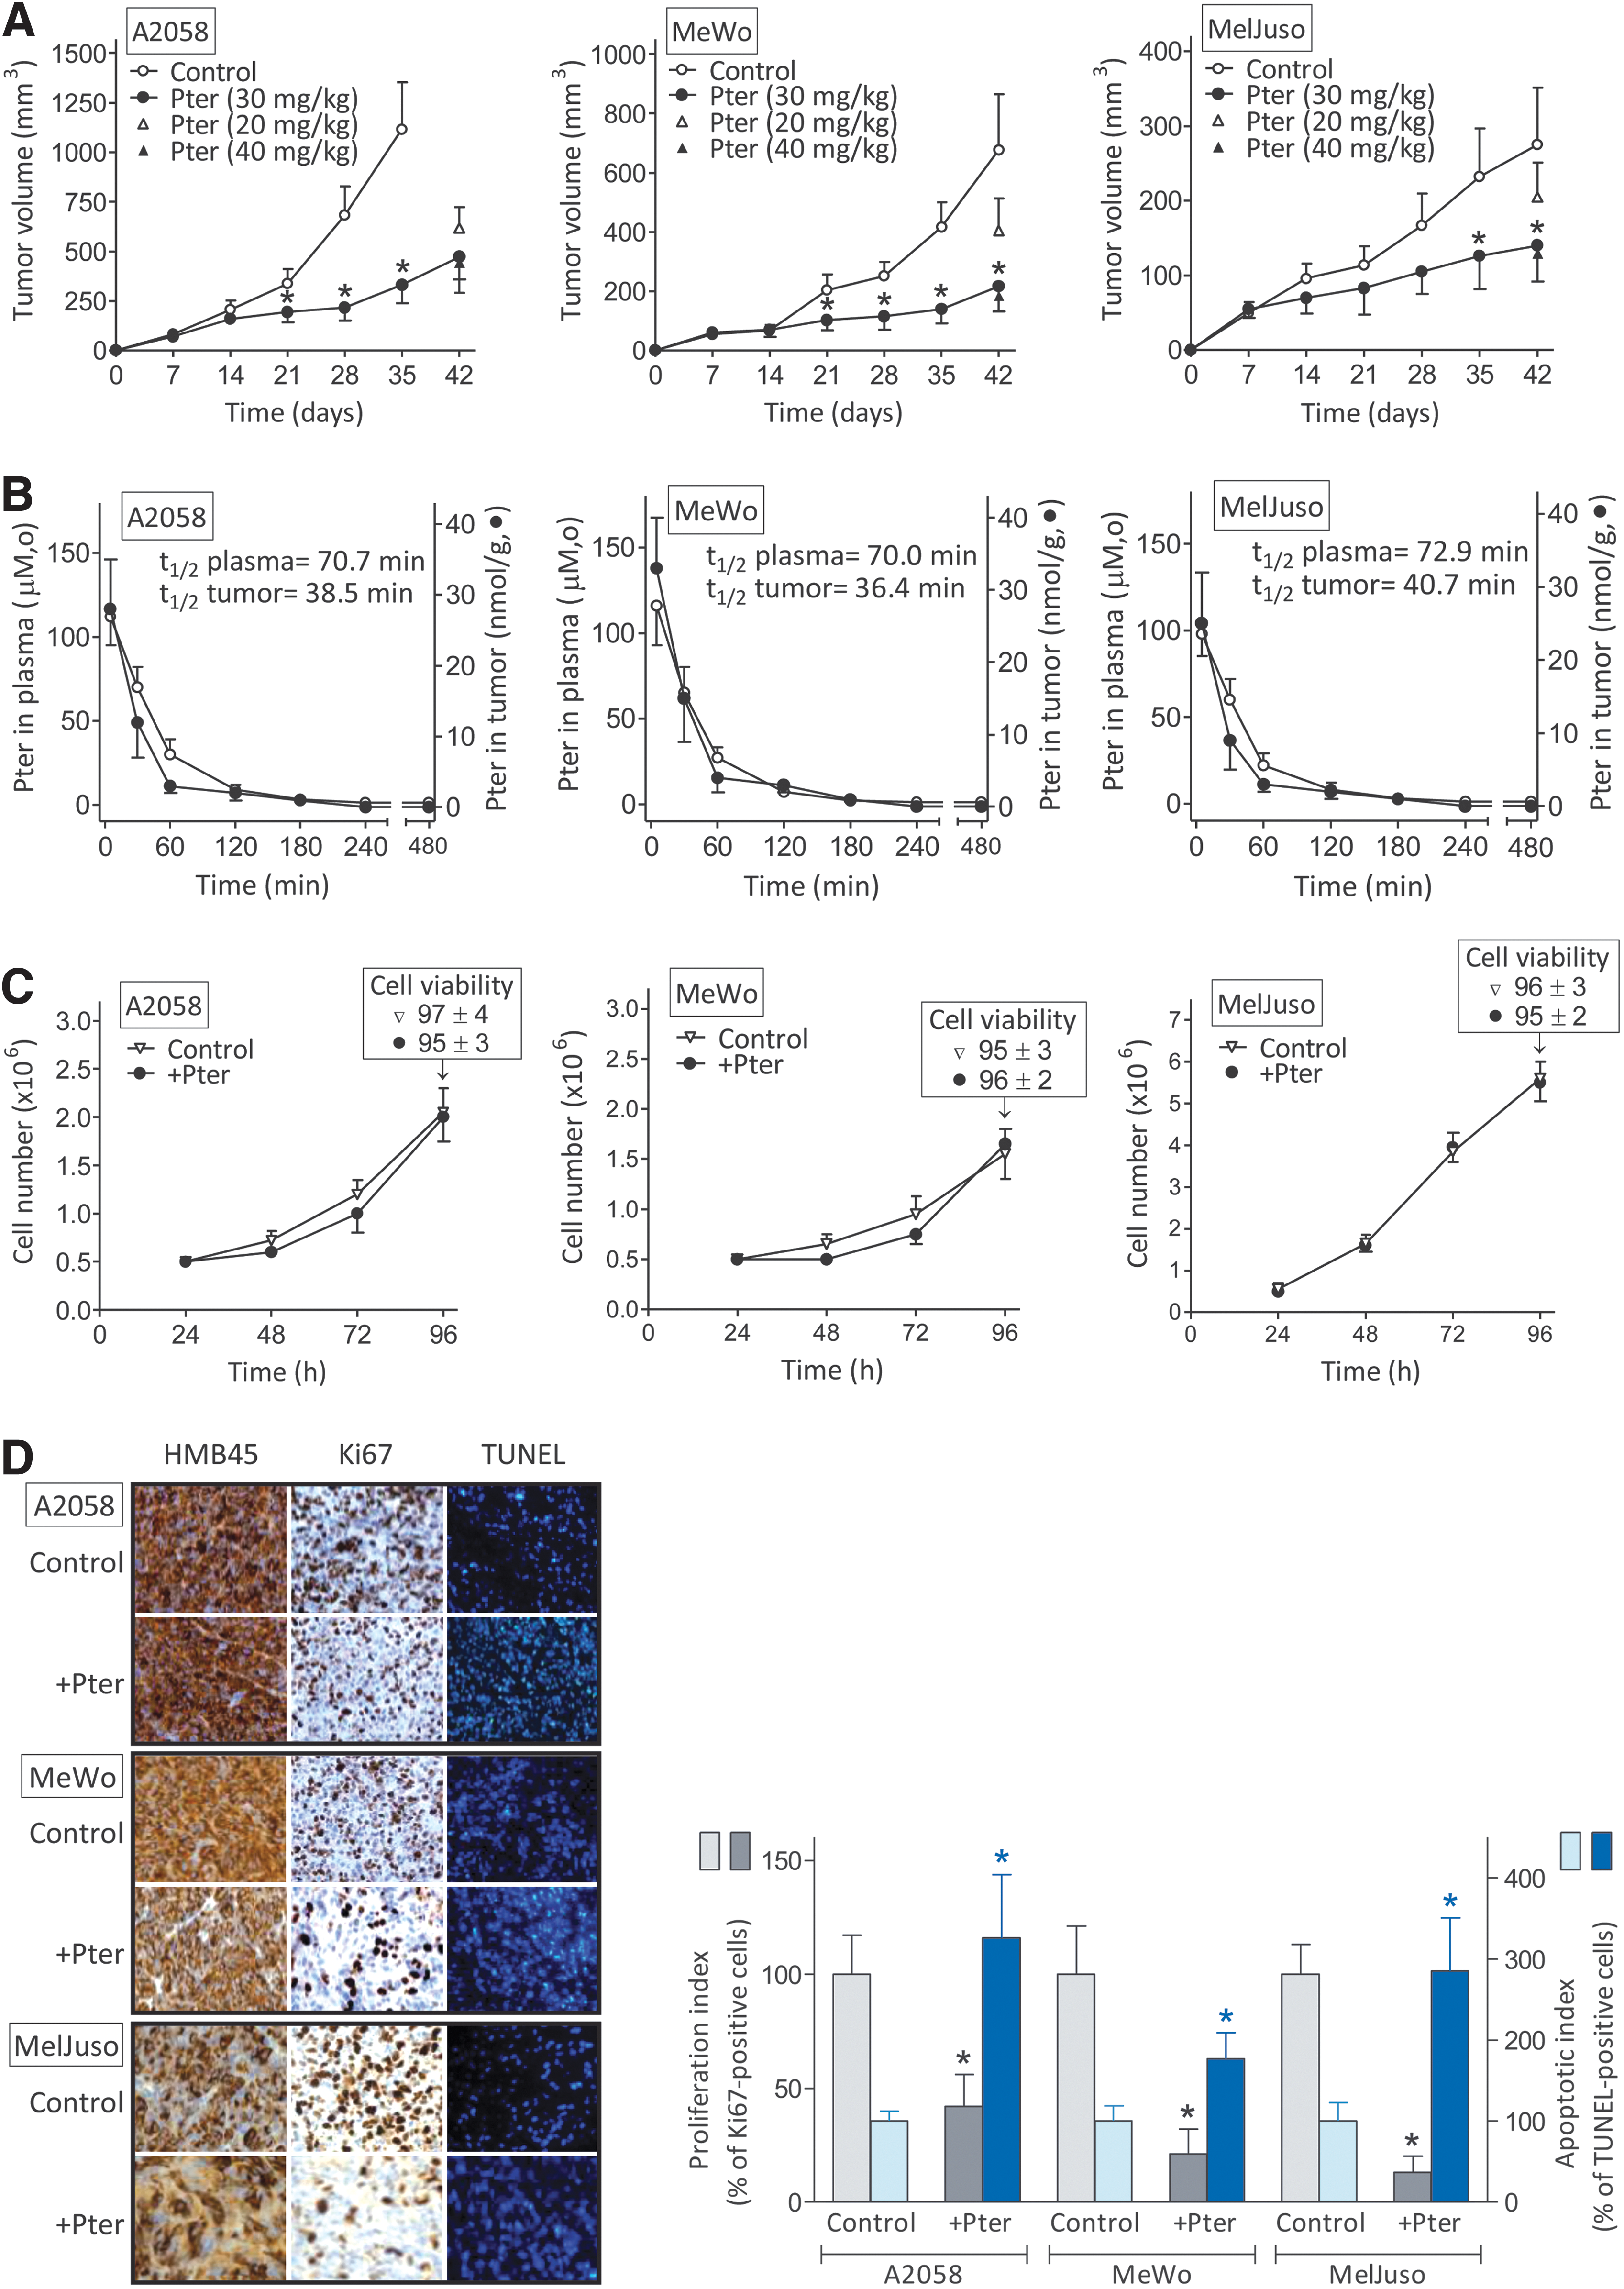
To correlate tumor growth inhibition and bioavailable Pter concentrations, we investigated Pter levels in plasma and in the tumor. As shown in Figure 1B, after i.v. administration of 30 mg Pter/kg, its highest concentration in plasma (112 ± 17, 116 ± 23, and 98 ± 13 μM in A2058, MeWo, and MelJuso melanoma-bearing mice, respectively, 5 min after administration) decreased rapidly to reach the lowest concentration (∼1 μM) at 240–480 min. After that last time point, Pter levels in plasma were undetectable (not shown). Pter levels in tumors were measured in parallel and also reached the highest concentration (28 ± 7, 33 ± 7, and 25 ± 7 μM in A2058, MeWo, and MelJuso melanoma-bearing mice, respectively) 5 min after administration, whereas the lowest concentration (∼1 μM) was measured at 180 min. From the data in Figure 1B, we calculated a half-life of Pter in circulating plasma of melanoma-bearing mice of 70–73 min (not significantly different from that calculated in nontumor-bearing mice where the same dose of Pter was administered i.v., not shown) and of 36–40 min in the melanoma tumors.
Measurement of the main Pter metabolites in plasma (Supplementary Fig. S1) confirmed previous observations (7), which showed that pterostilbene-4′-sulfate (Pter-S) is the main Pter-derived metabolite generated under in vivo conditions.
Based on the Pter levels measured in the tumors (Fig. 1B), our next step was to assay the effect of this stilbene on melanoma cell proliferation and viability under in vitro conditions. To mimic in vivo conditions, we incubated melanoma cells in the presence of Pter (15 μM) for a limited period (60 min) (this represents an approximate mean value of the Pter concentration measured within the tumor during the first hour after i.v. administration of 30 mg Pter/kg) (Fig. 1C). Pter was added to the incubation medium every 24 h and, as indicated, was present only for 60 min. After addition to the culture medium, Pter levels remained unchanged during the incubation time (not shown), which suggests that human melanoma cells do not metabolize Pter. As shown in Figure 1C, neither tumor cell proliferation nor viability was significantly affected by Pter (similar results were found using Pter-S and Pter-glucuronide [Pter-G, Supplementary Table S2]).
However, it is possible that even very low concentrations, as suggested for other PFs (54), are effective in vitro. Thus, we incubated the three melanoma cell lines used for 72 h in the presence of 1–5 μM Pter (approximate mean Pter levels found in plasma of tumor-bearing mice in the 120–180 min period after its i.v. administration, Fig. 1B). Since melanoma cells do not metabolize the stilbene, its levels remained constant through the incubation period. However, under in vitro conditions, melanoma cell growth and viability were not altered in the presence of the low concentrations of Pter (compared with controls—which were not significantly different from the data displayed in Fig. 1B) (not shown).
However, histopathological studies of tumors, obtained from melanoma-bearing mice treated with Pter (as in Fig. 1B), revealed that Pter administration causes a decrease in melanoma cell proliferation (Ki-67 staining) and an increase in apoptotic cell death (TUNEL) (Fig. 1D). Previously, we observed (22) that short-term exposure (60 min/day) to Pter (40 μM) and quercetin (Quer) (20 μM) (approximate mean values of the plasma concentrations measured within the first hour after i.v. administration of 20 mg of each polyphenol/kg) downregulated inducible nitric oxide synthase (iNOS) in murine B16-F10 melanoma cells and upregulated endothelial nitric oxide synthase (eNOS) in the vascular endothelium. Pter and Quer induced an NO shortage-dependent decrease in CREB phosphorylation, a positive regulator of bcl-2 expression, in the B16-F10 cells, thereby facilitating endothelium-induced tumor cytotoxicity (22).
As shown in Supplementary Figure S2, in our present experimental conditions, Pter treatment downregulated iNOS expression and activity in the melanoma cells growing in vivo (no significant effect compared with controls was observed on eNOS in isolated endothelial cells). Therefore, it is plausible that the NO shortage-dependent mechanism indicated above also contributes to the increased rate of apoptotic death (Fig. 1D).
Our results suggest that Pter-induced inhibition of melanoma growth, under in vivo conditions, must involve other factor(s) and may not be the consequence of a direct antitumor effect elicited by Pter. In this regard, some primary observations suggested a possible relationship between PFs and the hypothalamic–pituitary–adrenal (HPA)-dependent stress response (1, 55, 59, 73).
Effect of Pter on stress hormones in melanoma-bearing mice
Stress-related responses in rodents under stressful conditions can be evaluated by measuring plasma levels of corticosterone and noradrenaline (NORA) (main circulating glucocorticoid and catecholamine, respectively) (67).
As shown in Figure 2A, corticosterone levels in plasma of control nontumor-bearing mice peak at 12 h, just before the beginning of the dark active phase in mice. However, in melanoma-bearing mice, corticosterone levels were higher than in controls and remained rather constant through the 24-h period (Fig. 2A). Treatment with Pter (30 mg/kg every 48 h, as in Fig. 1A) induced a decrease of corticosterone in plasma of melanoma-bearing mice to practically control values (Fig. 2A). Adrenocorticotropin hormone (ACTH) levels also followed a circadian pattern in control nontumor-bearing mice (ACTH was higher before corticosterone levels peaked, and lower during the dark active phase) (Fig. 2B). ACTH levels were also higher in melanoma-bearing mice than in controls and were also decreased by Pter treatment (Fig. 2B) [Pter can cross the blood–brain barrier (7, 23)].
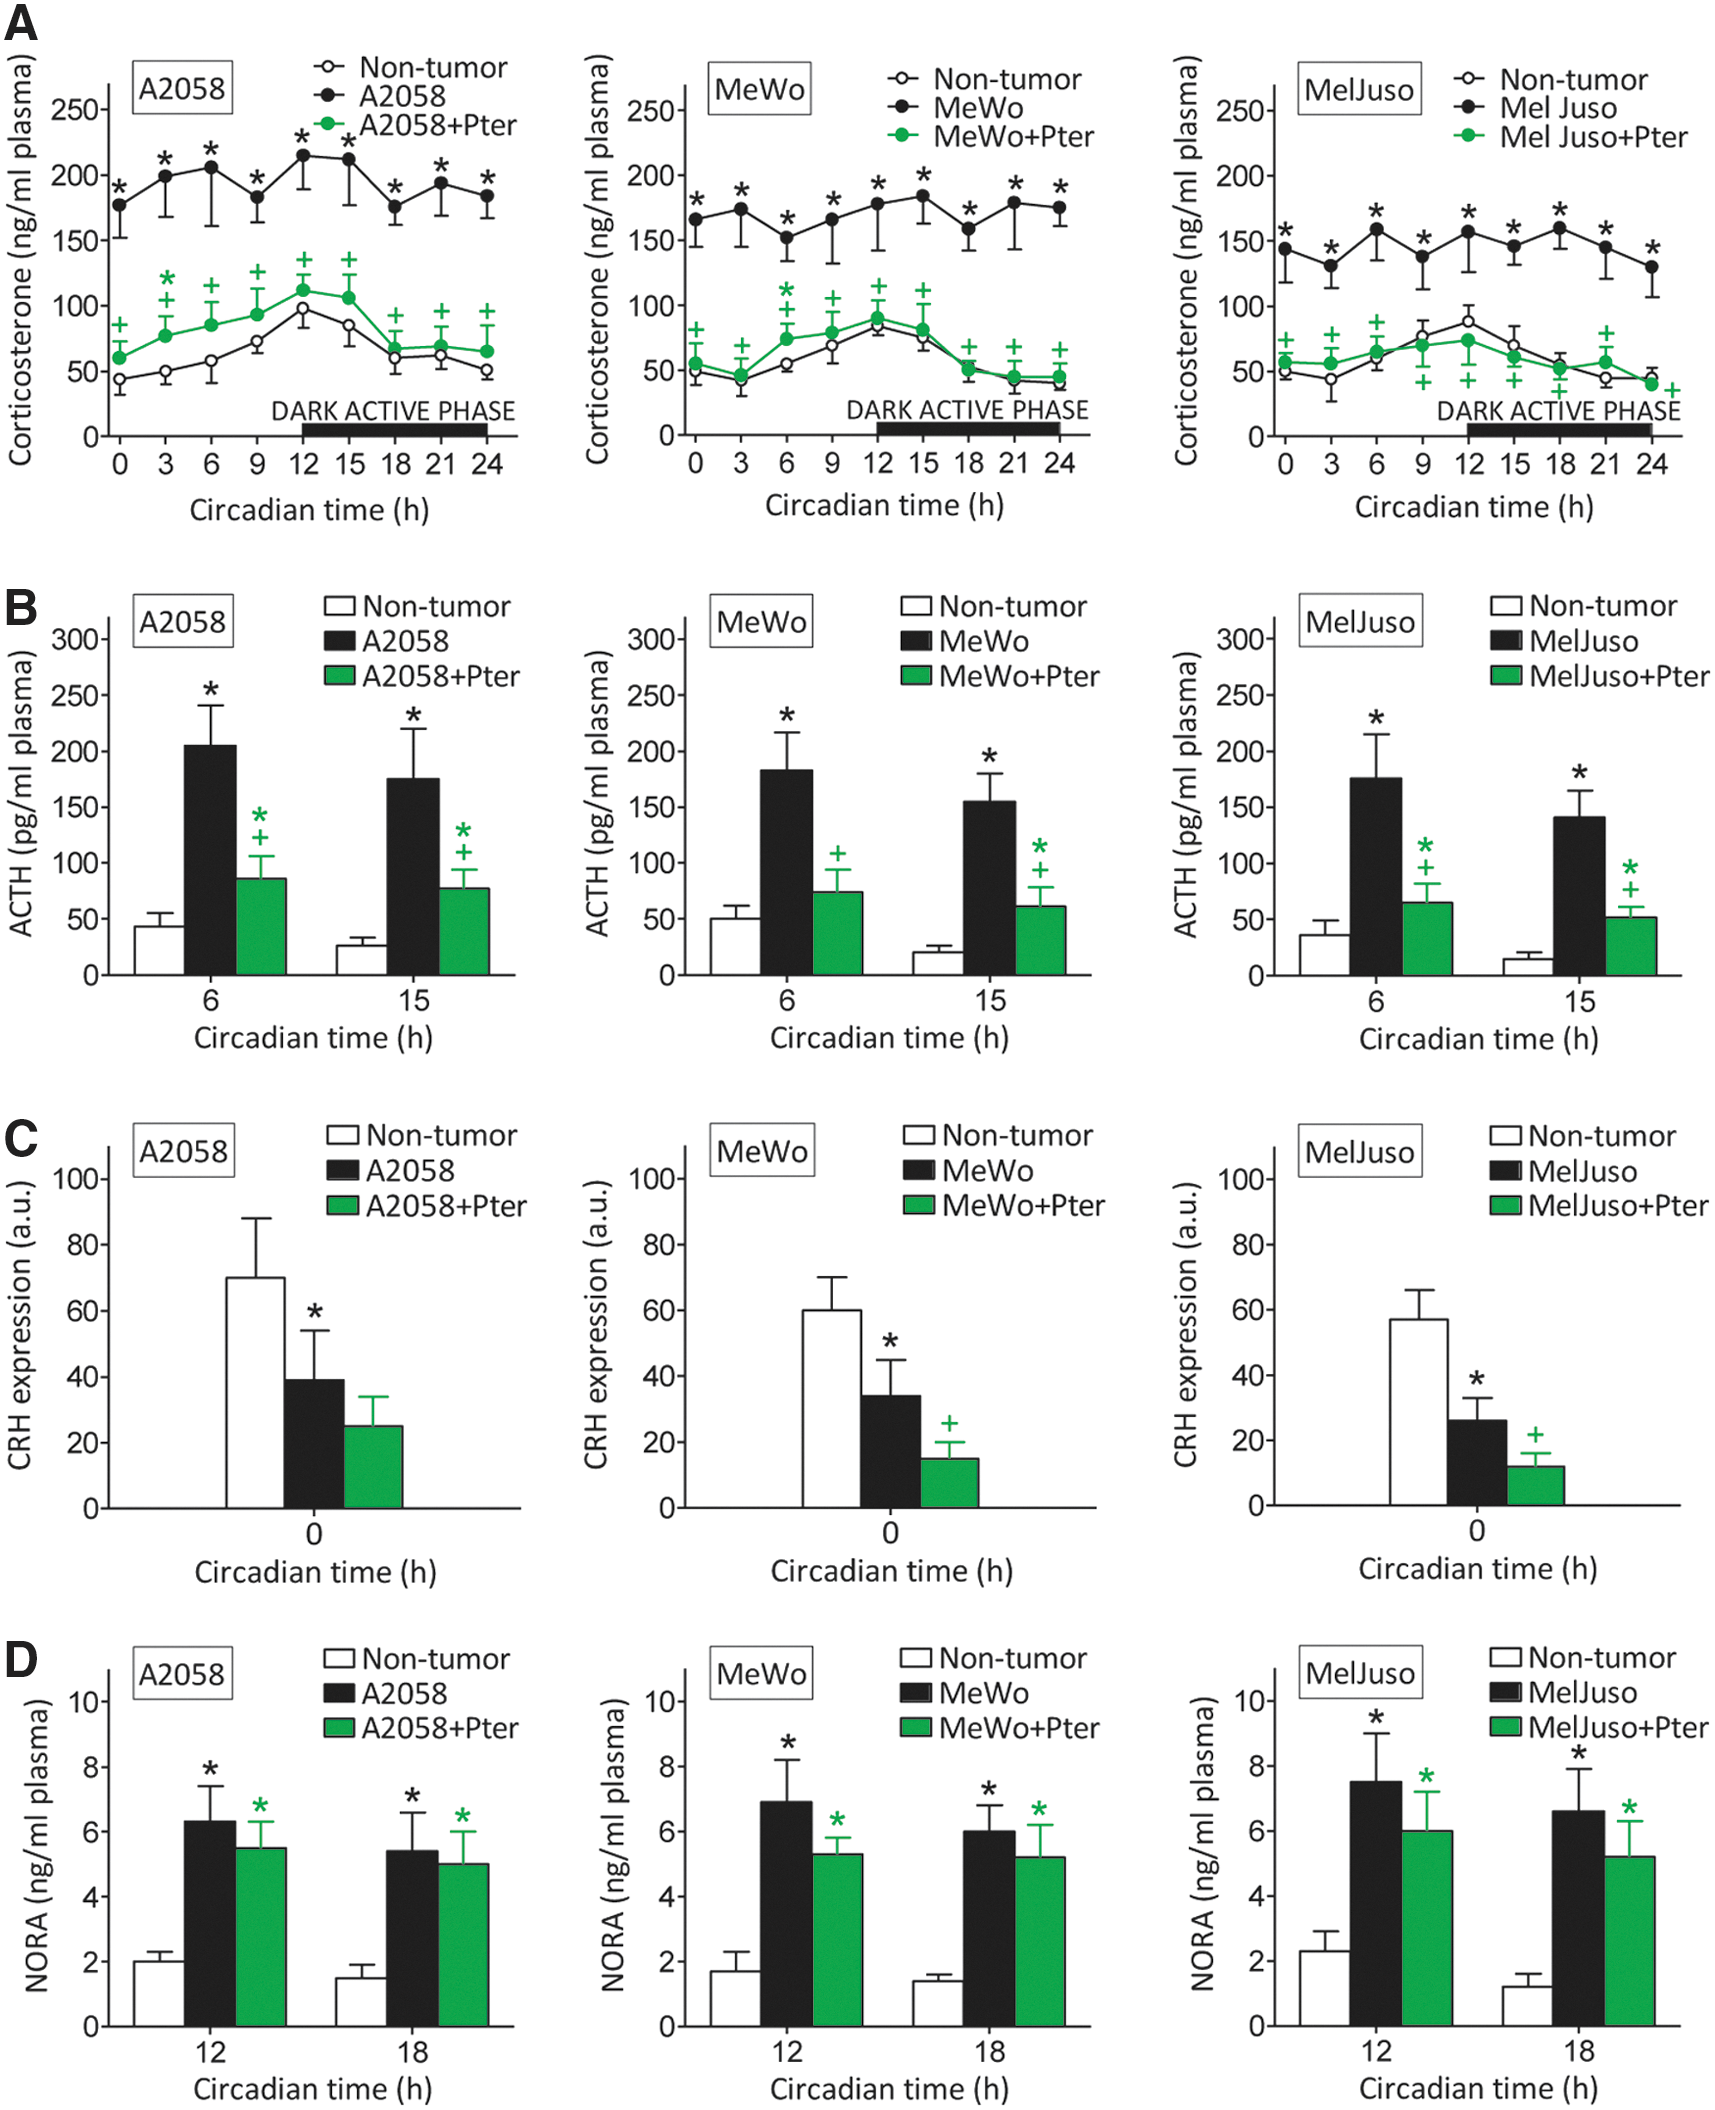
Therefore, changes in plasma corticosterone levels follow those of ACTH, which stimulates synthesis and release of glucocorticoids from the adrenal glands (21). However, corticotropin-releasing hormone (CRH) mRNA expression in the hypothalamic paraventricular nucleus (PVN) was lower in melanoma-bearing mice (Fig. 2C) [in agreement with a similar finding in mice bearing highly metastatic B16-F10 melanoma (67)].
This apparent biological paradox (a decrease in CRH associated with an increase in ACTH) can be explained, for example, by direct activation of pituitary ACTH production by melanoma-released interleukin (IL)-6 (67). Pter treatment caused a further decrease in CRH expression, which was statistically significant in MeWo- and MelJuso-bearing mice (Fig. 2C). A fact in agreement with recent reports showing that hesperidin (a polyphenolic flavanone glycoside) or Quer (a polyphenolic flavonol) also decrease mRNA CRH expression in rat models of chronic (12) or acute stress (36), respectively. Hence, since CRH expression is lower in melanoma-bearing mice than in nontumor-bearing mice, whereas ACTH increases, the Pter-induced decrease in corticosterone generation appears probably due to Pter-induced inhibition of pituitary ACTH production.
NORA in plasma was also higher in melanoma-bearing mice than in control nontumor-bearing mice (Fig. 2D). However, NORA levels were not significantly different when melanoma-bearing mice, treated or not treated with Pter, were compared (Fig. 2D).
Pter inhibits ACTH production in AtT-20 cells
To assay if Pter affects ACTH production, we used, as a model AtT-20, an ACTH-secreting cell line cloned from cultures established after alternate passage of mouse pituitary tumor cells as tumors in animals and in cell culture (
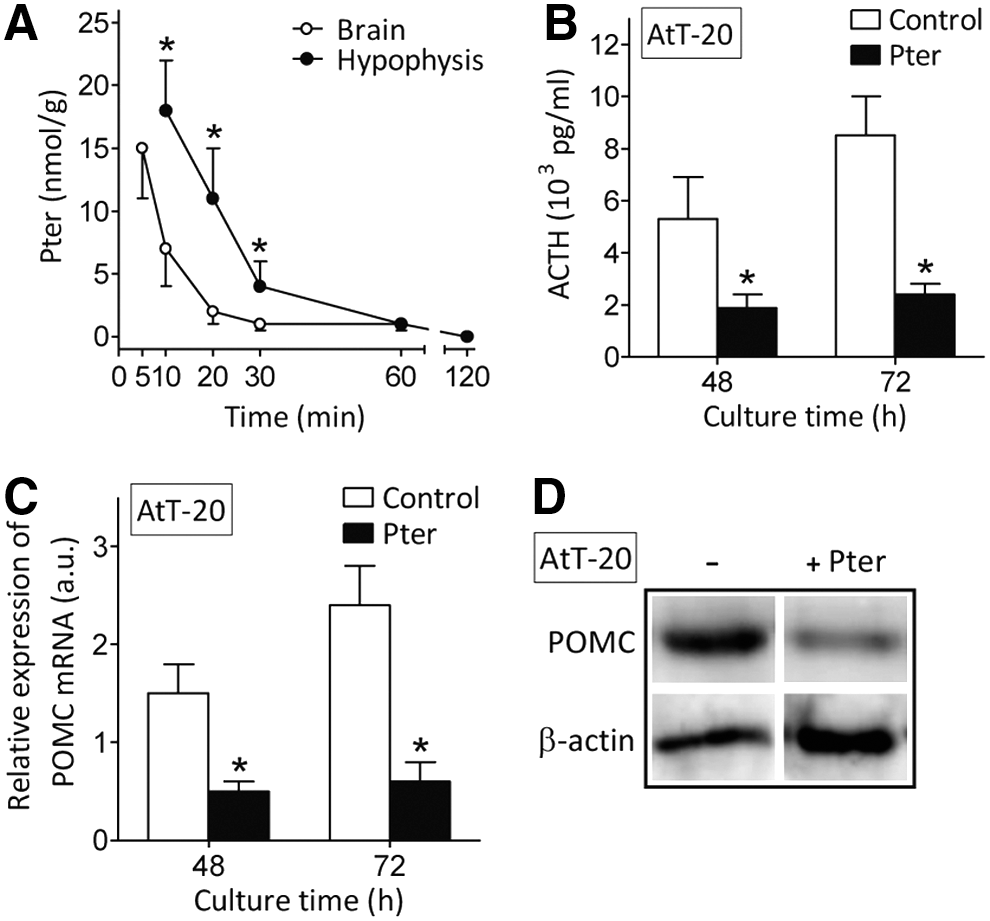
The effect of Pter on ACTH production was measured in cultured AtT-20 cells. As shown in Figure 3B, Pter (15 μM, an ∼mean value of the Pter levels measured in the hypophysis 10–30 min after i.v. administration of 30 mg/kg, see the caption) decreases ACTH production.
Proopiomelanocortin (POMC) is a common precursor of melanocortin-related peptides in the pituitary. ACTH is produced in pituitary corticotrophs when POMC is cleaved to β-lipotropic hormone and ACTH by the prohormone, convertase-1/3 processing enzyme (26). Pter also decreased POMC expression and levels in AtT-20 cultured cells (Fig. 3C, D), thus further indicating that Pter suppresses ACTH synthesis and secretion in corticotroph cells, as suggested by the data displayed in Figure 2. None of the main Pter conjugates (Pter-S and Pter-G; incubated as in Supplementary Table S2) decreased ACTH production in AtT-20 cells (not shown), thus indicating that the natural structure, and not its in vivo generated metabolites, is responsible for inhibiting ACTH production.
Exogenous administration of corticosterone antagonizes the effect of Pter on melanoma growth
Human melanoma cells express high-affinity glucocorticoid receptors (GRs) (16). As shown in Table 1, treatment with Pter reduced circulating corticosterone levels and melanoma growth in all models assayed, but without affecting the number of GRs. However, Pter was unable to significantly affect in vivo melanoma growth if mice received at the same time a constant i.v. infusion of exogenous corticosterone (which resets its pathophysiological levels in melanoma-bearing mice) (Table 1). Therefore, since Pter does not directly affect melanoma growth under in vitro conditions (Fig. 1C), our results suggest that Pter-induced inhibition of melanoma growth indirectly requires glucocorticoids and, consequently, GR-derived intracellular signaling.
Melanoma cells stably expressing the red fluorescence protein (RFP) were inoculated, as in Figure 1, and allowed to grow for 35 days. Treatment with Pter (as in Fig. 1) and/or costicosterone (using ALZET minipumps [ALZET Osmotic Pumps] and jugular vein catheterism [following manufacturer's instructions]; the mean rate of infusion was 0.3 μg of CRC/h) started 1 week after tumor inoculation. Treatment of tumor-bearing mice with vehicles (DMSO-ethanol for Pter as indicated under the Materials and Methods section; or polyethylene glycol 400 for CRC) did not significantly affect the rate of melanoma growth compared with controls (not shown). The number of GRs (expressed as binding sites/cell) was not significantly different when 72 h cultured A2058-RFP, MeWo-RFP, or MelJuso-RFP cells were compared with their wild-type A2058, MeWo, or MelJuso cell counterparts (not shown). Data for GR number, tumor volume (Tumor vol.), and CRC (blood samples were obtained at 12 h circadian time, Fig. 2) displayed in this table were obtained 35 days after tumor inoculation. All tumors had 50–70 mm3 of volume on day 7 after inoculation. GR number on day 7 was not significantly different from GR number on day 35 (not shown). Data are mean values ± SD of six to seven different animals.
Significantly different p < 0.01, comparing all groups versus controls (untreated). Data obtained in melanoma-bearing mice treated with vehicle were not significantly different from those calculated for the untreated group (not shown).
CRC, corticosterone; GR, glucocorticoid receptor; Pter, pterostilbene.
Effect of Pter treatment on the Nrf2-dependent antioxidant system in growing melanomas
However, Pter treatment decreases circulating corticosterone (Fig. 2A) without affecting the number of GRs in melanoma cells (Table 1). Therefore, it is uncertain whether Pter treatment may also affect the Nrf2 [nuclear factor (erythroid-derived 2)-like 2]-dependent battery of antioxidant and xenobiotic-metabolizing enzymes. Compared with cultured HEMa-LP human melanocytes, expression of practically all checked Nrf2-dependent enzymes, excepting a decrease in catalase (CAT), increases in A2058, MeWo, and MelJuso melanoma cells growing in vivo (Fig. 4A), thus suggesting that cancer cells, compared with their normal counterparts, tend to reinforce their antioxidant defenses. However, Pter treatment causes a decrease in the expression of all Nrf2-dependent enzymes tested, with some exceptions, that is, γ-glutamyl transpeptidase 1 (GGT1) and NADPH oxidase 1 (NOX1) (Fig. 4B).
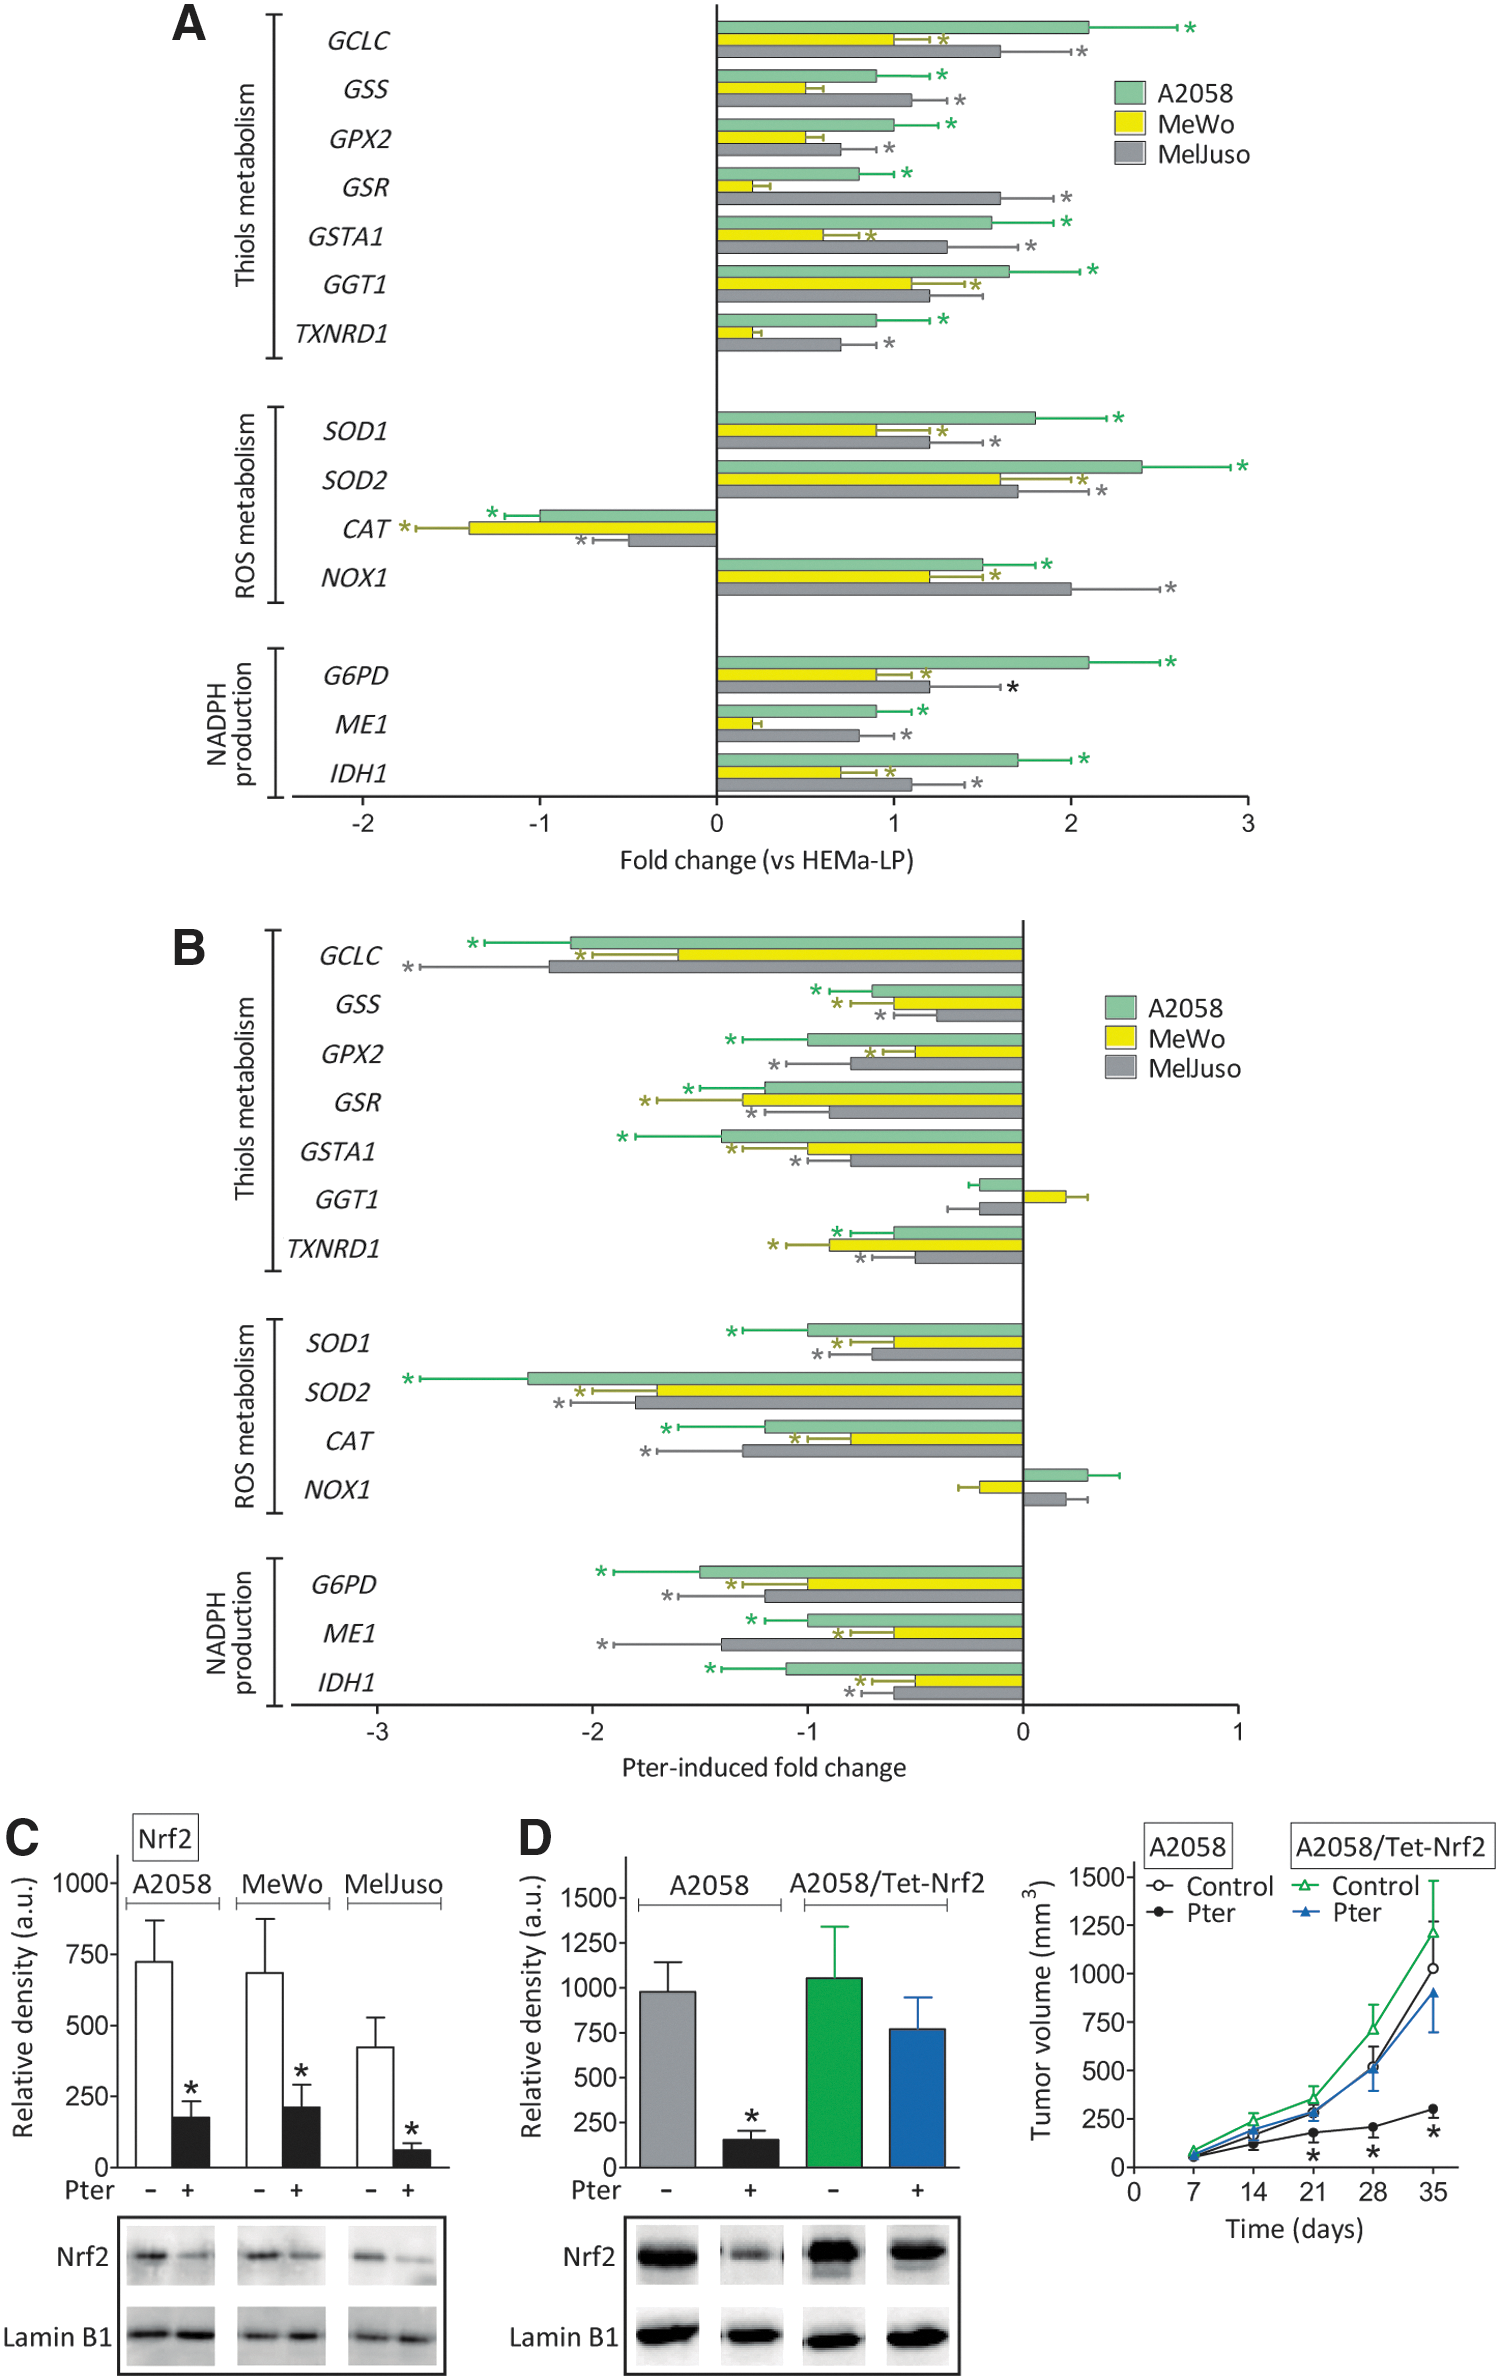
The Pter-induced decrease in melanoma antioxidant defense was confirmed by measuring many different GSH (glutathione, γ-L-glutamyl-L-cysteinyl-glycine)-, reactive oxygen species (ROS)-, and cellular redox state-related enzyme activities and metabolites (Table 2 and Supplementary Fig. S3). Pter induction also associated with an increase of isoprostanes (a molecular marker of oxidative stress) in the cancer cells (Supplementary Fig. S4). As shown in Figure 4C, and compared with control melanoma-bearing mice, these effects associate with a decrease in nuclear Nfr2 in melanoma cells from in vivo Pter-treated mice. As shown in Supplementary Figure S5, and compared with controls, a decrease in nuclear Nrf2 associated with an increase in Keap1 [a negative regulator of Nrf2 signaling (63)] in tumors from Pter-treated mice, a fact that may reflect Pter-induced upregulation of Keap1 expression and/or a decrease in its (proteasome-independent) degradation. Moreover, melanoma cells engineered to overexpress Nrf2 were able to grow in vivo as controls, despite treatment with Pter (Fig. 4D).
Tumor-bearing mice were treated as in Figure 1A. All parameters (see under the Materials and Methods section) were measured in melanoma cells isolated from tumors 35 days after inoculation. Data are mean values ± SD for seven to eight different tumors per parameter and experimental condition.
Significantly different p < 0.05,
CAT, catalase; GCL, γ-glutamylcysteine ligase; GGT, γ-glutamyltranspeptidase; GSR, glutathione reductase; GSS, GSH synthase; NOX, NADPH oxidase; GPX, glutathione peroxidase; Nrf2, nuclear factor (erythroid-derived 2)-like 2; ROS, reactive oxygen species; SOD, superoxide dismutase.
These results are relevant for three main reasons: (i) Pter treatment decreases the Nrf2-dependent cancer cell antioxidant defense; (ii) as previously shown by, for example, Homma et al. (33) in human lung cancer, Nrf2 enhances cell proliferation and resistance to anticancer drugs; and (iii) Pter treatment may facilitate identification of potential key targets for melanoma therapy. This could be the case, for example, for GSH [the most prevalent nonprotein thiol in mammalian cells (20)] or superoxide dismutase (SOD) activities (active O2 • − production and low SOD activity in cancer cells could render malignant cells highly dependent on SOD for survival) (34) (Fig. 4B and Table 2).
Melanoma cells from Pter-treated mice are highly sensitive to combined chemotherapy and Nrf2-related target therapy
GSH depletion only appears therapeutically effective when very low levels of this tripeptide can be achieved within the cancer cells (19). Experimentally, GSH can be rapidly depleted using diethylmaleate (DEM, an α,β-unsaturated carbonyl compound) (19). On the other hand, downregulation of SOD activities can be achieved using (i) the known SOD inhibitor, diethyldithiocarbamate, but it has antagonistic effects on apoptosis by triggering both cytochrome c release and caspase inhibition and has not been tried in vivo (17); or (ii) using antisense oligonucleotides.
We used the A2058 cell line bearing BRAFV600E [the most common mutation in melanoma (62)] under in vitro controlled conditions. As shown in Figure 5A, cultured A2058 cells, isolated from Pter-treated mice (30 mg/kg every 48 h for a period of 5 weeks, as in Fig. 1A), were completely eliminated by the combination of DEM-induced GSH depletion and paclitaxel protein-bound particles (PAC.PBP, 100 ng/ml [approximate mean values in human plasma obtained after administration of the standard i.v. dose of 260 mg/m2 regularly used in, for example, patients bearing a metastatic breast cancer] [
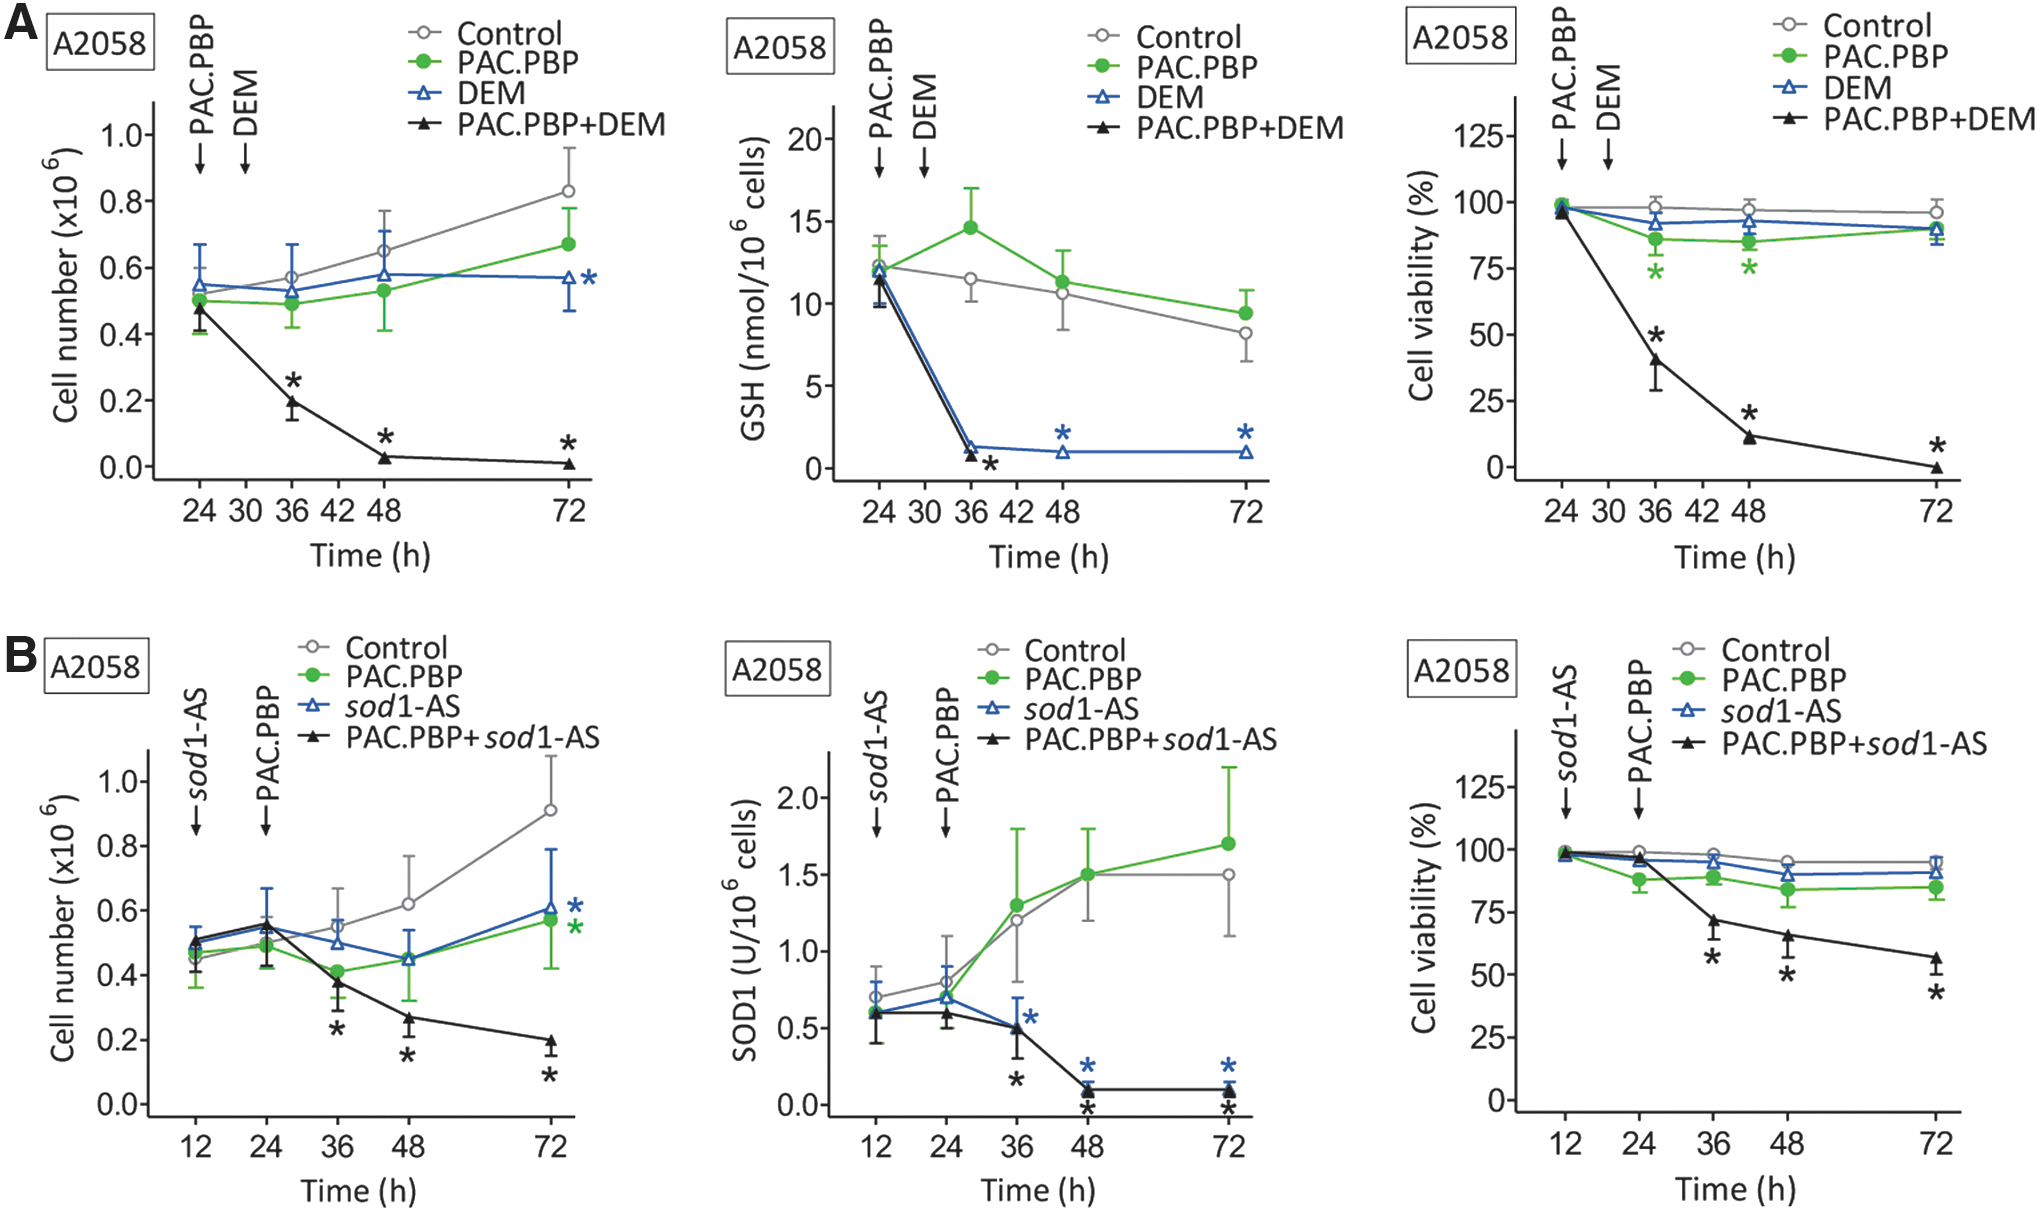
As shown in Figure 5B, the combination of antisense oligonucleotides anti-sod1 (sod1-AS) (which targets the main intracellular SOD activity, Table 2) and PAC.PBP was less effective. Incubation of A2058 cells, isolated from control (non-Pter-treated mice), with DEM and PAC.PBP or sod1-AS and PAC.PBP (as in Fig. 5A, B) only decreased the melanoma cell number to 51% ± 12% or 73% ± 7% of control values, respectively (n = 5 in both cases, p < 0.01).
This proof-of-concept assay suggests the pretreatment with Pter and GSH depletion as a potential chemosensitizing strategy against malignant melanoma.
Glucocorticoid- and Nrf2-dependent inhibition of human pancreatic growth by Pter
Is the action of Pter restricted to melanoma cells? To begin preliminary studies regarding this question, we selected pancreatic cancer, one of the most aggressive and lethal cancers, with 1- and 5-year relative survival rates for all stages combined of 25% and 6%, respectively (
Evaluation of therapy-induced systemic toxicity
Does i.v. administration of Pter show any toxicity that could preclude its use? Standard hematology, clinical chemistry, and urinalysis were evaluated in nontumor-bearing mice and in A2058- and AsPC-1-bearing mice treated with vehicle or Pter to evaluate potential side effects of the treatment regimen. As shown in the Supplementary Table S6, tumor growth-related side effects included anemia, neutropenia, low natural killer cell count, and an increase of several tissue damage-related enzyme activities in plasma, including aspartate aminotransferase, alanine aminotransferase, GGT, alkaline phosphatase, and lactate dehydrogenase (all commonly observed in cancer patients). Most of these deleterious effects were found partially or totally prevented in Pter-treated mice (Supplementary Table S6). Moreover, during the treatment period, none of the tumor-bearing mice died (either treated with vehicle or Pter).
Rates of glucose utilization by isolated hepatocytes and of glutamine and glucose by isolated lymphocytes were similar in tumor-bearing mice treated with Pter and in control nontumor-bearing mice (Supplementary Table S6), which suggest normal rates of utilization of main energy-supplying substrates. Moreover, GSH levels, cell volume, and rates of glucose and glutamine utilization were not significantly different when isolated hepatocytes or lymphocytes from Pter-treated tumor-bearing mice and control nontumor-bearing mice were compared (Supplementary Table S6), further indicating that these normal cells appear to preserve their physiological status. Moreover, when isolated hepatocytes from Pter-treated tumor-bearing mice and control nontumor-bearing mice were cultured, their rates of growth were also similar (not shown). The decrease of GSH content in hepatocytes and CD2+ lymphocytes isolated from tumor-bearing mice (compared with nontumor-bearing mice) is a known tumor growth-derived effect (20) (Supplementary Table S6). These results clearly suggest that i.v. administration of Pter, per se, causes no significant in vivo toxicity.
Discussion
In vivo administration of different PFs inhibits growth of several cancer types (5, 43, 58). Based on the assumption that their antitumor effects should involve a direct interaction with the cancer cells, most mechanistic studies have ignored the uncomfortable limitation associated with their low bioavailability (which imply time-limited and very low intratumoral concentrations) (5). The present results show that under in vivo conditions, the main anticancer effect elicited by Pter is indirect and depends on stress-related neuroendocrine signaling mechanisms.
Moreover, as shown by the additional set of experiments performed using two other PFs, curcumin (Curc) and (−)-epigallocatechin gallate (EGCG), this mechanism is not restricted to the use of Pter (see the Supplementary Results section, including Supplementary Figs. S7 and S8 and Supplementary Table S7).
Hypothetically, Pter could promote microenvironment (tissue specific?)-related and/or systemic antitumor mechanisms. Regarding the second option, it has been reported that chronic Curc administration (5 or 10 mg/kg, p.o.) reverses some effects linked to chronic stress such as an abnormal adrenal gland weight-to-body weight ratio and increased thickness of the adrenal cortex, as well as elevated serum corticosterone levels and reduced GR mRNA expression (73). Another report showed that EGCG can attenuate acute stress responses through the GABAergic system in the brain (1). Moreover, dietary Quer attenuates the HPA axis activation by suppression of the CRH mRNA expression (36). These primary observations are examples of particular interest since stress has been suggested as a promoter of tumor growth and angiogenesis in different in vivo models (55, 59). Thus, we decided to explore first possible links between Pter administration and the HPA-dependent stress response in different tumor-bearing mice.
Up to now, it has been assumed that whatever occurs under in vitro conditions can be reproduced in the whole organism by the oral administration of sufficiently large doses. As a recent example, it has been argued that sulfate metabolites can provide an intracellular pool for resveratrol generation and induce autophagy with senescence in human colon adenocarcinoma cells (54). However, the concentrations used in these in vitro experiments with colonic cells (e.g., 50–75 μM of the resveratrol monosulfate mixture incubated for days, hence without taking into account the time limitation associated with the actual bioavailability) were those extrapolated from peak plasma levels in healthy human volunteers receiving 2.5–5.0 g of resveratrol daily for 29 days. It was concluded that conjugates may act as a reservoir of the natural structure and that at doses considered (not proven) to be safe in humans, resveratrol generated via this route may be of greater importance than the unmetabolized form.
Nevertheless, a phase II clinical trial (
Recent studies have tested, both in vitro and in vivo, the antitumor effect of Pter. However, the use in vitro of unattainable in vivo concentrations and/or long-term exposure (24 h or more) seriously questions the relative importance of the proposed mechanisms, for example, via metastases-associated protein 1 in prostate cancer (41), estrogen receptor-α36 (53), or the PI3K/Akt and MAPK signaling pathways in colon cancer (14). We observed that 20 μM Pter (which would be in the upper level of an in vivo achievable intratumoral level, Fig. 1B), incubated for 24 h under in vitro conditions, only decreased tumor cell viability by ∼30% in human A375 melanoma, 40% in A549 human lung cancer, 10% in HT-29 human colon cancer, and 25% in human breast cancer (46). However, no significant decrease in cell viability was observed if the incubation time was <6 h, thus questioning mechanisms claimed to explain the in vivo induced tumor growth inhibition elicited by Pter (or other related molecules), at least under conditions where Pter needs the blood circulation to reach the growing tumor.
Our group has pointed out the importance of stress-related signals in metastatic melanoma growth (51, 67). Glucocorticoids in particular are used at high doses in cancer therapy, in conjunction with other treatments, because they have proapoptotic properties in different cancer cells (60). Nevertheless, at the pathophysiological levels measured in plasma of tumor-bearing models, glucocorticoids show tumor-promoting activities (51, 70). For instance, results in animal models of human breast cancer suggest that glucocorticoids inhibit tumor cell apoptosis (70). Moreover, glucocorticoids may induce a yet undefined resistant phenotype, thereby facilitating fast growth and metastasis of different solid tumors (60). To explain this paradox, recently, we showed that GR knockdown decreases the antioxidant protection (i.e., Nrf2- and p53-dependent downregulation of γ-glutamylcysteine ligase [GCL] and GSH, SOD1 and 2, CAT, glutathione peroxidase [GPX], and glutathione reductase [GSR]) of highly metastatic B16-F10 melanoma cells, thus causing a drastic decrease (90%) in their survival upon interaction with endothelial cells in vitro and in vivo (51).
As shown here, Pter, by inhibiting ACTH production (Fig. 3B and Supplementary Table S4), caused a decrease in circulating corticosterone (Fig. 2A, Table 1 and Supplementary Table S4) and, thereby, downregulated the GR- and Nrf2-dependent antioxidant defense system in growing melanomas (Table 2) and pancreatic cancer (Supplementary Table S5). Exogenous administration of corticosterone (Table 1) or genetic manipulation to induced Nrf2 overexpression (Fig. 4D) in melanoma cells prevented these antitumor effects. Moreover, studies of expression/levels/activities of different Nrf-2-dependent molecules in melanoma and pancreatic cancer cells from Pter-treated mice (Fig. 4B, Table 2 and Supplementary Table S5) suggested potential therapeutic targets.
Since the mechanisms described in the present work have been studied in immunodeficient mice, we also explored if the Pter-induced effect on the antioxidant defenses of cancer cells could be also influenced by our immune system. As shown in the supplementary set of experiments (see the Supplementary Results section, including Supplementary Fig. S9 and Supplementary Table S8), the main findings in human melanomas can be also observed in immunocompetent mice bearing B16-F1 melanoma cells.
Mechanistically, Sirtuins (Sirt), enzymes with nicotinamide adenine dinucleotide (NAD)+-dependent deacetylase or mono-[ADP-ribosyl]transferase activity, particularly Sirt1 and Sirt2, play diverse parts in cancer by affecting the response to genomic instability and stress, regulating cancer-associated metabolism and ROS production, and modifying the tumor microenvironment (13, 71). Therefore, a Pter-induced reduction of ROS (Table 2) could be mediated through Sirt. Moreover, acetylation–deacetylation of Nrf2 regulates its transcriptional activity and nucleocytoplasmic localization, and it has been argued that Sirt1 may decrease acetylation of Nrf2 as well as Nrf2-dependent gene transcription (37). Thus, we measured Sirt1 and Sirt2 levels (both found in the nucleus and cytoplasm) using Western blot analysis and monoclonal antibodies. However, no significant differences were found when A2058 and AsPC-1 tumors from control and Pter-treated mice were compared. Measurements were performed 3 and 5 weeks after tumor inoculation (not shown). These results suggest a Sirt-independent Pter effect. Nevertheless, further work would be necessary to reach more conclusive evidences under in vivo conditions, for example, using knockout mice.
Production of large amounts of H2O2 by human tumor cells was already observed by Szatrowski and Nathan (64), who raised the hypothesis that increased ROS generation could contribute to the ability of cancers to mutate, injure local tissues, and promote tumor heterogeneity and metastases. In fact, control of oxidative stress to balance ROS levels and benefit of their signaling effects, promoting proliferation and survival, is essential for cancer cells (28). The fact that Pter downregulates the Nrf2-dependent antioxidant defenses of melanoma and pancreatic cancer cells may offer a therapeutic advantage. As shown in Figure 5A, combined Pter and GSH depletion treatment chemosensitizes melanoma cells and facilitates their complete elimination.
The relationship between GSH depletion, chemotherapy, and the radiation response has been examined in many tumor cells after treatment with different drugs, including buthionine sulfoximine (BSO), DEM, 2-oxothiazolidine-4-carboxylate, and different radiosensitizing agents. However, BSO is nonspecific and, besides promoting tumor GSH depletion in vivo, can cause irreversible damage in most normal tissues (52). The fact that Pter treatment decreases tumor GSH levels is an advantage. Starting from the previous Pter treatment-induced depletion, a further decrease in melanoma cell GSH levels could be approached in vivo from different angles, that is, (i) Bcl-2 antisense oligodeoxynucleotides and the calcium channel blocker, verapamil (52); (ii) acivicin, an irreversible GGT inhibitor (50); (iii) sulfasalazine, which inhibits the x(c)-cystine transporter (29); (iv) NOV-002, a formulation of disodium glutathione disulfide (30); (v) phenethyl isothiocyanate, which decreases GPX activity and GSH levels (66); (vi) an L-glutamine-enriched diet (9); (vii) RU-486, a GR antagonist (47); and (viii) anti-IL-6 therapy (melanoma-derived IL-6 activates GSH release from the liver, the main physiological GSH reservoir) (49). On the other hand, it is available as an antisense oligonucleotide designed to inhibit sod1 expression (ISIS 333611) and delivered intrathecally in SOD1 familial amyotrophic lateral sclerosis patients (
These numerous options suggest a novel therapy against cancer. Besides, our results may help to explain (at least in part) the apparent lack of correlation between bioavailability and Pter (and likely other PFs)-induced anticancer activities. Moreover, Nrf2 and possible p-53 and/or c-Myc coregulation, as well as potential interactions between Nrf2 and other signaling pathways (e.g., NF-kB/AP-1), deserve further investigation.
Materials and Methods
Cell culture
Human A2058, MeWo, and MelJuso melanoma cells, pancreatic cancer (adenocarcinoma) ASPC-1 and BxPC-3, murine B16 melanoma F1, and mouse AtT-20 pituitary corticotroph tumor cells were from the American Type Culture Collection. Human HEMa-LP epidermal melanocytes were from Life Technologies. Cells were grown in DMEM (Invitrogen), pH 7.4, supplemented with 10% heat-inactivated fetal calf serum (FCS) (Biochrom KG), 100 U/ml penicillin, and 100 μg/ml streptomycin. Cells were plated (20,000 cells/cm2) and cultured at 37°C in a humidified atmosphere with 5% CO2. Cells were harvested by incubation for 5 min with 0.05% (w/v) trypsin (Sigma, St. Louis, MO) in phosphate-buffered saline (PBS), pH 7.4, containing 0.3 mM EDTA, followed by the addition of 10% FCS to inactivate the trypsin. Cell numbers were determined using a Coulter Counter (Coulter Electronic, Inc.). Cells were allowed to attach for 12 h before any treatment addition. Cellular viability was assessed as previously reported (44).
Animals, tumor growth, and in vivo administration of Pter
Female nu/nu nude mice (6–8 weeks; Charles River Laboratories) were fed ad libitum on a standard diet (Harlan Teklad Animal Diets & Bedding). Mice were kept on a 12-h light/12-h dark cycle at 22°C. Procedures were in compliance with international laws and policies (EEC Directive 86/609, OJ L 358. 1, December 12, 1987; and NIH Guide for the Care and Use of Laboratory Animals, NIH Publ. No. 85-23, 1985). For xenograft experiments, mice were inoculated s.c. with 10 × 106 cancer cells per mouse, except for the ASPC-1 and B16-F1 groups where, due to their very high growth rate, animals were inoculated with 3 × 10⁶ and 2 × 10⁶ cancer cells, respectively, per mouse.
Tumor volume was calculated (every 2 days after inoculation) based on two dimensions, measured using calipers, and expressed in mm3 according to V = 0.5a × b 2 (a and b are the long and the short diameters, respectively). For histological analysis, samples were fixed in 4% formaldehyde, paraffin embedded, and stained as indicated below. For pharmacokinetic and treatment studies, Pter (Green Molecular S.L.) (dissolved in DMSO:ethanol [2:1], 50 mg Pter/ml) was administered i.v. through the jugular vein (where a permanent catheter was surgically fixed).
Determination of Pter and its metabolites by high-pressure liquid chromatography and mass spectrometry
Liquid chromatography and mass spectrometry (LC-MS/MS) was performed, as previously described (7, 23), using a TSQ Vantage™ Triple Quadrupole Mass Spectrometer (Thermo Scientific) equipped with a Shimadzu LC-10ADvp. pump and an SLC-10Avp. controller system with an SIL-10ADvp. autoinjector.
Immunohistochemistry
Monoclonal mouse anti-human HMB45antibodies (Abcam) were used for immunohistochemical detection of melanoma cells. Tumors were fixed and paraffin embedded as described above. Immunohistochemical analysis was applied to tissue slices (5 μm thick) following the methodology recommended by Abcam. A horseradish peroxidase-conjugated goat anti-mouse polyclonal (Abcam) was used as secondary antibody.
Monoclonal mouse anti-human Ki-67 (Dako) was used for immunohistochemical detection of the tumor-growing fraction. Immunohistochemical analysis was applied to tissue slices (5 μm thick) following Dako's methodology. A biotin-conjugated goat anti-rabbit polyclonal (Dako) was used as secondary antibody.
DNA strand breaks in apoptotic cells were assayed using a TUNEL labeling assay (Boehringer), fluorescence microscopy, and manufacturer's methodology.
Measurement of NOS activity in tumor and endothelial cells
The assay, based on the conversion of L-arginine to L-citrulline, was carried out by adding 100 μg of sample protein to 150 μl of assay buffer (50 mM HEPES, 1 mM dithiothreitol, 1 mM MgCl2, 5 mg/L pepstatin A, 0.1 mM phenylmethylsulfonyl fluoride, and 3 mg/L aprotinin, pH 7.4) containing 70 μM arginine, 250,000 dpm L-[3H]arginine, (GE Healthcare), 2 mM NADPH, 5 μM tetrahydrobiopterin, 5 μM FAD, and 0.5 mM CaCl2 to measure total NOS activity or in the presence of 1 mM EGTA (without calcium) to determine Ca2+-independent NOS activity. After 30 min at 37°C, the reaction was stopped with 100 μl of 1 M trichloroacetic acid. The samples were adjusted to pH 4.6 by adding 500 μl of 20 mM HEPES and applied to Dowex AG 50W-X8 resin columns. L-[3H]citrulline was eluted and separated by thin-layer chromatography. Radioactivity was counted with an AR-2000 scanner detector (Bioscan, Inc.). The results are expressed as pmol of L-[3H]citrulline/mg of protein/min. Isolation and culture of tumor endothelial cells were based on previously published methodology (22).
Measurement of nitrite and nitrate
Nitrite and nitrate determinations were based on the methodology of Braman and Hendrix and performed as described previously (23). Total NO2 − plus NO3 − (NOx) determinations were made by monitoring NO evolution from a measured sample placed into a boiling VCl3/HCl solution (which will reduce both NO2 − and NO3 − to NO). Quantitation was accomplished using a standard curve made up of known amounts of NO2 − and NO3 −.
CRH expression in the brain (in situ hybridization)
Sections of 10 μm of the PVN were cut according to a mouse brain atlas (
Measurement of ACTH, corticosterone, and NORA levels
Plasma ACTH (Calbiotech, Inc.), corticosterone (Kamiyama Biomedical Co.), and NORA (IBL) were quantified by ELISA according to the suppliers' instructions.
Measurement of the GR content of cancer cell lines by [3H]-labeled ligand binding assay
The GR content was measured by a whole-cell binding assay as previously described with some modifications (31). Briefly, 72 h cultured melanoma cells were harvested, as above, and resuspended in culture medium at 5 × 10⁶ cells/ml. Then, cells were exposed to various concentrations of [3H]-dexamethasone (GE Healthcare Life Sciences) from 1 to 100 nM in the presence or absence of 10 μM unlabeled dexamethasone, followed by incubation for 1 h at 37°C, and harvested by centrifugation (1200 rpm/min ×1 min). Cells were then washed thrice in 5.0 ml of Hank's balanced salt solution and suspended in 1.5 ml of the same solution. A 0.2-ml aliquot was used for cell number determination, and 1.0 ml was assayed for radioactivity by a liquid scintillation counter. The presence of at least 200-fold excess unlabeled dexamethasone effectively competed out all of the [3H]-dexamethasone binding to specific GR. The binding of [3H]-dexamethasone to GR was represented as the difference in disintegrations/minx cell between those samples incubated with [3H]-dexamethasone alone and those with at least 200-fold excess unlabeled dexamethasone. Using the specific activity of [3H]-dexamethasone, the GR number/cell was calculated, assuming that each receptor binds to one dexamethasone molecule.
Transfection of the red fluorescence protein
First, the pDsRed-2 vector (Clontech Laboratories, Inc.) was used, as described for A375 melanoma cells (45), to engineer A2058, MeWo, and MelJuso melanoma clones stably expressing the red fluorescence protein (RFP). Isolation of A2058-RFP, MeWo-RFP, or MelJuso-RFP cells from the xenografts was performed by laser microdissection and high-performance cell sorting as previously described (45).
RT-PCR and detection of mRNA
Total RNA was isolated using the TRIzol kit from Invitrogen following the manufacturer's instructions. cDNA was obtained using a random hexamer primer and a MultiScribe Reverse Transcriptase kit as recommended by the manufacturer (TaqMan RT Reagents; Applied Biosystems). PCR master mix and AmpliTaq Gold DNA polymerase (Applied Biosystems) were added to the primers previously reported (51) for the GCLC (catalytic subunit), GSH synthase (GSS), GPX2, GSR, GGT, SOD1, SOD2, CAT, NOX1, and glyceraldehyde-3P-dehydrogenase (GAPDH) (Sigma-Genosys). Other primer sequences (5′-3′) used were GSH transferase A1 (GSTA1), sense TTCCTTACTGGTCCTCACATCTC and antisense TCACCGGATCATGGCCAGCA; thioredoxin reductase 1 (TXNRD1), sense GTGTTGTGGGCTTTCACGTA and antisense CAGCCTGGAGGATGCTTG; malic enzyme 1 (ME1), sense AGTGCCTACCTGTGATGTTG and antisense GGCTTGACCTCTGATTCTCT; isocitrate dehydrogenase 1 (IDH1), sense ACCAAATGGCACCATACGA and antisense TTCATACCTTGCTTAATGGGTGT; iNOS, sense GCATGGCCTTCCGTGTTC and antisense TCCTCCTCCGCCTCGTAAGGA; and eNOS, sense TGGTACATGAGCACTGAGATCG and antisense CCACGTTGATTTCCACTGCTG (Sigma-Genosys). The primer sequences (5′-3′) used for POMC were sense AGTGTCGTCAGAAAGAACGAACGGC and antisense CTCAACTGGTGTCGTGGAGTC (74). Real-time quantification of mRNA relative to GAPDH was performed with an SYBR Green I assay and an iCycler detection system (Biorad). Target cDNA was amplified using the following conditions: 10 min at 95°C, followed by 40 cycles of denaturation at 95°C for 30 s, and annealing and extension at 60°C for 1 min. Changes in fluorescence were measured in real time during the extension step. The threshold cycle (CT) was determined and the relative gene expression expressed as fold change = 2−Δ(ΔCT ), where ΔCT = CTtarget − CTGAPDH and Δ(ΔCT) = ΔCTtreated − ΔCTcontrol.
Enzyme assays
Isolated tumor cells were homogenized in 0.1 M phosphate buffer (pH 7.2) at 4°C. GCL and GSS activities were measured as previously described (50). GPX (selenium dependent) activity was measured as in (24) using H2O2 as a substrate. GSR activity was determined as previously reported (3). GGT activity was measured as in (50). GST activity was measured using an assay kit from Sigma. TXNRD activity, defined by the concentration of sodium lipoate (disulfide) reduced to dehydrolipoate (dithiol) per milligram protein, was measured as in (35). SOD activity was measured as in (25) using 2 mM cyanide in the assay medium to distinguish the mangano-type enzyme (SOD2) from the cuprozinc type (SOD1). CAT activity was analyzed as previously described (2). NOX activity was measured by chemiluminescence as in (72). Protein concentration was determined with the Pierce BCA protein assay (Fisher Scientific).
Measurement of H2O2 and O2 • −
Quantitative measurement of H2O2 and flow cytometric determination of O2 • − generation were performed as previously described (9).
GSH, GSSG, NADP+, and NADPH determination
GSH and GSSG were determined, as previously reported (51), by LC/MS using the equipment indicated above for Pter determination. Cell processing was performed according to published methodology, where rapid N-ethylmaleimide derivatization was used to prevent GSH auto-oxidation (6). NADP
Lipid peroxidation
For isoprostane determination, tumor samples, stored at −80°C, were homogenized in 0.1M phosphate buffer (pH 7.4)+1 mM EDTA +0.005% butylated hydroxytoluene. Isoprostanes were measured using the 8-isoprostane EIA kit (Cayman Chemical) and following the manufacturer's protocol.
Western blot analysis
For Western blotting, minced tissues were washed twice in ice-cold Krebs-Henseleit bicarbonate medium (pH 7.4). Tissue extracts were made by freeze–thaw cycles (cells) or homogenization (tissues) in a buffer containing 150 mM NaCl, 1 mM EDTA, 10 mM Tris-HCl, 1 mM phenylmethylsulfonyl fluoride, 1 μg/ml leupeptin, 1 μg/ml aprotinin, and 1 μg/ml pepstatin (pH 7.4). About 50 μg of protein (as determined by the Bradford assay) was boiled with Laemmli buffer and resolved in 12.5% SDS-PAGE. Proteins were transferred to a nitrocellulose membrane and subjected to Western blotting with anti-human SOD1 or CAT monoclonal antibodies (OriGene). Blots were developed using horseradish peroxidase-conjugated secondary antibody and enhanced chemiluminescence (ECL system; Amersham). Protein bands were quantified using laser densitometry. Equal protein loading on membranes and complete transfer were confirmed by staining the gels and membranes with Coomassie Blue. To make the pooling of data from different immunoblots possible, the relative density of each band was normalized against the internal standard analyzed on each blot.
Nrf2 gene transfer and measurement
The Tet-Off Advanced Inducible Gene Expression System (Clontech) was used to insert the human Nrf2 gene and for transfection into melanoma cells. Tet-off cells stably expressed Tet-regulated pTRE-Tight-Nrf2, giving an increased Nrf2 gene expression (Tet-Nrf2 cells). To suppress Nrf2 protein levels, Tet-Nrf2 cells were cultured in the presence of 2 mg tetracycline (Sigma)/106 cells. The NE-PER extraction kit from Thermo Scientific was used for nuclear protein extraction according to the manufacturer's instructions. Mouse monoclonal primary antibodies against Nrf2 were purchased from Abcam. A total of 50 mg of protein was boiled in Laemmli buffer and resolved by 12.0% SDS-PAGE. Proteins were transferred to a nitrocellulose membrane (Hybond C-extra; GE Healthcare Europe GmbH) and subjected to Western blotting. The blotted membrane was blocked for 1 h at room temperature in TBS containing 5% (w/v) membrane-blocking reagent (nonfat dried milk). All antibody incubations were carried out at 22°C in TBS containing 1% membrane-blocking reagent. The incubation steps were followed by three washing steps of 5 min using TBS containing 0.1% Tween 20. The blots were developed using horseradish peroxidase-conjugated secondary antibody and enhanced chemiluminescence (ECL system; GE Healthcare). Protein bands were quantified using laser densitometry. Relative density of each band was normalized against an internal standard, thus facilitating pooling of data from different immunoblots.
POMC analysis
RT-PCR and detection of mRNA were performed as described above. For Western blotting (see also above), POMC mouse monoclonal antibody (clone 2B2) from Origen was used.
Antisense oligodeoxynucleotides
Fully phosphorothioate-modified chimeric 20-mer human sod1 antisense oligonucleotides comprising five 2′-O-(2-methoxy)ethyl modifications on both the 5′ and 3′ ends and 10 oligodeoxynucleotides in the center to support RNase H activity (sequence: 5′-GTCGCCCTTCAGCACGCACA-3′) were obtained from Sigma-Genosys. As a control, a reversed phosphorothioated 20-mer sequence was purchased from the same source. Inhibition of sod1 expression was verified by measuring the SOD1 activity and Western blot analysis with anti-human SOD1 monoclonal antibody (Sigma).
Evaluation of Pter-induced in vivo toxicity
This included the following parameters: blood cell count and chemistry based on NIH standard methodology, and urinalysis based on the Combur test from Roche. Urine pH was directly measured using a pH meter and urine protein content with the Pierce BCA Protein Assay Kit. The glomerular filtration rate was evaluated following the single-bolus FITC-inulin clearance methodology described for mice by Qi et al. (57).
Isolation and incubation of hepatocytes and lymphocytes
Isolation of hepatocytes was performed according to previously reported methodology (11). Blood mononuclear cells were obtained from heparinized blood by Accuspin-Histopaque (Sigma) gradient centrifugation. Mononuclear cells were washed twice and resuspended in Krebs-Henseleit bicarbonate medium (pH 7.4) with 0.3% bovine serum albumin at a concentration of 20 × 106 cells/ml. Further positive selection of lymphocyte subsets by monodispersed immunomagnetic Dynabeads (Dynal) was performed at 4°C, as described elsewhere (65). Hepatocyte and lymphocyte cell volumes were obtained as previously described (18).
Isolated hepatocytes were incubated in flasks (about 10 mg dry wt/ml) at 37°C in Krebs-Henseleit bicarbonate medium (pH 7.4) containing 1.3 mM-CaCl2, 5% fat-free bovine serum albumin, and in the presence of glucose (5 mM). The gas atmosphere was O2/CO2 (19:1). Isolated lymphocytes were incubated (106 cells/flask) at 37°C in Krebs-Ringer medium with 5% fat-free bovine serum albumin and in the presence of glucose (5 mM) and glutamine (2 mM). After incubation, the cells were disrupted by the addition of 0.2 ml of 25% perchloric acid. Protein was removed by centrifugation and the supernatant was neutralized with 20 ml of a 40% KOH solution and a Tris-(hydroxymethyl) aminomethane/KOH (0.5–2.0 M) solution for the measurement of the metabolites. Rates of glucose and glutamine utilization were measured as previously described (48).
Culture of hepatocytes
Isolated hepatocytes were diluted with warm William's complete medium to 2.5 × 10⁵ cells/ml and plated in uncoated cultured flasks at a ratio of 5 × 10⁵ cells/2 ml. Cells were cultured at 37°C in a humidified atmosphere of 95% air and 5% CO2.
Determination of EGCG and Curc by high-pressure LC-MS/MS
LC-MS/MS procedures were based on previously reported methodologies (42, 69), but using the equipment indicated for Pter determination.
Expression of results and statistical analyses
Data are presented as mean values ± SD for the number of different experiments. Statistical analyses were performed using Student's t-test, and p < 0.05 was considered significant.
Footnotes
Acknowledgments
This research was supported by grants from the MINECO (
Author Disclosure Statement
No competing financial interests exist.
Abbreviations Used
References
Supplementary Material
Please find the following supplemental material available below.
For Open Access articles published under a Creative Commons License, all supplemental material carries the same license as the article it is associated with.
For non-Open Access articles published, all supplemental material carries a non-exclusive license, and permission requests for re-use of supplemental material or any part of supplemental material shall be sent directly to the copyright owner as specified in the copyright notice associated with the article.