
Abstract
Introduction
M
Nevertheless, selenium potentially maintains energy metabolism through interactions occurring with components of carbohydrate and lipid metabolic pathways (34). Energy balance is also influenced by redox status as well as the hormones insulin, leptin, adiponectin, and testosterone (14, 71), the latter which is responsible for gender differences in energy metabolism (58). These factors are correspondingly regulated by selenium, suggesting that this micronutrient may also exert an indirect influence over metabolic pathways (7, 13, 23 –25, 47, 50, 62).
Selenium is utilized in selenocysteine, an amino acid that is cotranslationally incorporated into selenoproteins (31). Selenoproteins act mostly in redox-dependent reactions and have been demonstrated to be involved in energy metabolism through various mechanisms. Examples include the following: curbing of oxidative stress (32), regulation of local availability of thyroid hormones (38), disruption of pancreatic insulin secretion (40, 48), and regulation of phosphorylation of key elements of energy metabolic pathways, such as insulin signaling inhibitor protein tyrosine phosphatase 1B (PTP1B) (63), and carbohydrate–lipid metabolism switch AMP kinase alpha (AMPKalpha) (43). Transgenic mice with an inability to synthesize oxidative stress-related selenoproteins presented severe liver and white adipose tissue (WAT) necrosis, ultimately leading to hepatic failure and death at an early stage of life. Hepatic cholesterol biosynthesis was upregulated, resulting in increased plasma cholesterol (56). Thus, selenoproteins appear to play a key role in lipid metabolism.
The role of selenium in lipid metabolism is well recognized, but specific mechanisms leading to obesity that depend on selenium metabolism are unclear. The innovation of this study resides in uncovering that a selenocysteine lyase-dependent selenium recycling mechanism participates in the development of obesity and metabolic syndrome triggered by ingestion of a high-fat selenium-adequate diet independent of most selenoprotein levels.
Availability of intracellular selenium for selenoprotein production comes from an intricate balance of selenium intake and recycling mechanisms. Selenocysteine lyase (Scly) catalyzes the decomposition of selenocysteine into alanine and selenide, the latter being redirected to selenoprotein biosynthesis (29), possibly through its interaction with selenophosphate synthethase (SPS) enzymes, particularly SPS2 (69). The ability to produce selenide that can reenter the selenoprotein biosynthetic pathway suggests a role for Scly in selenium recycling. In rodents, the liver is the main site of Scly expression (10), and Scly is important for selenoprotein expression during times of selenium deficiency (29). The liver produces several selenoproteins and it is also a key organ in management of selenium availability to the entire body.
While the majority of studies consider only intake levels when analyzing selenium effects in health, we demonstrated previously that selenium recycling mechanisms should not be disregarded. Mice lacking Scly develop metabolic syndrome and become obese, with hyperinsulinemia, hyperleptinemia, and hypercholesteremia, which are aggravated by a selenium-deficient diet (55). These findings demonstrated that Scly plays a role in energy metabolism and raised the question of whether this role could be independent of its function in selenoprotein biosynthesis.
Most amino acid degradation pathways lead to generation of pyruvate, a crucial substrate for energy metabolism and gluconeogenesis. Pyruvate levels are maintained by the actions of enzymes, pyruvate carboxylase (Pcx), which converts pyruvate into oxaloacetate to fuel the tricarboxylic acid (TCA) cycle, and pyruvate dehydrogenase (Pdh), which converts pyruvate to acetyl-CoA, a key regulator of lipogenesis. Since Scly is involved in an amino acid degradation pathway, we hypothesized that Scly may regulate pyruvate levels, consequently impacting energy metabolism and gluconeogenesis.
Lipid-rich diets are partially responsible for the rise in obesity among the human population (11). However, the molecular mechanisms underlying diet-induced obesity are complex and not fully understood. Moreover, whether selenium metabolism influences lipid pathways remains to be tested. Therefore, we investigated the effects of a high-fat diet concomitant with Scly disruption. To achieve this, we exposed whole-body Scly knockout (Scly KO) mice to a selenium-adequate high-fat diet, an experimental paradigm that leads to obesity and metabolic syndrome in rodents (2). We report that Scly KO mice are more susceptible to diet-induced obesity than their wild-type (WT) counterparts, despite receiving adequate selenium supply. Our findings reveal insights into a potential crosstalk between selenium metabolism and energy metabolic pathways that is independent of most selenoprotein levels.
Results
Scly KO mice are more susceptible to diet-induced obesity
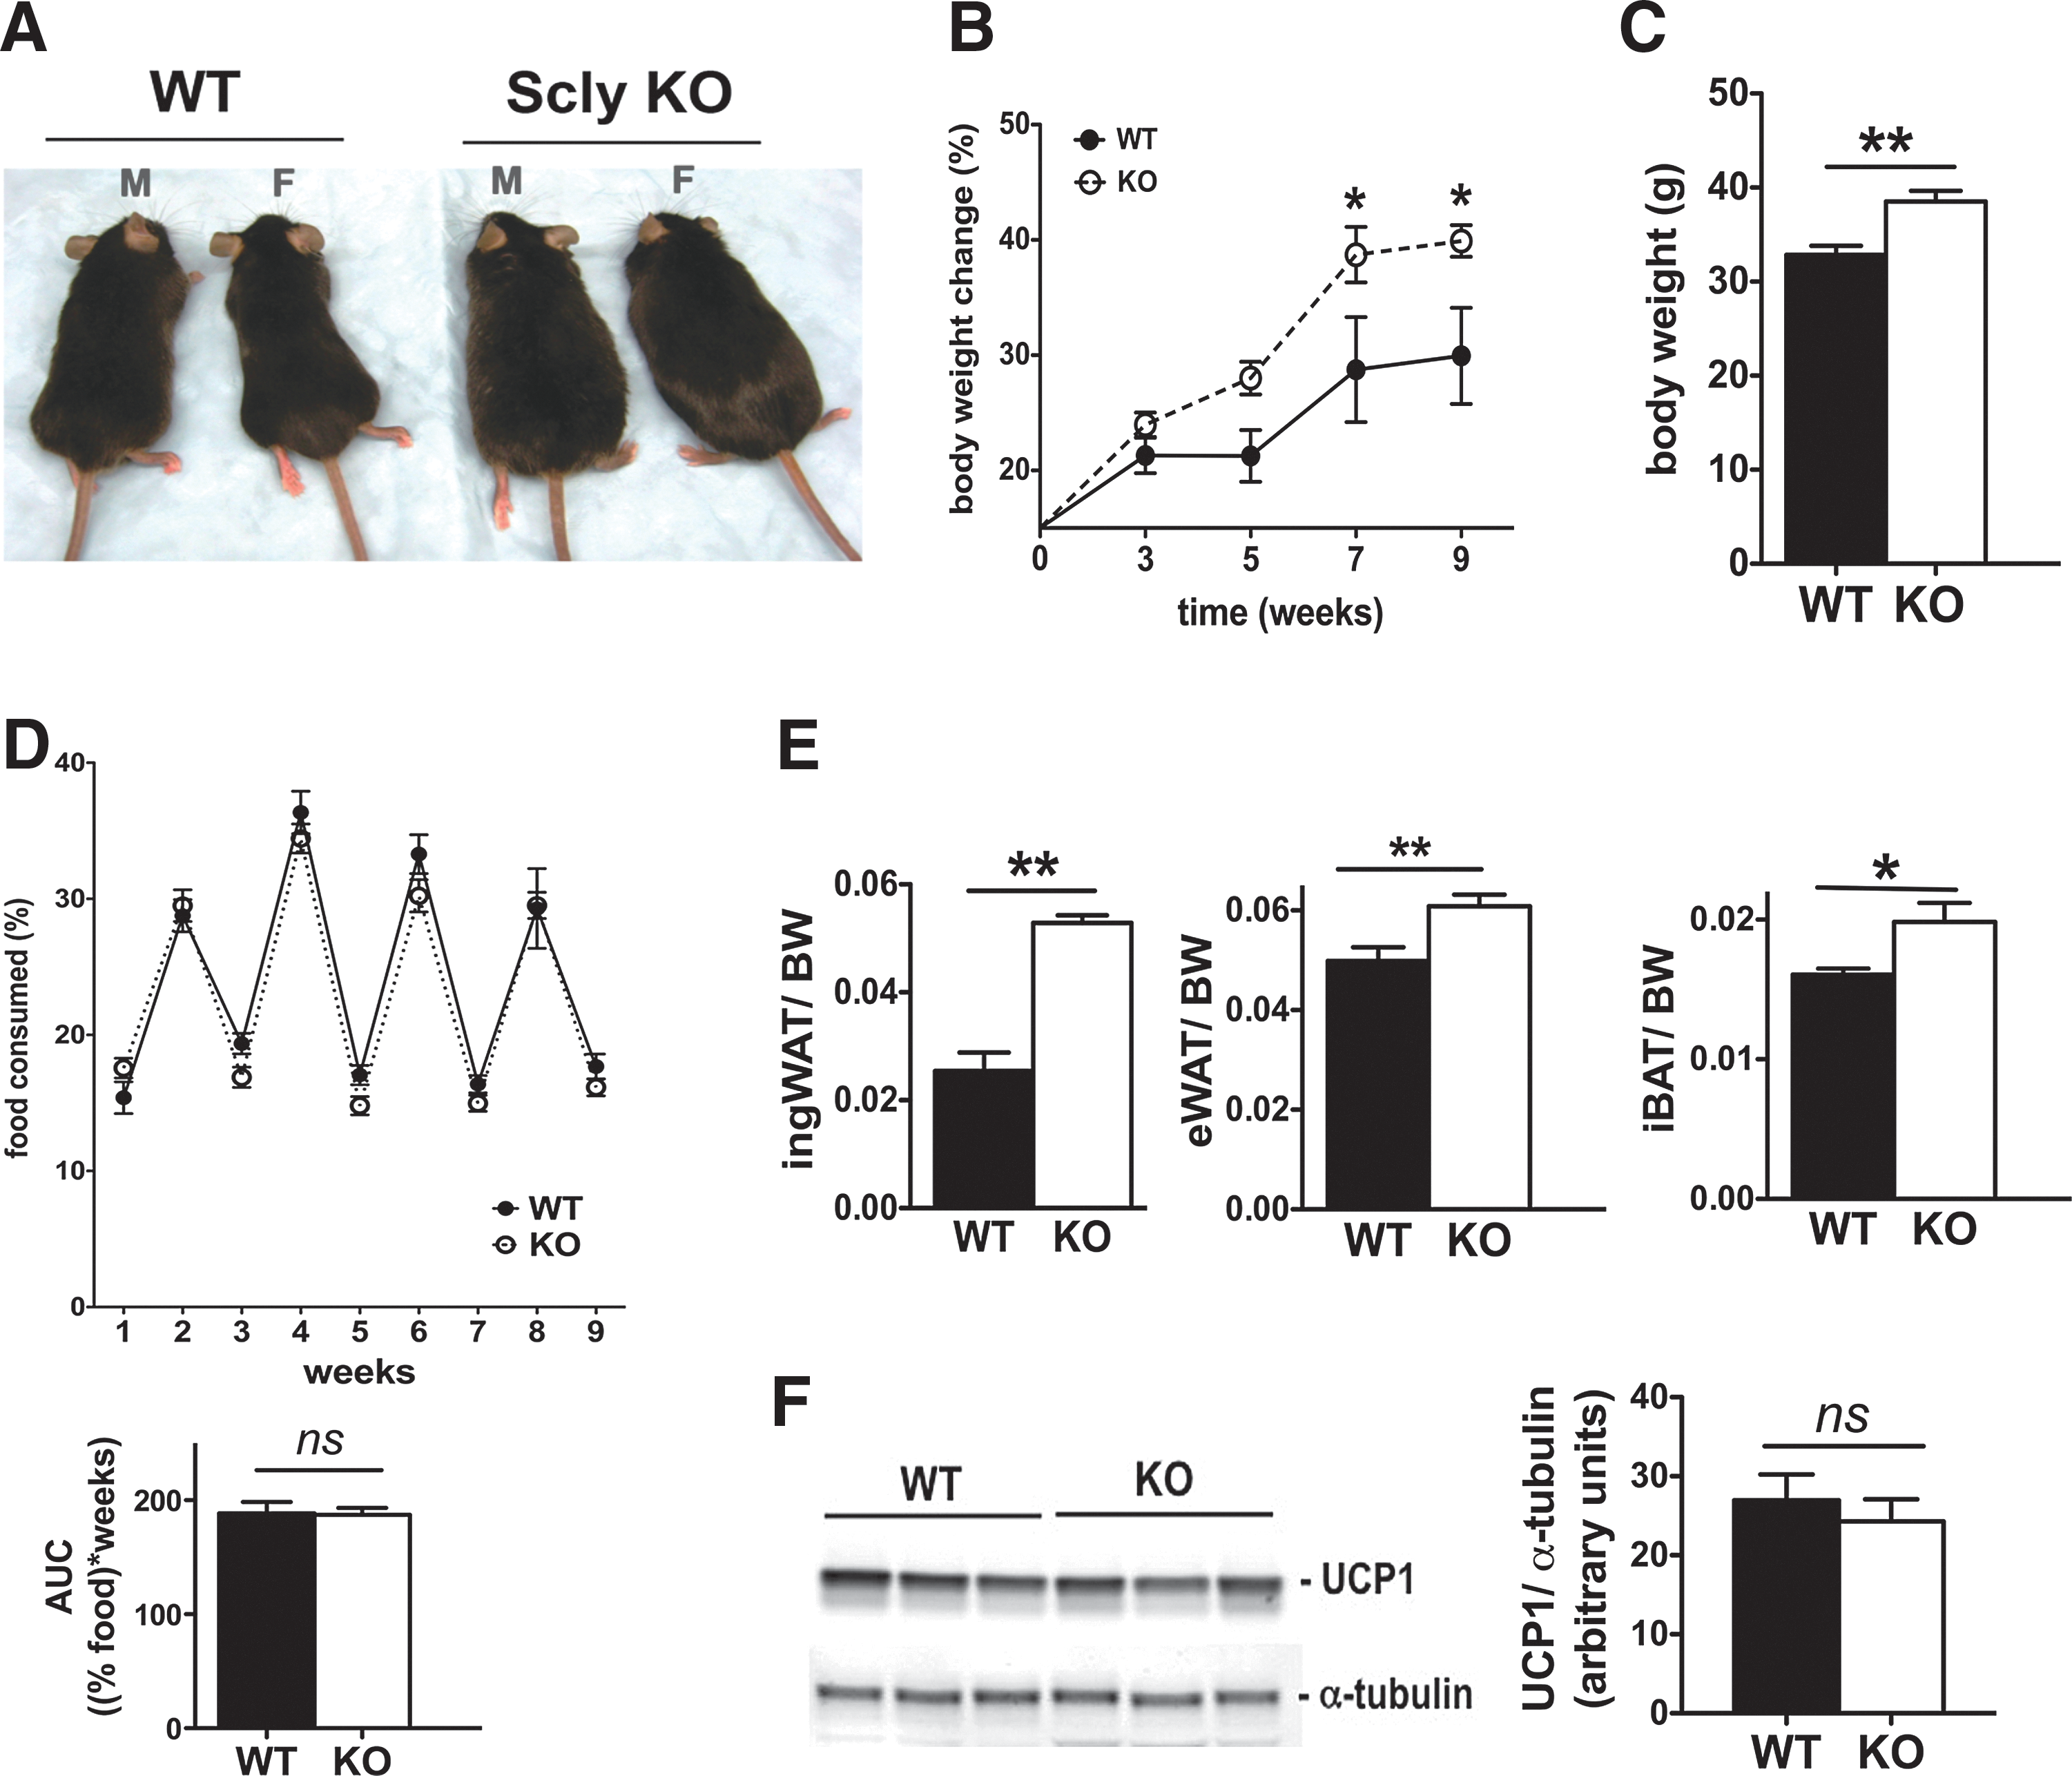
Weanling Scly KO mice fed a selenium-adequate, 45% kcal high-fat diet developed severe obesity when compared with WT mice fed the same diet (Fig. 1A). Both male and female Scly KO mice presented similar aggravated obesity; however, we selected male mice to be further analyzed in our study, as gender-specific mechanisms were found to regulate energy metabolism (58) and selenium metabolism (33, 54). Body weight differences between Scly KO and WT mice were significantly increased after 7 weeks on a high-fat diet (Fig. 1B). At the time of experimental termination (4 months on diet), Scly KO mice were ∼30% heavier than their WT counterparts (Fig. 1C). The weight of the inguinal WAT (ingWAT) depot and the epidydimal WAT (Fig. 1E) was heavier in Scly KO mice than in WT mice after a high-fat intake. The increase in body and fat weights in Scly KO mice could not be considered as a consequence of increased food intake, as we found no differences in food consumption (Fig. 1D). Interscapular brown adipose tissue (iBAT) is a key organ in energy expenditure, a process mostly coordinated by the actions of uncoupling protein 1 (UCP1). iBAT mass was ∼20% heavier in Scly KO mice than WT mice (Fig. 1E). Despite increased BAT weight, Scly KO and WT mice expressed UCP1 at the same levels (Fig. 1F).
Disruption of Scly accompanied by increased dietary fat intake worsens metabolic syndrome
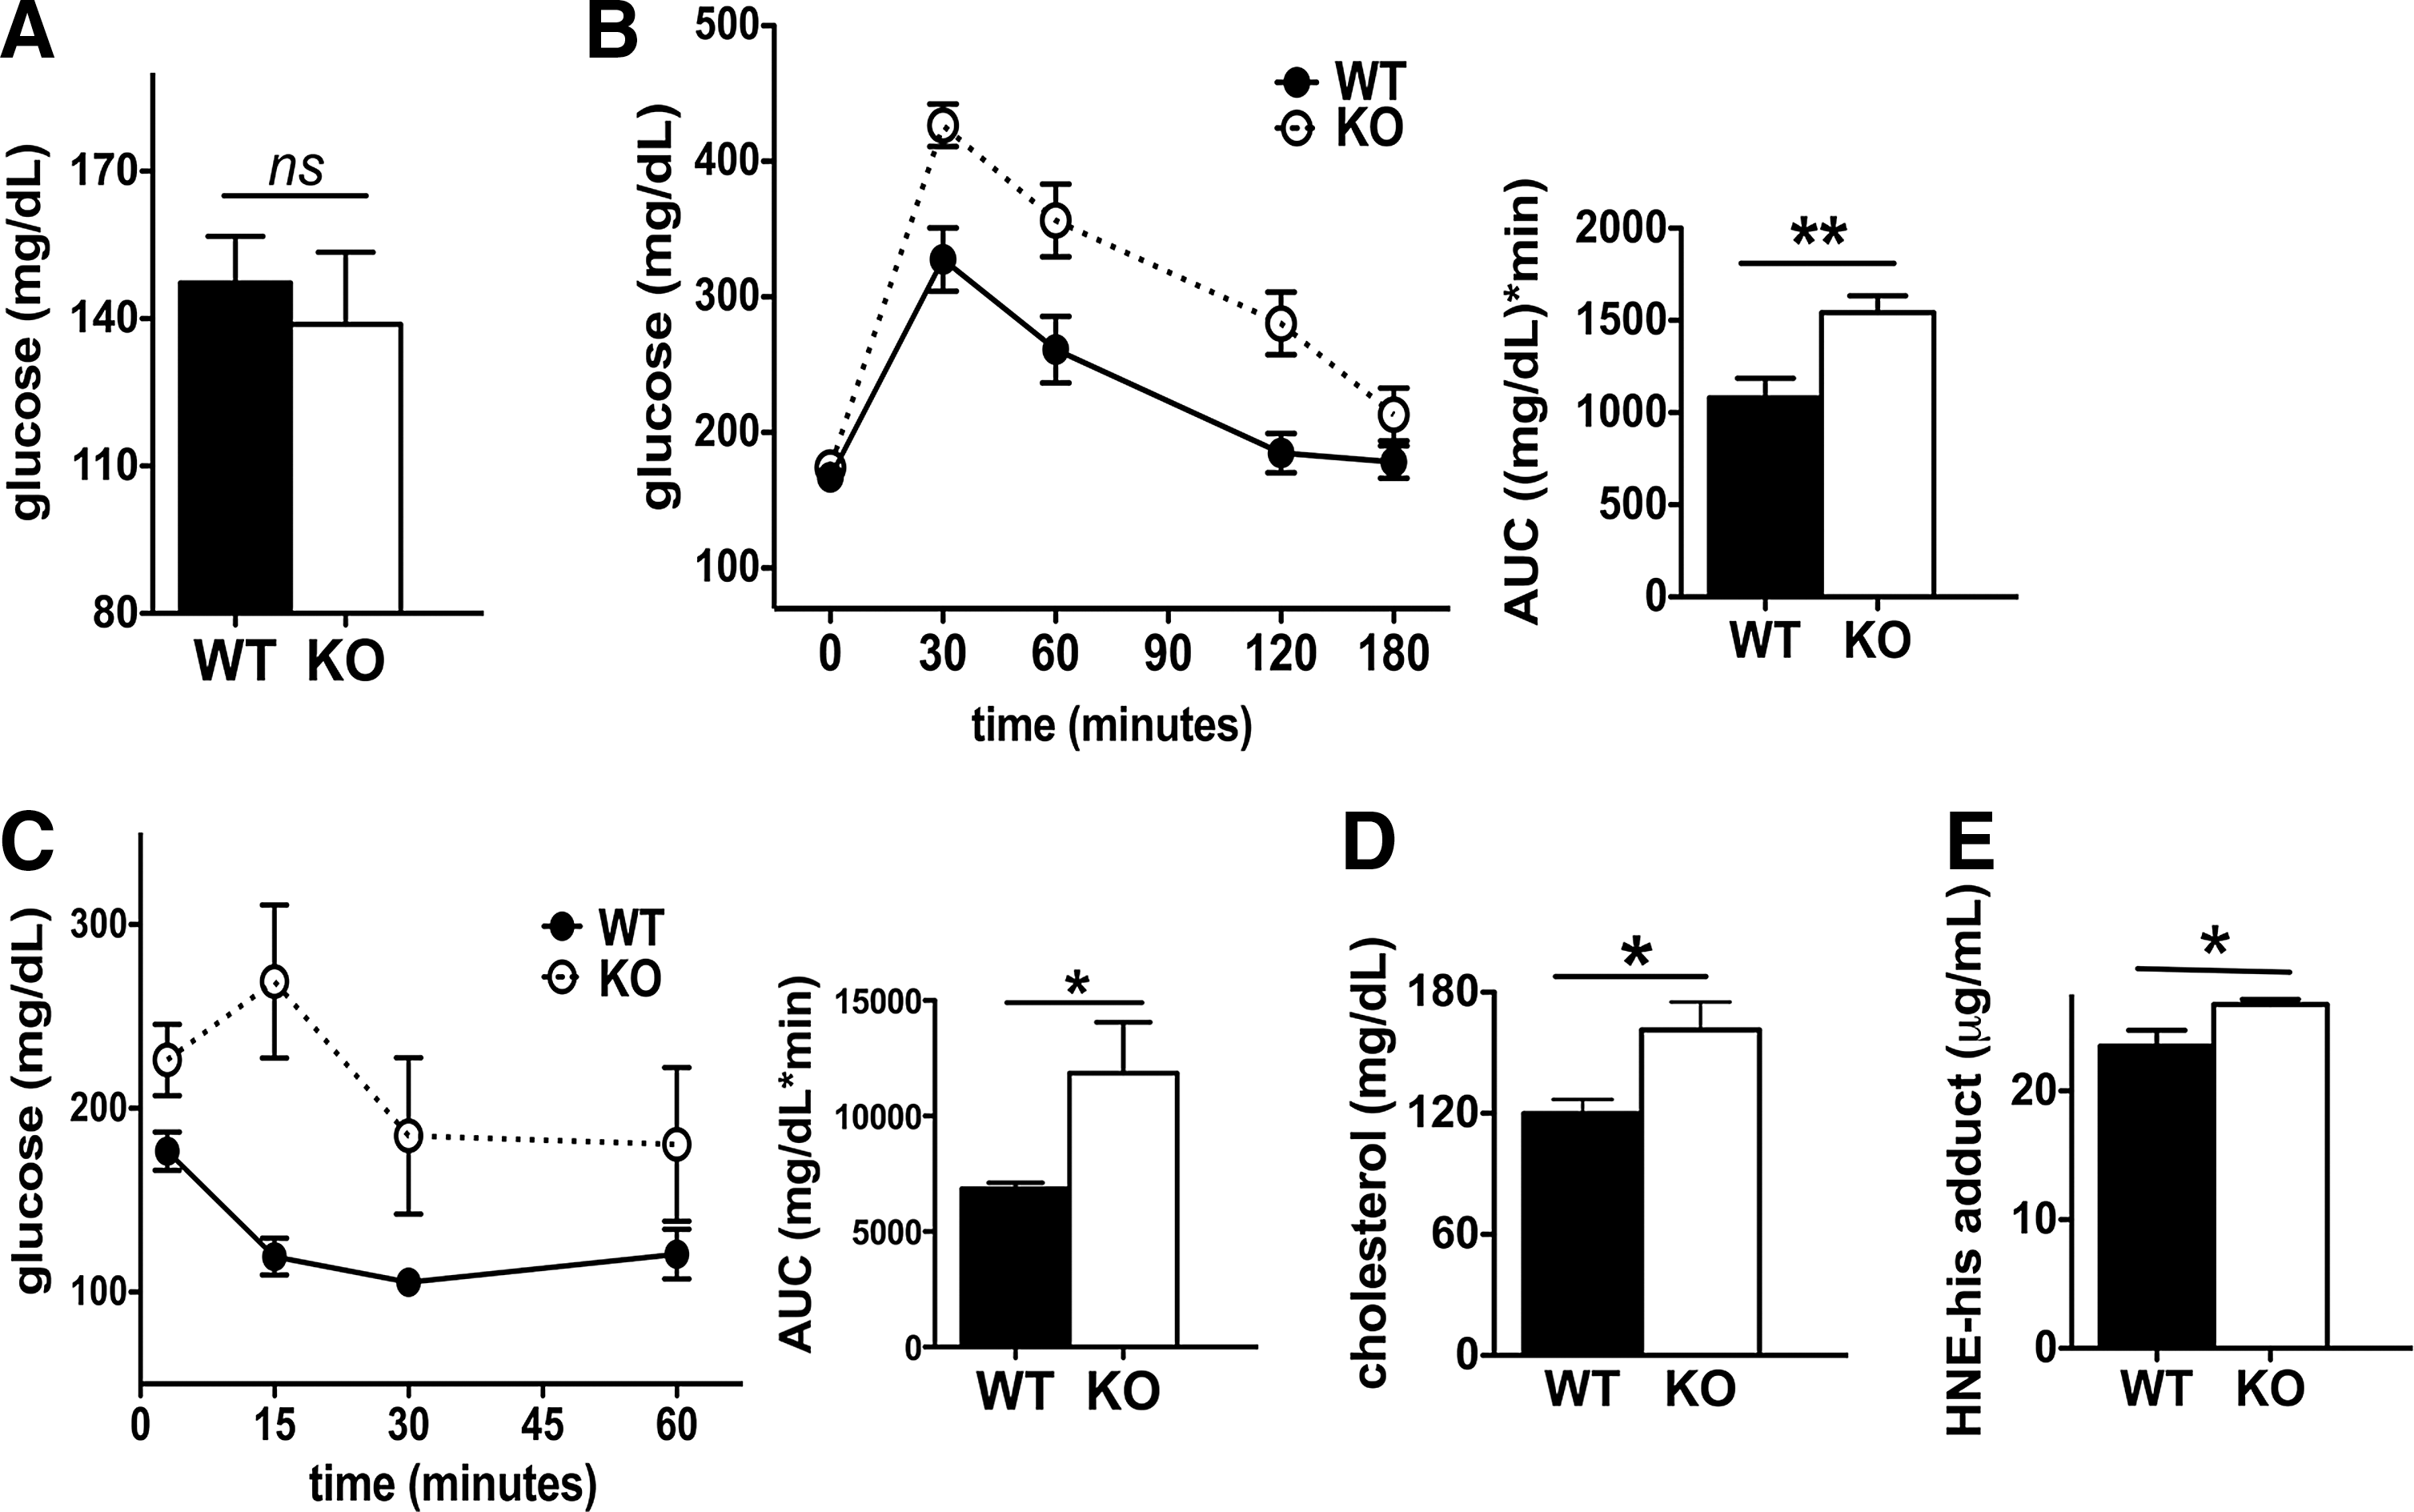
Fasting glucose concentrations were maintained at similar levels in Scly KO and WT mice, ∼140 mg/dl (Fig. 2A), after 3 months on a high-fat diet. Nevertheless, Scly KO mice on a high-fat diet for 3 months were more severely glucose intolerant (Fig. 2B) and insulin intolerant (Fig. 2C) compared with their WT counterparts. Serum cholesterol levels measured at the time of euthanasia (4 months on diet) were increased by ∼30% in the Scly KO mice compared to WT mice (Fig. 2D), an astounding finding considering the latter exhibited elevated cholesterol when fed a high-fat diet alone (37). Obesity is characterized by increased oxidative stress in rodents (36, 42), and Scly KO mice were further susceptible to oxidative stress, as indicated by serum measurements of hydroxynonenal (HNE)-his adduct, which were ∼10% higher in the Scly KO mice (Fig. 2E) upon euthanasia.
Scly KO mice are hyperinsulinemic and hyperleptinemic
High-fat diet induces hyperinsulinemia and hyperleptinemia in WT mice (22, 72). Nevertheless, Scly KO mice on a high-fat diet presented approximately twice as much circulating insulin as WT mice (Table 1). Circulating leptin levels were also doubled (Table 1). Interestingly, other measured hormones expected to change upon a high-fat diet exposure, such as adiponectin and testosterone (39, 41), were at the same levels in the WT and Scly KO mice (Table 1). In addition, rodents are expected to increase the levels of circulating immunocytokines interleukin-6 (IL-6), monocyte chemotactic protein 1 (MCP1), and tumor necrosis factor alpha (TNFalpha) (18, 19, 72) in response to a high-fat diet. Despite aggravated obesity, measurements of these three cytokines in the serum were similar between Scly KO and WT mice (Table 1). Thus, both groups of mice were likely under similar systemic inflammatory environments.
Values are mean ± SEM. Average comparison by two-tailed Student's t-test (S) and nonparametric Mann–Whitney U test (MW). p-Values under 0.05 are deemed significant and highlighted in italic/bold.
IL-6, interleukin 6; MCP1, monocyte chemotactic protein 1; TNFalpha, tumor necrosis factor alpha; WT, wild type.
High-fat diet selectively affects selenoprotein levels in Scly KO mice
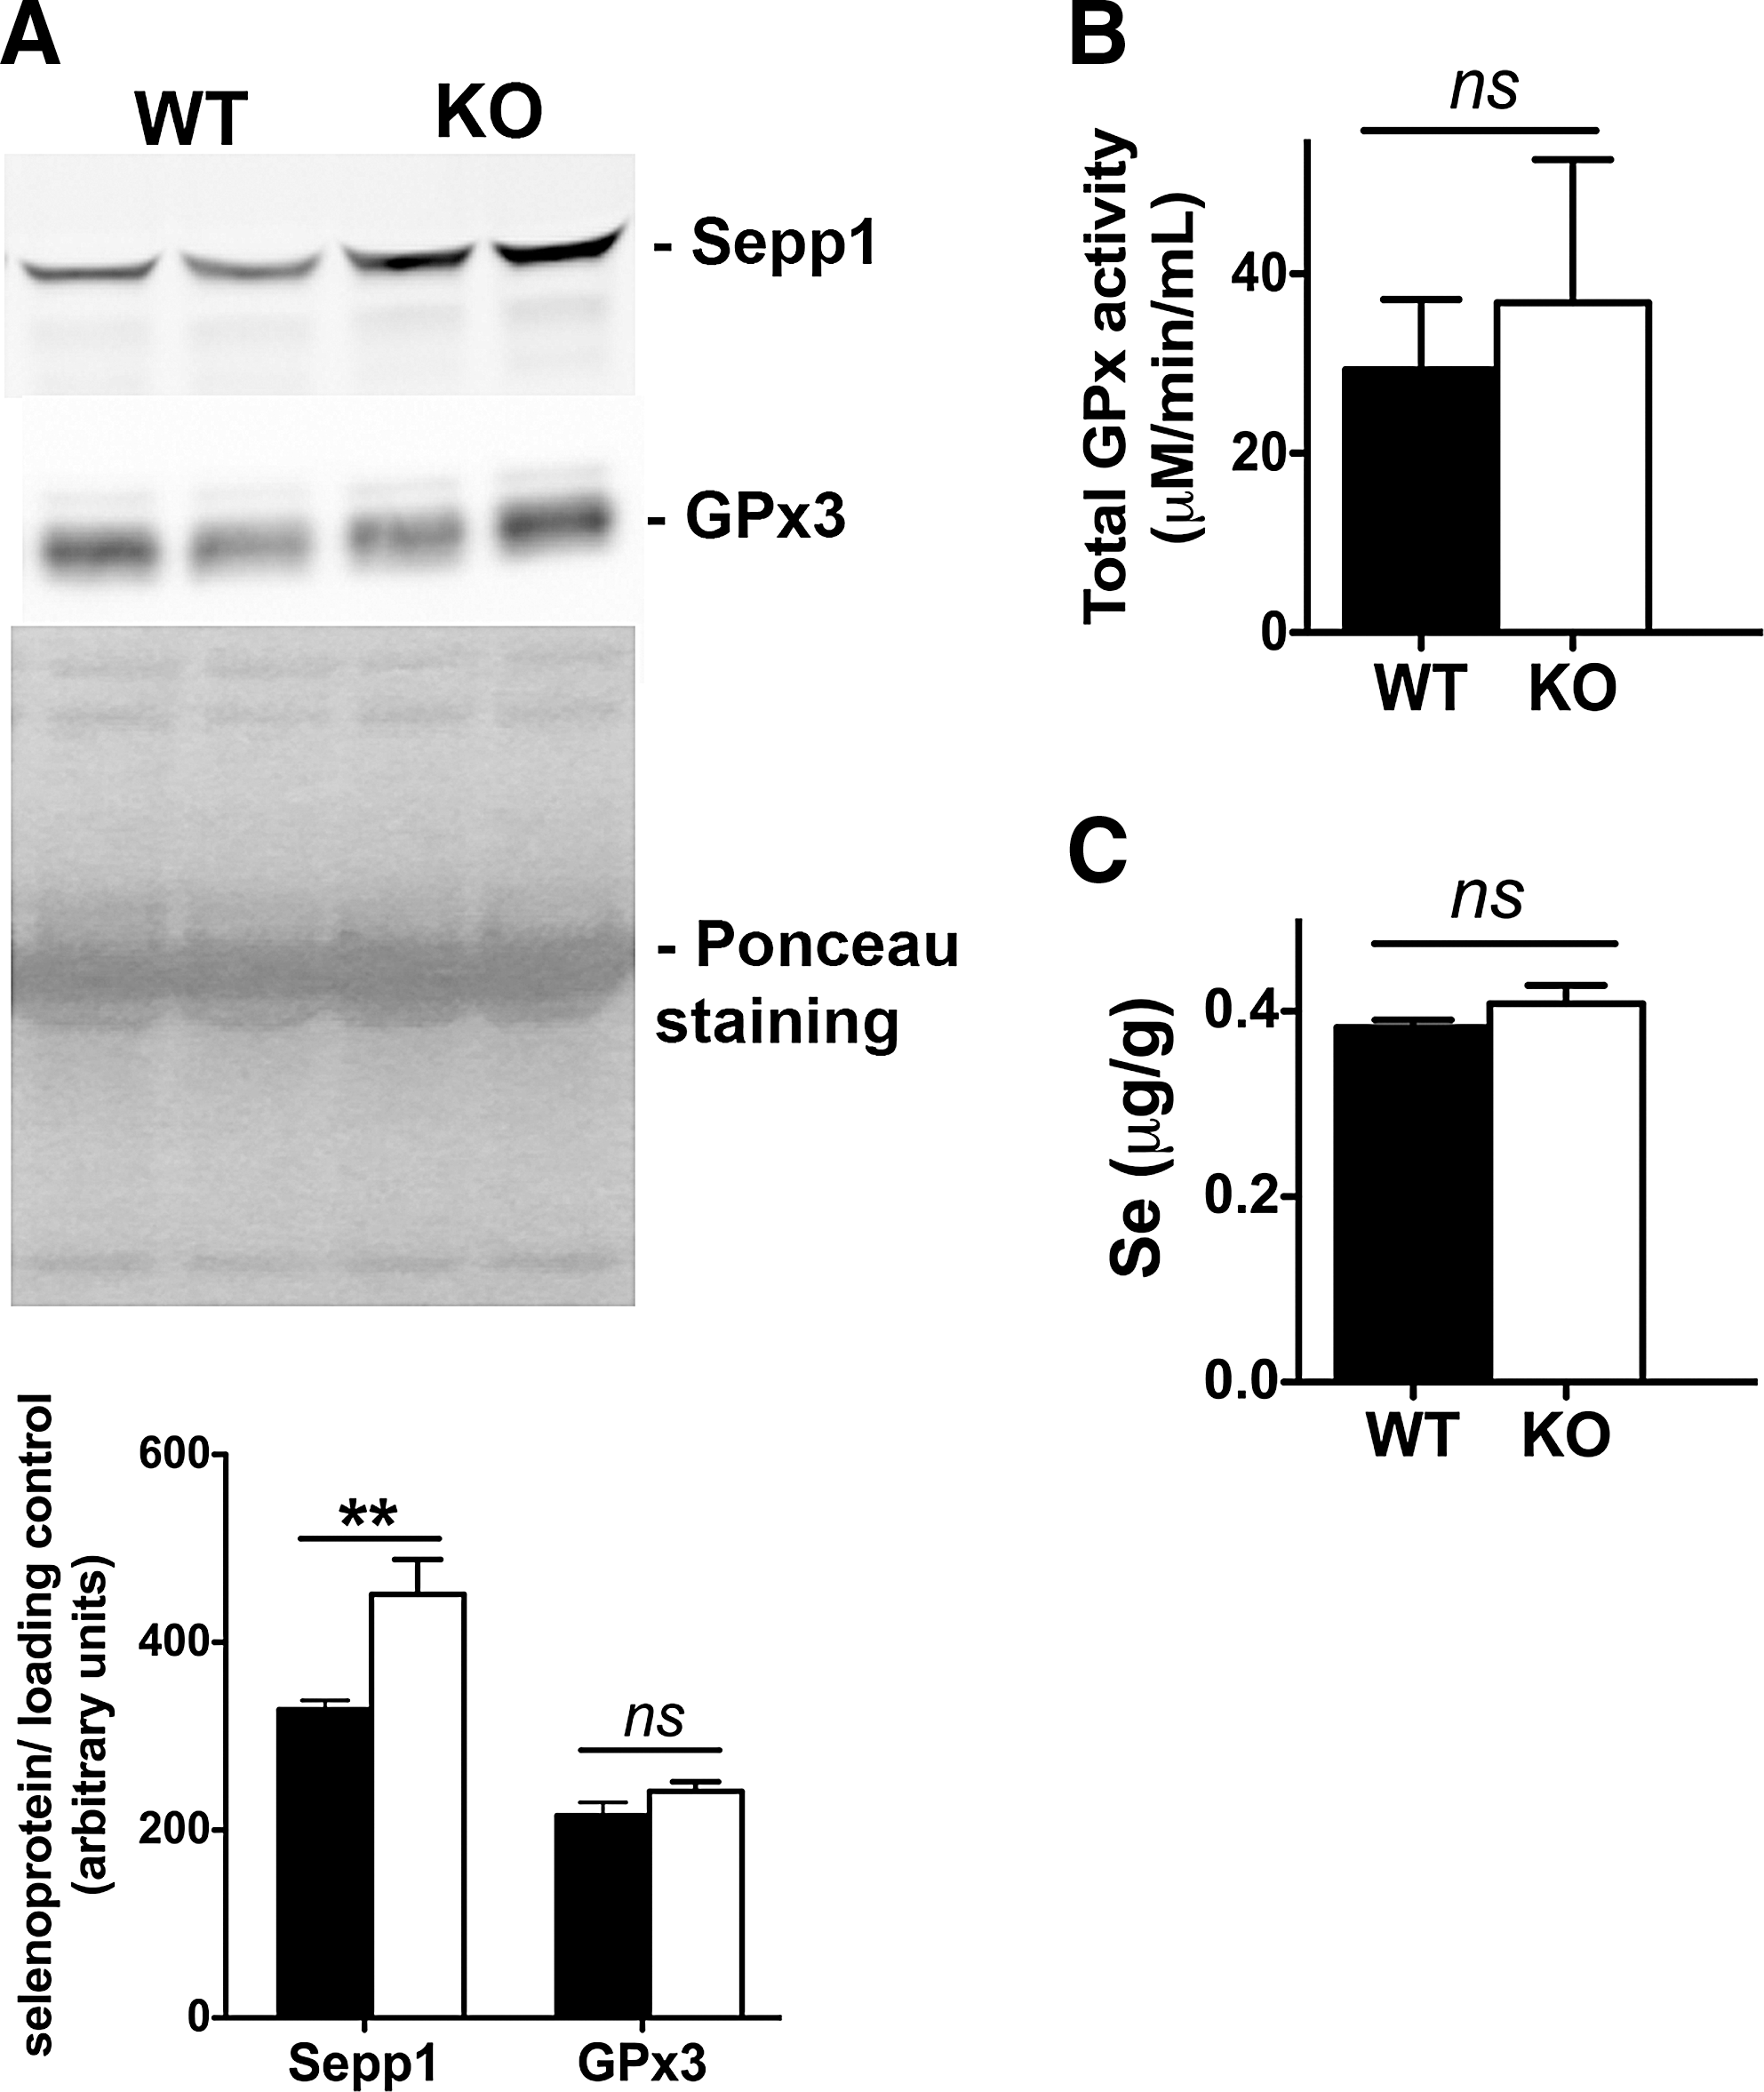
Selenium adequacy was maintained throughout our experiments by maintaining the levels of selenite intake at ∼0.2 ppm. Circulating levels of glutathione peroxidase 3 (GPx3) and selenoprotein P (Sepp1), whole-body biomarkers of selenium availability, were assessed in Scly KO mice fed a high-fat diet, with an interesting picture emerging. Serum GPx3 levels (Fig. 3A) and GPx activity (Fig. 3B) were unchanged in Scly KO compared to WT mice. Moreover, total selenium content in the serum of Scly KO and WT mice was also at the same levels (Fig. 3C). However, circulating Sepp1 levels were elevated (Fig. 3A), suggesting that Sepp1 hepatic production and secretion into plasma were upregulated (3).
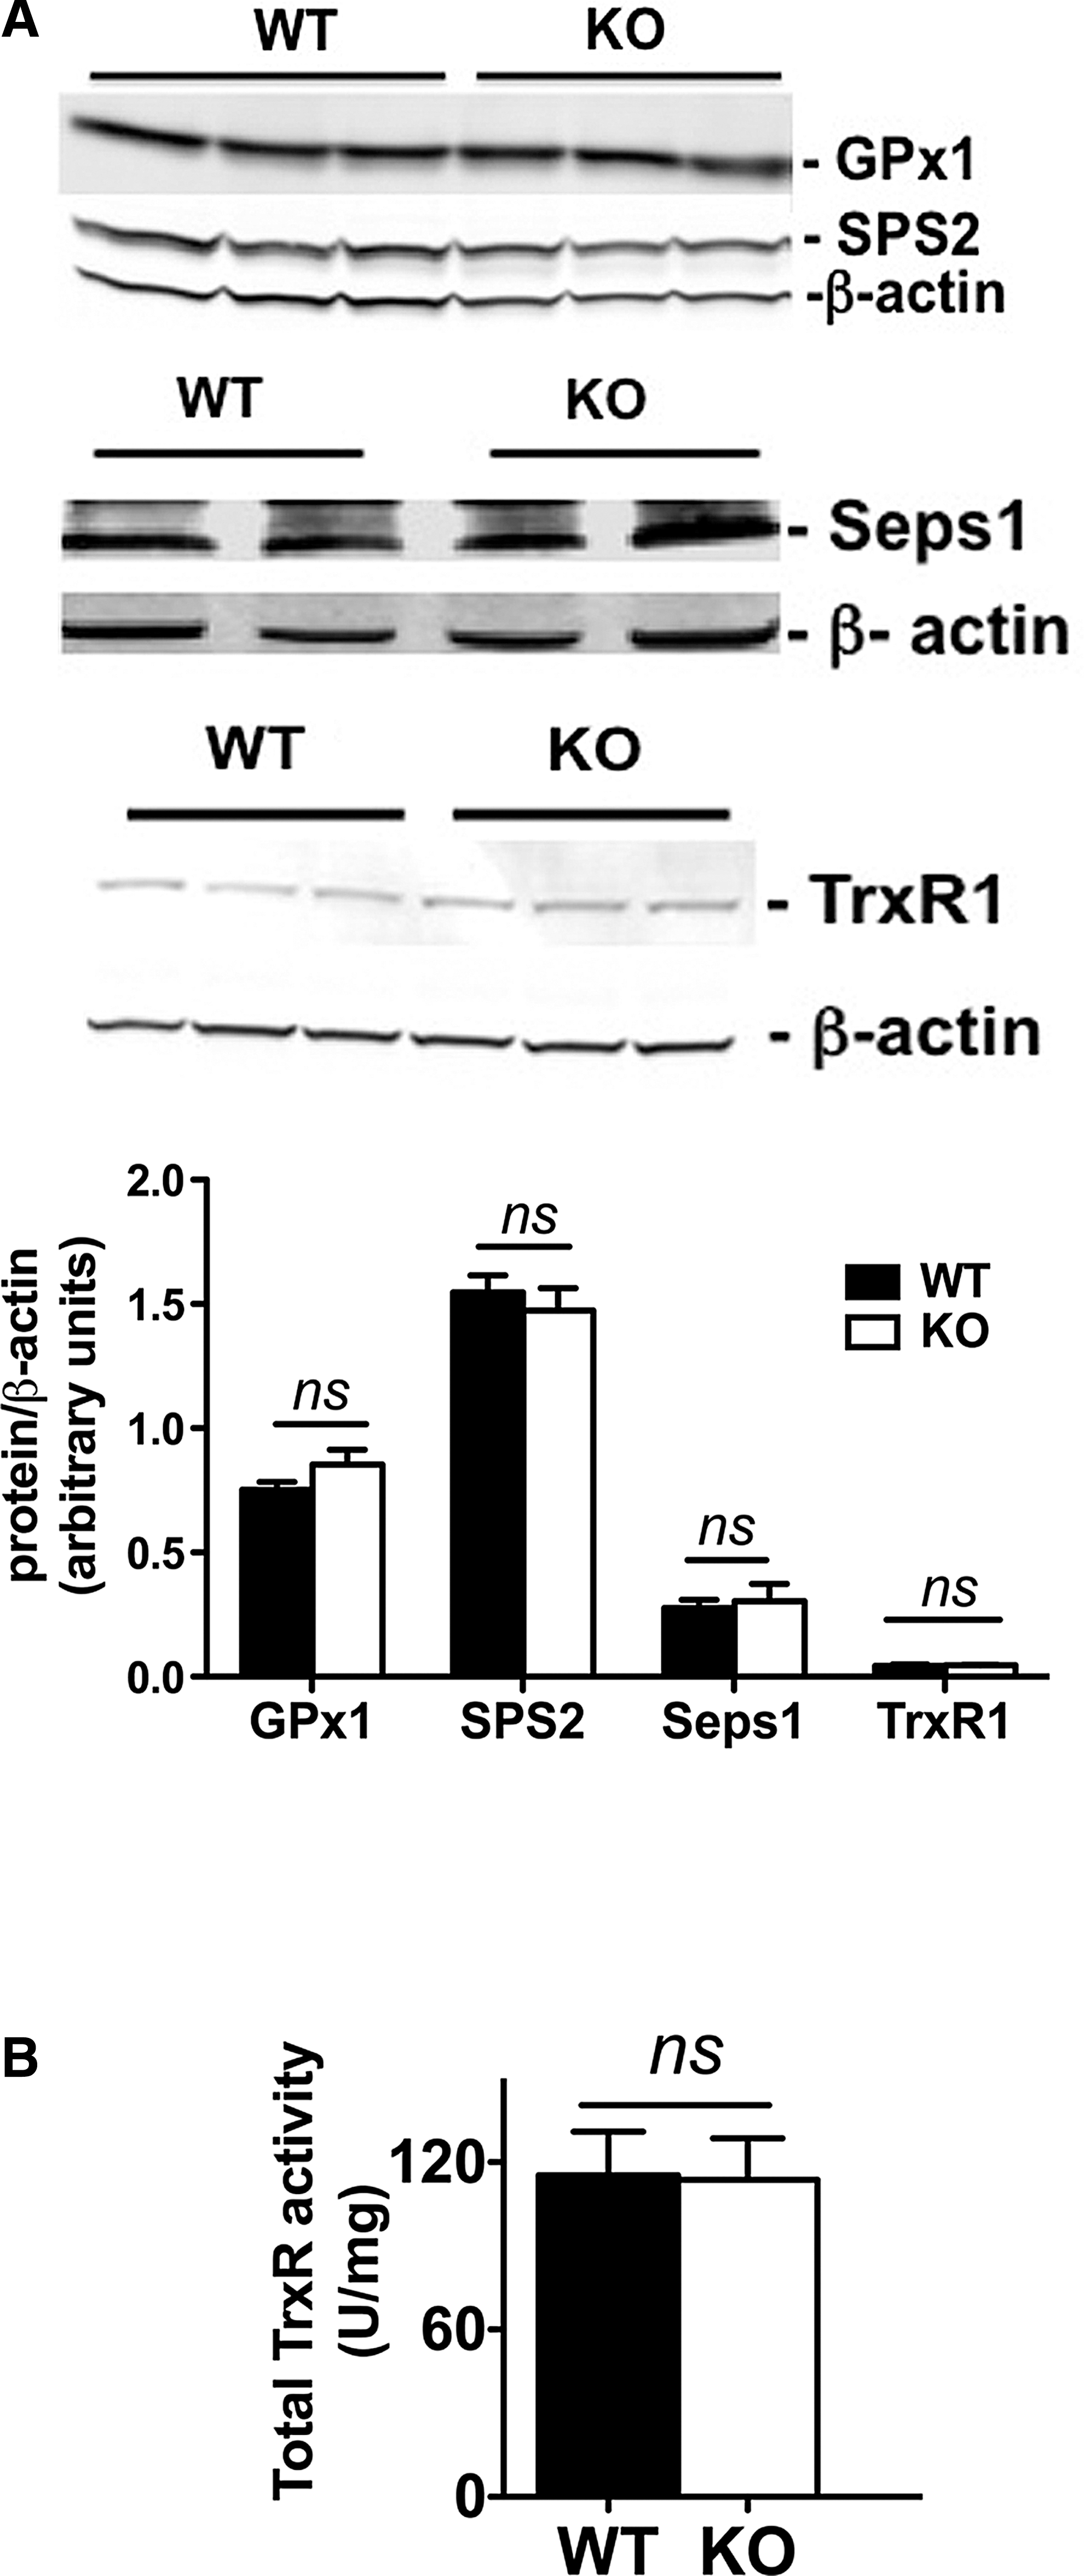
In accordance with an adequate selenium intake, mRNA of hepatic selenoproteins regulated by selenium, such as glutathione peroxidase 1 (GPx1), glutathione peroxidase 4 (GPx4), selenoprotein S (Seps1), and thioredoxin reductase 1 (TrxR1), was expressed at the same levels in the Scly KO and WT (Table 2). Gene expression of factors involved in selenium metabolism that directly interact with Scly (69), such as SPS1 and SPS2, was also unchanged (Table 2). Moreover, these mRNA expression patterns were maintained at the protein level, as we did not detect changes in liver expression of selenoproteins GPx1, SPS2, Seps1, and TrxR1 (Fig. 4A) or total activity of TrxR (Fig. 4B). Therefore, it is possible that the exacerbation of the metabolic disturbances observed in Scly KO mice fed a high-fat diet is independent of selenoprotein levels or activity.
Values are mean ± SEM and were normalized to GAPDH mRNA levels. Two-tailed Student's t-test (S) and nonparametric Mann–Whitney U test (MW) were used to compare averages. p-Values under 0.05 deemed significant; n = 3–4.
High-fat diet overactivates hepatic energy metabolism in obese Scly KO mice
The livers of Scly KO mice did not present upregulation in mRNA expression of enzymes involved in maintenance of pyruvate levels, such as malic enzyme (Me1), Pcx, and Pdh (Table 2). In addition, the mRNA levels of acetyl-CoA carboxylase 1 (ACC1) and ATP-citrate lyase (Acly), enzymes that regulate acetyl-CoA levels, were unchanged in Scly KO mice compared to WT mice (Table 2).
Nevertheless, we observed higher pyruvate levels in the livers of Scly KO mice than in their WT counterparts (Fig. 5A). Moreover, protein expression of Pcx and Pdh was increased (Fig. 5B). There was also a concomitant increased activity of citrate synthase (Fig. 5C), an enzyme that uses acetyl-CoA derived from pyruvate to produce citrate, the initial step of the TCA cycle. Together, these results suggest an overall enhancement of the initial steps of the TCA cycle.
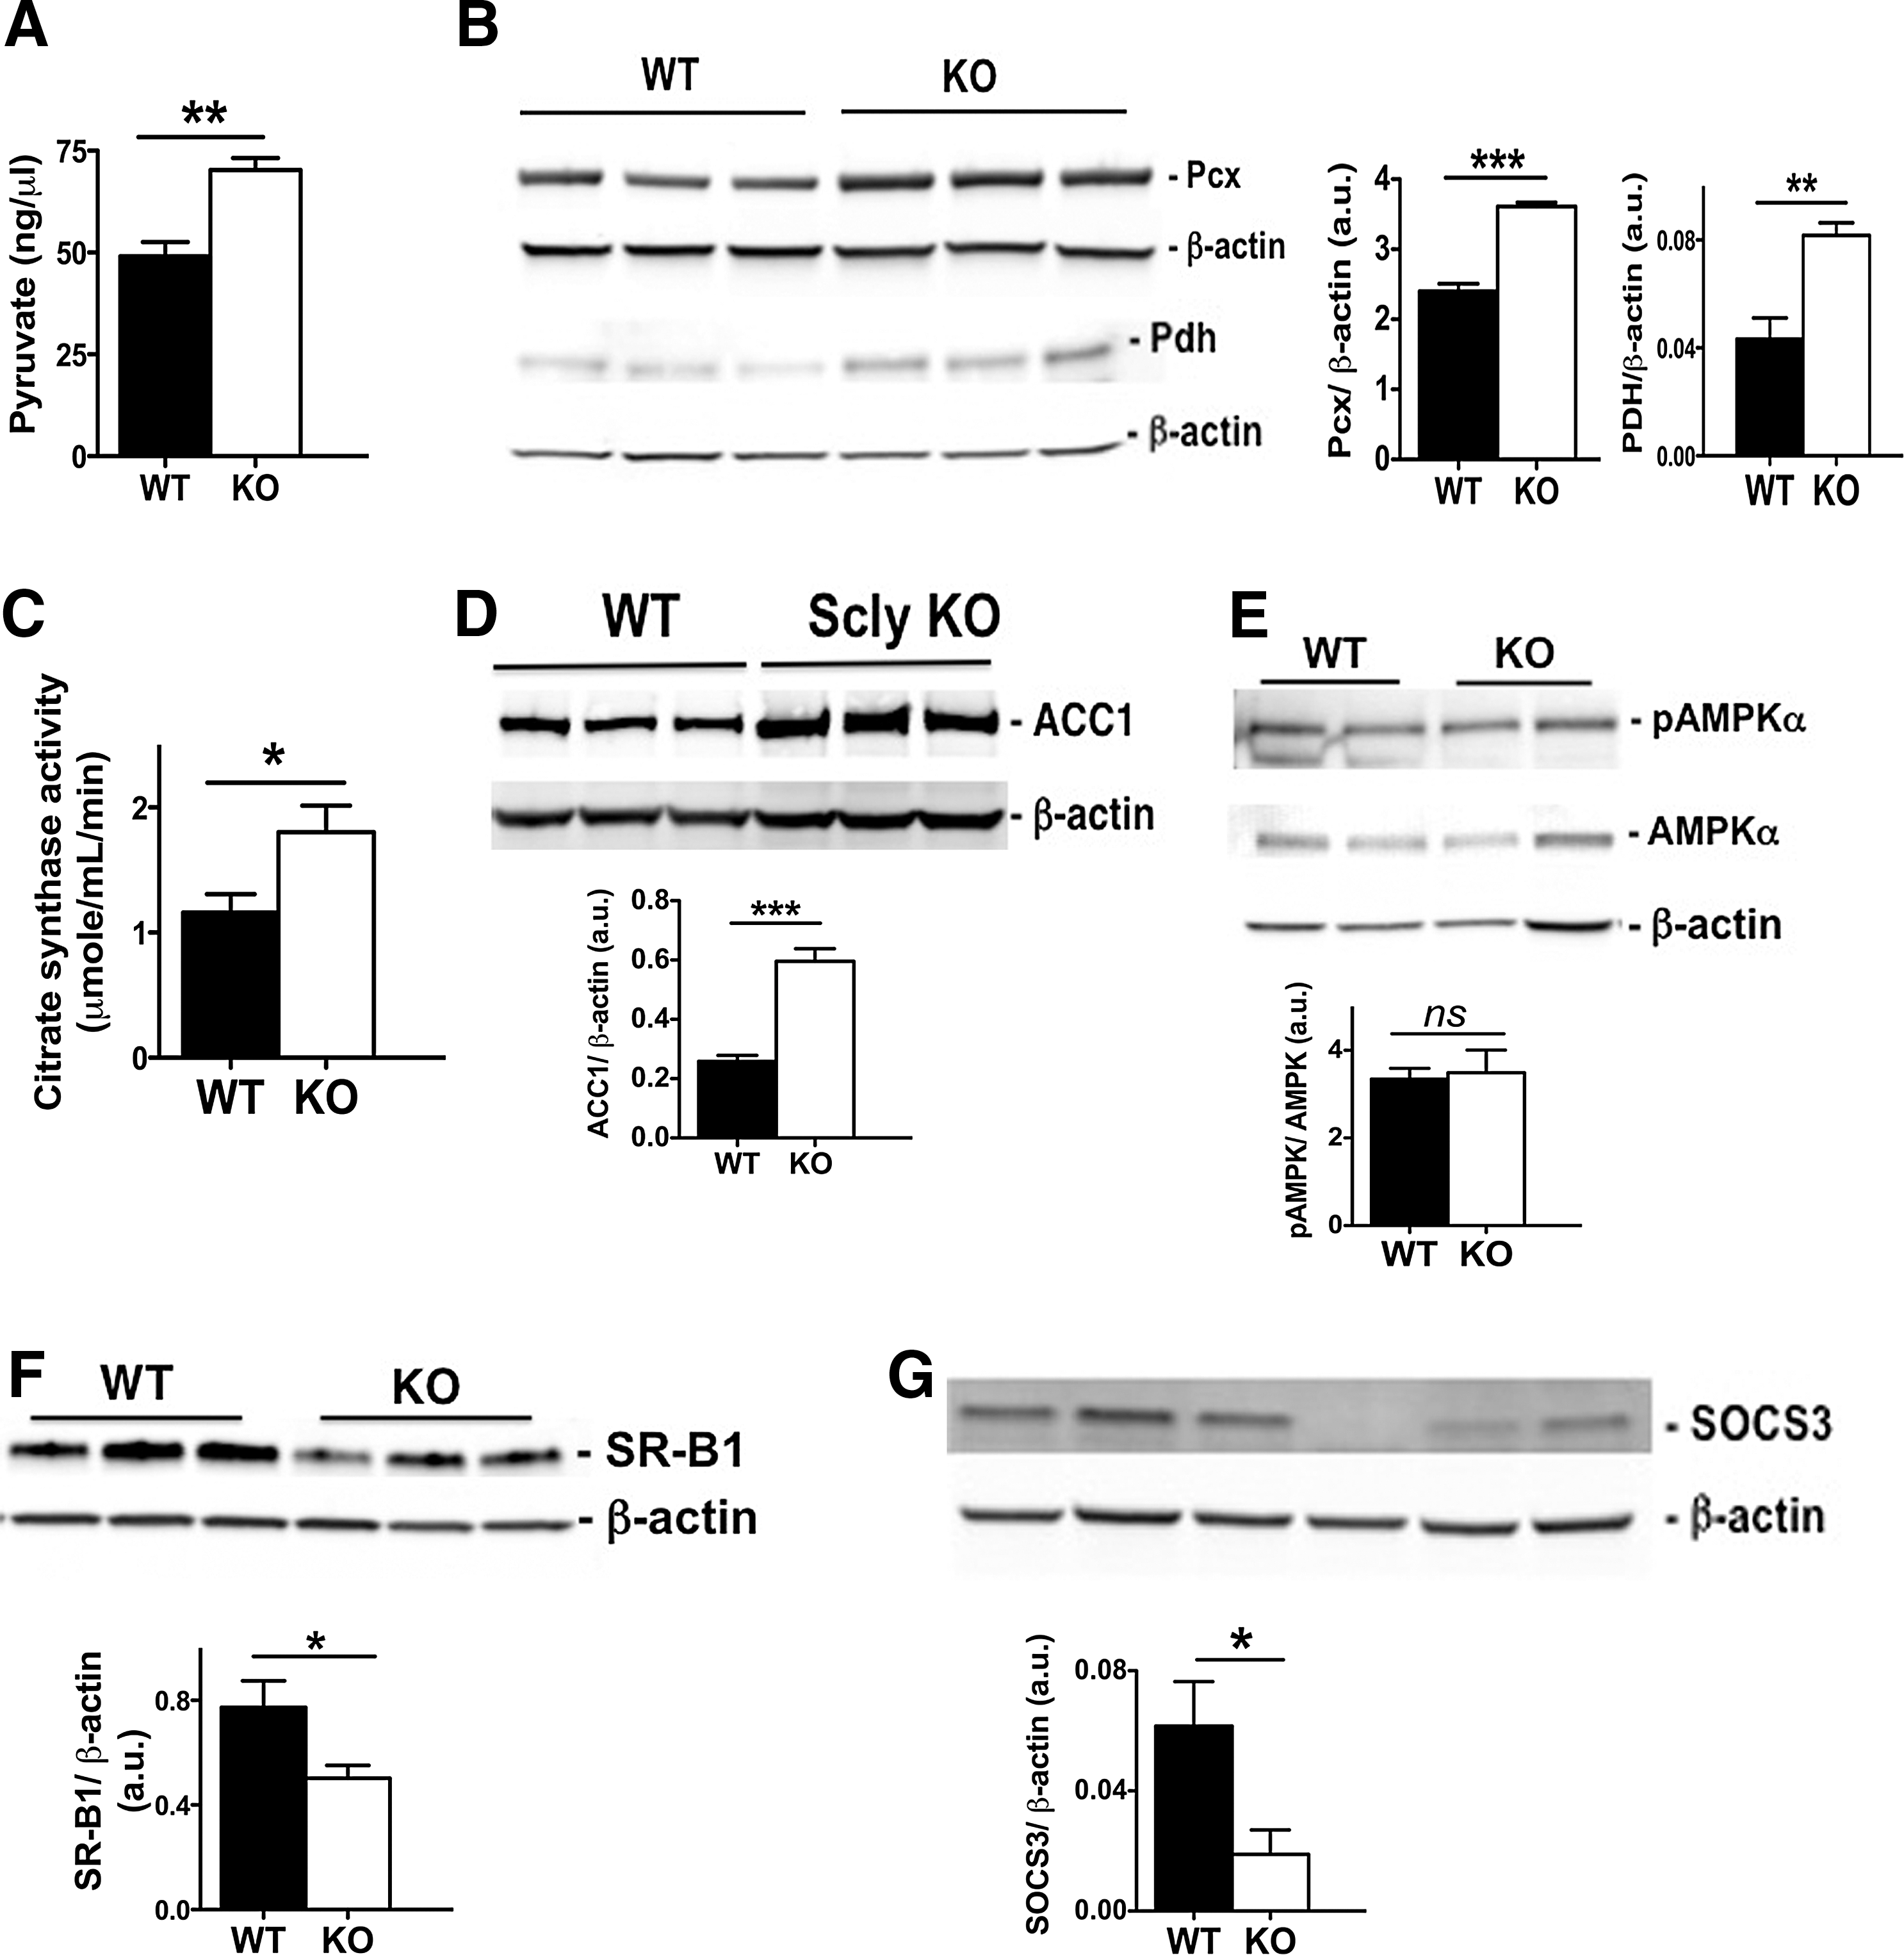
ACC1 is a key enzyme of de novo lipogenesis and its levels were also elevated in Scly KO mice compared to WT mice (Fig. 5D). Paradoxically, the downstream enzyme that coordinates the fate of acetyl-CoA toward carbohydrate or lipid metabolism, AMPKalpha, was activated in Scly KO mice at the same level as in the WT mice after high-fat diet intake (Fig. 5E). Another component of hepatic lipid metabolism was also affected by disruption of Scly. The scavenger receptor class B type 1 (SR-B1), a receptor of lipoproteins, including high-density and low-density lipoproteins, is highly expressed in the liver (74). SR-B1 is downregulated in mouse models of diabetes and metabolic syndrome (35, 44), and Scly KO mice fed a high-fat diet indeed presented a further decrease in its levels (Fig. 5F) compared to their WT counterparts. Moreover, despite doubling of circulating leptin levels in Scly KO mice (Table 1), their livers had significantly diminished expression of suppressor of cytokine signaling 3 (SOCS3) protein, a downstream effector of the leptin signaling pathway.
In vitro silencing of Scly does not affect expression of selenoprotein genes or metabolic genes
We were intrigued by the specific effect of Scly disruption in Sepp1 circulating levels and decided to further investigate whether Scly affects selenoprotein expression in murine Hepa1-6 cells. Upon silencing of Scly in Hepa1-6 cells by ∼50% through siRNA-mediated knockdown, we observed that the only measured selenoprotein that changed its mRNA expression was Sepp1, which was downregulated (Table 3). The expression of specific enzymes involved in energy metabolism or selenium metabolism previously assessed in our mouse model was maintained upon Scly silencing in Hepa1-6 cells (Table 3).
Values are mean ± SEM, and were normalized to Cphn2 levels. Average comparison by two-way ANOVA (2WA) with Bonferroni's post-test. p-Values were achieved by comparison with control, BSA-only parental cells, and values under 0.5 deemed significant and highlighted in bold/italic; n = 5 per group.
ANOVA, analysis of variance; BSA, bovine serum albumin.
In vitro silencing of Scly combined with exposure to palmitate affects expression of oxidative stress-related selenoproteins and metabolic enzymes
Initially, we treated Hepa1-6 cells with 0.4 mM palmitate, an in vitro treatment model demonstrated to increase Sepp1 levels in a different hepatocyte cell line model, the HepG2, mimicking a hyperlipidemic state in vivo (21). Hepa1-6 cells were able to withstand the lipid stress provided by the palmitate treatment dose. However, combination of silencing of Scly with palmitate treatment led to severely unhealthy cells (data not shown). To proceed with our in vitro investigation of the combined effects of Scly and palmitate, we halved the concentration of palmitate to 0.2 mM. Hepa1-6 cells, in which Scly was knocked down, combined with treatment with 0.2 mM palmitate for 24 h exhibited increases in TrxR1 and decreases in GPx1 and SPS2 mRNA levels, but not significant changes in Sepp1 or Seps1.
Interestingly, mRNA expression of metabolic enzymes Pcx, Pdh, ACC1, and Acly was diminished by palmitate treatment, but not affected by knocking down Scly in vitro. Nevertheless, when palmitate treatment was combined with Scly knockdown, Pdh was downregulated, while mRNA expression of the other enzymes mentioned above remained unchanged (Table 3).
Discussion
We previously demonstrated that Scly KO mice become obese and develop metabolic syndrome when dietary selenium is low, but caloric intake is adequate (55). The results presented herein suggest that, when selenium intake is adequate, a high caloric intake in the form of fat leads to obesity and metabolic syndrome development with greater severity in the Scly KO mice than in their WT counterparts. Obesity in Scly KO mice was accompanied by significant glucose and insulin intolerance, hyperinsulinemia, hypercholesterolemia, and increased oxidative stress in the bloodstream, all hallmarks of metabolic syndrome development and of disturbances in metabolic pathways.
This aggravated obesity phenotype did not result from elevated food intake nor from impairment of BAT-dependent energy expenditure regulation (Fig. 1D, F). Food satiety is regulated by leptin, and Scly KO mice doubled circulating leptin levels (Table 1). Obesity commonly leads to leptin resistance, which is followed by upregulation of SOCS3, one of the effector molecules of leptin signaling. Nevertheless, Scly KO mice presented downregulation of hepatic SOCS3 (Fig. 5G), suggesting that our Scly KO mice are not leptin resistant; in fact, mice with hepatocyte-specific deletion of SOCS3 were shown to develop obesity despite enhanced hepatic insulin sensitivity (52) and that could be the case for the Scly KO mice. It is possible that increased leptin is affecting other mechanisms of energy expenditure besides food consumption, possibly through regulation of a central mechanism (28, 46). Interestingly, iBAT was heavier (Fig. 1F), possibly indicating a compensatory mechanism to maintain a normal energy expenditure, and maintained UCP1 levels to curb the caloric overload. It remains to be investigated in further detail whether either adaptive thermogenesis in the Scly KO mice may be impaired and contributing to energy imbalance or additional effects of leptin caused by Scly action upon energy metabolism may be driving the aggravated obesity after a high-fat diet intake. Combined, these data suggest that energy imbalance is a result of altered metabolism.
Obesity is a crucial characteristic of metabolic syndrome development and is broadly defined by increases in fat tissue in several areas of the body. Selenium's effects on the molecular intricacies of WAT physiology that might interfere in energy metabolism remain an underinvestigated topic. Scly is present in WAT depots, although at low levels. Moreover, WAT Scly expression does not depend on selenium levels (55) and its physiological role in this tissue is currently unknown. It is possible that selenium recycling may affect adipocyte physiology in a subtle way.
Scly may be involved in responses to oxidative stress seen in WAT of obese mice through its role in selenoprotein synthesis and not in lipid metabolism. However, the fact that we previously observed no major changes in selenoprotein expression in the WAT (55) jeopardizes this hypothesis. Of all described selenoproteins, Seps1 has been the most investigated in WAT, with its expression enhanced in human WAT after treatment with insulin (45). In our model, the animals are severely hyperinsulinemic, however, it is unknown whether their WAT depots are insulin resistant as well. Therefore, specific effects and functional roles of Seps1 and Scly in lipid metabolism on the WAT remain to be investigated.
Seps1 influences inflammatory responses (9), and obesity is considered a chronic low-inflammatory state (6, 67) characterized by enhanced oxidative stress in rodents. We observed that the levels of Seps1 and other measured inflammatory markers are unchanged in the Scly KO mice. Greater fat accumulation in Scly KO mice fed a high-fat diet implies a greater production of secreted adipocyte hormones by the WAT depots in these mice. Despite enhanced leptin levels, circulating levels of the adipokine, adiponectin, and of TNFalpha were maintained both in Scly KO and in WT mice, as were other markers of systemic inflammation, such as MCP1 and IL-6. Insulin resistance has been shown to activate TNFalpha and IL-6 production in adipocytes (59). Thus, our results suggest that production of inflammatory cytokines may be neither impaired nor enhanced in the Scly KO mice exposed to fat overload, ruling out a potential cause for the severe obesity observed in the Scly KO mice when compared to their WT counterparts. It remains to be investigated, however, whether tissue-specific changes in cytokines might account for some of the worsening effects on carbohydrate and lipid metabolism.
It should be noted that serum GPx3 and hepatic GPx1 levels were not different between Scly KO and WT mice on a high-fat diet, despite increased oxidative stress in the serum. This same result emerged when animals were fed a standard selenium-adequate diet (55). It is possible that the defect in oxidative stress response is due to impairment of other reactive oxygen species-responsive enzymes after exposure to elevated lipid intake. Moreover, total circulating selenium content was maintained in both groups of mice. In that regard, it should be noted that our diet contained selenium as inorganic selenite, which allowed us a most appropriate comparison of the results described herein with our previous results as it can directly enter the selenium pool (55). However, as Scly utilizes Sec as its substrate, it is possible to infer that the observed effects on metabolism could be considerably different if the selenium source of the diet was an organic form, such as selenomethionine (SeMet). SeMet is decomposed through the transsulfuration pathway into Sec (27, 60), which can be utilized by Scly to provide selenium for selenoprotein synthesis (29). Nevertheless, SeMet is also incorporated nonspecifically in place of methionine (8), potentially hindering metabolic effects that are hard to distinguish. Feeding of selenite, therefore, allowed us to eliminate a possible confounding effect, as our mice Scly would act exclusively on Sec derived from degradation of selenoproteins, rather than Sec derived from transsulfuration pathway. Further studies are needed to assess whether feeding of organic forms of selenium, such as SeMet, could either circumvent or worsen the pathological effects observed in Scly KO mice.
Sepp1 is a secreted selenoprotein containing up to 10 Sec residues in rodents, thus acting as selenium carrier in the plasma (4), maintaining selenium availability in all tissues (51). Sepp1 has a previously established role in energy metabolism, possessing phospholipid peroxidase activity (3, 53), and acting on lipid metabolism through downregulating AMPKalpha activity, the central regulator of energy metabolism in the liver (43). Hepatic expression and secretion of Sepp1 were demonstrated to be increased in diabetic mouse models and humans with diabetes (43, 73). Moreover, Sepp1 deletion in rodents protects against development of obesity and hyperinsulinemia (43). We previously demonstrated that Scly KO mice properly produce Sepp1 in the liver and secrete it into the bloodstream (55). We also demonstrated that on a selenium-adequate diet, phosphorylation of AMPKalpha was maintained. In contrast, under selenium deficiency, AMPKalpha phosphorylation was decreased in the liver of Scly KO mice (55).
On a high-fat selenium-adequate diet as described in this study, phosphorylation of AMPKalpha was again maintained in Scly KO compared to WT mice. The fact that Sepp1 was more elevated in Scly KO mice than in WT mice, when both were on the path to metabolic syndrome, indicates an interesting specific effect of Scly in the regulation of Sepp1 levels. These findings raise additional exciting questions regarding the basic role of Sepp1 in transporting selenium to other organs, such as skeletal muscle and adipocytes, and the importance of this mechanism in energy homeostasis. One possible explanation for Sepp1 in Scly KO mice is that a truncated Sepp1 isoform is upregulated rather than a full-length protein, as it is the case in selenium deficiency (15, 57). Another possibility is that Sepp1 accumulates as a result of improper degradation due to Scly absence. Whether these conditions are affected by each other or if they act independently, representing a Sepp1-dependent action of Scly in metabolism, remains to be determined.
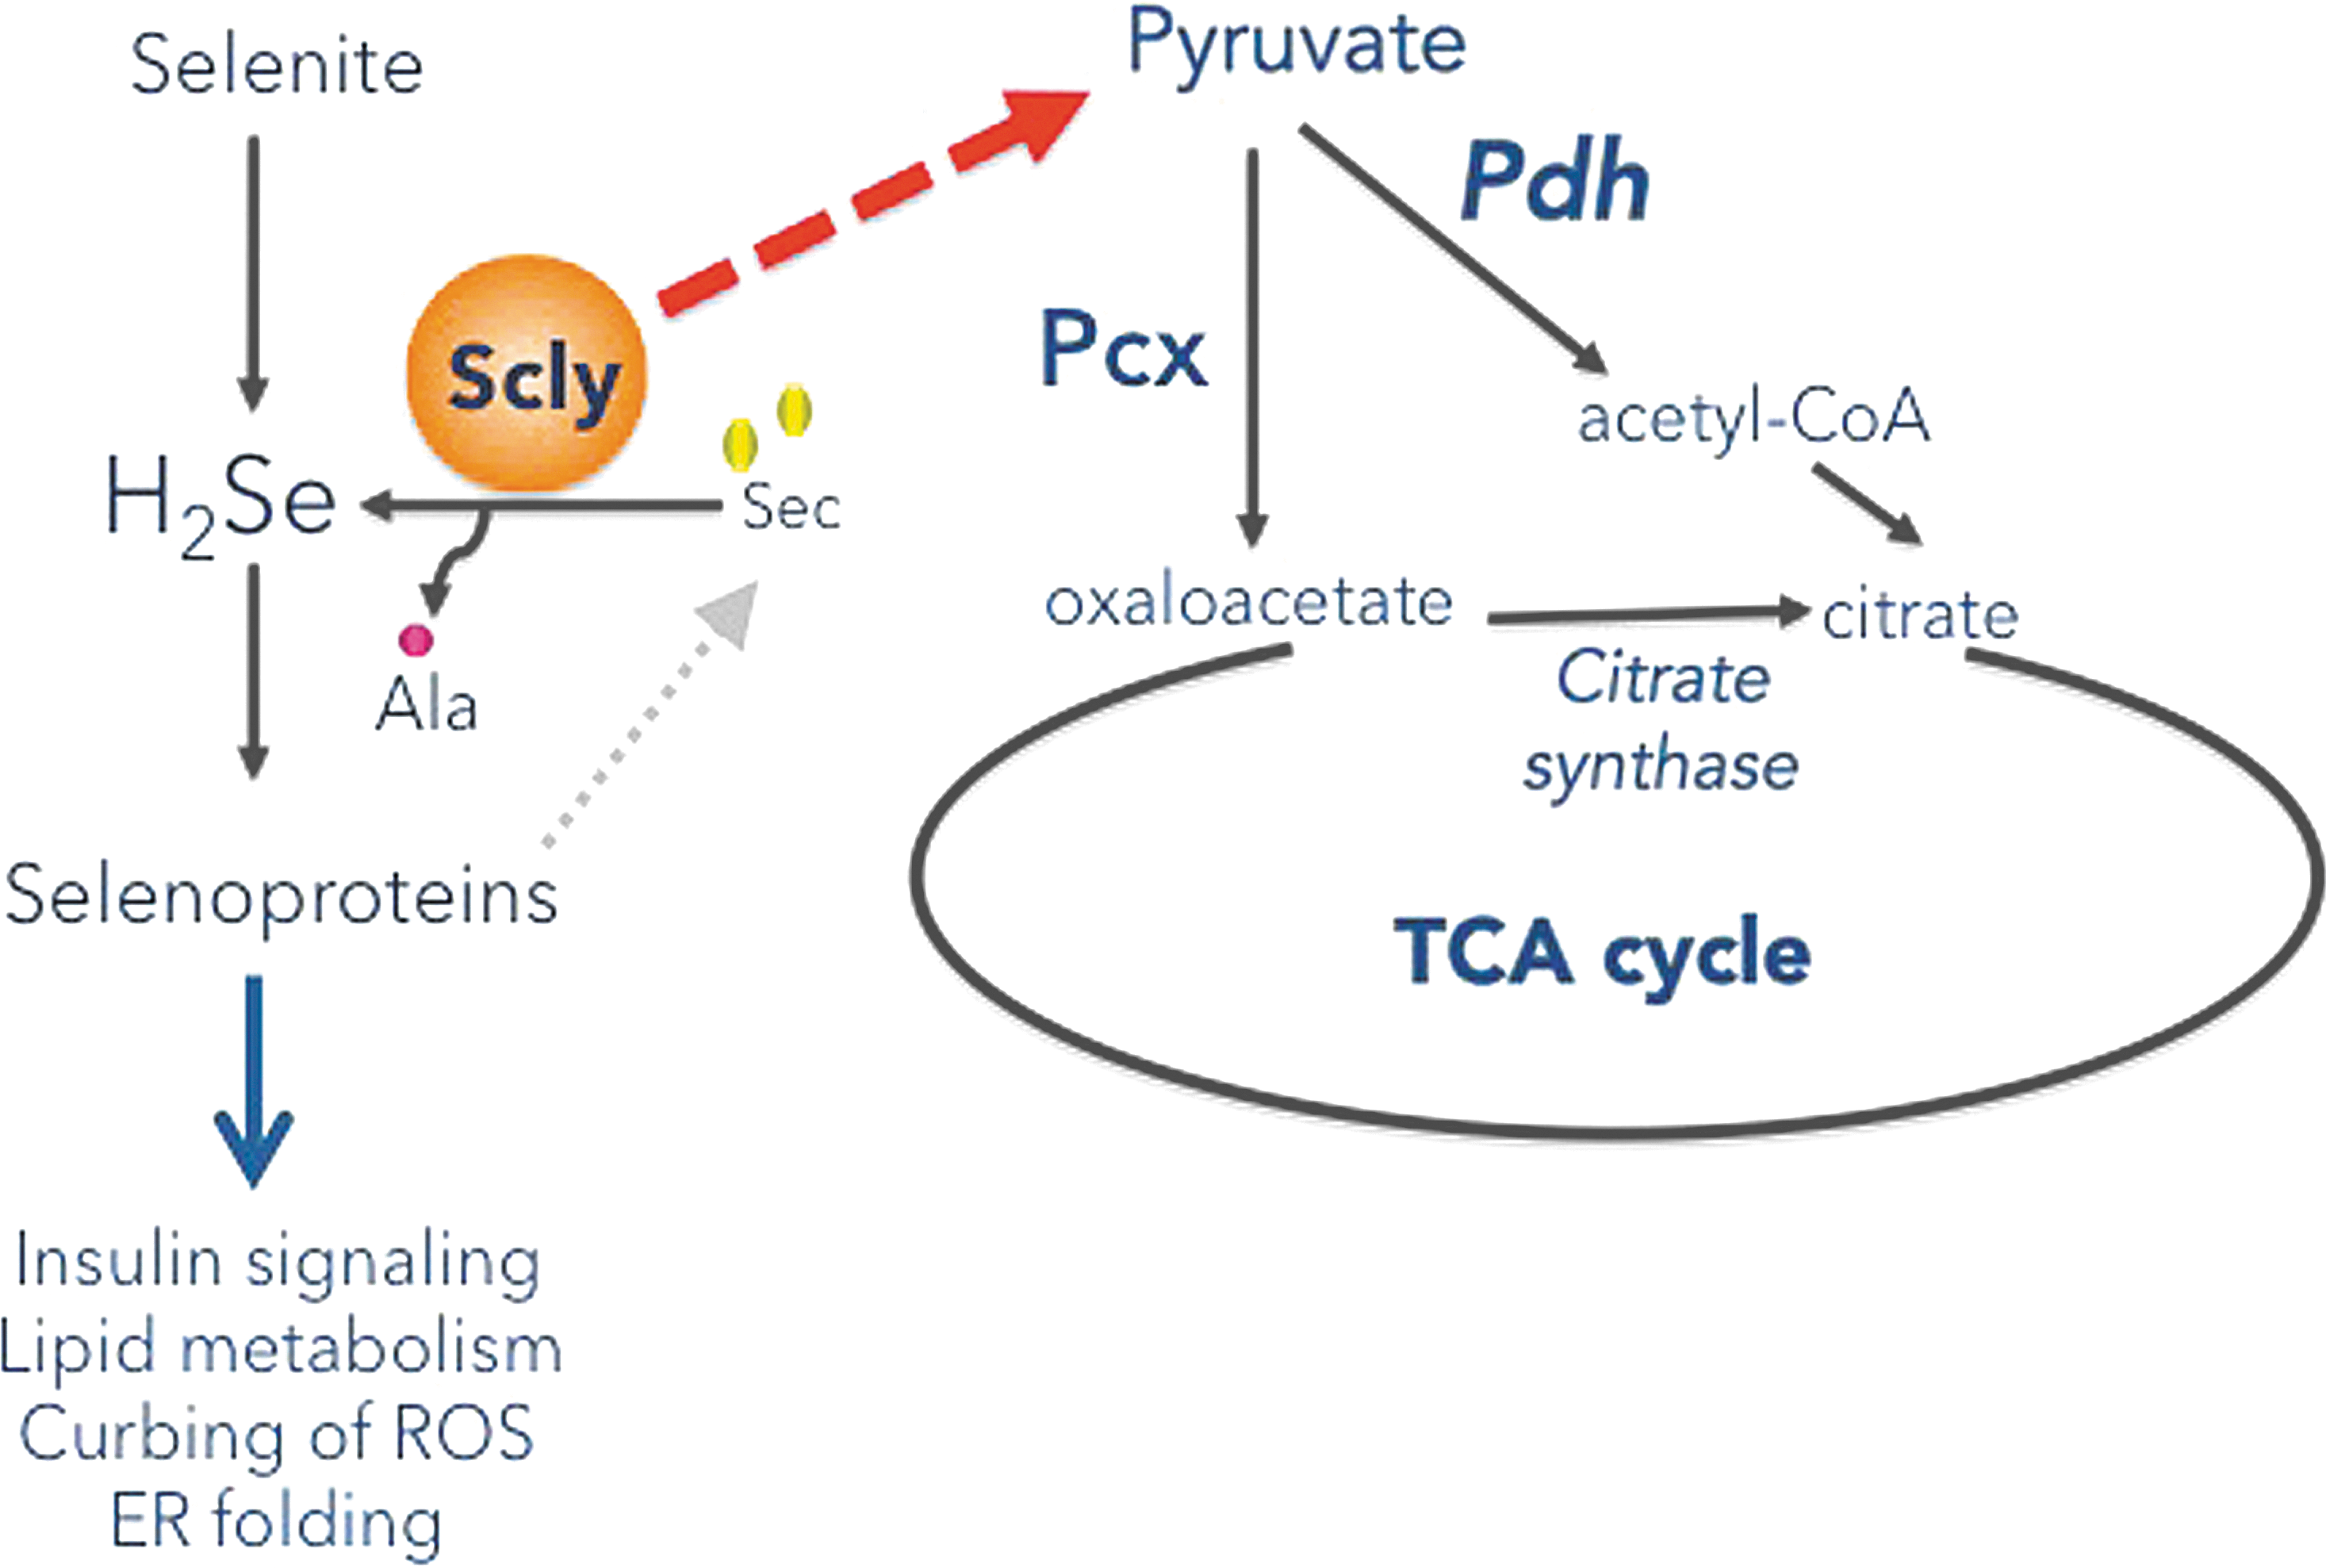
Nevertheless, we should consider that the role of Scly in energy metabolism may be minimally dependent on selenoprotein expression and primarily related to the Sec levels/decomposition per se. The fact that Scly KO mice on a selenium-adequate high-fat diet exhibited aggravated obesity compared to WT mice suggests that, under fat overload, a direct role of Scly on hepatic energy metabolism exists. Scly has been found in yeast two-hybrid system studies to interact with several enzymes involved in mitochondrial energy metabolism/respiratory chain, such as NADH dehydrogenase subunit 4L, ATP synthase A, and ATP synthase coupling factor 6 (30), as well as enzymes of carbohydrate and lipid metabolism, such as aldehyde reductase, squalene synthase, and farnesyl pyrophosphate synthase (69). It is possible that Scly, as it decomposes Sec, works as part of a supramolecular complex that funnels the products of this amino acid degradation to direct players in energy metabolism. Our data demonstrating elevated pyruvate levels, Pcx levels, and citrate synthase activity in the livers of Scly KO mice corroborate this exciting possibility and place Scly in the crossroad of Sec degradation and energy metabolism (Fig. 6).
Specifically, gluconeogenesis is increasingly favored as the mechanism mostly affected by, and interconnected to, selenium. Moreover, Sepp1 has been suggested to be a gluconeogenic enzyme, as it is regulated by the same transcription factors as glucose-6-phosphatase, another gluconeogenic enzyme (61, 63). Our results suggest that Scly absence disrupts pathways that are connected to this mechanism. Upon feeding of a high-fat diet, glucose and insulin intolerance develop in target tissues, and the liver starvation of glucose leads to gluconeogenesis activation. Decomposition of Sec promoted by Scly possibly contributes, at least partially, to gluconeogenesis. In fact, the combined results of Figure 5 suggest that, in the absence of Scly, an increased flux of pyruvate/acetyl-CoA is possibly available in the Scly KO mice liver, with elevated pyruvate allowing for increased gluconeogenesis and acetyl-CoA, enhancing TCA cycle flux and possibly activating lipogenesis as well.
We revealed herein that Scly KO mice were more susceptible to obesity induced by a high-fat diet. This susceptibility could be a direct result of increased Sepp1 expression. Hepatic Sepp1 secretion to the bloodstream may even be facilitated by a Scly-dependent mechanism still not described. Our results also reveal a novel role for Scly in negatively regulating gluconeogenesis and de novo lipogenesis. Nevertheless, this susceptibility cannot be a consequence of impaired hepatic selenoprotein biosynthesis, as most selenoproteins were produced at the same levels. Whether alterations in posttranslational modification or activities of these selenoproteins contribute to the phenotype we uncovered remains to be tested. Further investigation is necessary to elucidate a mechanistic relationship between Scly and energy metabolism.
Studies of selenium and its interconnection with pathways of lipid and carbohydrate metabolism are in their infancy, as Scly was regularly neglected when analyzing selenium metabolism. Our results unveiled Scly to possibly be a key mediator molecule in the crossroad between selenium and energy metabolism. By advancing the understanding of the role of Scly in energy metabolism, we might ground novel insights to the role of selenium in obesity and metabolic syndrome development.
Materials and Methods
Animals and diets
Development of Scly knockout (Scly−/− or Scly KO) mice was described previously (49). Weaned, age-matched homozygous Scly KO and WT homozygous littermates from C57BL/6J background were bred, born, and raised in the vivarium at the John A. Burns School of Medicine, University of Hawaii, Honolulu, HI, and, unless assigned to experiments, fed standard lab chow previously assessed to contain 0.2–0.25 mg/kg (ppm) of total selenium content (16), which is in the physiological range to avoid health risks in rodents (8) and to maintain selenoprotein production (68). Experimental animals were group caged and assigned for 4 months to a diet containing 45% kcal fat as lard and soybean oil, 35% kcal carbohydrate, mainly from starch, maltodextrin 10 and sucrose, and ∼0.2 ppm of selenium as sodium selenite, derived from the Mineral Mix S10026 (OpenSource Diets). High-fat diet pellets were branded OpenSource Diets, purchased from Research Diets, Inc. (catalog number D12451). Animals were weighed biweekly. Food consumption was measured in individually caged mice weekly for 9 weeks by weighing the leftovers of 100 g of high-fat diet supplied weekly into cages. Termination of experiments occurred when CO2 asphyxiation was performed for mice euthanization after 4 months of high-fat diet. Serum, liver, epididymal WAT (eWAT), ingWAT, and iBAT tissues were collected, weighed, and frozen in liquid nitrogen. eWAT, ingWAT, and iBAT weights were normalized to the body weight of the animal at the time of euthanasia. All experiments were conducted according to the protocol approved by the Institutional Animal Care and Use Committee of the University of Hawaii.
Chemicals and antibodies
All chemicals are from Sigma-Aldrich, except when specified from a different vendor. Mouse GPx1, GPx3 (R&D Systems), SOCS3, SR-B1, UCP1 (Abcam), ACC1, AMPKalpha, pAMPKalpha, Pdh (Cell Signaling), SPS2 (Rockland, Inc.), Pcx, alpha-tubulin, TrxR1 (Novus Biologicals), Seps1, and beta-actin (Sigma-Aldrich) antibodies were diluted according to the manufacturer's protocols. Rabbit polyclonal Sepp1 antibody (ProteinTech) was used at a 1:2000 dilution as described after validation experiments (55).
Cell culture
The male murine Hepa1-6 cell line was purchased from ATCC. Hepa1-6 cells were maintained in DMEM plus 10% fetal bovine serum (FBS) and 2 mM glutamine as suggested by the supplier. FBS batches from Life Technologies were tested before use for their selenium content, and the same lot, containing ∼300 nM total selenium content, was used throughout the experiments. Palmitate treatment consisted of exposure to 0.2 mM conjugated to 0.46% bovine serum albumin for 24 h and was performed as previously described (5). Silencing of Scly in Hepa1-6 cells was achieved using Lipofectamine RNAiMax Transfection Reagent (Life Technologies) with Trilencer-27 siRNA system, containing three unique 27mer siRNA duplexes specific to mouse Scly (OriGene).
Serum metabolic parameters
Commercially available ELISA kits were used to assay for mouse insulin (Alpco Immunoassays), leptin, testosterone (Crystal Chem, Inc.), and adiponectin (Otsuka Pharmaceutical Co. Ltd.). Plasma cholesterol was assessed using a commercial kit (Cayman Chemical Company). Oxidative stress status was assayed by measuring lipid peroxidation using the OxiSelect HNE-his Adduct ELISA Kit (Cell Biolabs, Inc.). All assays were performed according to the manufacturer's protocol. Cytokines TNFalpha, MCP1, and IL-6 were measured using the mouse Th1/Th2 Cytometric Bead Array Kit (BD Biosciences) and the MILLIPLEX MAP Mouse Adipokine Magnetic Bead Panel (Millipore) following the manufacturer's protocol. Data were collected in a BD FACSCaliber flow cytometer and in a Luminex 200® (Millipore) and analyzed using the Bio-Plex Manager (Bio-Rad) software.
Selenium content
Total selenium content was assessed by inductively coupled plasma–mass spectrometry (ICP-MS) at Exova, Inc., following the company's standard protocols for selenium analysis (SOP 7040, Rev 12). Samples portions (0.1–0.2 g) were mixed with internal standards and then diluted to a mass of 2 g with a solution of 0.1% ammonium hydroxide, 0.05% EDTA, and 0.05% Triton X-100. After dissolution, samples were analyzed in the ICP-MS. Detection limit of the instrument was 0.008 ppm (μg/g).
Activity assays
Total GPx activity was measured by the coupled enzyme procedure, as described previously (55). Total TrxR activity was assessed by the Thioredoxin Reductase Activity Assay Kit (Sigma-Aldrich). Pyruvate levels and citrate synthase activity were measured using the Pyruvate Assay Kit (Sigma-Aldrich) and the Citrate Synthase Assay Kit (Sigma-Aldrich), respectively, following the manufacturer's protocols. Assay results were calculated with the SoftMax Pro5 Software (Molecular Devices).
Glucose and insulin tolerance tests
Glucose tolerance test (GTT) and insulin tolerance test (ITT) were performed at 3 months after starting of high-fat diet feeding. Animals were fasted for 4 h before performance of GTT or ITT. Mice were injected with a bolus of glucose corresponding to 1 mg/g of body weight, and for GTT, blood glucose levels were measured in time intervals ranging from 15 to 180 min, with strips and a glucometer (OneTouch Ultra/LifeScan). For ITT, fasting mice were injected with a bolus of glucose and with insulin (Eli-Lilly) to a concentration of 0.75 U of diluted insulin (0.1 U/ml) per kg of body weight. Blood glucose levels were measured 15, 30, and 60 min after insulin injection using a glucometer.
Quantitative polymerase chain reaction
Real-time quantitative polymerase chain reaction (qPCR) was performed as previously described in our laboratory (17, 49, 55). Briefly, total RNA was extracted using TRIzol (Life Technologies) or RiboZol (Amresco LLC) followed by the RNeasy Clean-Up Kit (Qiagen), following the manufacturer's protocol, and quantified using a ND1000 spectrophotometer (NanoDrop Technologies-ThermoScientific). Reverse transcription was performed using the High-Capacity cDNA Reverse Transcription Kit (Life Technologies/Applied Biosystems), and 10 ng (liver or Hepa1-6 cells) of cDNA was used in qPCR with SYBR Green (Life Technologies). Analyses were performed using the ΔΔ −CT method using the LightCycler® 480 software release 1.5.0 in a LightCycler 480II (Roche). Values were normalized to levels of reference genes, and we tested 18S rRNA, hypoxanthine-guanine phosphoribosyltransferase (Hprt1), glyceraldehyde-3-phosphate dehydrogenase (Gapdh), or cyclophillin B (Cphn2) mRNAs. In our experimental design, Gapdh and Cphn2 were the most stable reference genes in liver and Hepa1-6 cells, respectively, and these genes were used for data normalization. Primer sequences used for qPCR, as well as amplicon size and Tm, can be found in Table 4. Primers were designed using the Primer3 software, and efficiency values between 1.95 and 2.05 were considered suitable for use in experiments, according to MIQE guidelines (20).
Western blot
Liver tissue was pulverized or Hepa1-6 cells were scraped, and proteins were extracted using the CelLytic MT reagent (Life Technologies) or a protocol specific for phosphoprotein extraction (43). Samples were then sonicated, centrifuged at 12,000 g for 10 min at 4°C, and supernatant containing proteins was collected. Ten to 30 μg of total protein, phosphoprotein, or 1 μl of mouse serum was separated by electrophoresis on 4–20% SDS-PAGE (Bio-Rad) and transferred to Immobilon-FL PVDF (IPFL) membranes (EMD Millipore). Membranes were probed with specific antibodies, and the protein expression levels were visualized using fluorescent secondary antibodies from LI-COR Biosciences. Serum protein samples were normalized by the pixel intensity of at least two bands in the same lane after staining with the Ponceau reagent. Detection and analyses of Western blot membranes were performed using an Odyssey Infrared Imager (LI-COR Biosciences).
Statistical analysis
Results were plotted and analyzed using Prism software (GraphPad Software, Inc.). Applied statistical tests, degrees of freedom, p-values, and sample size (n) are indicated in figure legends or table footnotes. All result values are expressed as mean ± SEM.
Footnotes
Acknowledgments
This work was funded by the National Institutes of Health, grants R01-DK47320 and G12-MD007601 to MJB, and Pilot Project Award funds from G12-MD007601 to LAS. Image of WT and Scly KO mice in ![]() was a courtesy of Ann Hashimoto. We thank FuKun Hoffmann, Maile O'Connell, Madhuri Namekar, Brooks Mitchell, and the COBRE Molecular and Cellular Immunology Core Facility at the University of Hawaii for helping with flow cytometry, and Dr. Frederick Bellinger for providing the mouse Sepp1 antibody. LAS designed and performed experiments, analyzed data, and wrote the article. ACH, ANO, and CLG performed experiments, analyzed data, and contributed with analytical tools. MJB mentored in all research steps. All authors discussed and reviewed the article.
was a courtesy of Ann Hashimoto. We thank FuKun Hoffmann, Maile O'Connell, Madhuri Namekar, Brooks Mitchell, and the COBRE Molecular and Cellular Immunology Core Facility at the University of Hawaii for helping with flow cytometry, and Dr. Frederick Bellinger for providing the mouse Sepp1 antibody. LAS designed and performed experiments, analyzed data, and wrote the article. ACH, ANO, and CLG performed experiments, analyzed data, and contributed with analytical tools. MJB mentored in all research steps. All authors discussed and reviewed the article.
Author Disclosure Statement
The authors declare no competing financial interests exist.