
Abstract
Introduction
E
HDACs are enzymes that maintain the dynamic equilibrium in acetylation levels of both nucleosomal histones and nonhistone proteins [reviewed in Refs. (33, 34, 52)]. In humans, HDACs are divided into four classes according to their sequence similarity and mechanism of catalysis. Nuclear HDAC class I includes four enzymes, HDAC1, HDAC2, HDAC3, and HDAC8 [reviewed in Refs. (33, 34, 52)], which have been shown to play a crucial role in cell cycle progression and proliferation. Class II HDACs (HDAC4, HDAC5, HDAC6, HDAC7, HDAC9, and HDAC10) have more tissue-specific functions and can shuttle between the nucleus and cytoplasm. Class III HDACs, also called sirtuins, are NAD-dependent enzymes unrelated to other HDACs and homologous to the yeast silent information regulator 2 (56). Finally, Class IV includes only one member (HDAC11) (16).
Our results lead to the identification of a relevant correlation between sensitivity/resistance to the histone deacetylase inhibitor and glutathione metabolism that can be further exploited for patient therapy, strengthening the notion that agents that target epigenetic alterations should be used not only as single agents but also in combination with other drugs.
HDACs are deregulated in many cancers, such as prostate, gastric, colon, and breast carcinomas, with expression levels correlating with prognosis and survival (19, 32, 53, 63 –66, 73). However, their contribution to tumorigenesis remains poorly understood, while it is of critical importance for the development of novel targeted therapies.
Indeed, HDACs are targets for antitumor drugs (69), and histone deacetylase inhibitors (HDACis) are a relatively new class of drugs with anticancer potential. Suberoylanilide hydroxamic acid (SAHA/Vorinostat), romidepsin, and belinostat have been recently approved for the treatment of refractory cutaneous T-cell lymphoma (21, 22, 43, 44), and several HDACis are currently in clinical trials for both solid and hematological malignancies. Interestingly, while SAHA is a pan-HDACi able to target class I, II, and IV HDACs, romidepsin shows higher selectivity against class I HDACs (33). An ongoing active area of investigation is whether selective HDACis are able to maintain a strong antitumor activity, while decreasing toxicity, compared with pan-HDACi (33).
Interestingly, SAHA has been proposed to have the ability to push reactive oxygen species (ROS) levels in malignant cells past a particular threshold, inducing cell death (38, 46).
In this study, we sought to determine whether breast cancer patient responsiveness to SAHA treatment could be mediated by ROS levels and intracellular antioxidant mechanism regulation. With this aim, we first identified breast cancer cell models resembling cancer cell patient responsiveness. Transcriptional profiling of these cancer cell lines identified a signature between SAHA-sensitive and SAHA-resistant cell lines, among which redox genes (especially belonging to the glutathione metabolism) were enriched. We then validated this finding in primary samples by showing that glutathione depletion can sensitize resistant tumors to SAHA. This points to an important role of antioxidant-dependent mechanisms in SAHA resistance, suggesting that this is a potential factor to consider when devising appropriate treatments with HDACi.
Results
In vitro responsiveness of primary breast cancer cell cultures to SAHA treatment
Eighty breast cancer samples were put in culture and analyzed for sensitivity to SAHA within early passages (12, 39). Cells were stained with crystal violet (CV) to assess cell growth after exposure to the HDACi over a period of 6 days and replenishment of the drug every 24 h. As expected, SAHA-treated cells displayed a higher level of acetylated histone H4, showing inhibition of cellular HDACs (Supplementary Fig. S1; Supplementary Data are available online at
We used CV as a quantitative measurement. Tumors were classified as resistant (R) when we observed less than 50% reduction in CV staining and as sensitive (S) when we observed more than 50% reduction in CV staining. Figure 1A and B depict examples of primary tumor cultures showing the various observed responses (Fig. 1A shows two different sensitive tumors, whereas Fig. 1B shows two different resistant tumors). Quantification of vitality between the two groups was found to be highly statistically significant at any SAHA concentration (Fig. 1C, Benjamini–Hochberg-corrected p-value≤1e-10, Wilcoxon rank-sum test). Notably, 59% of the tumors showed resistance to SAHA treatment, whereas 41% responded to the HDACi (Fig. 1D), suggesting a mechanism of resistance for this HDACi.
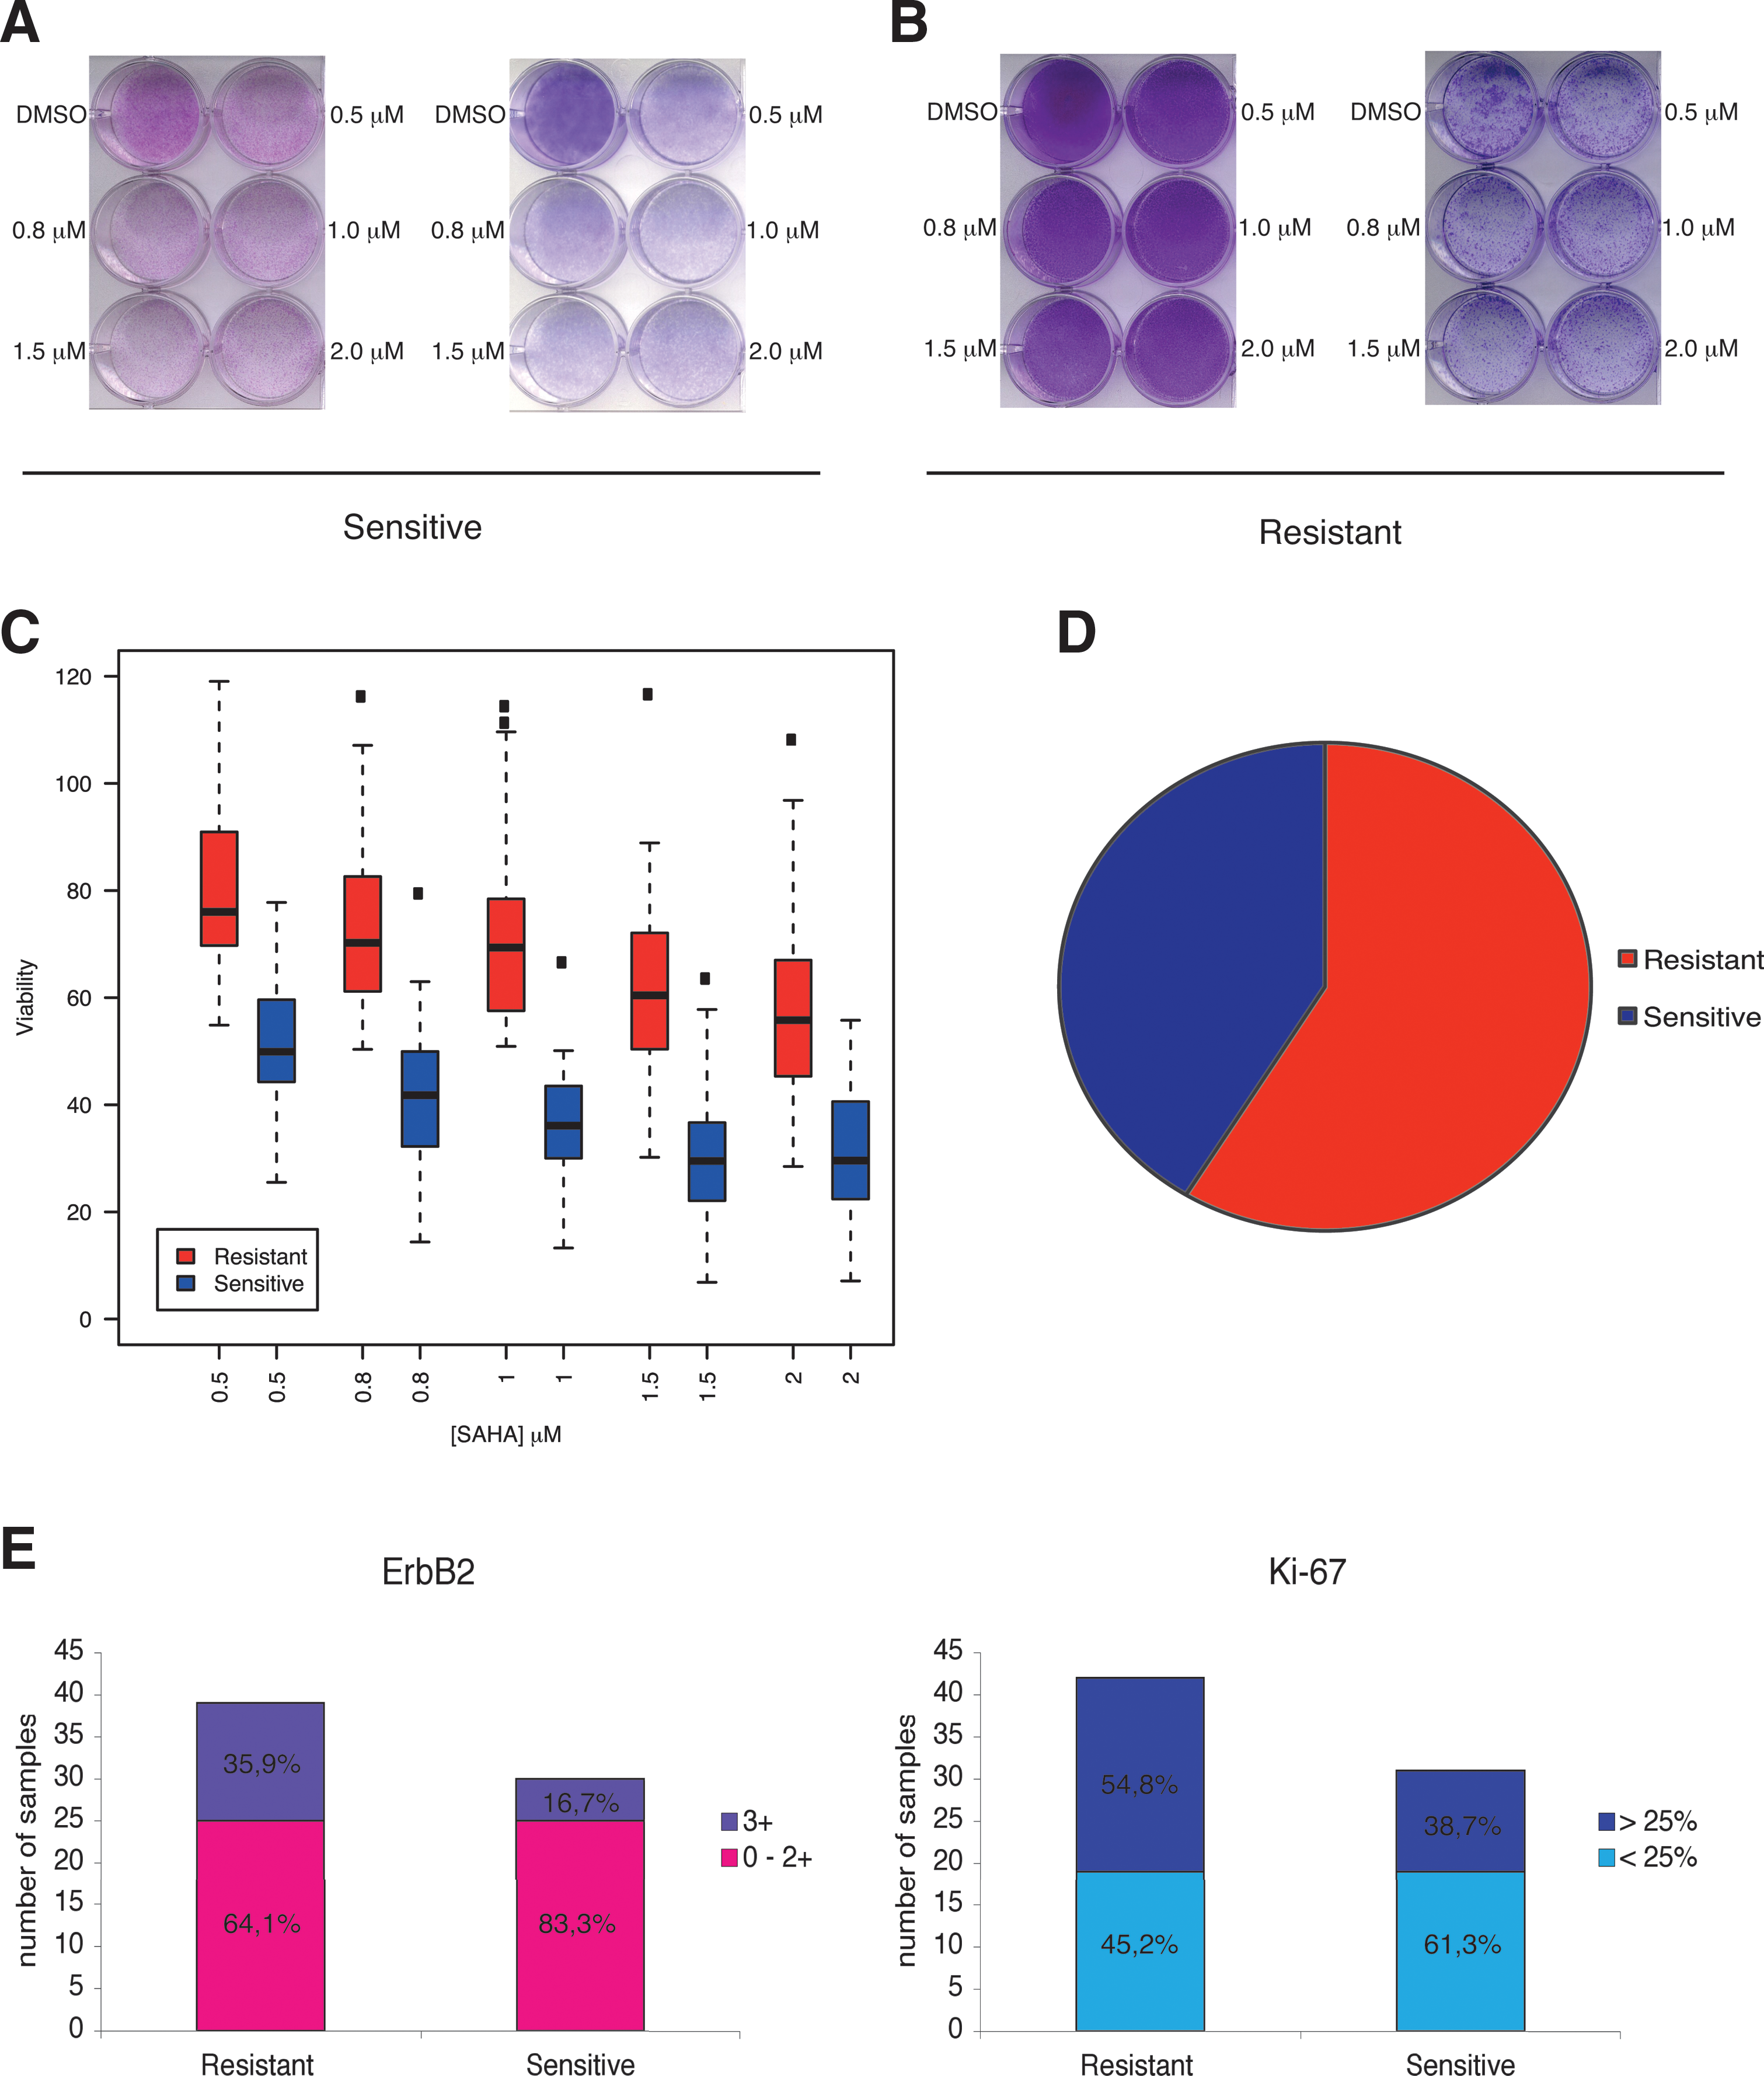
Analysis of the tumor properties of the 80 cases showed that the more resistant tumors were also considered more aggressive, owing to elevated levels of c-ERBB2 (3+) and a higher proliferative index (Ki67 greater than 25%) (Fig. 1E). In breast cancer, cancer-causing genes such as erbB2 can provide survival signals to tumorigenic cells and are thus considered as poor prognosis markers. Thus, in primary breast cancer tissues, resistance to SAHA is possibly associated with specific tumor clinical properties (Fig. 1E, Supplementary Fig. S2, and Supplementary Fig. S3).
Analysis of SAHA response in a panel of human breast cancer cell lines
Although primary cultures are likely to more closely represent tumors in their native environment, the number of cells and the limited timeframe in which cells are viable in culture make them a non-ideal model system for molecular studies. Furthermore, their higher genetic (23), and perhaps also epigenetic, heterogeneity hampers prediction studies.
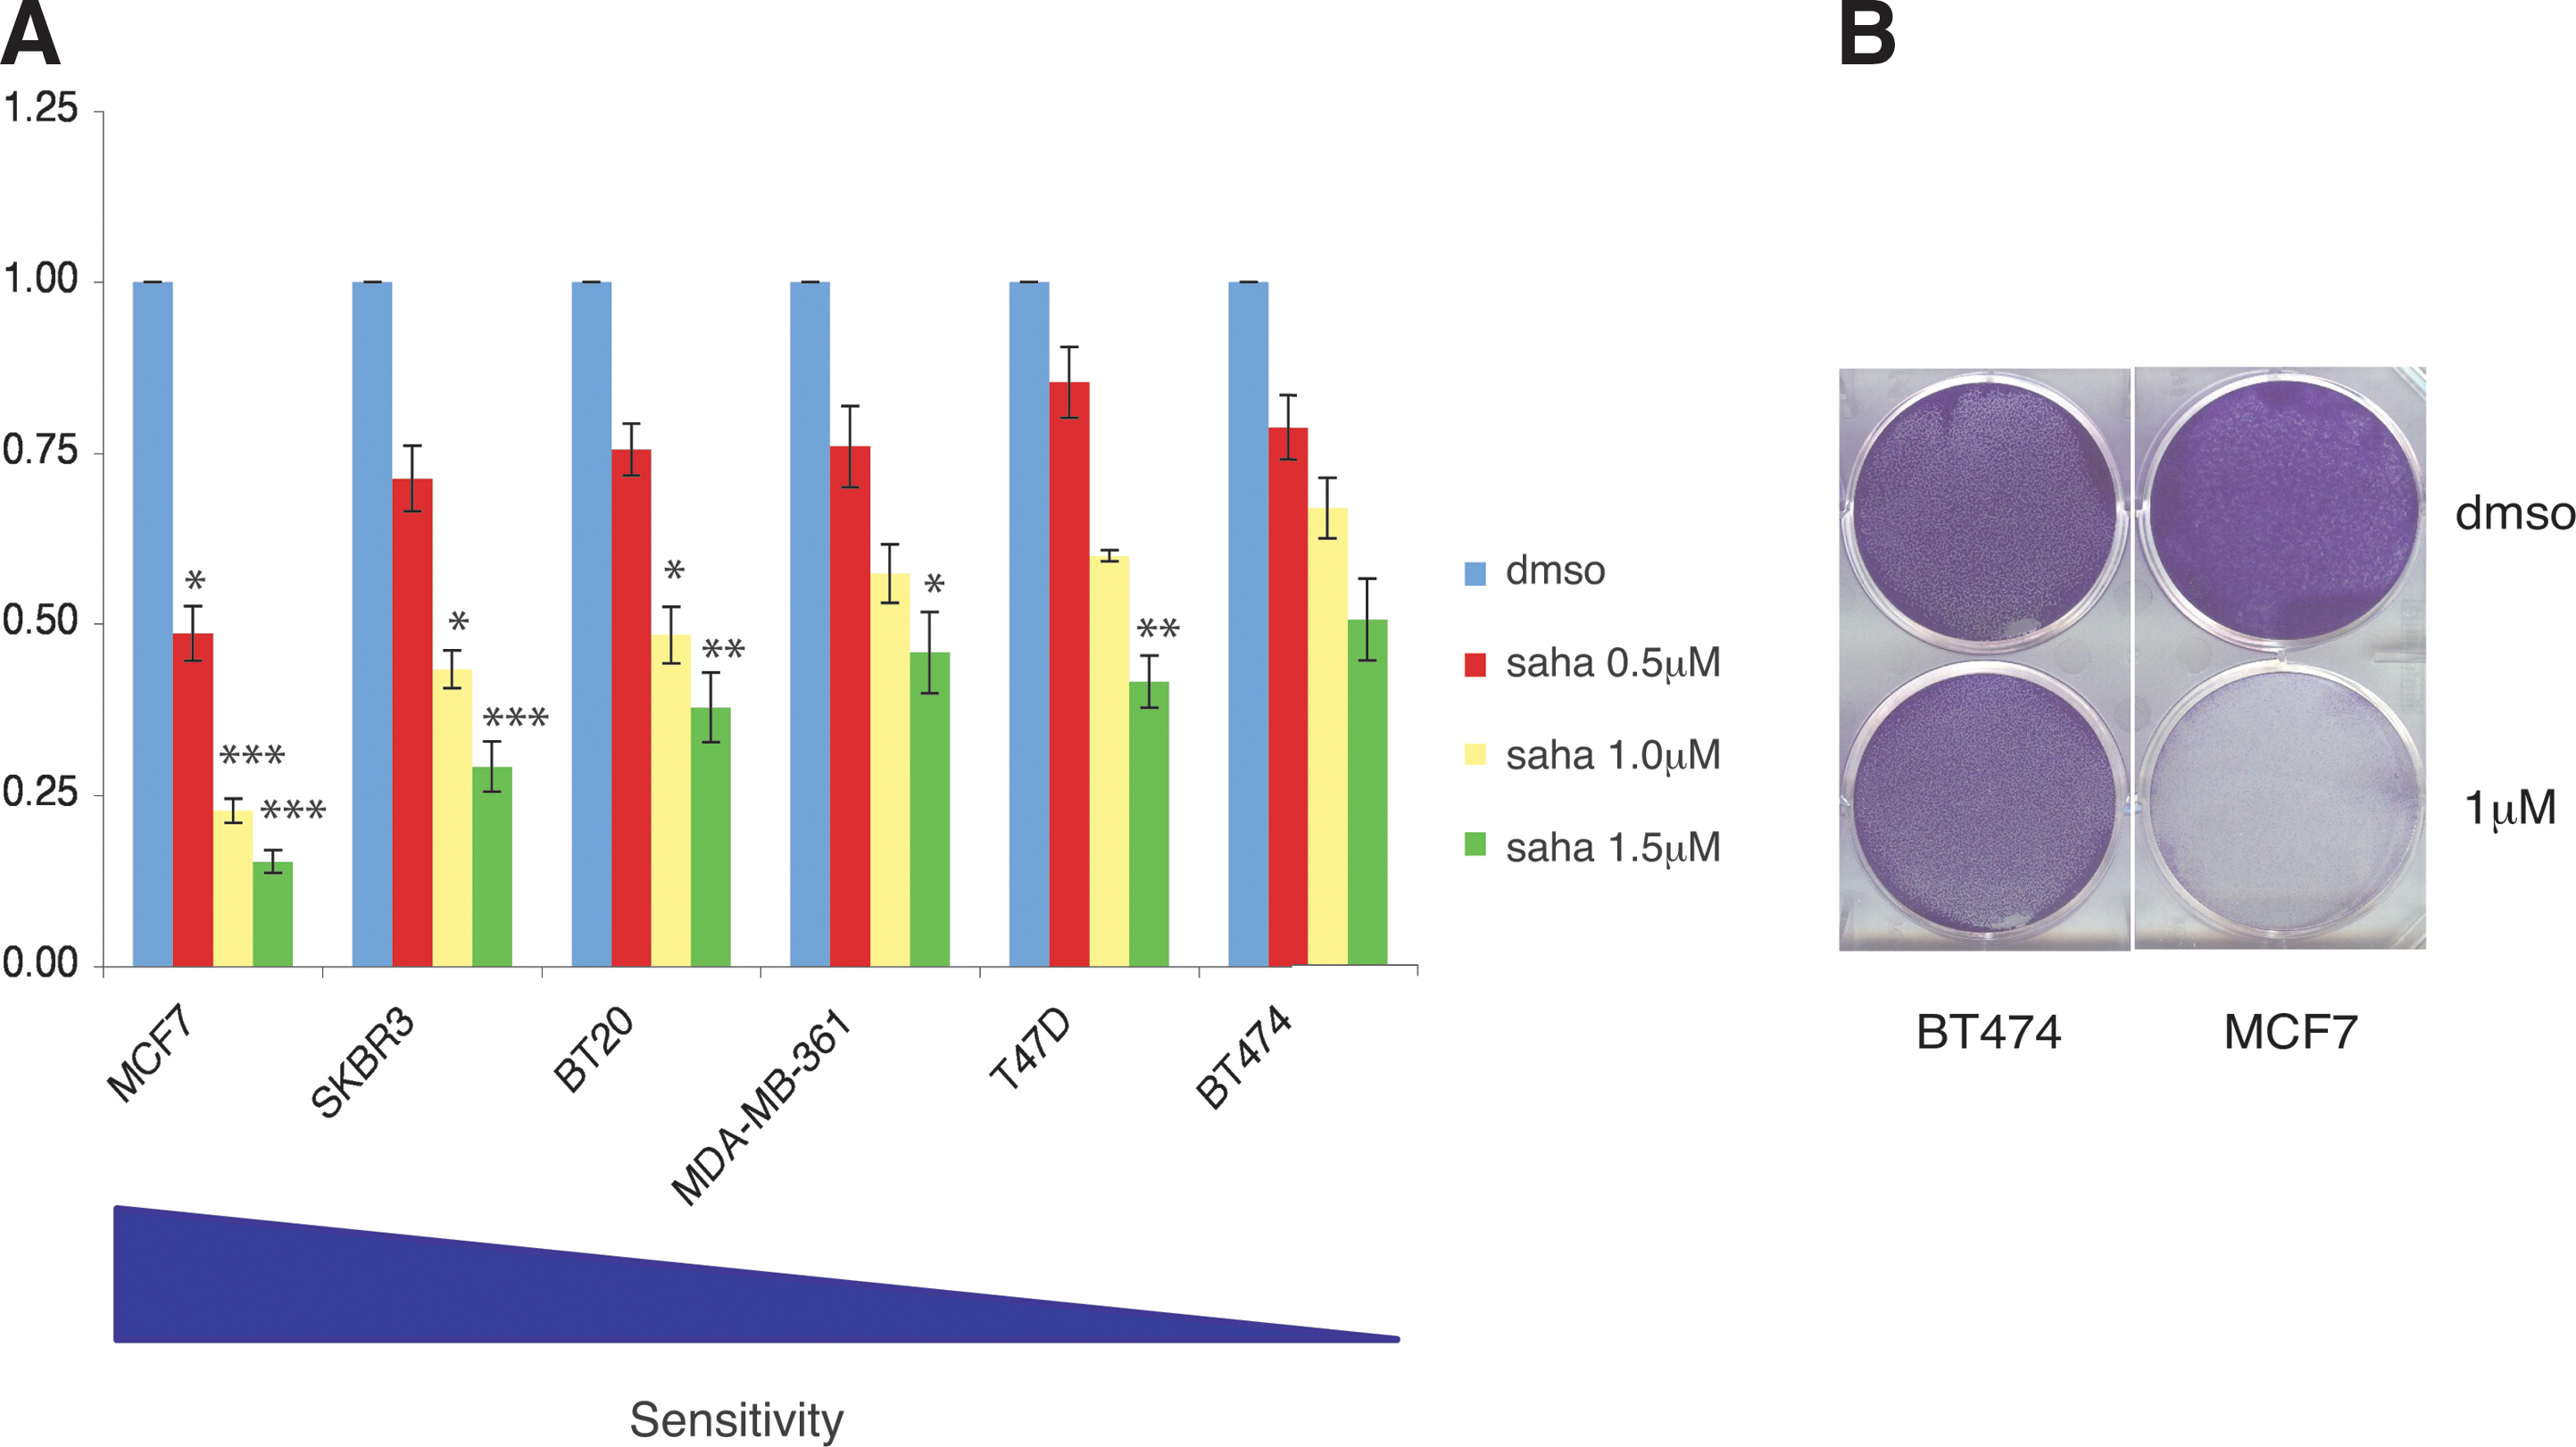
We therefore explored the possibility to use established cell lines for our studies and sought responsiveness to SAHA treatment in six human epithelial breast cancer cell lines, namely MCF7, SK-BR-3, BT-20, MDA-MB-361, T47D, and BT-474. Upon incubation with a different concentration of SAHA over a period of 6 days, we could detect a differential response (Fig. 2A). Interestingly, MCF7, SK-BR-3, and BT-20 cell lines were the most sensitive to SAHA treatment, whereas MDA-MB-361, T47D, and BT-474 were the least sensitive (Fig. 2A). Importantly, CV viability experiments (Fig. 2B) confirmed that at the SAHA concentration of 1 μm, MCF7 cells were the most sensitive and BT474 the least sensitive.
Gene expression profiling and validation of breast cancer cell lines
We performed gene expression profiling of the six cell lines (three sensitive and three resistant) in triplicates using Affymetrix GeneChip Human Gene 1.0 ST.
After data normalization and annotation, principal component analysis (PCA) was performed using as input all those genes showing a significant difference among the six cell lines (analysis of variance [ANOVA], see the Materials and Methods section). PCA was used to transform the gene expression profiles of the six cell lines considered, reducing the thousands of genes identified by the ANOVA to three main components (Fig. 3A). This plot indicates that the gene expression profiles of the SAHA-resistant lines (in red) are more similar among them compared with the SAHA-sensitive lines (in blue), with the latter also showing higher variability.
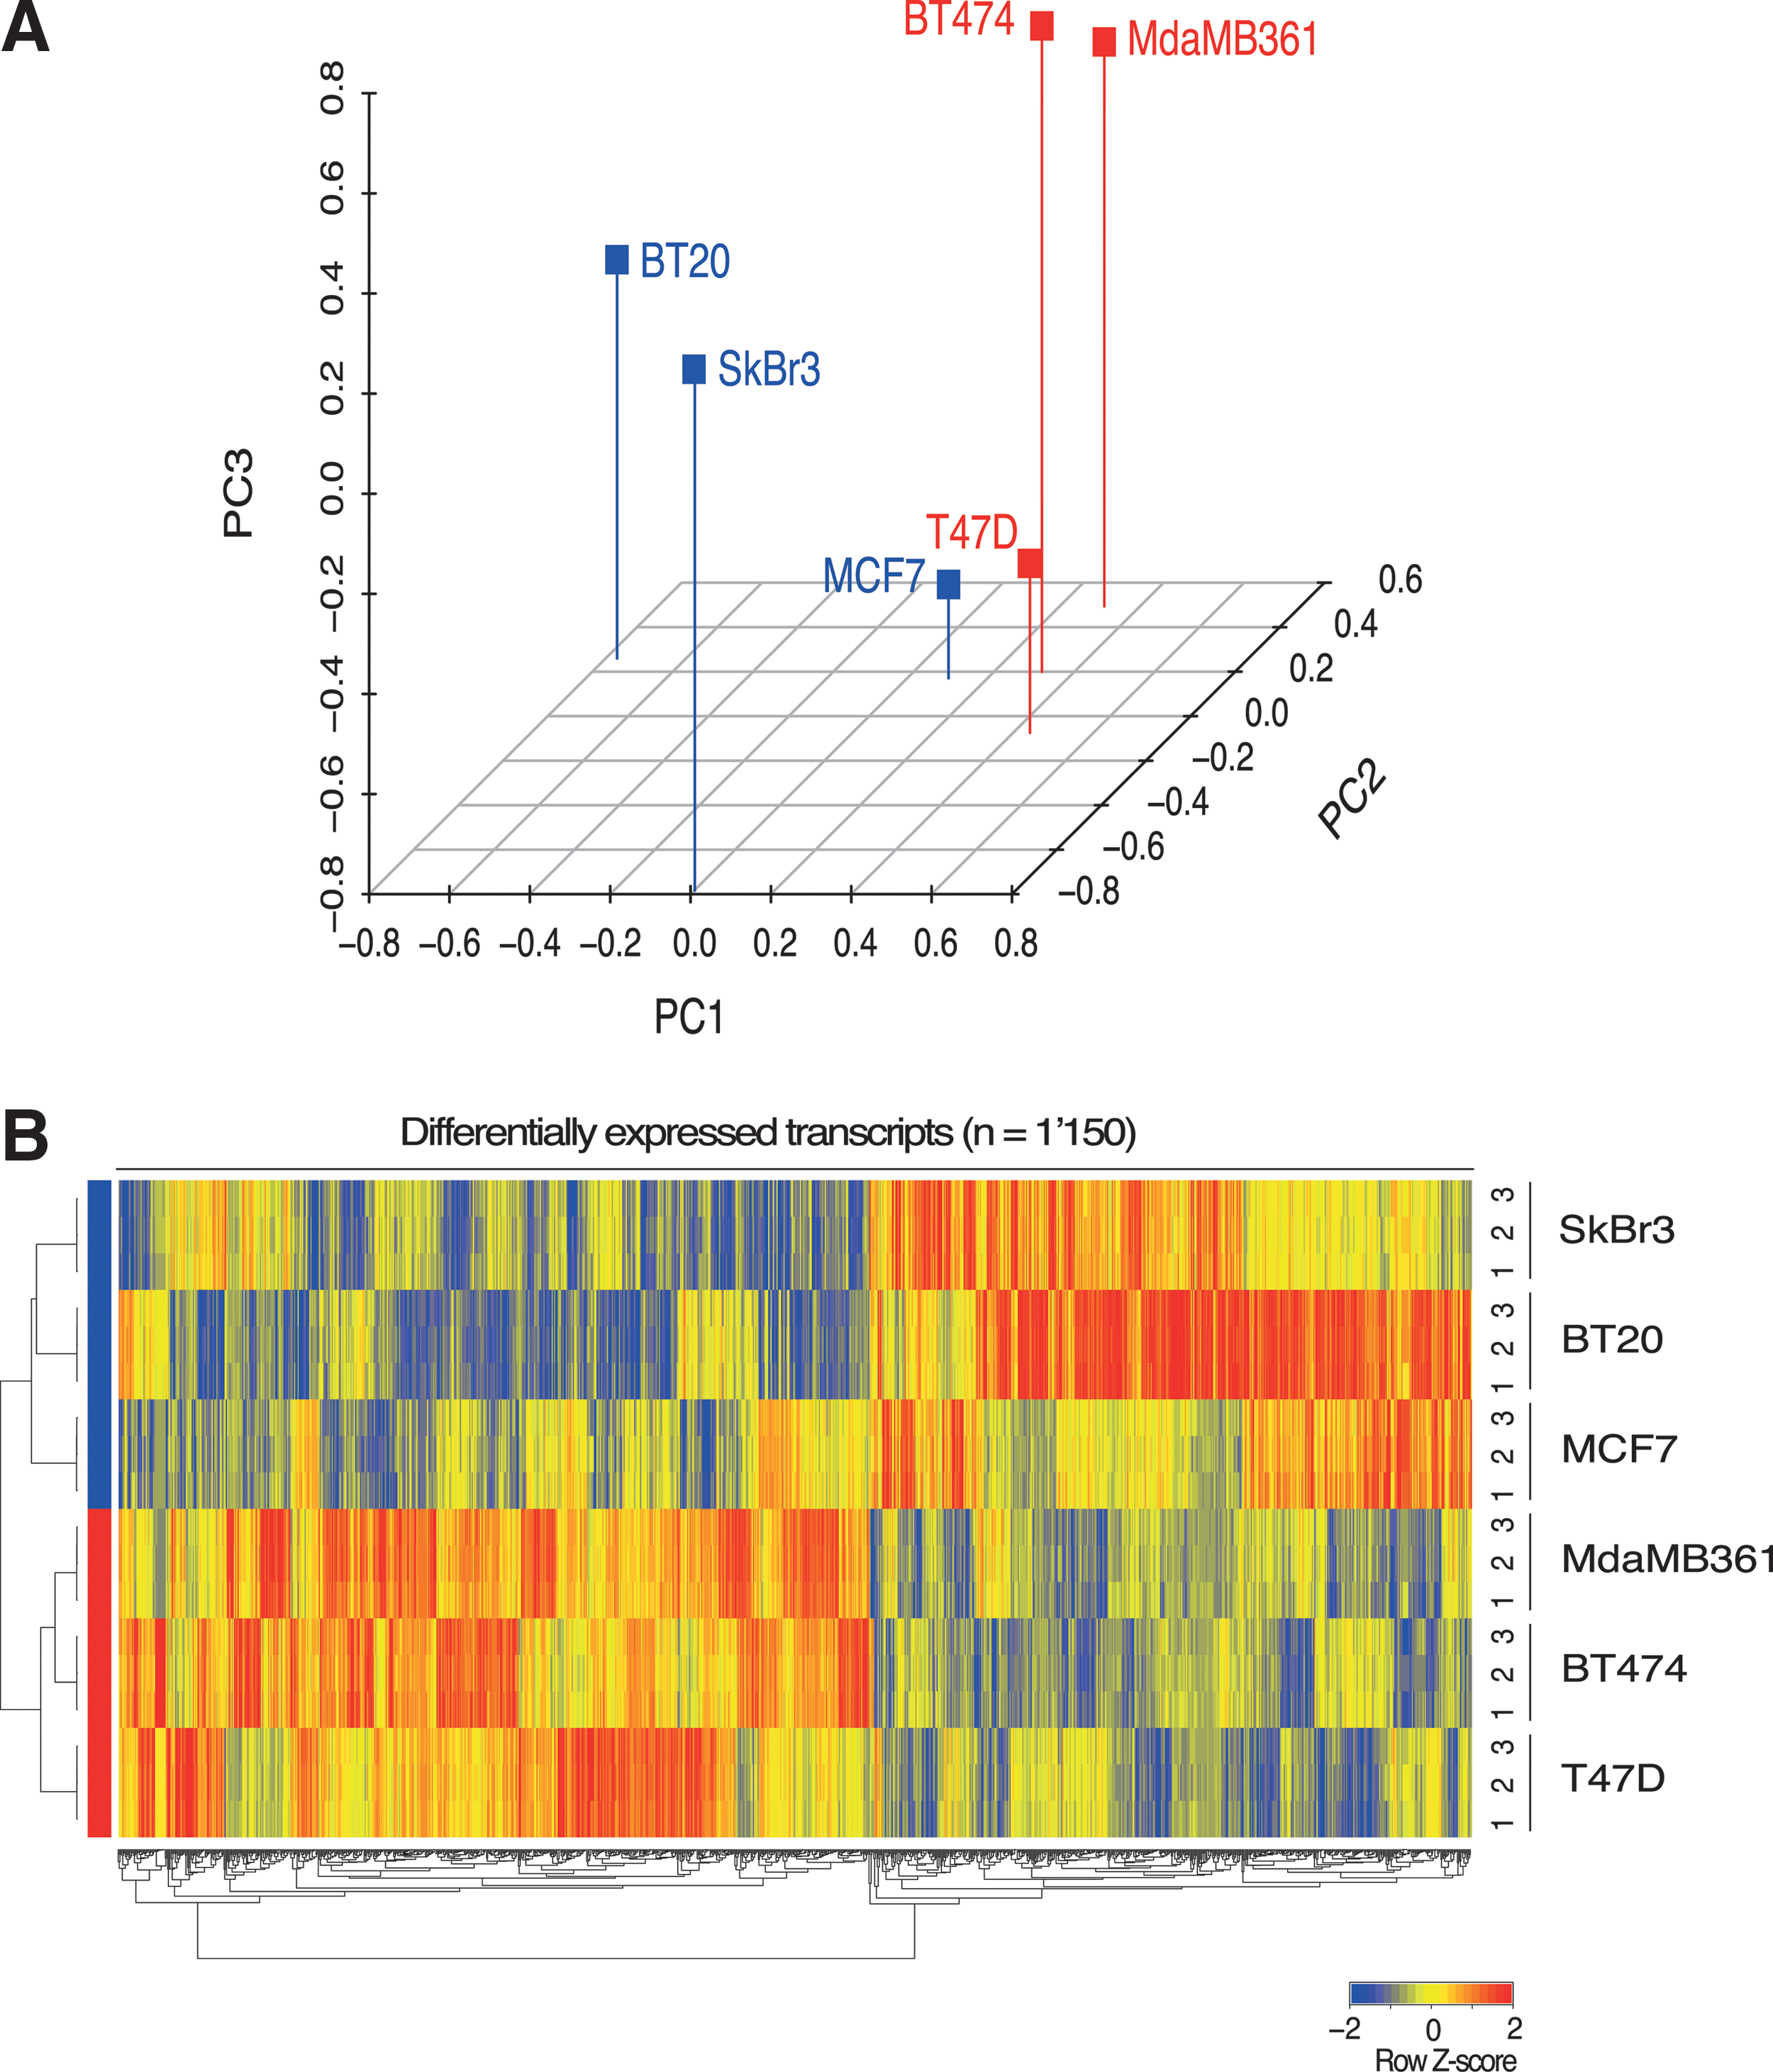
This was further confirmed by comparing the standard deviations of the normalized log2-transformed intensity values for all the microarray probe sets (p-value=7.88e–259, Wilcoxon signed-rank test). These results suggest that differences in the transcriptome could explain at least part of the observed differences in SAHA responsiveness. We then directly compared the profiles associated with these two different types, namely sensitive and resistant (or least sensitive) breast cancer cell lines. A signature was determined as described in the Materials and Methods section and resulted in 1,150 differentially expressed transcripts (Supplementary Table S1 and Fig. 3B).
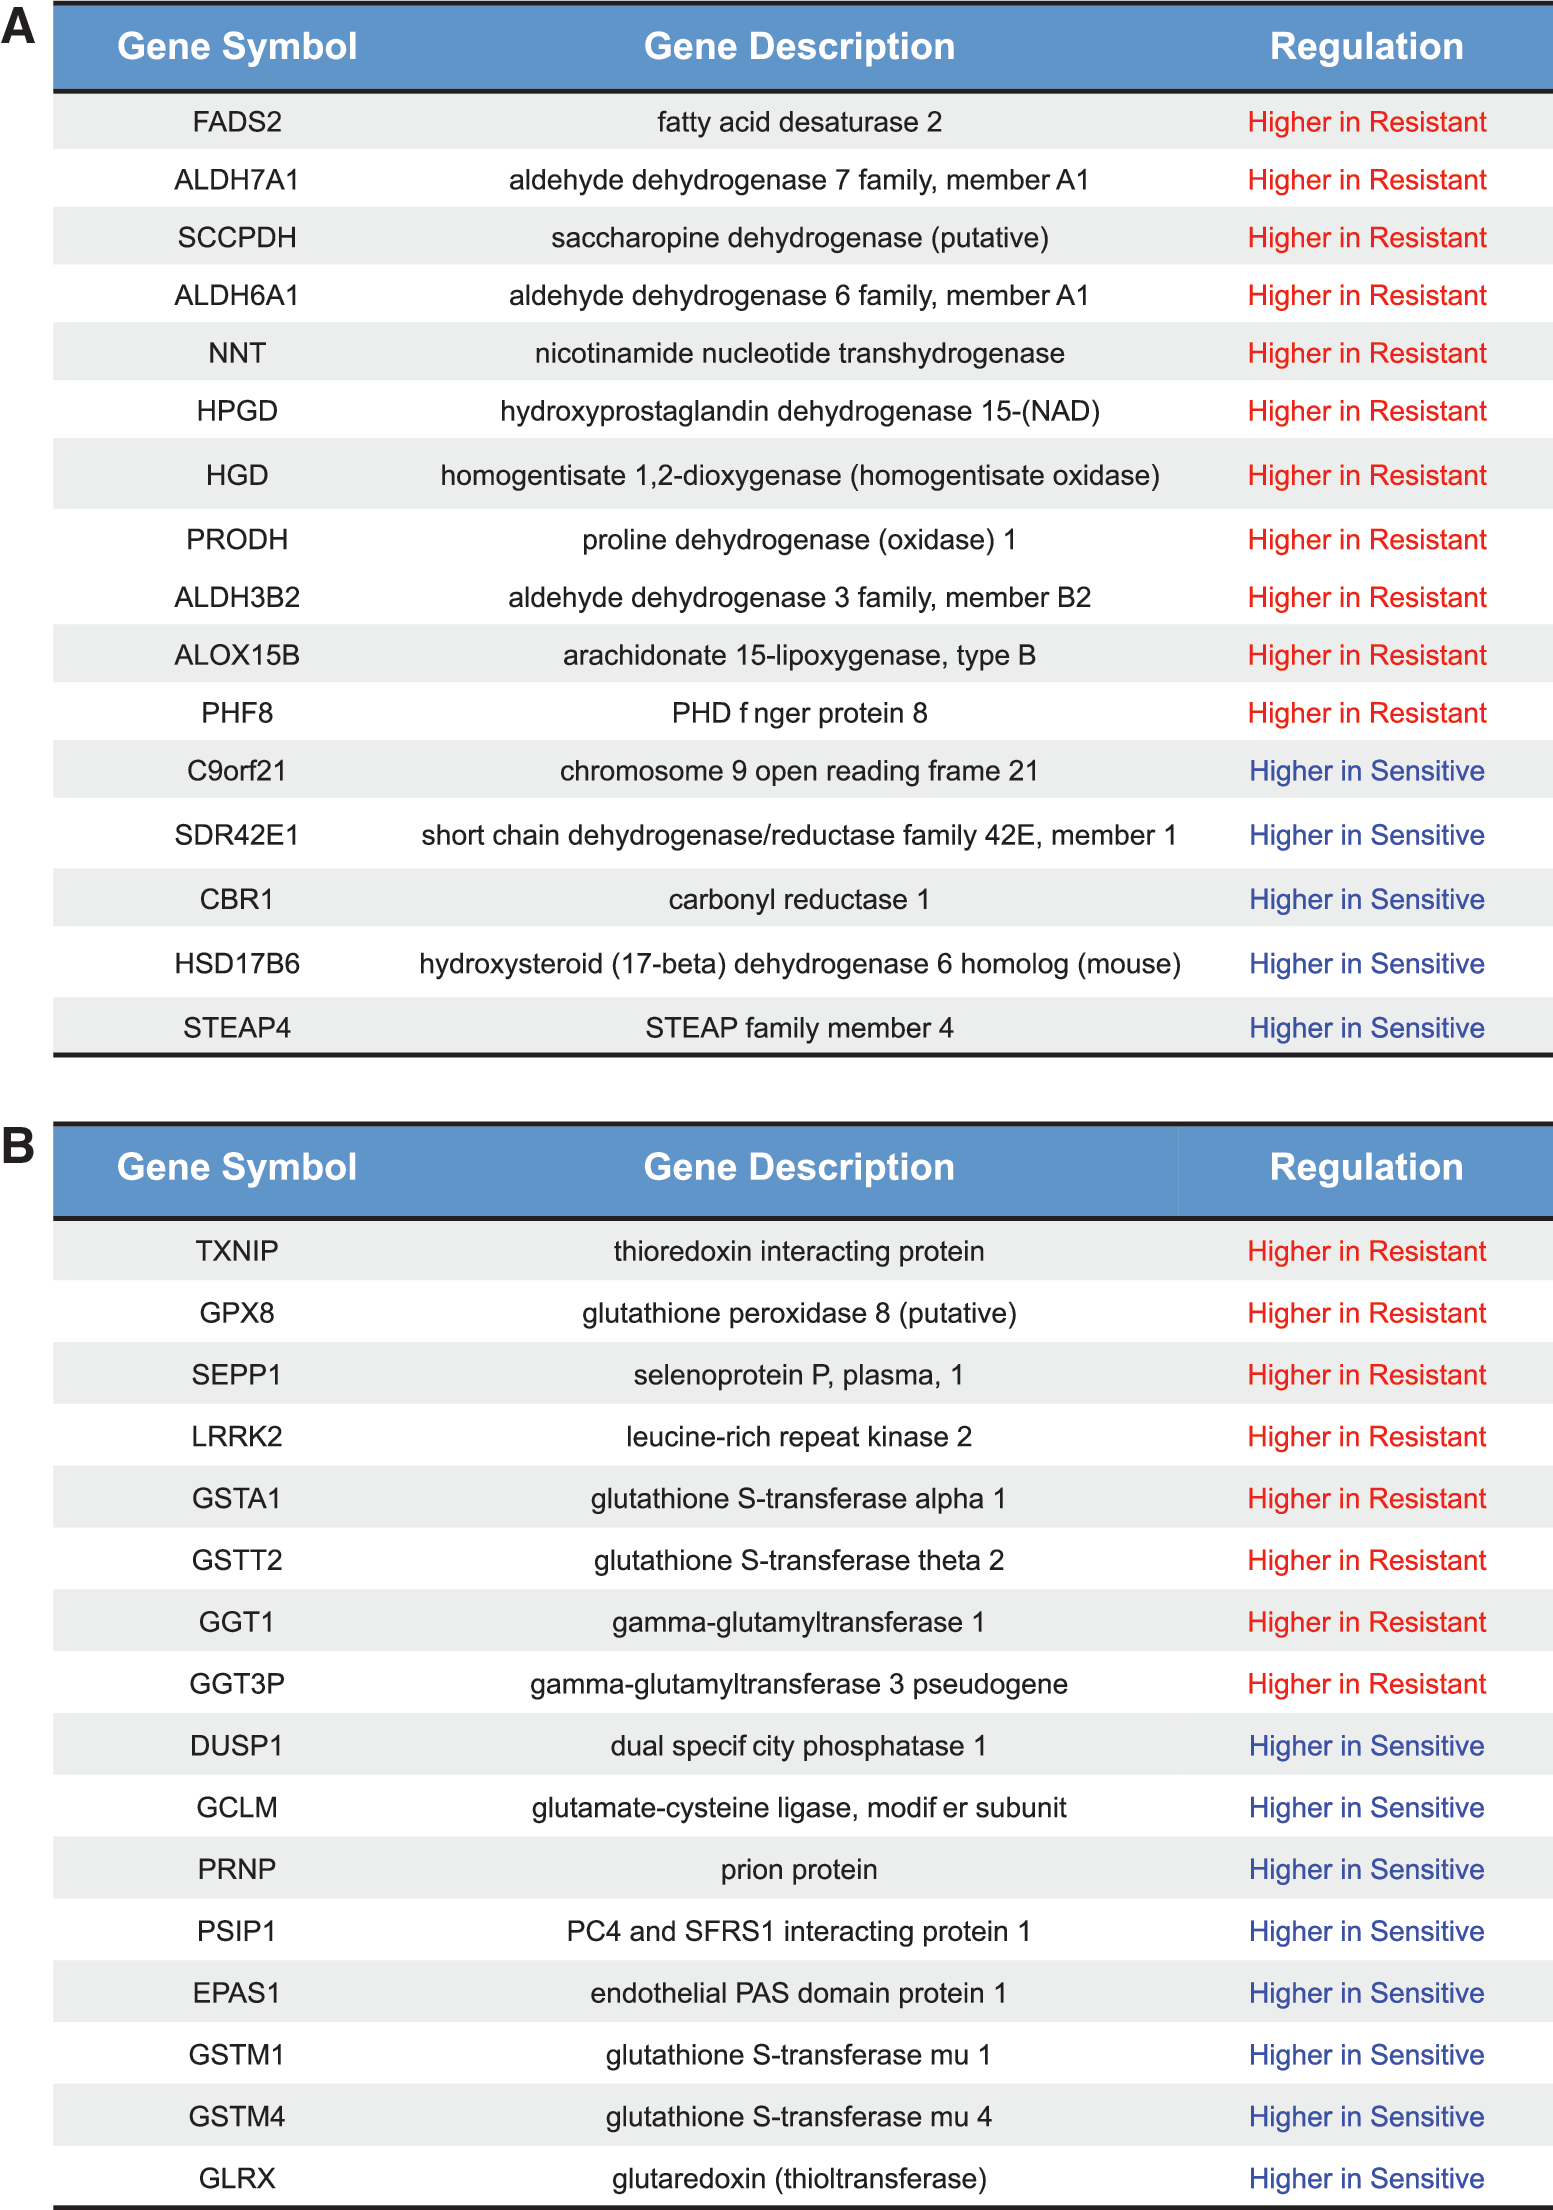
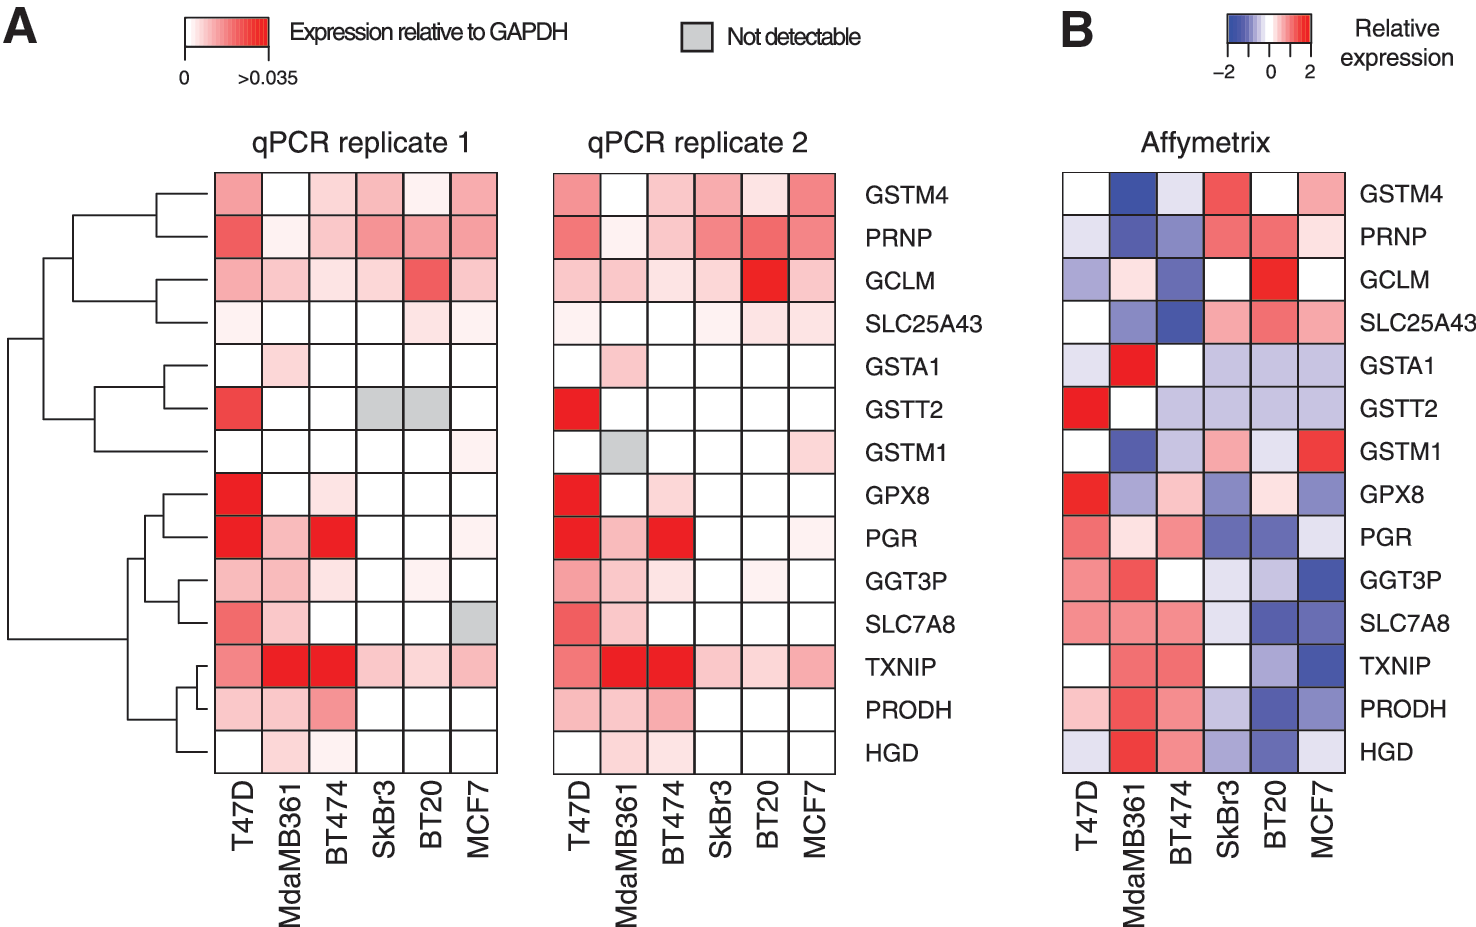
Among the differentially expressed transcripts, further functional enrichment analysis underscored that the most represented categories belong to cell adhesion pathways (cadherin and Wnt) (Supplementary Fig. S4 and Supplementary Table S2). Interestingly, we also observed a significant enrichment for molecules with oxidoreductase activity (p-value=1.59e-07) and involved in the response to oxidative stress (p-value=0.01). Since redox pathways may have an important role in the resistance to HDACi (24, 41, 70, 71), we manually searched for genes belonging to these pathways in our differentially expressed gene list and extended these lists (Fig. 4A, B). We then validated by quantitative polymerase chain reaction (qPCR) a number of these genes and corroborated them with the corresponding values measured by microarray, as shown in Figure 5.
HDACi-dependent intracellular ROS level alteration is associated with sensitive and resistant cell responses to SAHA treatment
Transcriptional profiling by microarray (Figs. 3, 4, and 5B) and the following qPCR validation (Fig. 5A) highlighted that some genes belonging to the glutathione metabolism pathway are differentially expressed in resistant versus sensitive cell lines. Given these observations, we expanded the selection of candidates from this specific pathway (specifically glutamate-cysteine ligase catalytic [GCLC], gamma-glutamyltransferase 7 [GGT7], glutathione peroxidase 3 [GPX3], glutathione reductase [GSR], glutathione synthetase [GSS], glutathione S-transferase alpha 2 [GSTA2], glutathione S-transferase alpha 4 [GSTA4], and glutathione S-transferase mu 5 [GSTM5]), measured their expression level by qPCR in MCF7 and BT474 cells, and mapped the results onto the glutathione metabolism pathway (hsa00480) in Kyoto Encyclopedia of Genes and Genomes (Fig. 6A) (26).
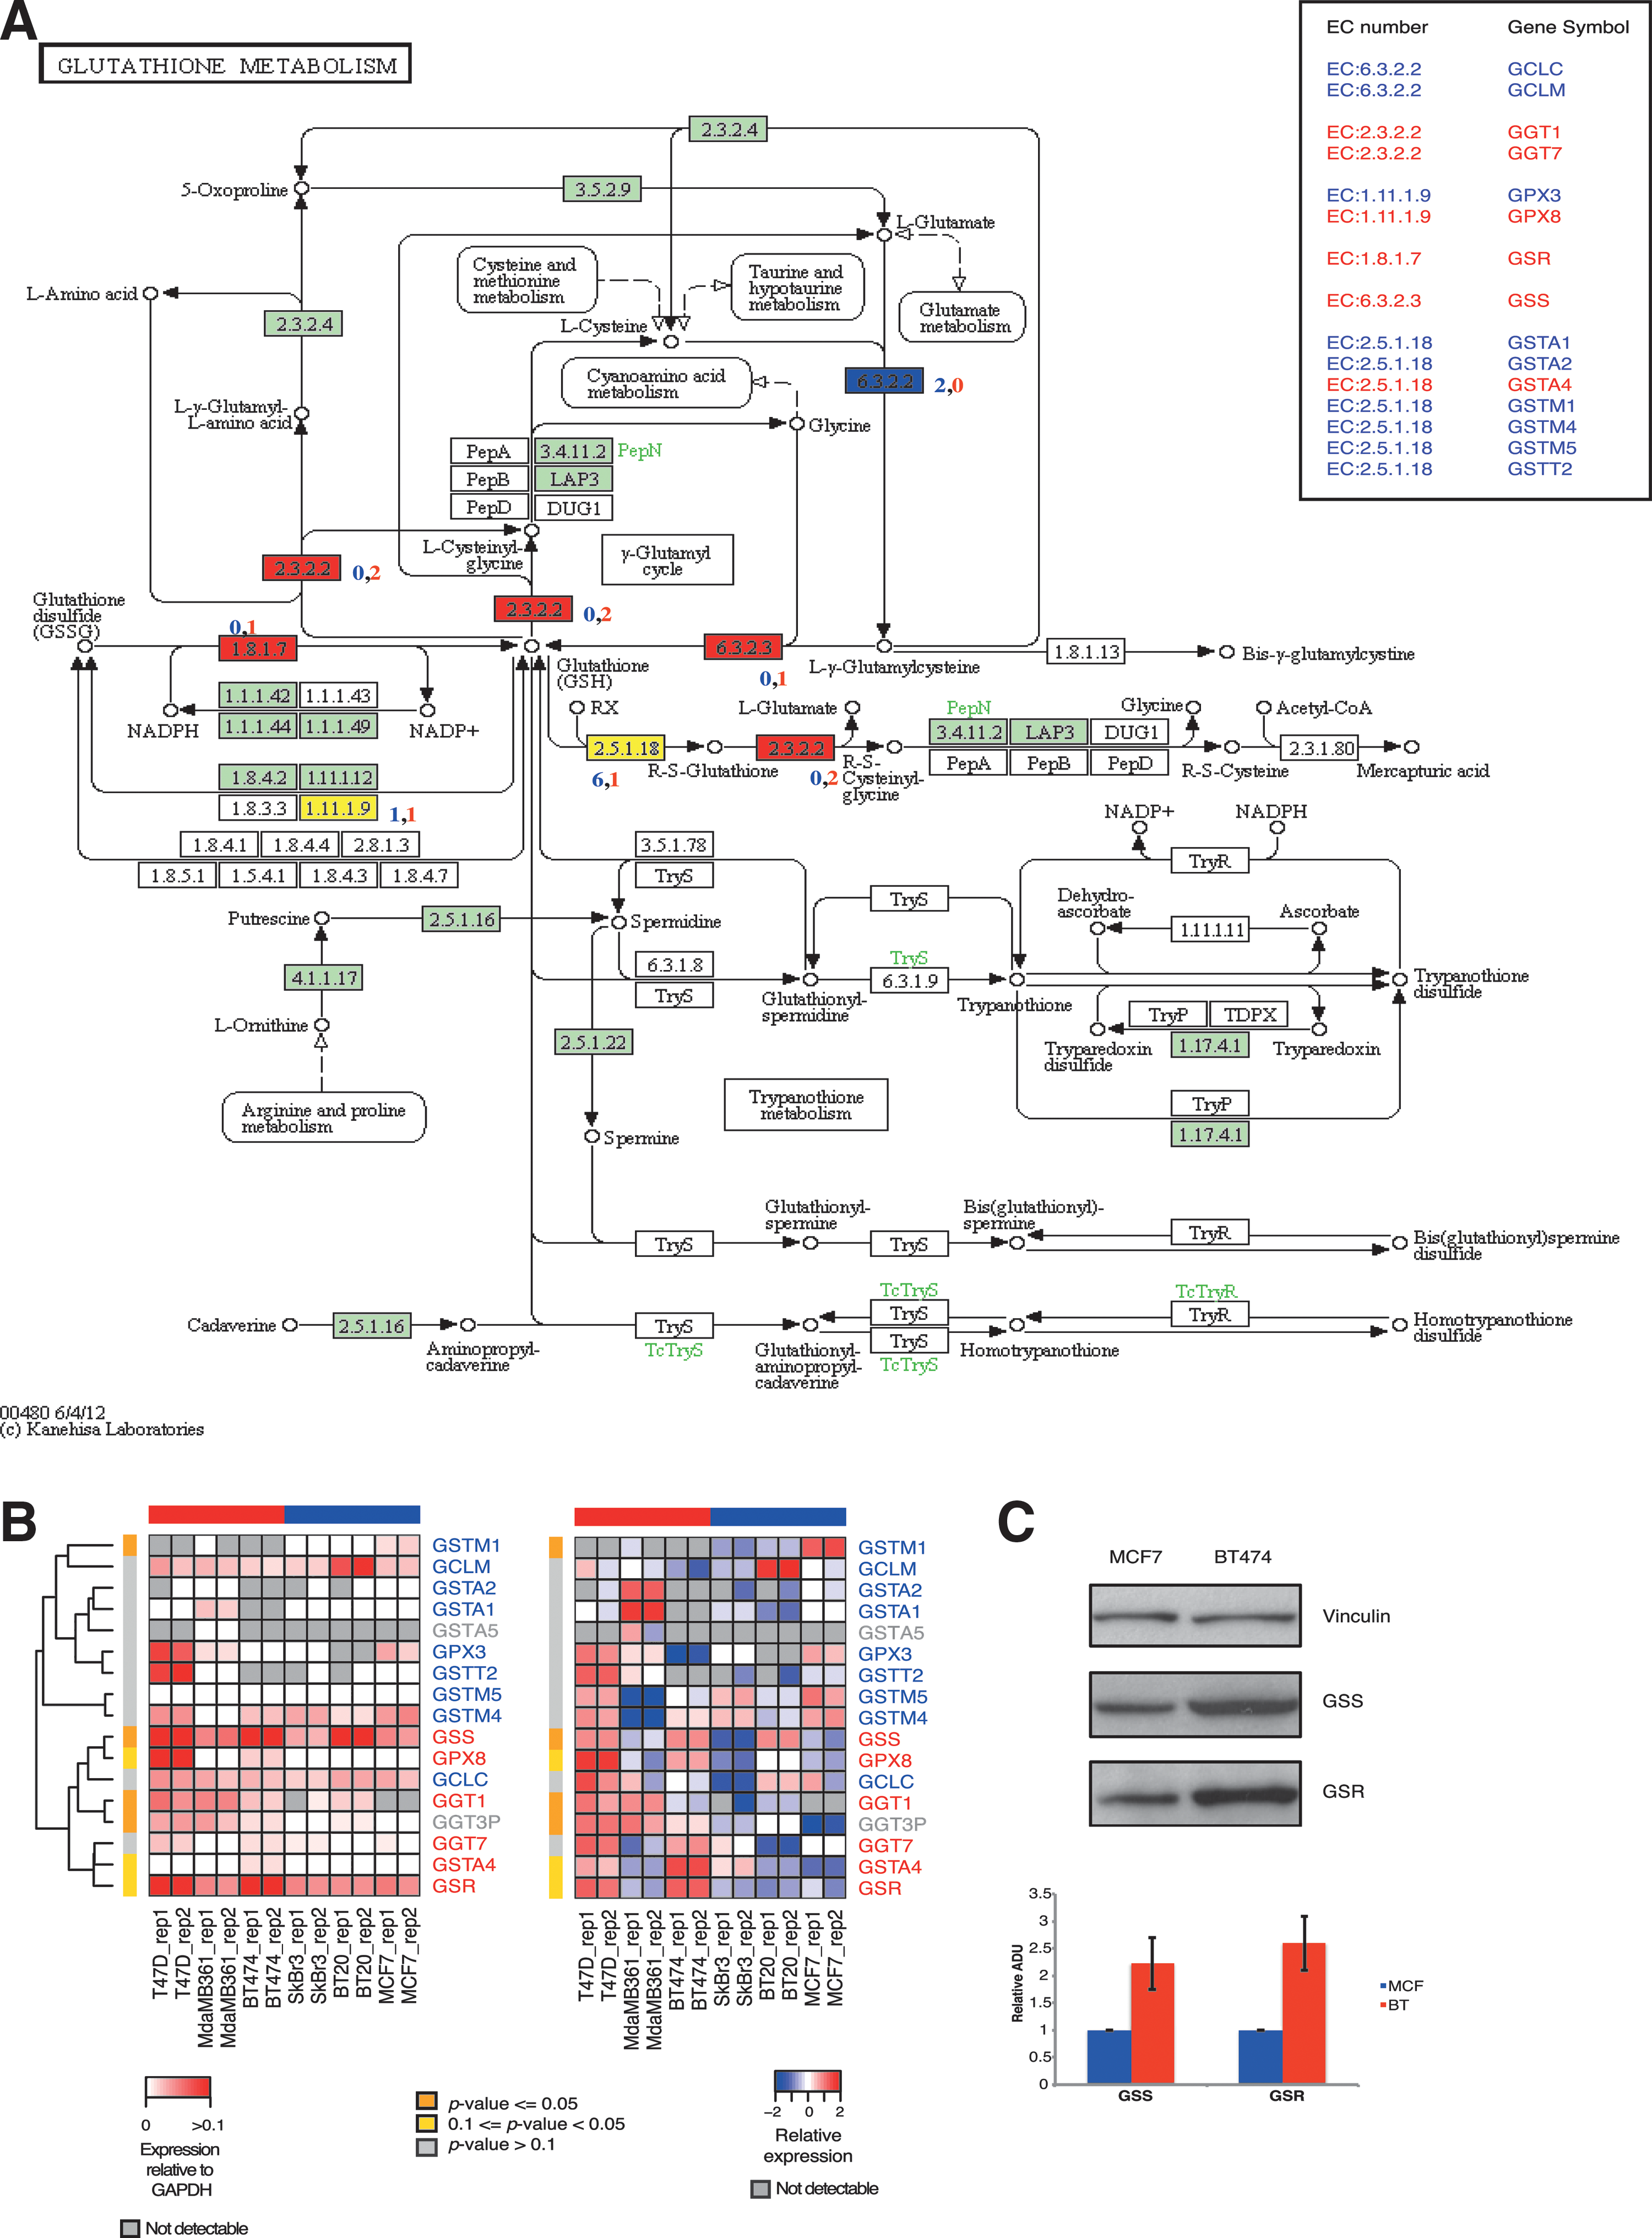
Each gene was assigned its enzymatic activity (EC number), and then the pathway was color coded according to the difference in expression between MCF7 and BT474 cells (blue if the majority of the genes showing that particular enzymatic activity showed higher expression in MCF7, red otherwise). Both cell lines showed upregulation of the genes encoding the enzymes involved in the first steps of glutathione synthesis (GCLC and GCLM in MCF7 cells and GSS in BT474 cells). However, while in sensitive cells, the genes encoding the enzymes involved in the use of reduced glutathione were more expressed compared with resistant cells (GSTAs and GSTMs), in the latter, we found higher expression of the enzymes involved in maintaining elevated intracellular levels of reduced glutathione (GSS, GSR, and GGTs) (Fig. 6A).
A similar pattern of gene expression was observed when we also included the other cell lines in this analysis, confirming a general upregulation of the glutathione metabolism pathway in resistant cells (Fig. 6B). To validate some microarray data, the levels of protein expression of GSS, involved directly in GSH synthesis, and GSR, involved in salvage of glutathione disulfide (GSSG), were evaluated in MCF7 and BT474 cell lines, confirming transcriptional data (Fig. 6C).
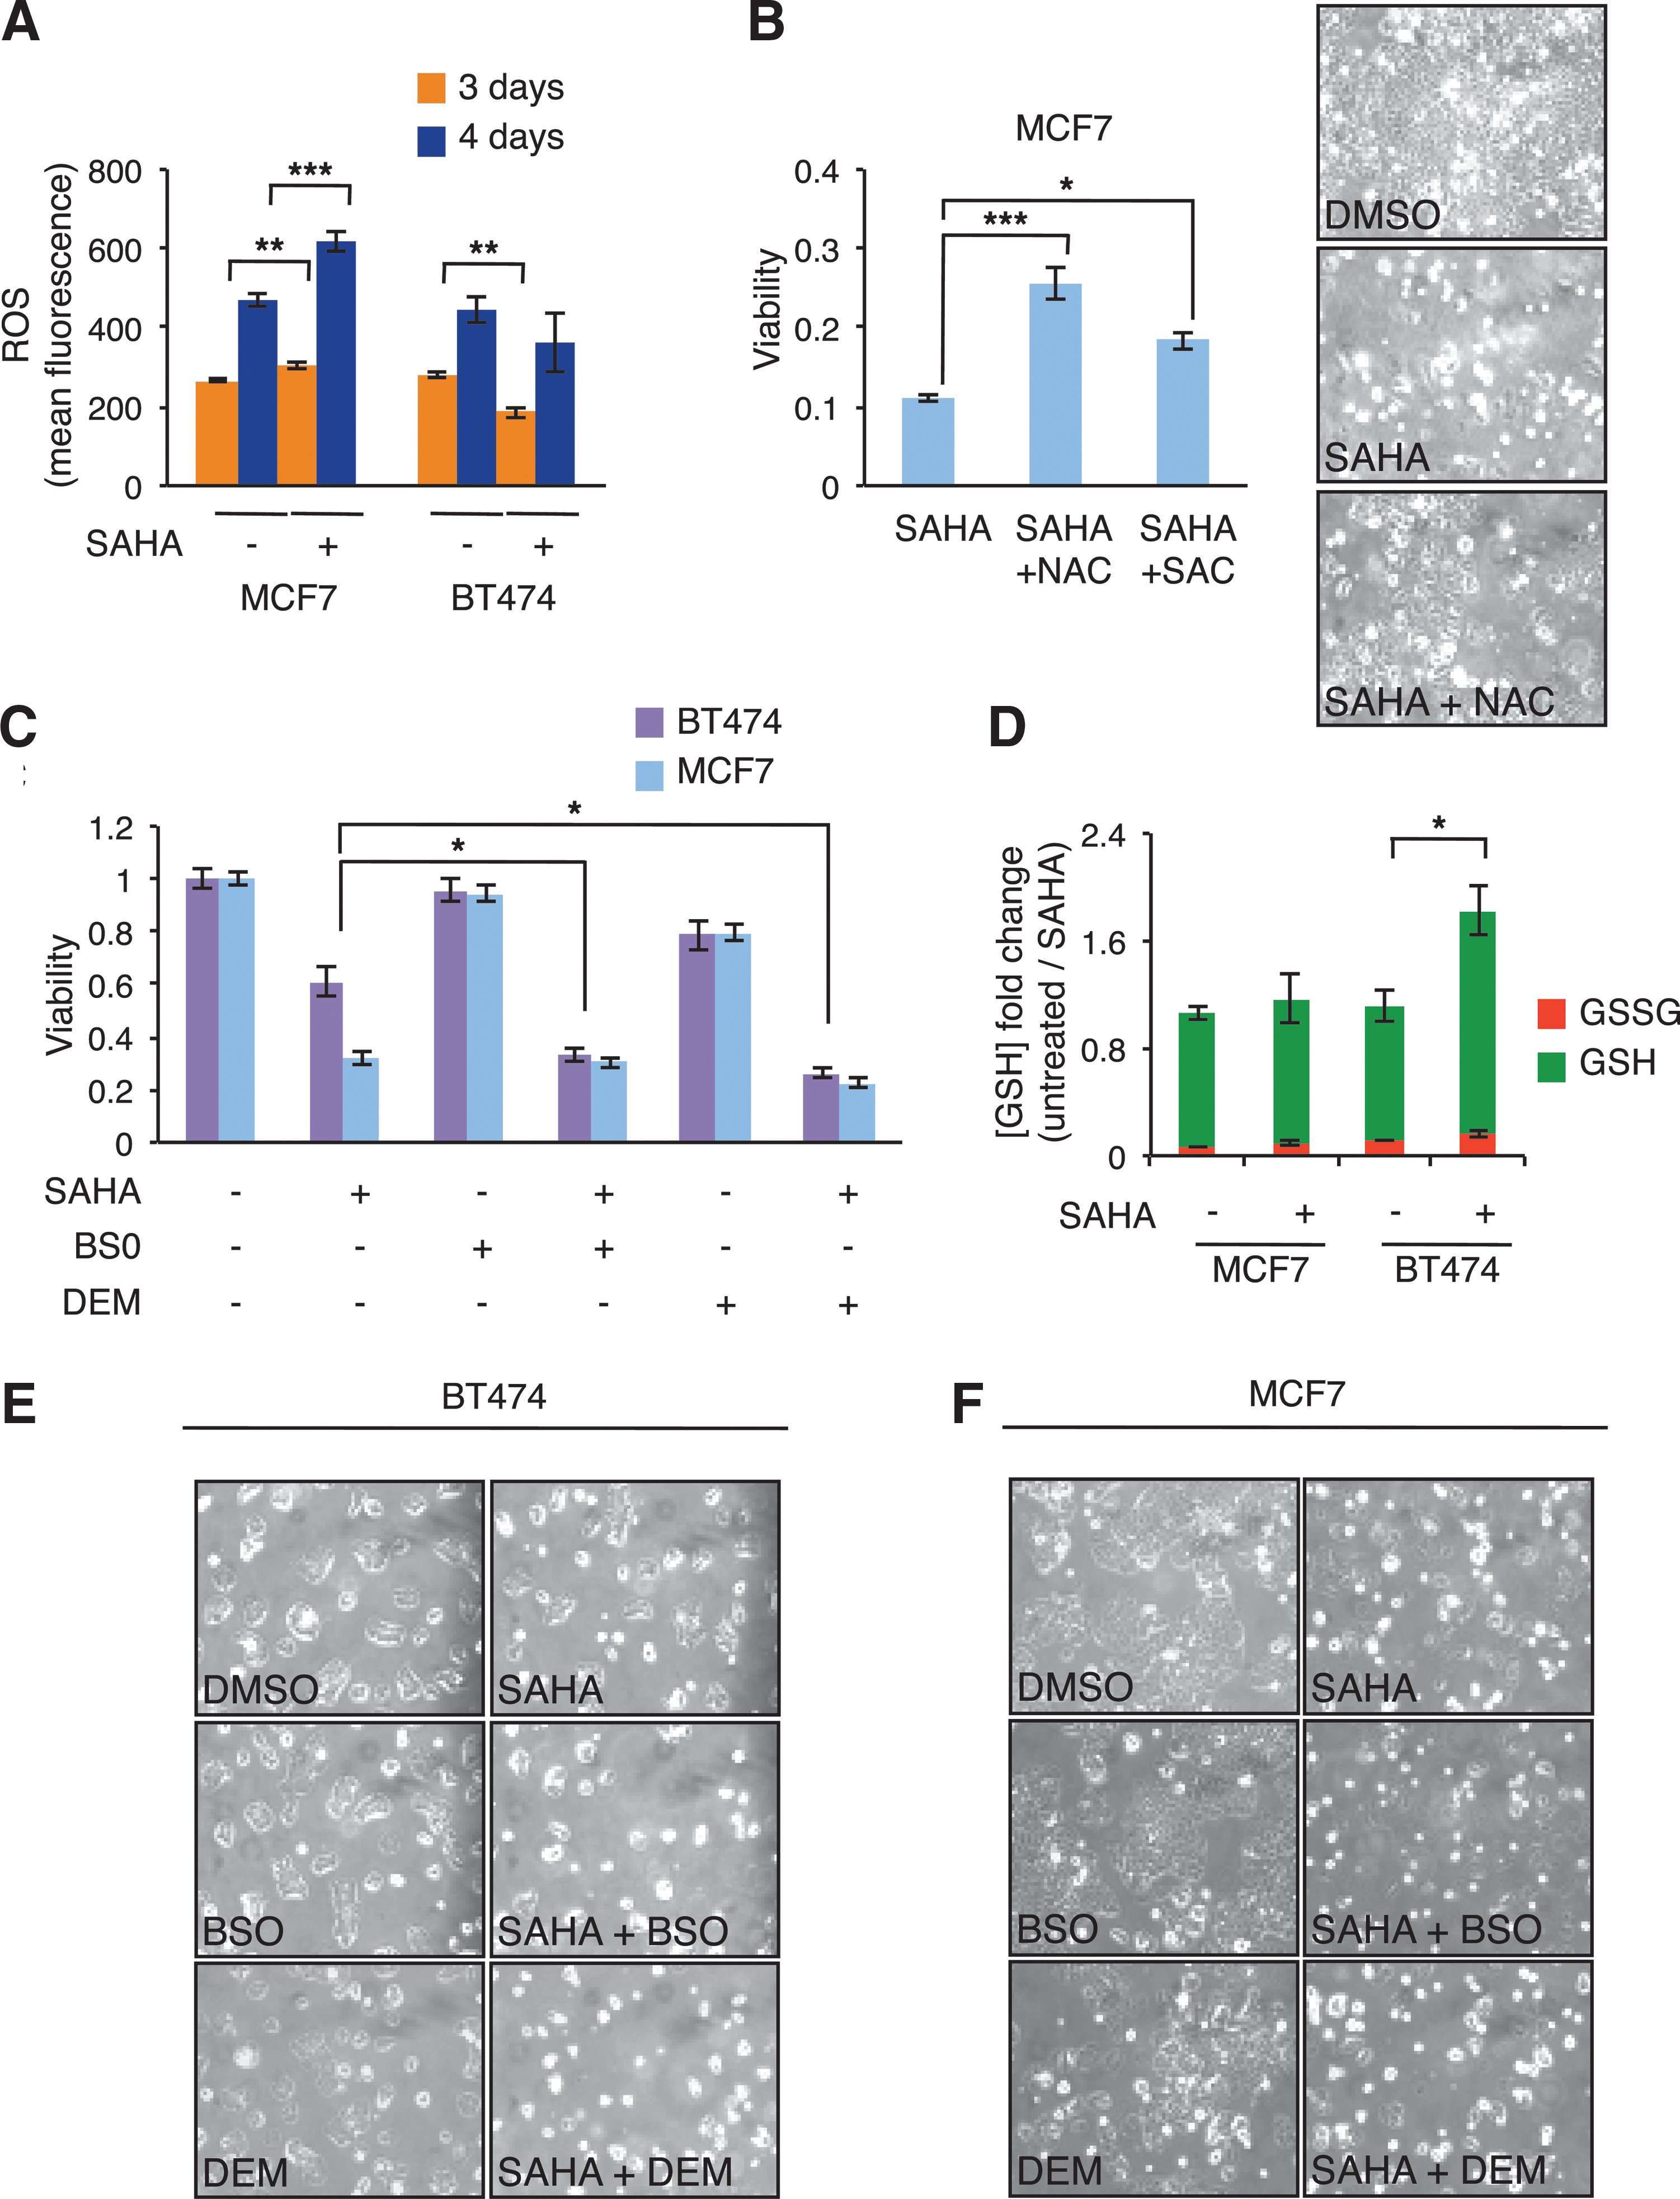
Since ROS production has been proposed to have an important role in HDACi-induced cancer cell death (8, 9, 48) and glutathione is mostly involved in their detoxification, we quantified ROS intracellular levels by DCFH2-DA fluorescence (14, 47) in both sensitive and resistant cells after 1 μM SAHA treatment for either 3 or 4 days. As shown in Figure 7A, both cell lines showed a time-dependent increase of DCFH2-DA fluorescence. However, upon SAHA treatment, they displayed a completely opposite behavior. Indeed, while in MCF7 cells, SAHA exposure led to an increase of ROS generation compared with untreated cells, BT474 cells had a significant decrease in intracellular ROS levels compared with untreated ones.
To assess the implication of ROS levels in MCF7 sensitivity and BT474 resistance to SAHA, we then treated the two cell lines with two classes of compounds known to change cellular ROS levels. Specifically, N-acetyl-cysteine (NAC) or S-allyl-
As shown in Figure 7B (bar graphs—left and cell morphology—right), NAC or SAC cotreatment, acting as ROS scavengers, significantly enhanced MCF7 cell viability upon SAHA treatment, supporting the role of ROS in their sensitivity to SAHA. In contrast, BSO or DEM cotreatment (Fig. 7C, E), by reducing the levels of the endogenous scavenger glutathione (GSH), led to a complete abrogation of BT474 cell resistance to SAHA treatment. Conversely, no further enhancement of SAHA effect on cell viability was observed in MCF7 cells upon cotreatment with BSO and DEM (Fig. 7C, F).
Since our transcriptional profiling and qPCR analysis identified genes involved in redox reactions—in particular, in glutathione metabolism—as differentially expressed between the sensitive and resistant cell lines (see Figs. 4 and 6), we measured intracellular glutathione in MCF7 and BT474 cell lines in basal condition and upon 3 days of SAHA treatment. Endogenous levels of GSH were determined in cell extracts from sensitive and resistant cells.
As shown in Figure 7D, GSH content in MCF7 cells remained almost unchanged upon SAHA treatment compared with the control. On the contrary, BT474 cells doubled total GSH levels upon SAHA treatment, indicating a higher detoxifying capacity of resistant cells compared with sensitive ones. Since the increase in reduced GSH (green bars) could be derived either from reduction of oxidized glutathione (GSSG, red bars) by GSR or from de novo synthesis (23), we also investigated the amount of GSSG upon or without exposure to SAHA. The amount of GSSG (red bars) did not decrease, but was elevated upon SAHA treatment in both cell lines, suggesting that in BT474 cells, GSH elevation is not due to reduction of GSSG, but possibly to GSH synthesis through the activity of GSR and GGT enzymes.
Otherwise, the GSH:GSSG ratio may be used as a marker of oxidative stress. Comparison between the two cell lines indicated that such a ratio decreased and increased in MCF7 and BT474 cells, respectively, upon SAHA treatment (data not shown). Taken together, these results support the involvement of ROS in SAHA-induced cell viability reduction and more specifically in MCF7 cell sensitivity. Conversely, they also support the notion that increased levels of GSH may act as protection from the HDACi that caused injury in resistant cells.
The redox gene signature identified in cell lines is associated with SAHA sensitivity and resistance in primary breast tumor cells
To translate our findings to a possible clinical setting, breast tumor cells from six patients were isolated and put in culture. CV in vitro analysis, as described in Figure 1, determined that two samples were sensitive to SAHA treatment (primary samples 2 and 3) and four were resistant (primary samples 1, 10, 15, and 17), mirroring the data depicted in Figure 1D. Similarly to our findings in cell lines (Fig. 6), qPCR showed that almost all genes belonging to the glutathione metabolism pathway (Fig. 8A, highlighted in red) were more expressed in primary tumor cells resistant to SAHA treatment compared with the sensitive ones.
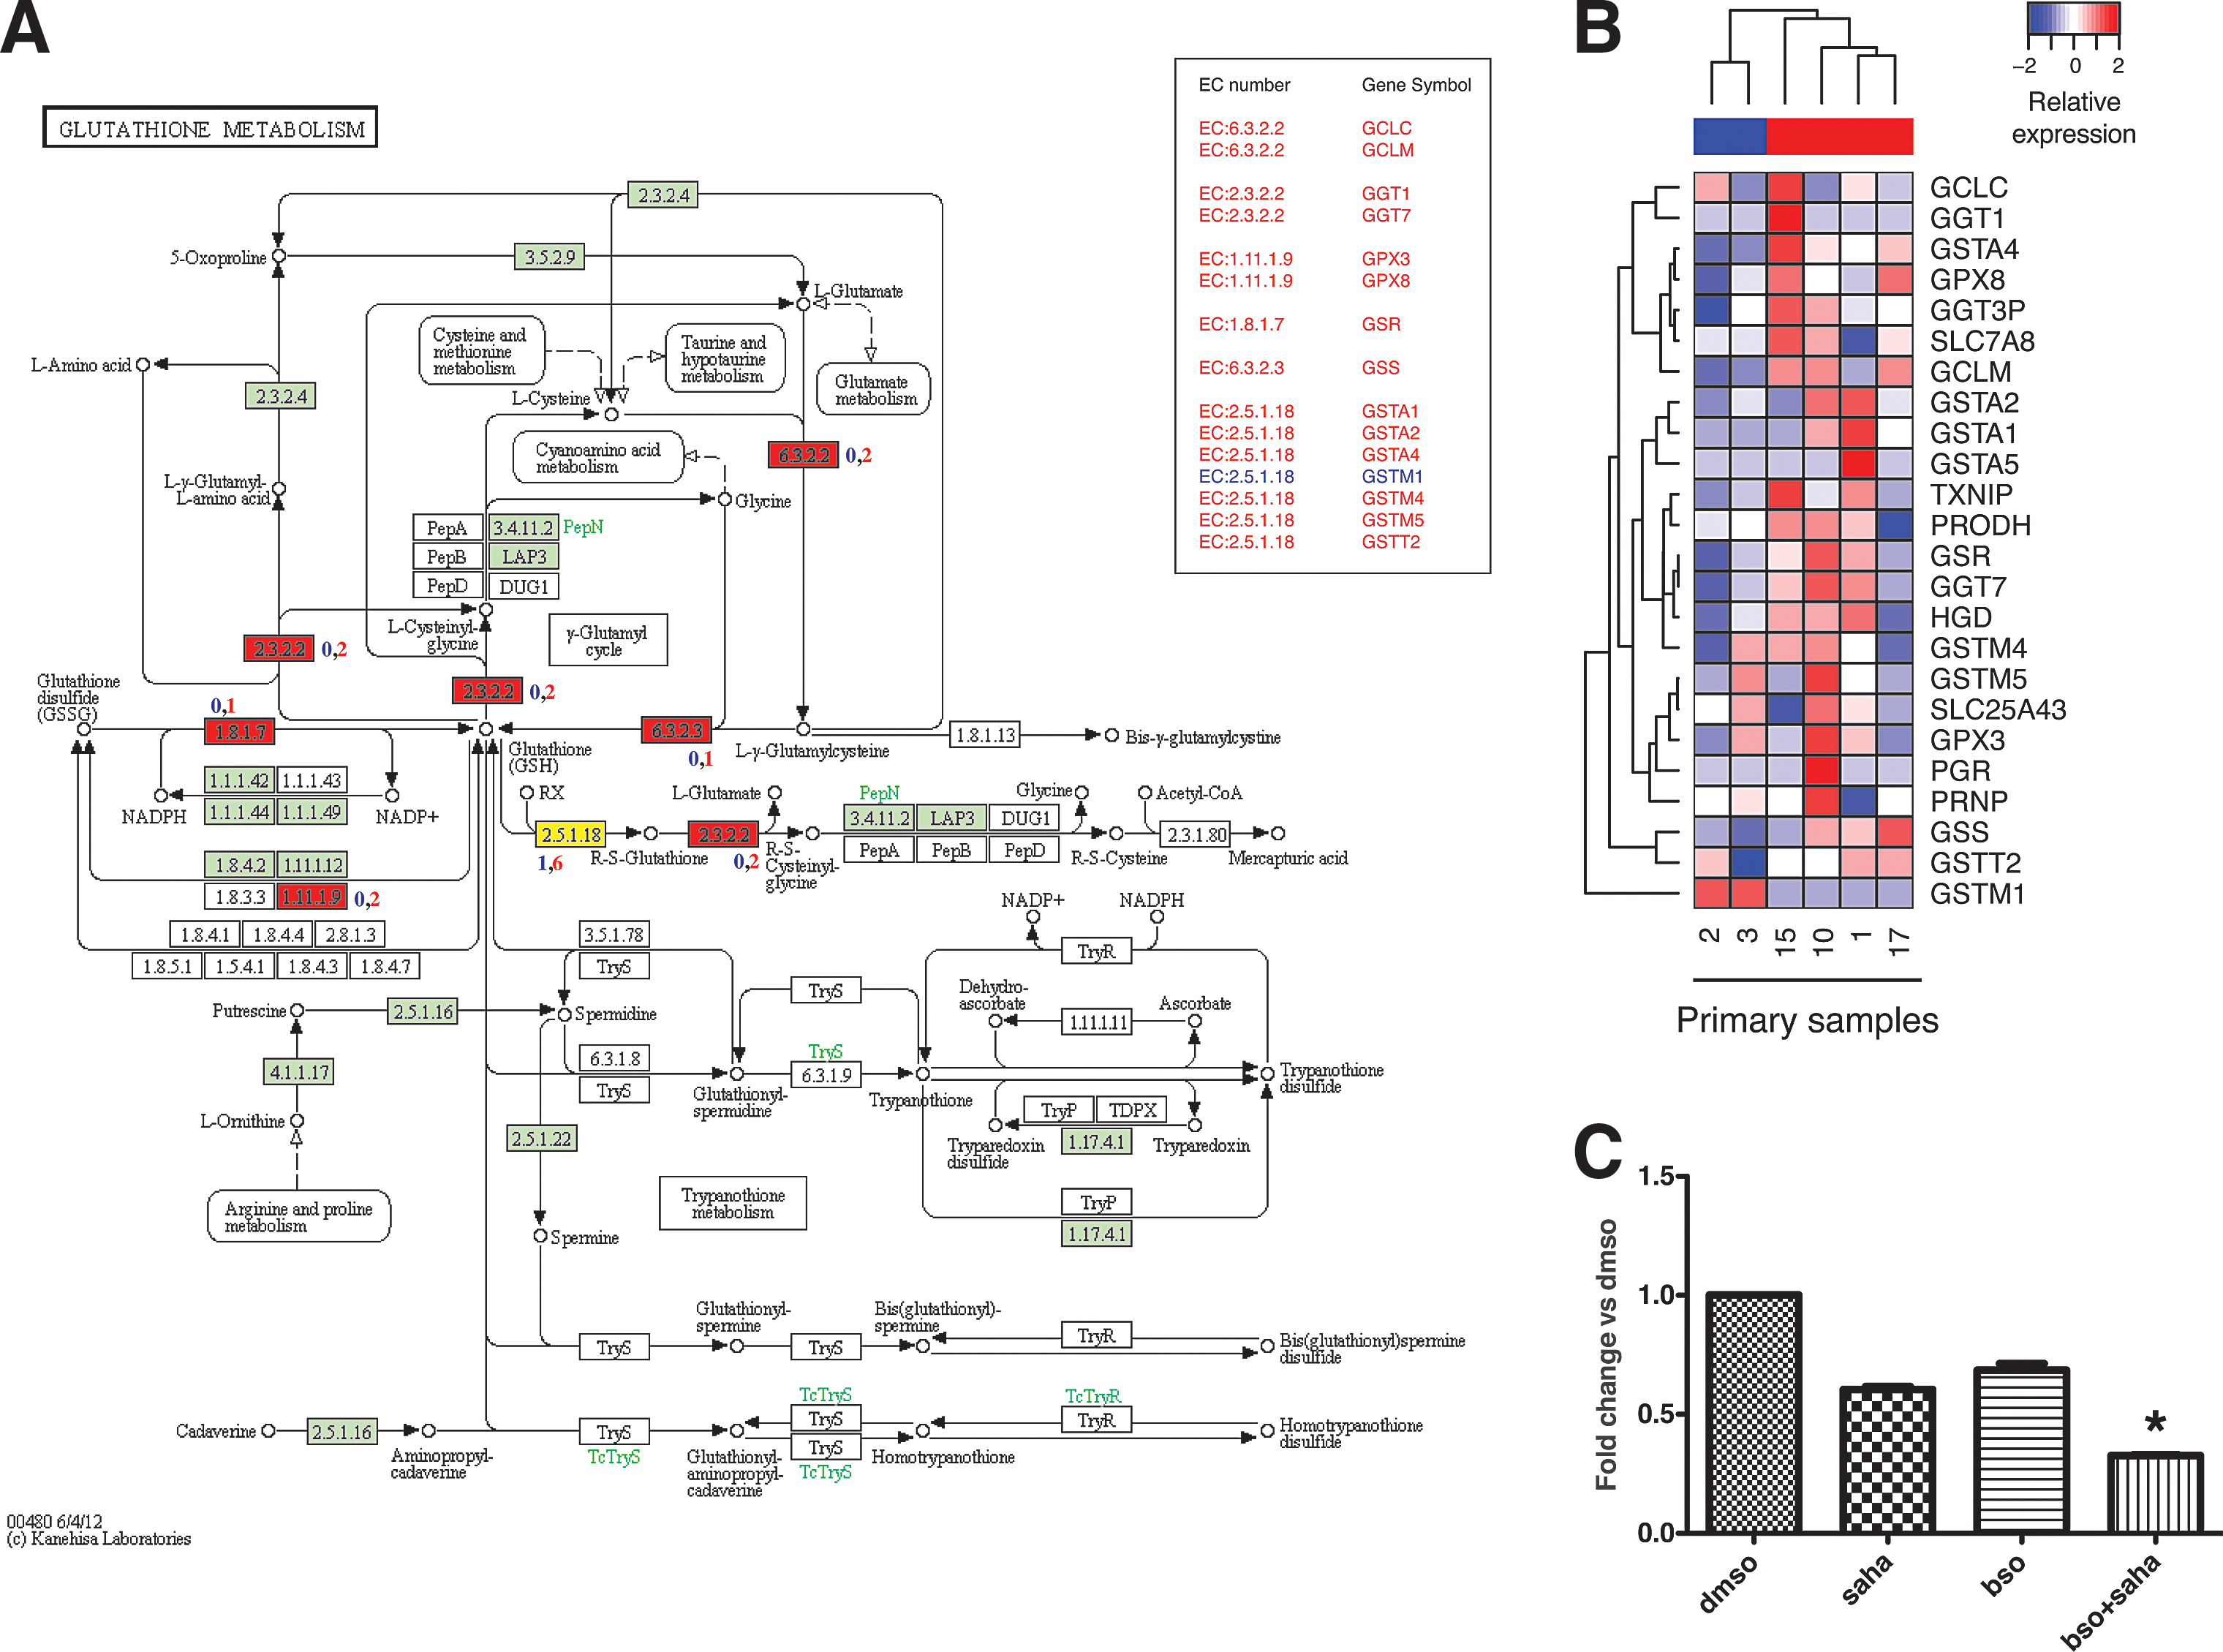
Since we showed that glutathione production is implicated in resistance to SAHA cancer cell lines (Fig. 7C, D), we examined the effect of BSO and SAHA cotreatment in two primary breast tumor samples classified as resistant to SAHA. Consistent with the results shown in Figure 7C, primary breast samples treated with SAHA plus BSO underwent significantly more cell death compared with SAHA and BSO alone (Fig. 8C). Taken together, these data point to the glutathione metabolism pathway as an important mechanism of cellular resistance to SAHA treatment.
Discussion
Drug approaches to breast cancer are becoming more and more tailored to patients' specific needs. Indeed, breast cancer patients undergo different treatments, either standard (radiotherapy and chemotherapy) or targeted (hormone therapy, monoclonal antibodies, and tyrosine kinase inhibitors).
The status of a specific tumor may underlie sensitivity/resistance to treatment with epigenetic drugs (2). Our study has revealed differences in responsiveness to vorinostat (SAHA), an HDACi approved for clinical use as an antitumor agent, in both human breast tumors and cell lines, confirming previous observations of the potential efficacy of this drug in breast cancer (54).
The use of primary breast cancer cultures increases the relevance of our findings. In fact, although extensively used, cell lines may undergo several changes to adapt to in vitro growth and therefore be less representative of the actual pathology of the disease. We thus made use of our study of primary cultures, with only a very limited time for in vitro growth (between 3 and 6 days). Although mammary primary tumors are recognized as very heterogeneous (11, 23, 42) and cancer cell lines may experience multiple stresses in in vitro culture, in our study, the data obtained in the two cancer model systems were comparable, establishing that the correlation we found in response to SAHA is robust. It will be important, however, to expand these observations to further in vivo studies to conclusively support our findings.
Redox pathways are being increasingly recognized as having a role in cancer resistance to HDACi (3, 5, 70, 71). In this regard, we found that some mRNA encoding for GSH-related enzymes was differentially regulated between sensitive and resistant cells. Particularly, resistant cells showed higher expression at both the mRNA and protein levels of GSS and GSR (Fig. 6), involved either in glutathione synthesis or in glutathione reduction (31, 51), and GGT1 (gamma-glutamyltransferase 1) and GGT7, proteins that participate in the enzymatic degradation of glutathione to recover cysteine to rebuild glutathione (13). Interestingly, the latter class of enzymes has been associated with a more unfavorable prognosis in breast cancer patients (4).
In correlation with the mRNA levels, the resistant cell line, BT474, also showed an increased intracellular level of GSH upon SAHA treatment. Moreover, resistant cells showed higher expression of selenoprotein P plasma 1 (SEPP1) and nicotinamide nucleotide transhydrogenase (NNT) (Fig. 4), both recognized as antioxidant enzymes through their direct detoxifying activity (in the case of SEPP1) or by generating nicotinamide adenine dinucleotide phosphate (NADPH), a critical modulator of the cell redox state (in the case of NNT) (30, 40, 68, 76). BT474 cells also present higher expression of the aldehyde dehydrogenase 7 family, member A1 (ALDH7A1), and aldehyde dehydrogenase 3 family, member B2 (ALDH3B2), both involved in the detoxification of aldehydes derived from lipid peroxidation, an effect of cellular oxidative stress (7, 27).
Importantly, it has been shown that lipid peroxidation in combination with anticancer agents, such as HDACi panobinostat, or radiation is able to elicit a synergistic cytotoxic effect in various cancer cells, such as breast, colon, cervical, pancreatic, and renal cancer cells [reviewed in Ref. (18)].
A different connotation has to be given to the mRNA levels of glutathione peroxidase 8 (GPX8). In fact, recent data place this protein in the endoplasmic reticulum where it participates in protein folding by the use of localized peroxide in disulfide bond formation, a necessary step for correct protein folding (36). This could suggest that resistant cells have a better capacity to respond to the drug also by increasing the protein-folding capacity in endoplasmic reticulum. In this regard, it has been recently shown that breast cancer cell cotreatments with SAHA and bortezomib, a proteasome inhibitor, enhance single treatment effects, inducing an endoplasmic reticulum stress-dependent cell death (28).
Importantly, positive regulation of glutathione metabolic genes was also observed in resistant primary breast cancer cells, further underlining the role of such a metabolic pathway in acquired resistance to SAHA treatment.
Conversely the sensitive cells that were unable to increase GSH levels upon SAHA treatment showed higher expression of GSH-consuming enzymes, such as glutathione S-transferase alpha 1 (GSTA1), GSTA2, glutathione S-transferase mu 1 (GSTM1), glutathione S-transferase mu 4 (GSTM4), GSTM5, and glutathione S-transferase theta 2 (GSTT2), since they catalyze the conjugation of GSH to a wide variety of endogenous and exogenous electrophilic compounds (49, 59). Surprisingly, these cells, showing higher expression of the rate-limiting enzymes for GSH synthesis, GCLM and GCLC (6), were unable to increase total GSH upon SAHA treatment as observed in the resistant cells (Fig. 7D).
This effect, which may suggest their inability to modulate the glutathione pathway upon oxidative stress insults, appears to be confirmed by the observed enhancement of their intracellular ROS levels upon SAHA treatment (Fig. 7A) and by their increased resistance to SAHA upon addition of antioxidant compounds such as NAC and SAC (Fig. 7B). However, since the limiting steps of glutathione synthesis are the cysteine availability and the GCLM enzymatic activity, it cannot be excluded that sensitive cells may have a limitation in one of these two factors.
In this regard, it has been shown that SAHA treatment in glioblastoma cells induces downregulation of xCT, a glutamate-cysteine transporter that controls the intracellular level of reduced glutathione (67). Accordingly, in triple negative breast cancer cells, it has been shown that xCT knockout increases doxorubicin efficacy (60).
Nevertheless, sensitive primary breast cancer cells (Fig. 8A, B) showed downregulation of all glutathione pathway genes compared with resistant ones and hence the low ability of the sensitive cells to modulate glutathione metabolism. In this regard, further confirmation of the GSH role in SAHA response is given by the observation that BT474 cells, in association with their enhanced resistance, show a parallel increase and, respectively, a decrease of intracellular GSH (Fig. 7D) and ROS (Fig. 7A) levels. Notably, such a resistance was completely abolished by the GSH inhibitors, BSO and DEM, in breast cancer cells (Fig. 7C) and primary breast tumors (Fig. 8C).
Besides the established function of classical HDACs (nonsirtuin HDACs) as HDAC enzymes controlling transcription and chromatin state, it is becoming increasingly evident that these proteins are also involved in the regulation of several other cellular processes through their ability to deacetylate hundreds of proteins with different functions in both the cytoplasm and nuclei. Importantly, recent high-throughput studies by proteomic and bioinformatic approaches have identified a large number of metabolic enzymes as important targets for HDAC activity (61, 74).
Concurrently, it has also been shown that a number of metabolic intermediates are able to influence, positively or negatively, HDAC activity [reviewed in Ref. (10)]. Likewise, several metabolites important in regulating HDAC activity are products of metabolic pathways deregulated in cancer [reviewed in Ref. (10)]. In this regard, it has been observed that valproic acid and SAHA treatment as well as NaB and trichostatin A may induce several effects on cancer cell metabolism, among which are an increased oxidative metabolism of amino acids (62), especially of glutamate and glutamine, and a reduction of the pentose phosphate pathway (1) necessary for NADPH generation, which ultimately may lead to a decrease of two essential substrates for GSH synthesis together with cysteine.
Altogether, these findings suggest that glutathione metabolism is an important pathway for HDACi activity in cancer cells. In agreement with prior reports (48, 75), our results therefore suggest that ROS accumulation in cancer cells may be a mechanism of cancer-specific cytotoxicity of HDACi. In addition, we suggest that elevated ROS levels upon GSH depletion, due to HDACi treatment or by chemical compounds interfering with GSH synthesis, may enhance cell death in cancer therapy. In accordance, BSO has been used indeed in combination with other chemotherapeutics to induce apoptosis (37) or to sensitize resistant tumor cells, as we also show is the case for BT474 cells and primary breast tumors in response to SAHA (Fig. 7C and 8C).
Certainly, the observed effect of SAHA on sensitive and resistant cells stems from multifactorial mechanisms, among which are the restoration of the expression of negative regulators of the cell cycle such as p21 (25) and the activation of proapoptotic proteins such as BCL2-associated X protein (Bax) (72), which must also be taken into account to evaluate the role of glutathione metabolism in the different response observed in these two cell lines.
In the future, we wish to connect tumor epigenetic status to SAHA sensitivity and glutathione metabolism. It is predictable that the global increase in histone acetylation (Supplementary Fig. S1) is the result of thousands of local increases at specific loci, which in turn alter transcription. Therefore, we expect that sensitive and resistant cells will differ in their antioxidant response, for example, resistant cells specifically activating genes involved in ROS detoxification. However, the consequences of global changes in the levels of multiple histone modifications upon SAHA treatment are more difficult to predict given their potential opposing functional effects on transcriptional activity and our incomplete understanding of their distribution through the cancer genome.
In conclusion, by shedding new light on the relationship between HDAC inhibition and redox, our study may lay the basis for the definition of a cohort of breast cancer patients with the potential to show responsiveness to SAHA.
Materials and Methods
Cell culture
MCF7, SKBR3, T47D, MDA-MB-361, and BT474 cell lines were grown in Dulbecco's modified Eagle's medium (DMEM) (Lonza) supplemented with antibiotics (100 U/ml penicillin and 100 μg/ml streptomycin) (Gibco), 2 mM
Tumor human tissue specimens were obtained from patients undergoing surgery for the removal of clinically confirmed neoplasia (39). Briefly, tumor pieces were minced and suspended for 4–6 h in the enzyme digestion mixture (DMEM with penicillin/streptomycin, 2 mM
The suspension was filtered in a cell strainer of 70 μm, centrifuged, and resuspended in a specific medium for adhesion primary cell culture. The medium composition was as follows: F-12 and DMEM (1:1) supplemented with 1% fetal calf serum, 20 μg/ml gentamicin (Lonza), 10 mM hepes ph 7.5 (Lonza), 10 nM triiodothyronine (Sigma), 35 μg/ml bovine pituitary extraction (Gibco), 50 μM
Primary breast tumor cultures were grown in a humidified 37°C incubator with 5% CO2.
Immunoblots and antibodies
Whole-cell extracts were obtained by lysis in a sodium dodecyl sulfate (SDS) buffer (50 mM of Tris-HCl, 10% glycerol, 2% SDS) supplemented with leupeptin 1 μg/ml, aprotinin 1 μg/ml, PMSF 100 μg/ml, and EDTA 1 mM. Twenty micrograms of whole-cell lysate was resolved by 15% SDS-polyacrylamide gel electrophoresis, blotted onto a polyvinylidene difluoride membrane, and probed with polyclonal anti-GSS (Santa Cruz), polyclonal anti-GSR (Santa Cruz), monoclonal antiacetylated histone H4 (K8, K12) [homemade (45, 50)], and polyclonal antihistone H4 (Abcam) or monoclonal antivinculin (Sigma) as a control for protein loading.
Primary antibodies were detected with the ECL detection system (Amersham Biosciences). For detection of histone H4 and acetylated histone H4 (K8, K12), we used IRDye 680-labeled goat-anti-rabbit IgG or IRDye 800-labeled goat-anti-mouse IgG (LI-COR Biosciences). Bands were visualized and quantified using an Odyssey Infrared Imaging System (LI-COR Biosciences).
Growth curves
Primary breast tumor cells were seeded in 12-well plates (30,000 cells/well) and treated (or not) with SAHA at different concentrations: 0.5, 0.8, 1, 1.5, and 2 μM. After 6 days, the plates were stained with CV (1% powder from Sigma, 35% ethanol in water) for evaluation of cell growth in the absence/presence of SAHA.
The dye from the stained plates was extracted using 10% acetic acid and a spectrophotometric measurement at 595 nm was made. We have classified the tumors as resistant if reduction in CV staining, at 1 μM SAHA concentration, was less than 50% and sensitive if more than 50%.
Breast cell lines were seeded in 96-well plates (4000 cells/well) and treated (or not) with the following SAHA concentrations: 0.5, 1, and 1.5 μM. After 6 days, the plates were stained with CV. The evaluation of cell growth curves was as described above.
To analyze the effects of combined treatments with SAHA and antioxidants, NAC and SAC (Sigma) and BSO and DEM (Sigma), MCF7 and BT474 cell lines were seeded in a 12-well plate (62,500 cells/well) and treated with 1 μM SAHA and/or 2 mM NAC, 100 μM SAC, 250 μM BSO, and 100 μM DEM. Cell growth was evaluated by CV staining.
Primary cells were seeded in 96-well plates (2500 cells/well) and treated with 1 μM SAHA and/or 50 μM BSO. After 3 days, the plates were stained with CV.
RNA extraction and qPCR
Total RNA was extracted from breast cell lines using an RNeasy mini kit from Qiagen, according to the manufacturer's recommendation. One microgram of RNA was retrotranscribed using Improm II reverse trascriptase (Promega).
Five micrograms of c-DNA was analyzed by qPCR using Fast SYBR Green (Applied Biosystems) and processed on the 7500 Fast Real-Time PCR system (Applied Biosystem). GAPDH was used as the housekeeping gene for normalization.
Primer sequences used for qPCR are shown below:
qPCR data for each gene were normalized on the GAPDH level in the corresponding cell line and shown as a heatmap. To mitigate the effect of the extreme outliers in data visualization, values exceeding the 95th percentile were set to this value. For hierarchical clustering (average linkage), values were not saturated, except that missing values were replaced with zeros. The distance among genes was measured as 1 minus the Spearman's rank correlation coefficient of their normalized expression levels.
ROS determination
ROS levels were measured by staining live cells with 5 μM dichloro-dihydro-fluorescein-diacetate (DCFH2-DA; Life Technologies) for 30 min at 37°C. After staining, the cells were detached with trypsin, collected in PBS plus serum, and analyzed by FACS.
GSH determination
GSH (total, oxidized, and reduced) levels were quantified using an enzymatic assay kit purchased by Cayman, according to the datasheet protocol. The amounts of GSH in cell lysates were calculated from GSH standard curves and normalized to micrograms of proteins.
Gene expression profile analyses
CEL files were imported into Partek® Genomics Suite software 6.5 (build 6.11.0321, Copyright; Partek, Inc.). Data were RMA normalized and annotated at the transcript level.
Transcripts showing a log2 intensity value of 6 in at least one cell line were retained for further analyses. ANOVA was then performed to identify transcripts showing a differential expression among different cell lines (Benjamini–Hochberg-corrected p-value equal or less than 0.05). After computing the mean among triplicates for each gene in each cell line, expression values were scaled to 0–1 for each gene. These were used as input for PCA.
ANOVA was also used to evaluate differential expression among sensitive and resistant samples. Transcripts with at least a twofold change and p-value equal or lower than 0.05 were retained as differentially expressed. Subsequent analyses were limited to probe sets matching annotated RefSeq genes. Differentially expressed genes shown in the heatmaps were hierarchically clustered using average linkage. The distance among transcripts and samples was evaluated using Spearman's correlation (1−r). R was used to compute statistics, perform cluster analysis, and generate heatmaps.
Functional annotations significantly associated with differentially expressed genes were identified using GeneCoDis (55).
Microarray data are available for download from the Gene Expression Omnibus (GEO) under the accession number, GSE49640.
Footnotes
Acknowledgments
This work was supported by grants from Associazione Italiana per la Ricerca sul Cancro (A.I.R.C.) to S.C., S.M., and F.C. and from the Italian Ministry of Health. F.C. has also been partially supported by SysBioNet, an MIUR grant for the Italian Roadmap of ESFRI Infrastructures and from the Italian Government (FAR). I.B. is supported by an Umberto Veronesi Foundation fellowship (F.U.V.). R.P. has been supported by fellowships of SysBioNet. The authors wish to thank Merck for the financial support during the first part of their studies.
Author Disclosure Statement
No competing financial interests exist.
Abbreviations Used
References
Supplementary Material
Please find the following supplemental material available below.
For Open Access articles published under a Creative Commons License, all supplemental material carries the same license as the article it is associated with.
For non-Open Access articles published, all supplemental material carries a non-exclusive license, and permission requests for re-use of supplemental material or any part of supplemental material shall be sent directly to the copyright owner as specified in the copyright notice associated with the article.