
Abstract
Introduction
E3
Previous reports have focused on the ability of C-terminus of HSC70-interacting protein (CHIP) to promote protein degradation or refolding as a primary mediator of neuroprotection. In this work, we show that CHIP relocalizes to mitochondria following acute stress (Fig. 4A, B) and that CHIP is an essential regulator of neuronal redox and energetic tone (Fig. 1). While neuronal development appears normal without CHIP, CHIP knockout (KO) animals experience high levels of lipid and protein oxidation, and neurons respond poorly when subjected to acute mitotoxic challenge (Fig. 8).
Parkin controls mitochondrial dynamics via its interaction with the mitochondrial redox sensor and serine–threonine kinase, PTEN-inducible putative kinase 1 (PINK1) (26, 27, 39, 44, 63), mutations in which result in an autosomal recessive inherited form of PD (55). Although E3 ligases often interact with substrates in a redundant manner, they can also impact protein folding and transcription independent of their ubiquitinating activities and can participate in the autophagy-dependent clearance of damaged mitochondria (mitophagy) (11, 24, 27).
We recently reported that C-terminus of HSC70-interacting protein (CHIP) haploinsufficiency results in mild behavioral impairments and profound changes in motor function in young animals (29). These data are particularly striking given that deletion of Parkin has a benign phenotype (43), whereas loss of CHIP is catastrophic early in life, resulting in the death of ∼30% of animals by postnatal day (PND)40 (8, 38).
In the current study, we report that CHIP relocalizes to damaged mitochondria following injury and that CHIP-positive materials are engulfed in autophagic bodies. We also report that in the absence of CHIP, young animals (PND35) have significantly increased baseline levels of protein oxidation and lipid peroxidation and undergo accelerated stress-induced mitochondrial permeability transition activity. Using a novel biochemical capture methodology, we found that dynamin-related protein 1 (Drp1), a key protein associated with mitochondrial homeostasis, and Parkin are oxidized in wild-type (WT) and heterozygous (Het), but not CHIP knockout (KO) animals. Lastly, we note that while neuronal cultures generated from CHIP KO mice appear intact, they are much more vulnerable to oxygen–glucose deprivation (OGD) than WT control cells. Taken together, this work suggests that CHIP is a critical determinant of mitochondrial integrity, function, and homeostasis in response to acute injury.
Results
CHIP-deficient animals have increased protein oxidation and lipid peroxidation, impaired antioxidant defenses, and experience energetic stress in the CNS early in development
We previously demonstrated that CHIP expression is increased in postmortem human tissue samples in patients following ischemic stroke as well as in an in vitro model of neuronal ischemia (51). In contrast to the benefits associated with transiently increased CHIP expression in blocking cell death induced by PD mutant genes (53), prolonged overexpression of CHIP worsens outcome following acute injury and causes proteasomal uncoupling (51), suggesting that a fine balance exists in the temporal expression of CHIP that affords neuroprotection.
To identify the mechanisms by which CHIP alters neuronal responsiveness to stress, we compared baseline levels of total oxidized proteins in CNS samples from PND35 WT, Het, and CHIP KO mice. A robust increase in total protein oxidation was evident in CHIP KO animals compared with age-matched WT and Het littermates (Fig. 1A). In addition, comparing F2t-Isoprostanes (F2t-IsoPs), the gold standard for assessing oxidative injury (16), across genotypes, we found that CHIP KO animals exhibit significant increases in the nonenzymatic oxidation of arachidonic acid (Fig. 1B) and depletion of antioxidants reflected by the ratio of reduced glutathione (GSH) to oxidized glutathione (GSSG) (Fig. 1C). This decrease in the reduced form of GSH that occurs when CHIP is absent could either be attributed to antioxidant depletion as cells attempt to clear the large number of oxidized substrates or due to an inherent energetic deficit in the animals, as the synthesis of GSH requires both ATP and NADPH.
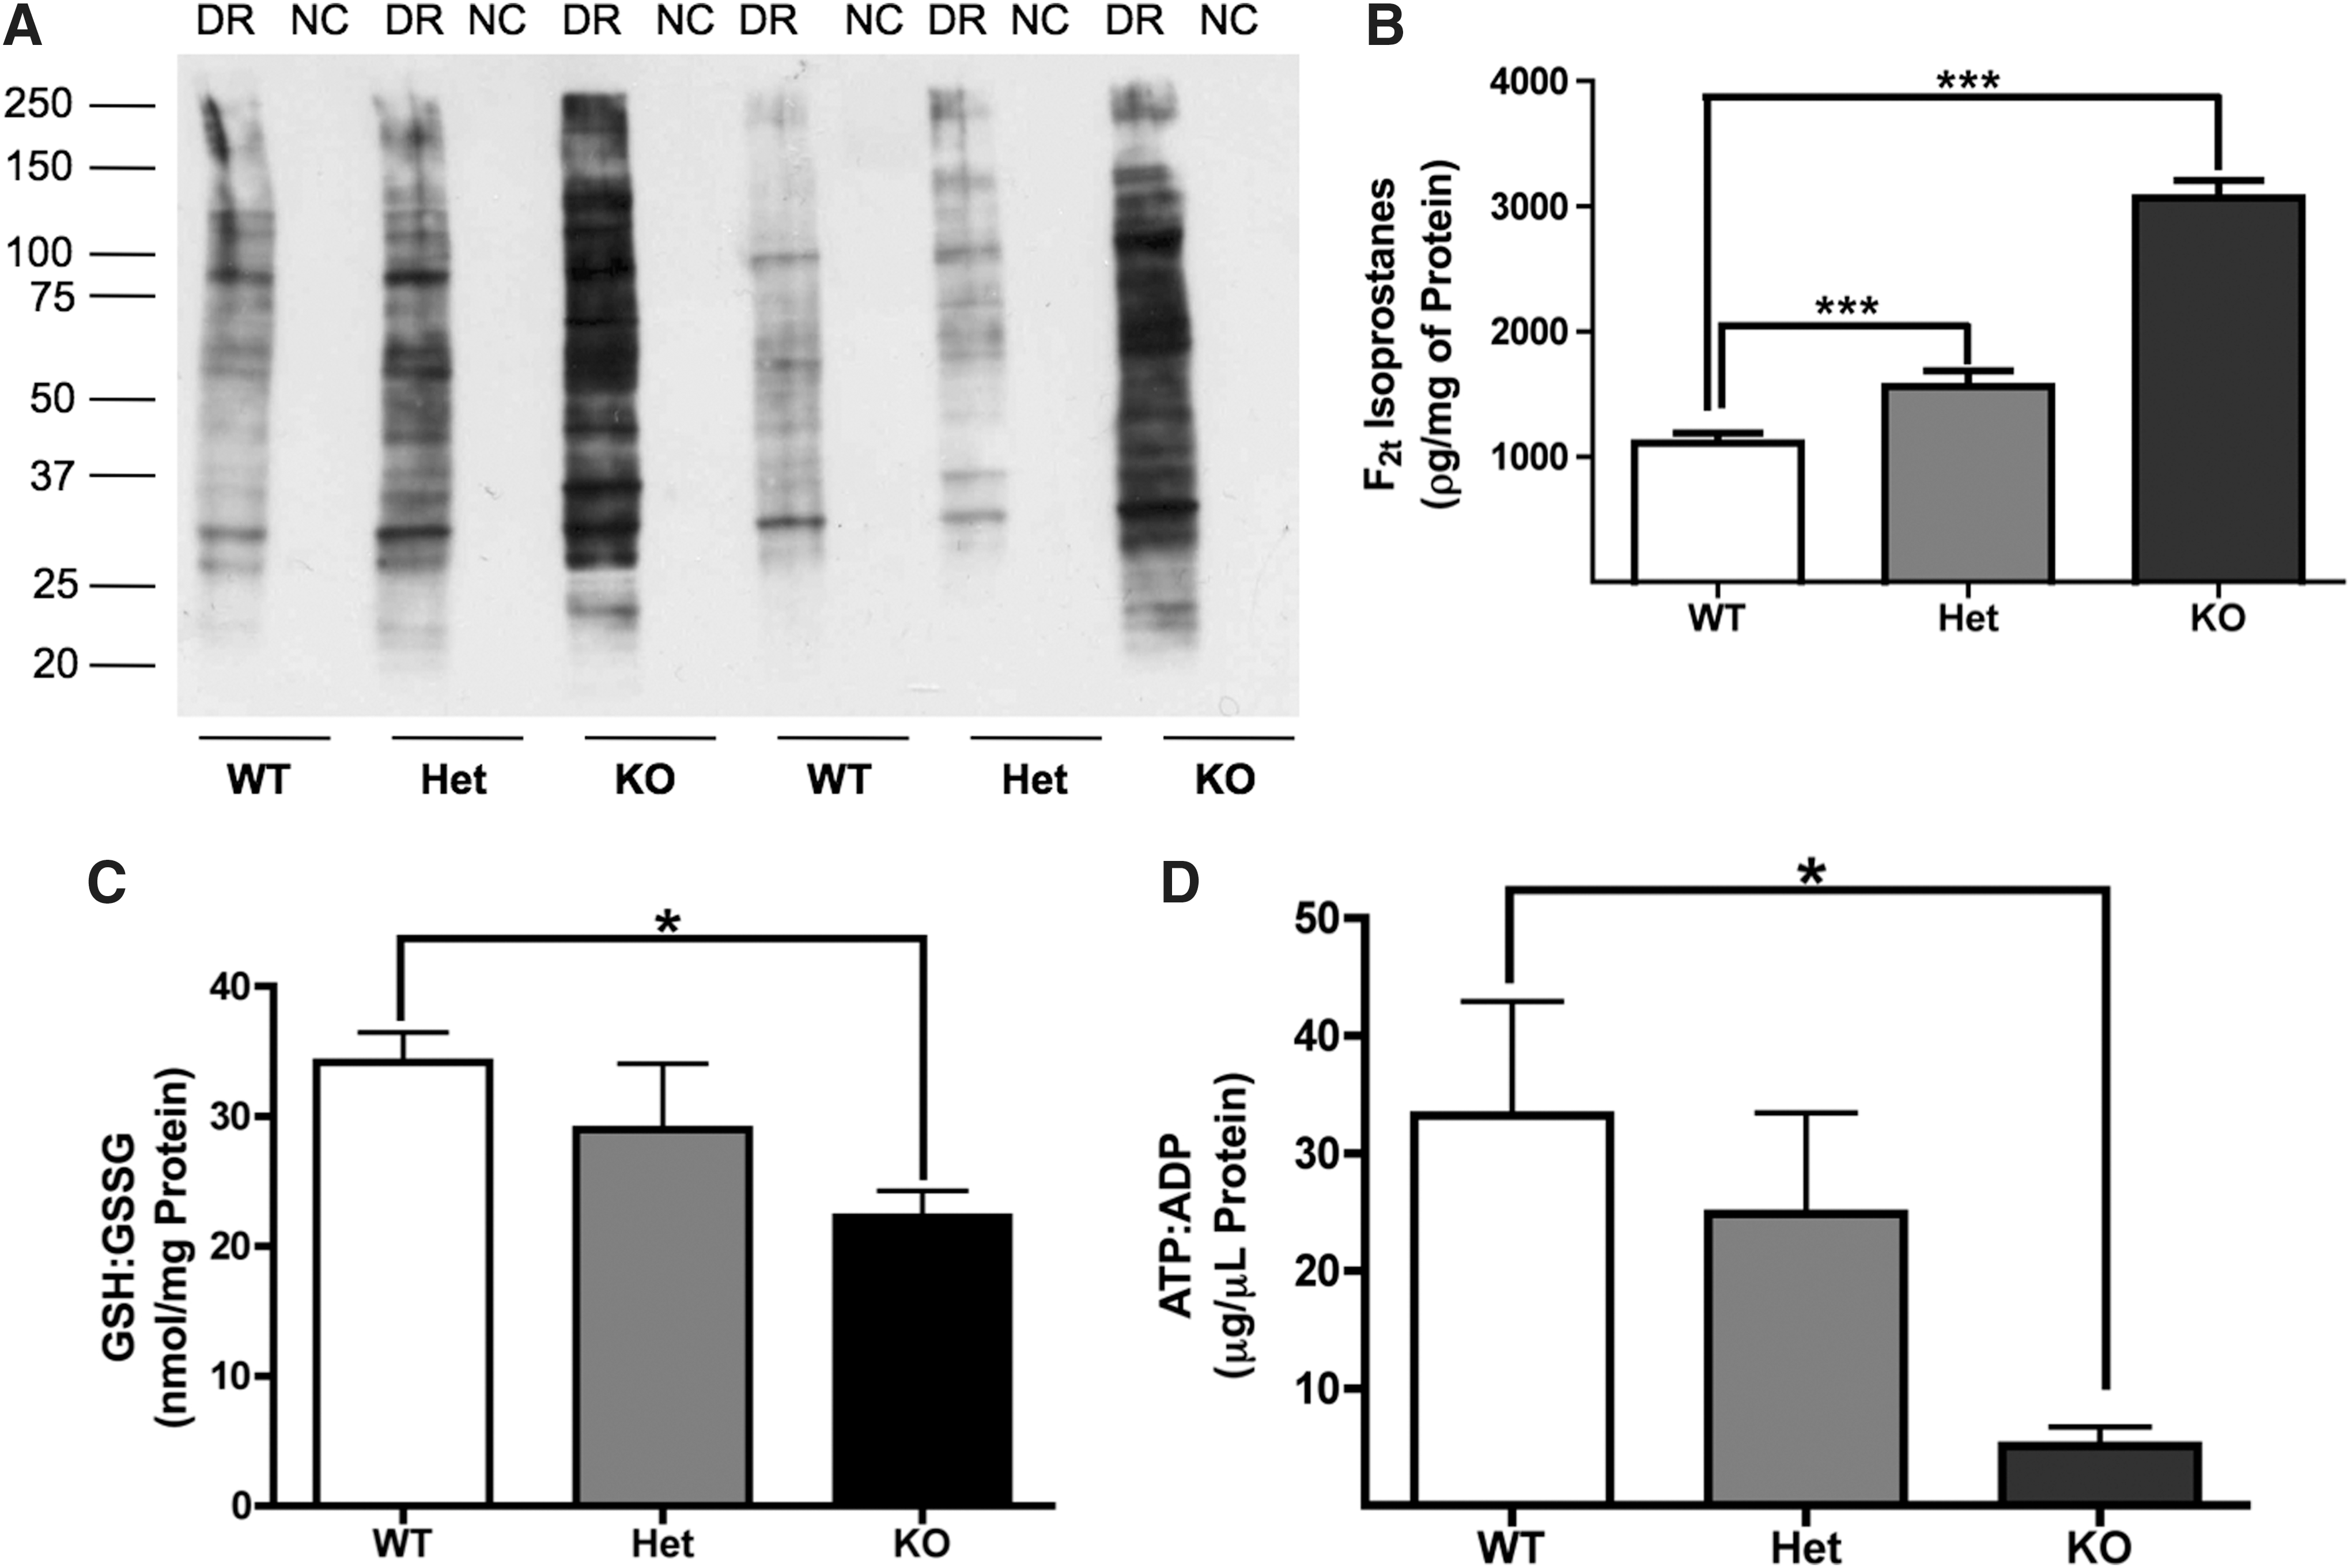
To determine if variations in energetic status may account for the decreased levels of GSH in CHIP KO mice, the ratio of ATP to ADP was determined via a bioluminescent assay. There is significantly lower ATP in CHIP KO animals and a trend toward decreased ATP in Het animals, while no changes in the absolute levels of ADP were noted between or within any groups. The resulting decreased ATP-to-ADP ratio (Fig. 1D) suggests that CHIP deficiency results in impaired brain energetic status.
CHIP deficiency increases the expression of mitochondrial proteins associated with PD
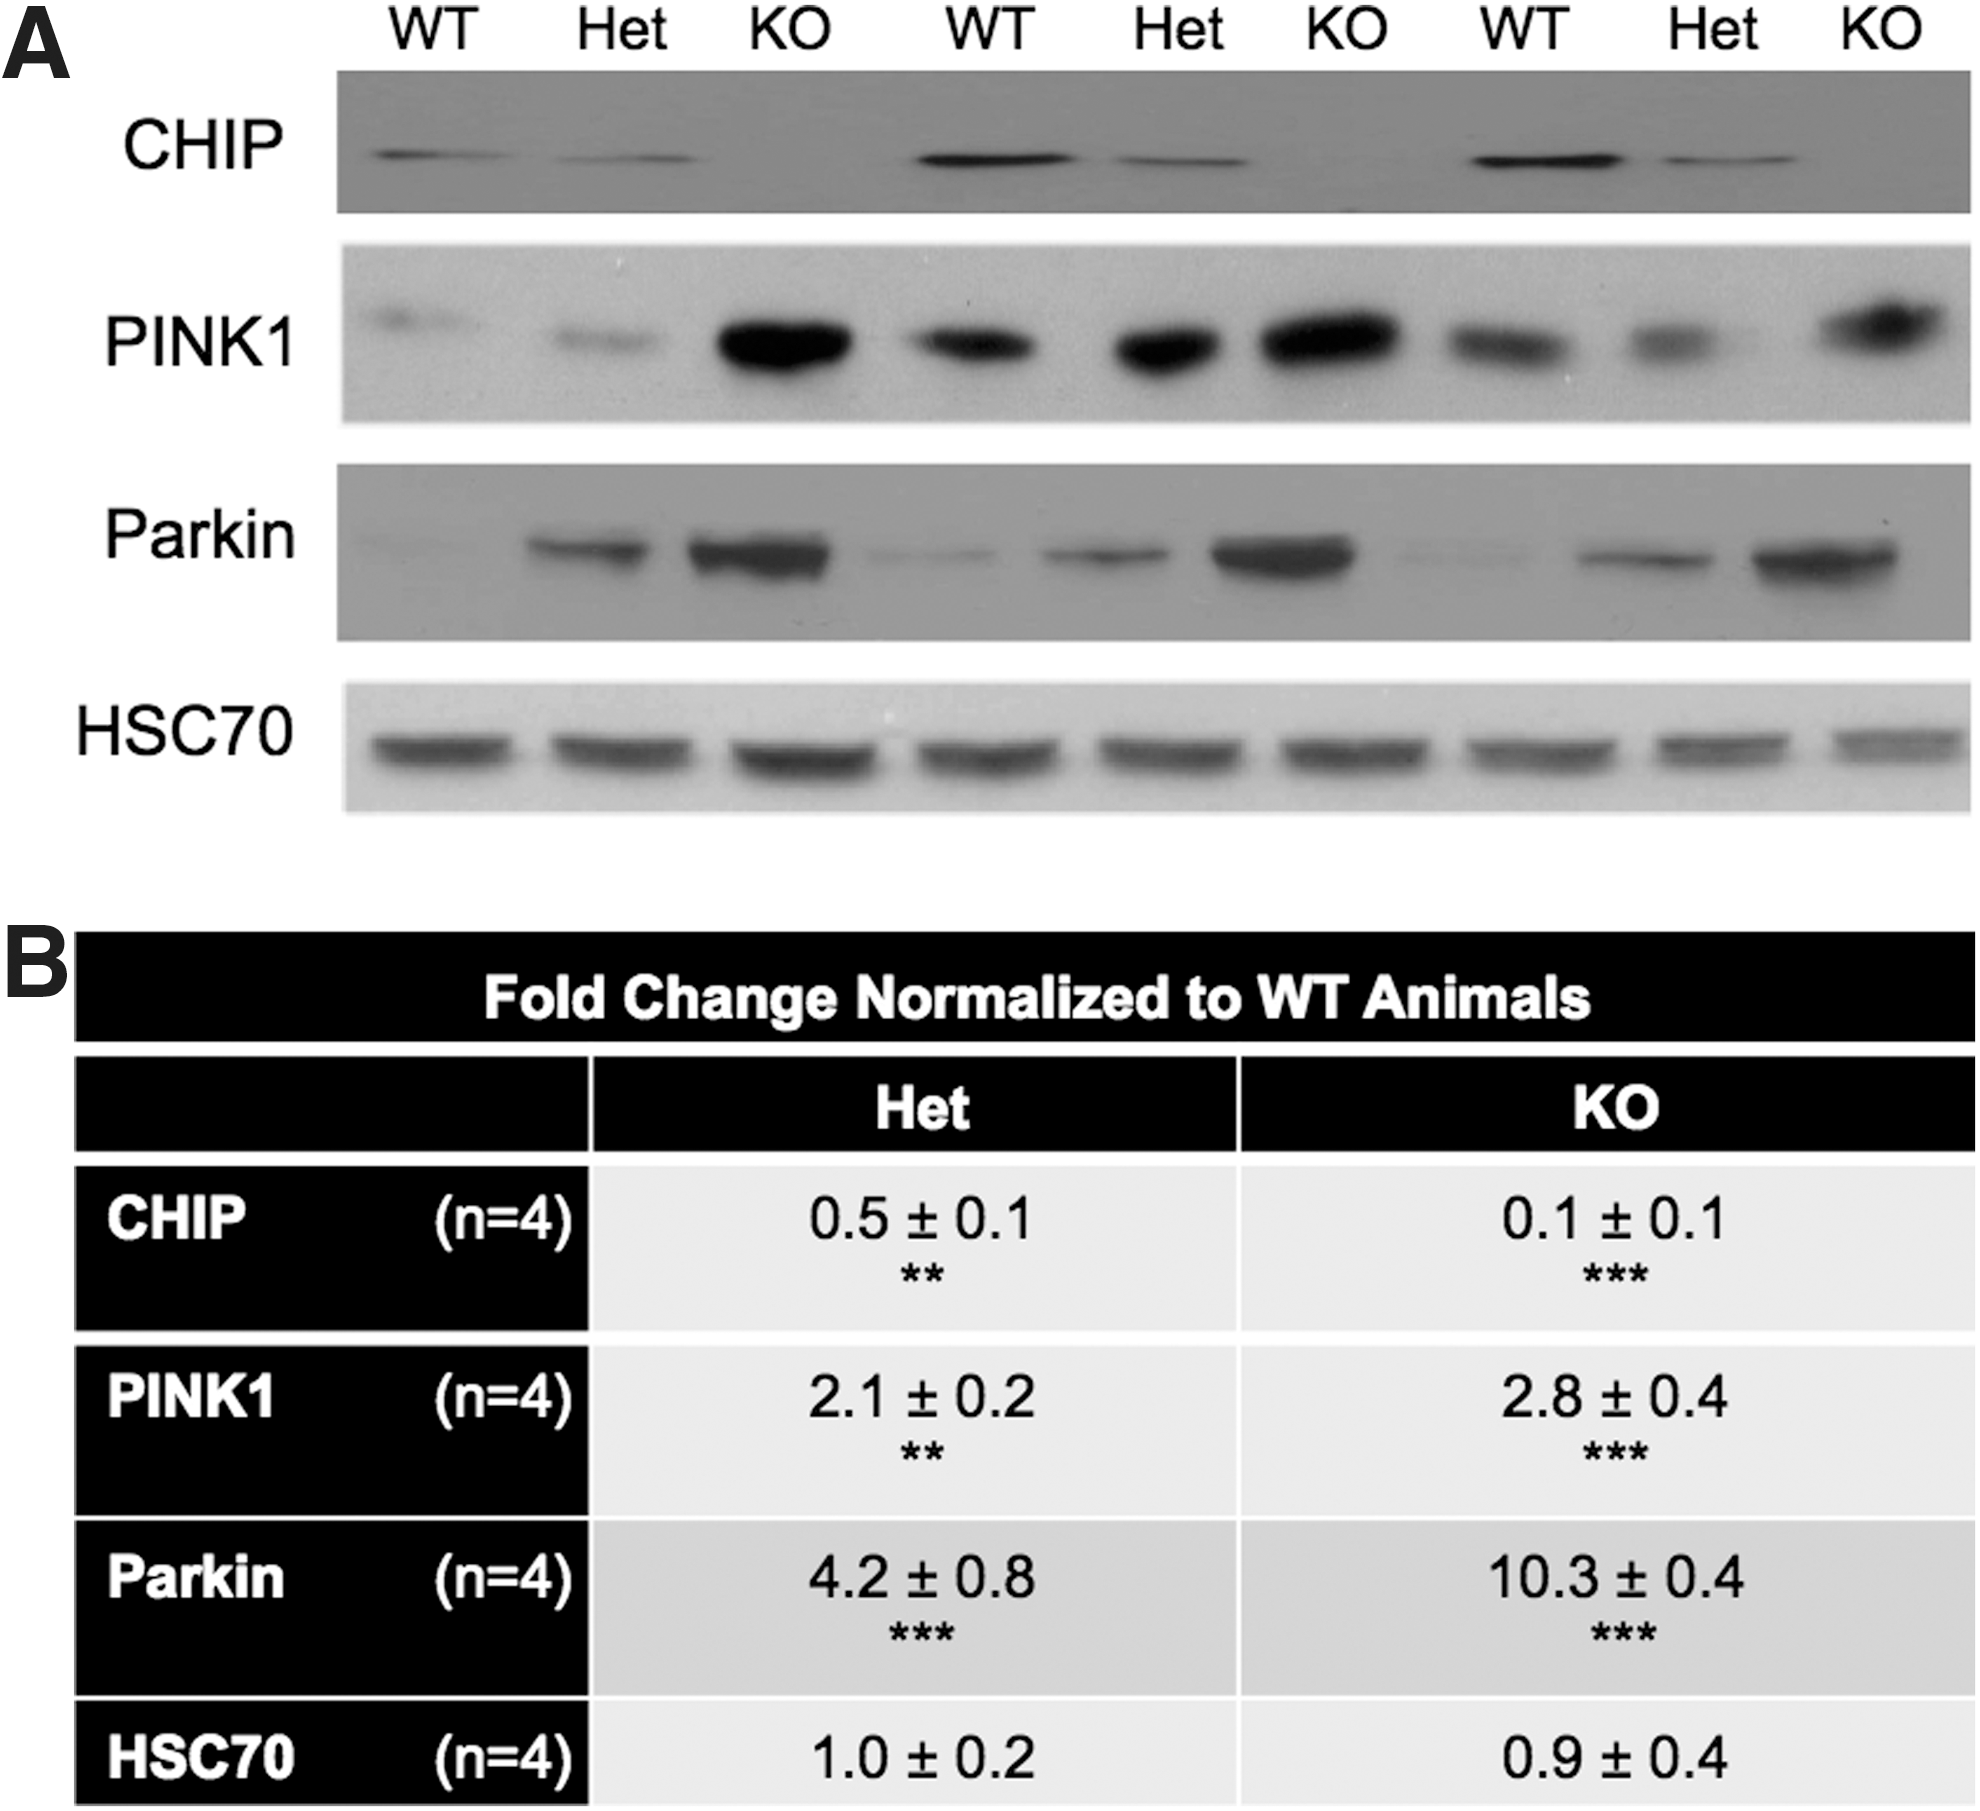
The increase in oxidized proteins and lipids in the absence of an exogenous stressor observed in Het and CHIP KO animals suggests that either more reactive oxygen species (ROS) are generated, that ROS are poorly converted to nonreactive species by antioxidants, or a combination of these two events. A growing body of evidence in the PD literature suggests a role for two genes associated with familial PD, PINK1 and Parkin, in mitochondrial stress handling. Expression of the redox sensor, PINK1, and the E3 ligase, Parkin, were increased in brain extracts from CHIP KO animals (Fig. 2A, B).
OGD increases mitochondrial stress-associated protein expression
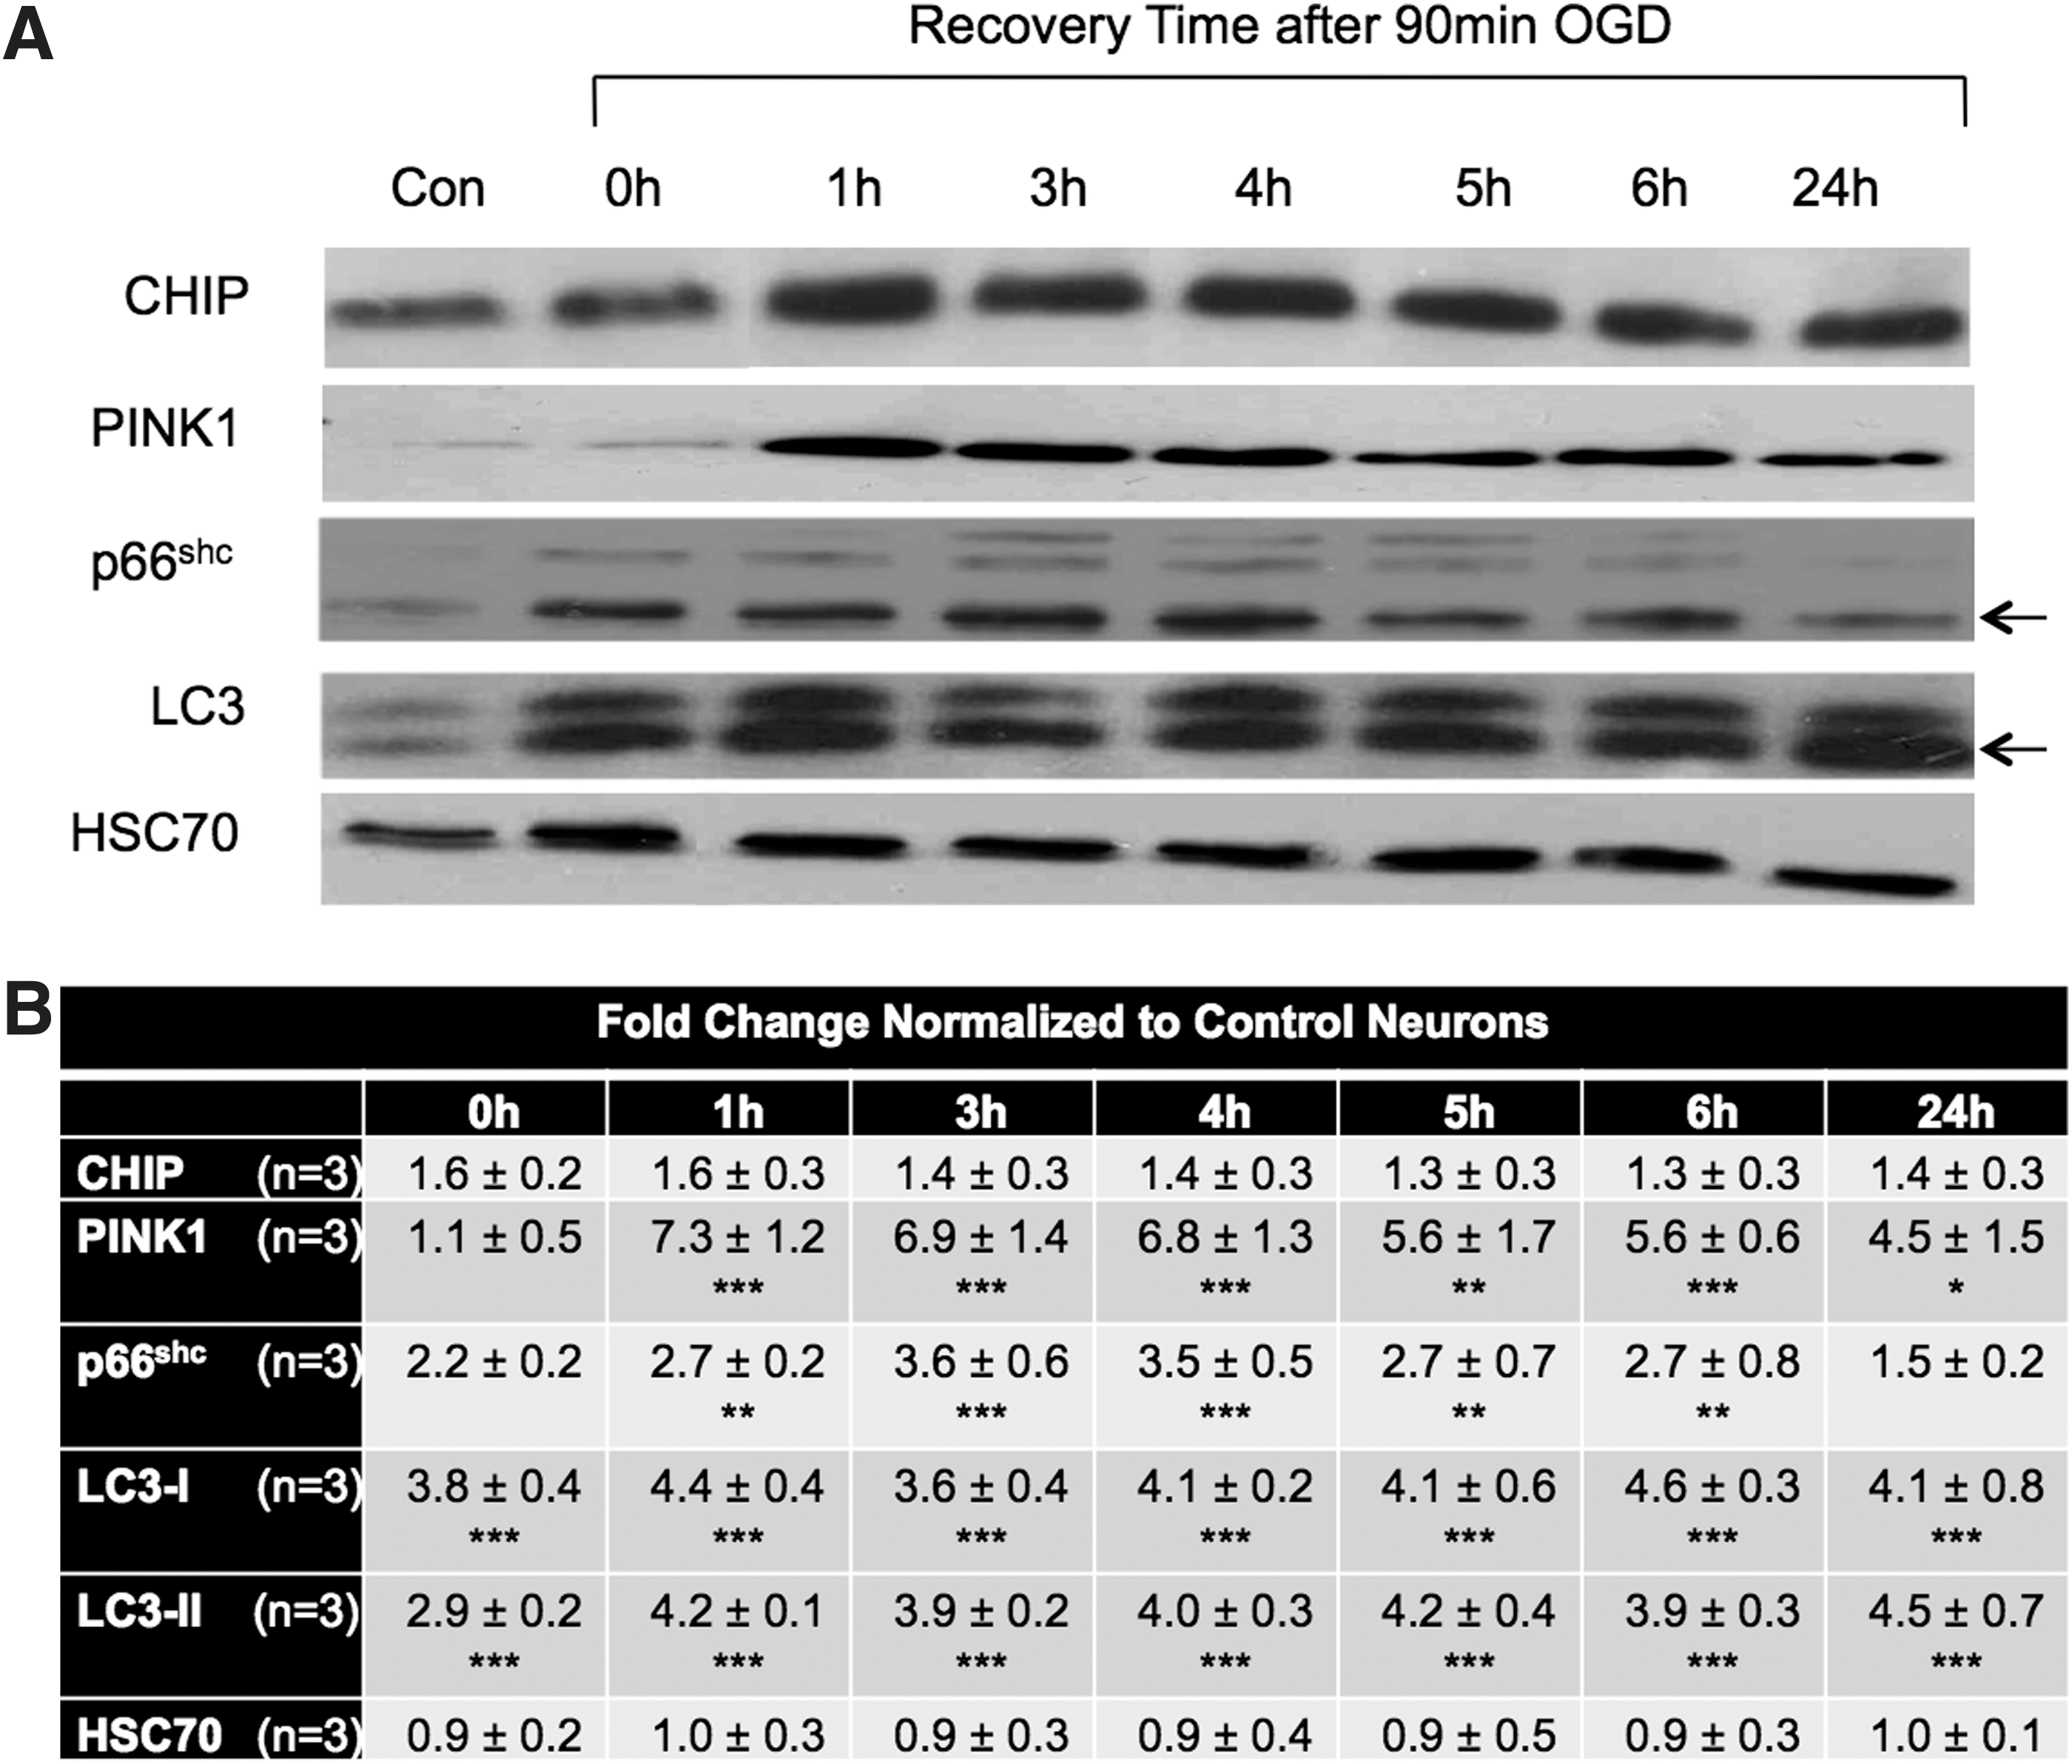
We next used an OGD model in neurons to determine if convergent signaling molecules between OGD and CHIP deficiency could be identified. We have previously shown that 90 min OGD results in membrane rupture and greater than 80% cell death evidenced as lactate dehydrogenase (LDH) release commencing 10 h after the onset of stress (61). Neuron-enriched cultures from rats were exposed to 90 min OGD to analyze levels and trafficking of redox-sensitive molecules, including CHIP. PINK1 and CHIP expression increase as early as 1 h following the insult and remain elevated for 24 h. Increased expression of the redox-sensitive kinase p66shc as well as the unlipidated (LC3-I) and lipidated (LC3-II, noted with an arrow) forms of the autophagic marker, LC3, were also observed 2 to 6 h after OGD (Fig. 3A, B).
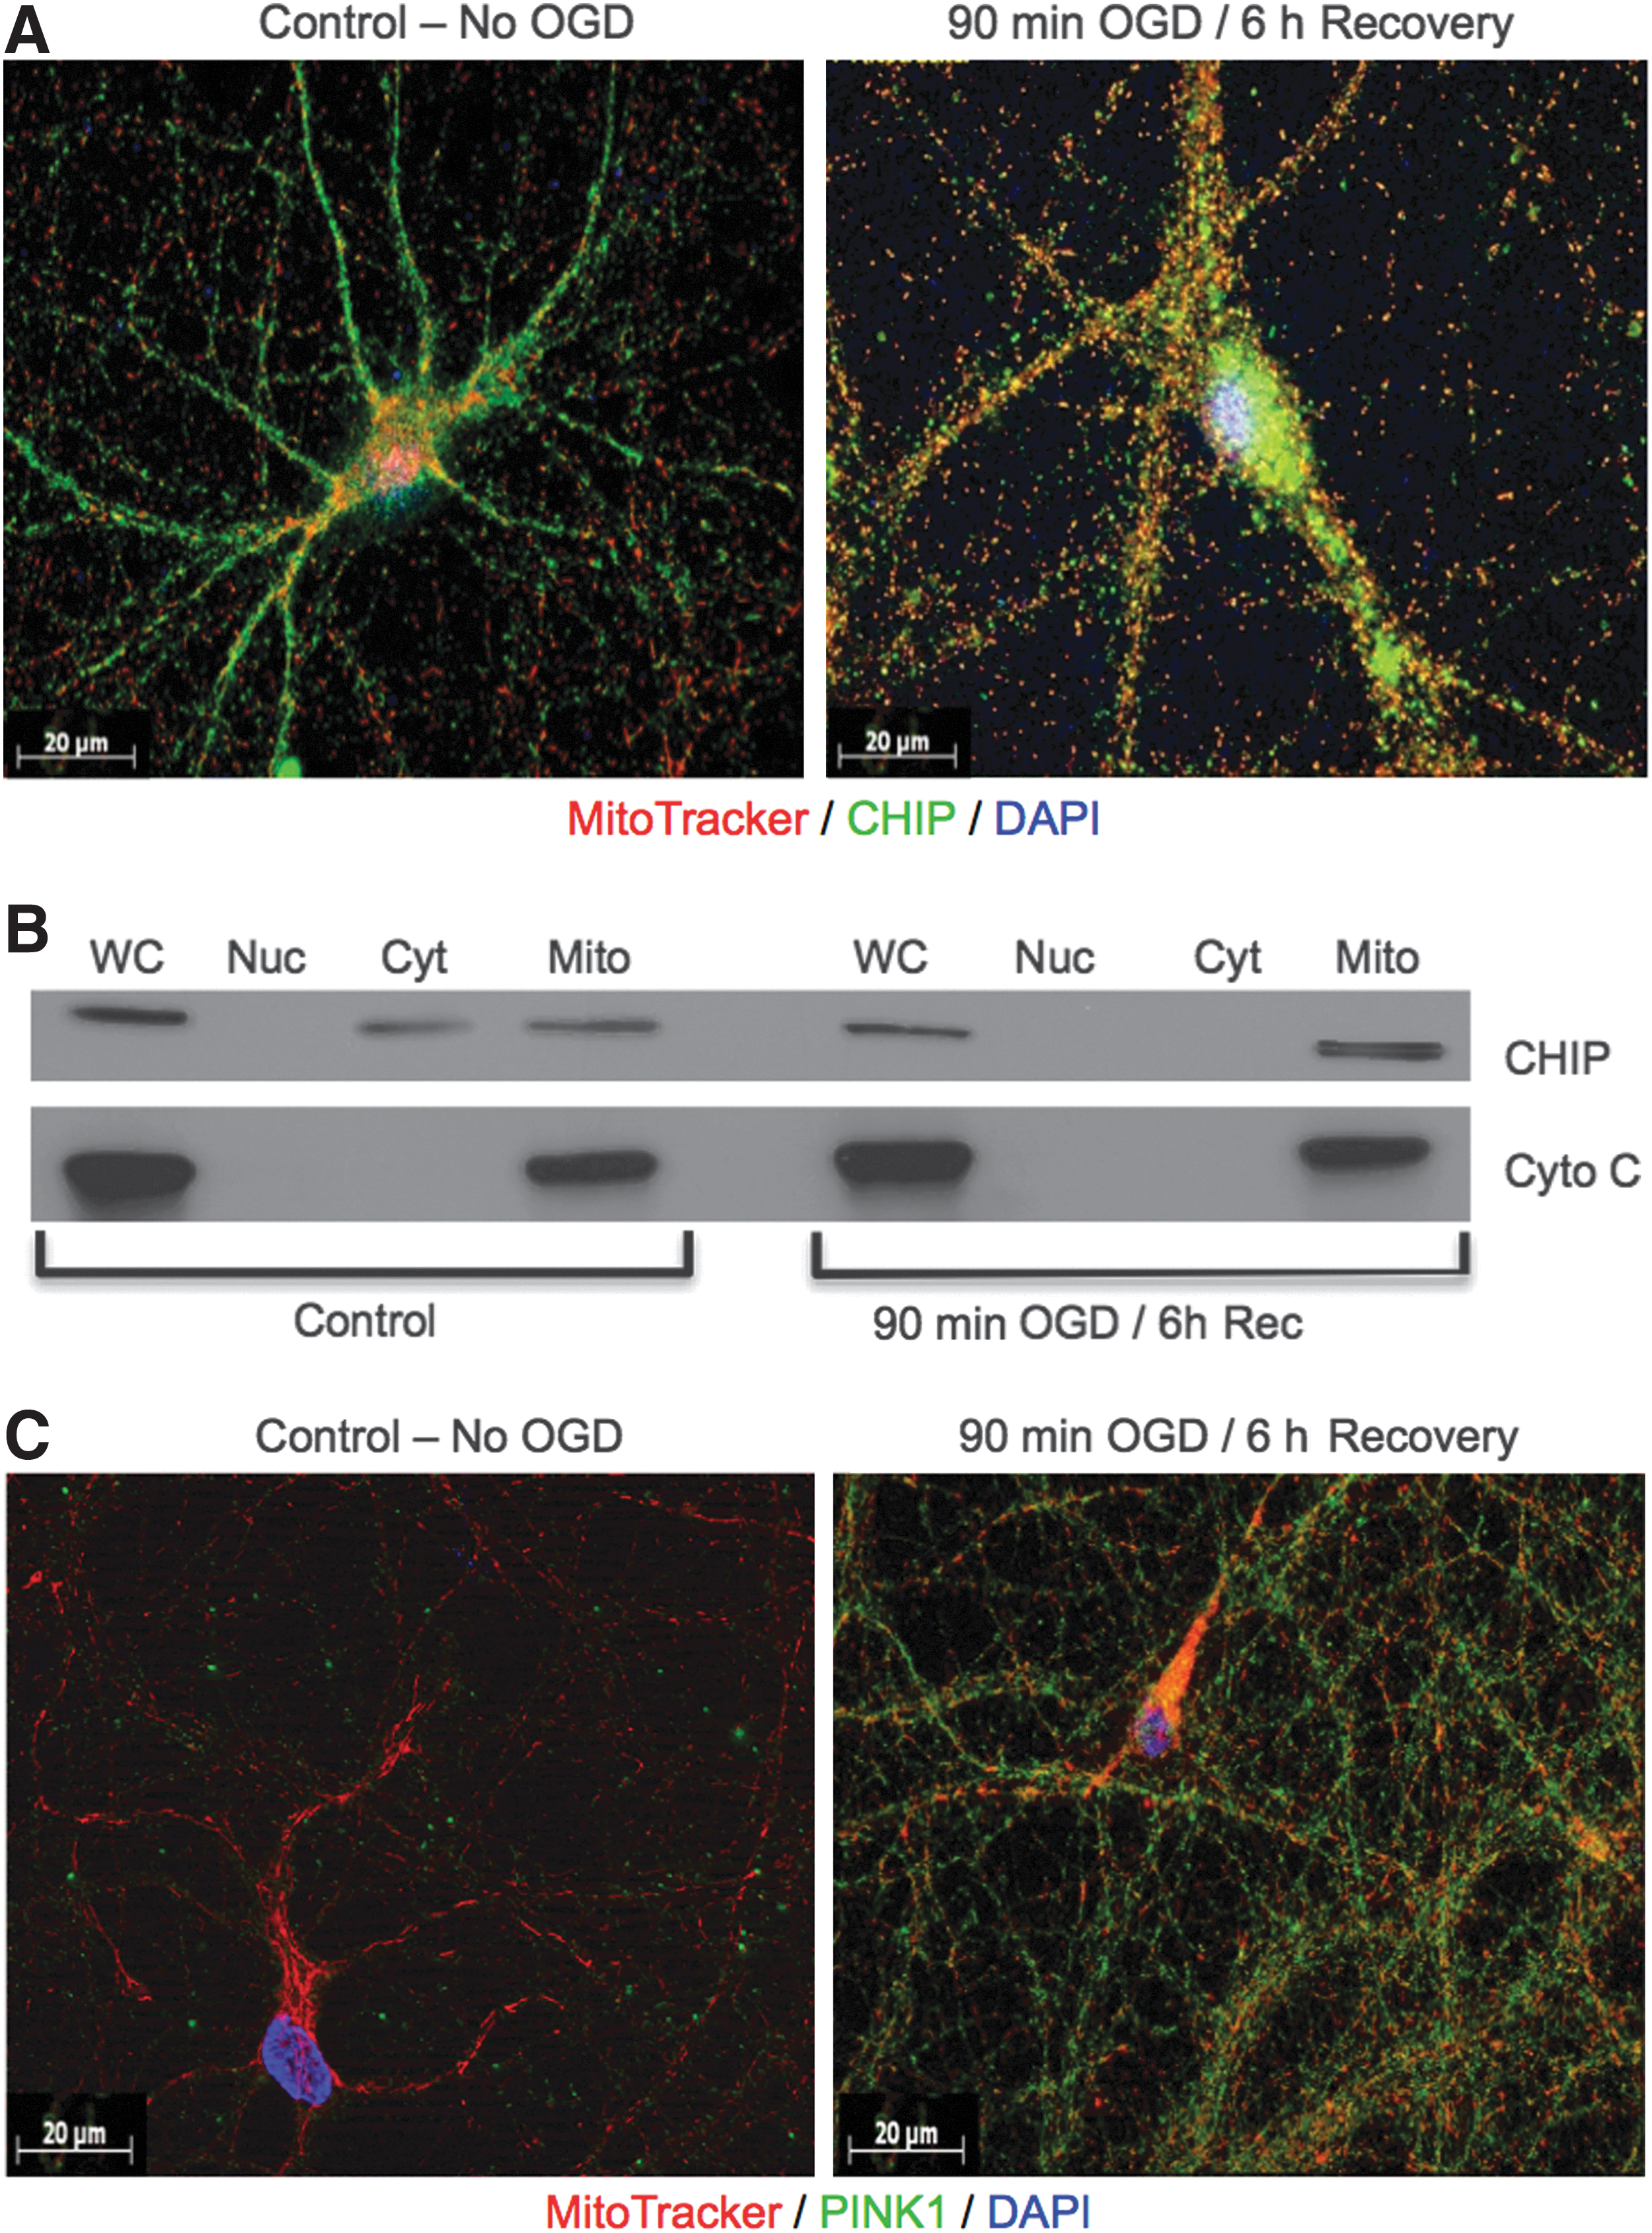
The early redox sensors upregulated by OGD, p66shc and PINK1, associate with mitochondria in response to stress (3, 26). Prior studies have only evaluated CHIP distribution in cytosolic and nuclear fractions, the latter of which likely contained mitochondria as the centrifugation speeds noted in the methods are not sufficient enough to efficiently separate these organelles (1, 49). Our immunocytochemical analysis revealed a very different pattern of distribution following OGD where CHIP relocates from cytosolic and perinuclear sites to mitochondria. After 90 min OGD, mitochondria (shown in red) underwent morphological reorganization and CHIP became more punctate, increasingly colocalizing with these organelles (Fig. 4, left vs. right). Subcellular fractionation experiments, 6 h following 90 min OGD, revealed that there was no nuclear CHIP signal as all CHIP associated with mitochondria. Control blots were run for KU70, β-tubulin, and cytochrome oxidase to confirm the purity and integrity of the organelles and showed no cross-contamination (data not shown). Stabilization of PINK1 (green) at MitoTracker-labeled organelles (red) was also detected 6 h following OGD, whereas in control cells, PINK1 levels were barely detectable in keeping with immunoblot data (Fig. 4C left vs. right).
Mitochondrial accumulation of PINK1 leads to the recruitment of the E3 ligase, Parkin, and subsequent autophagic degradation of mitochondria via mitophagy (12, 13, 40). We detected no change in Parkin or voltage-dependent anion channel (VDAC) expression in response to OGD in vitro, which is in keeping with results from other labs, which demonstrate that Parkin is poorly inducible in cortical neuronal cultures exposed to endoplasmic reticulum stress (34). We did, however, observe increases in LC3-I and LC3-II, the major components of autophagosomes (Figs. 3A, B and 5A, B). These data could reflect the induction of autophagy, reduction in autophagosome turnover, or the inability of turnover to keep pace with increased autophagic processing (20).
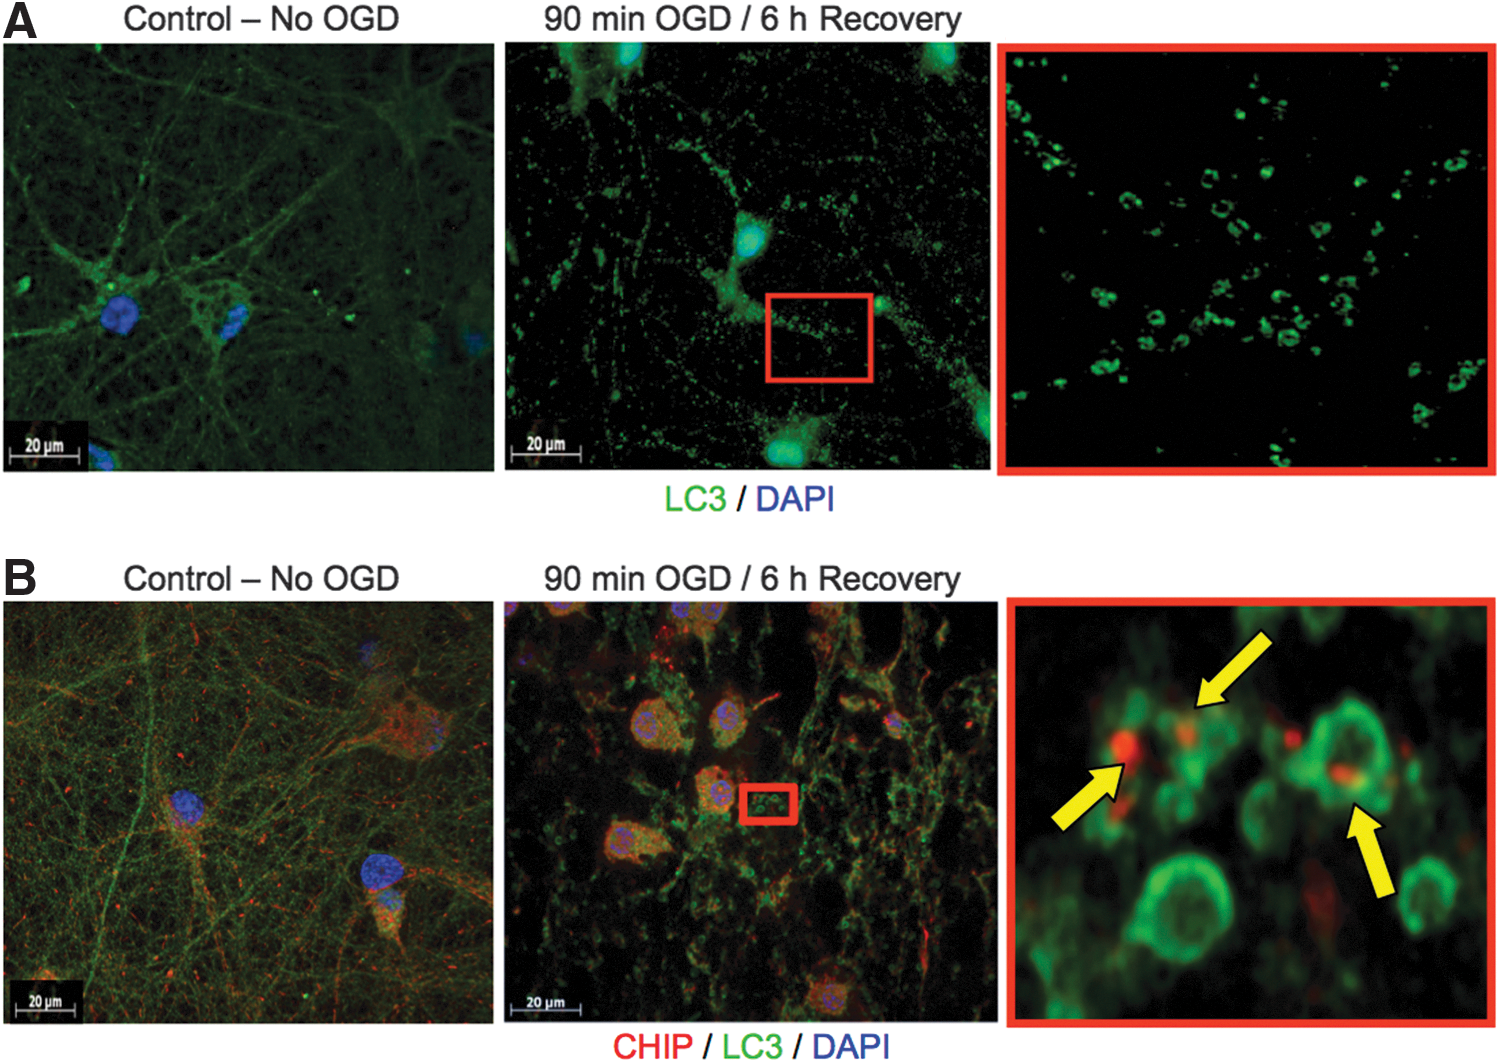
Immunofluorescent staining of cultures 6 h after exposure to 90 min OGD revealed many fields of small, circular LC3-positive structures (Fig. 5). Upon closer inspection of the fields (shown in red boxes magnified in the bottom panels), these structures were morphologically consistent with autophagosomes. Subsequent immunofluorescent staining revealed that many of the structures had CHIP engulfed within these autophagic bodies (Fig. 5; bottom right).
CHIP-deficient cultures appear morphologically intact and exhibit extensive neuronal processes and mitochondrial networks
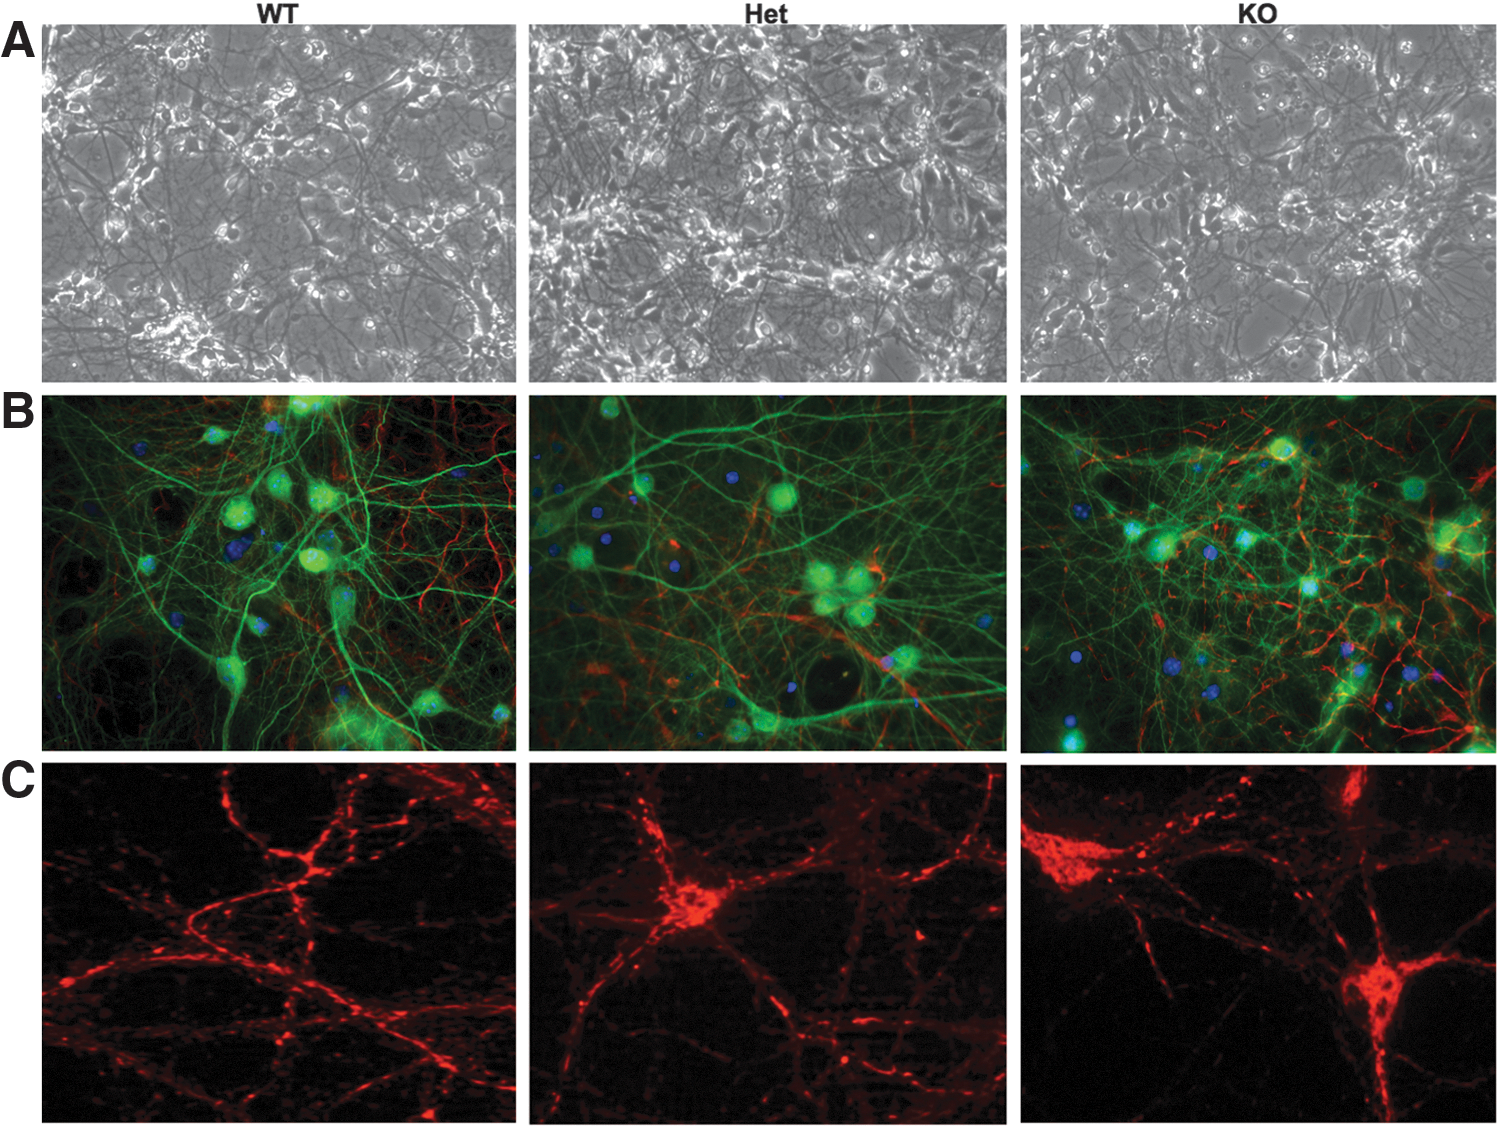
Given the relocalization of CHIP to mitochondria and the stress associated with CHIP deficiency in vivo, we sought to generate primary cultures from transgenic animals to determine if neurons develop and respond normally to stress in the absence of CHIP. Live cell micrographs (20×) of WT, Het, and CHIP KO cultures demonstrate that regardless of the genotype, neurons are viable with phase-bright somas and extensive neuronal processes after 3 weeks in culture (Fig. 6A). Immunocytochemical analyses using the neuronal marker, MAP2 (green), the glial marker, GFAP (red), and the nuclear marker, DAPI (blue), revealed that genotype has no effect on neuronal survival as these cells constituted 85% of the culture in every genotype (Fig. 6B). Using the live cell dye, MitoTracker Orange, which is taken up into healthy mitochondria based on their membrane potential, no changes in mitochondrial morphology or networks were evident across genotypes (Fig. 6C). Taken together, these data suggest that while CHIP deficiency has profound effects on baseline protein oxidation, lipid peroxidation, antioxidants, and energetics, neurons derived from CHIP KO animals are morphologically indistinguishable from WT and Het sister cultures.
CHIP deficiency affects the oxidation of mitochondrially associated proteins and mitochondrial transition activity
Given the changes in redox and energetic status associated with CHIP deficiency in vivo, we sought to determine if proteins involved in mitochondrial homeostasis are altered as a result of CHIP deficiency. Expression of VDAC and COX IV, proteins associated with mitochondrial integrity and function, remained unchanged in brains from CHIP KO animals (Fig. 7A, B), but there were high levels of both LC3-I and LC3-II (Fig. 7A, B). Analyses of further proteins essential for maintaining mitochondrial dynamics and homeostasis (Fig. 7A, B) revealed that CHIP KO animals have increased expression of the fission protein, Drp1, with no change in the mitochondrial fusion protein, Mitofusin 1 (Mfn1). As increased fission and subsequent formation of fragmented mitochondria have been linked to the induction of mitophagy (54), this may contribute to the pattern of LC3 expression observed in these animals.
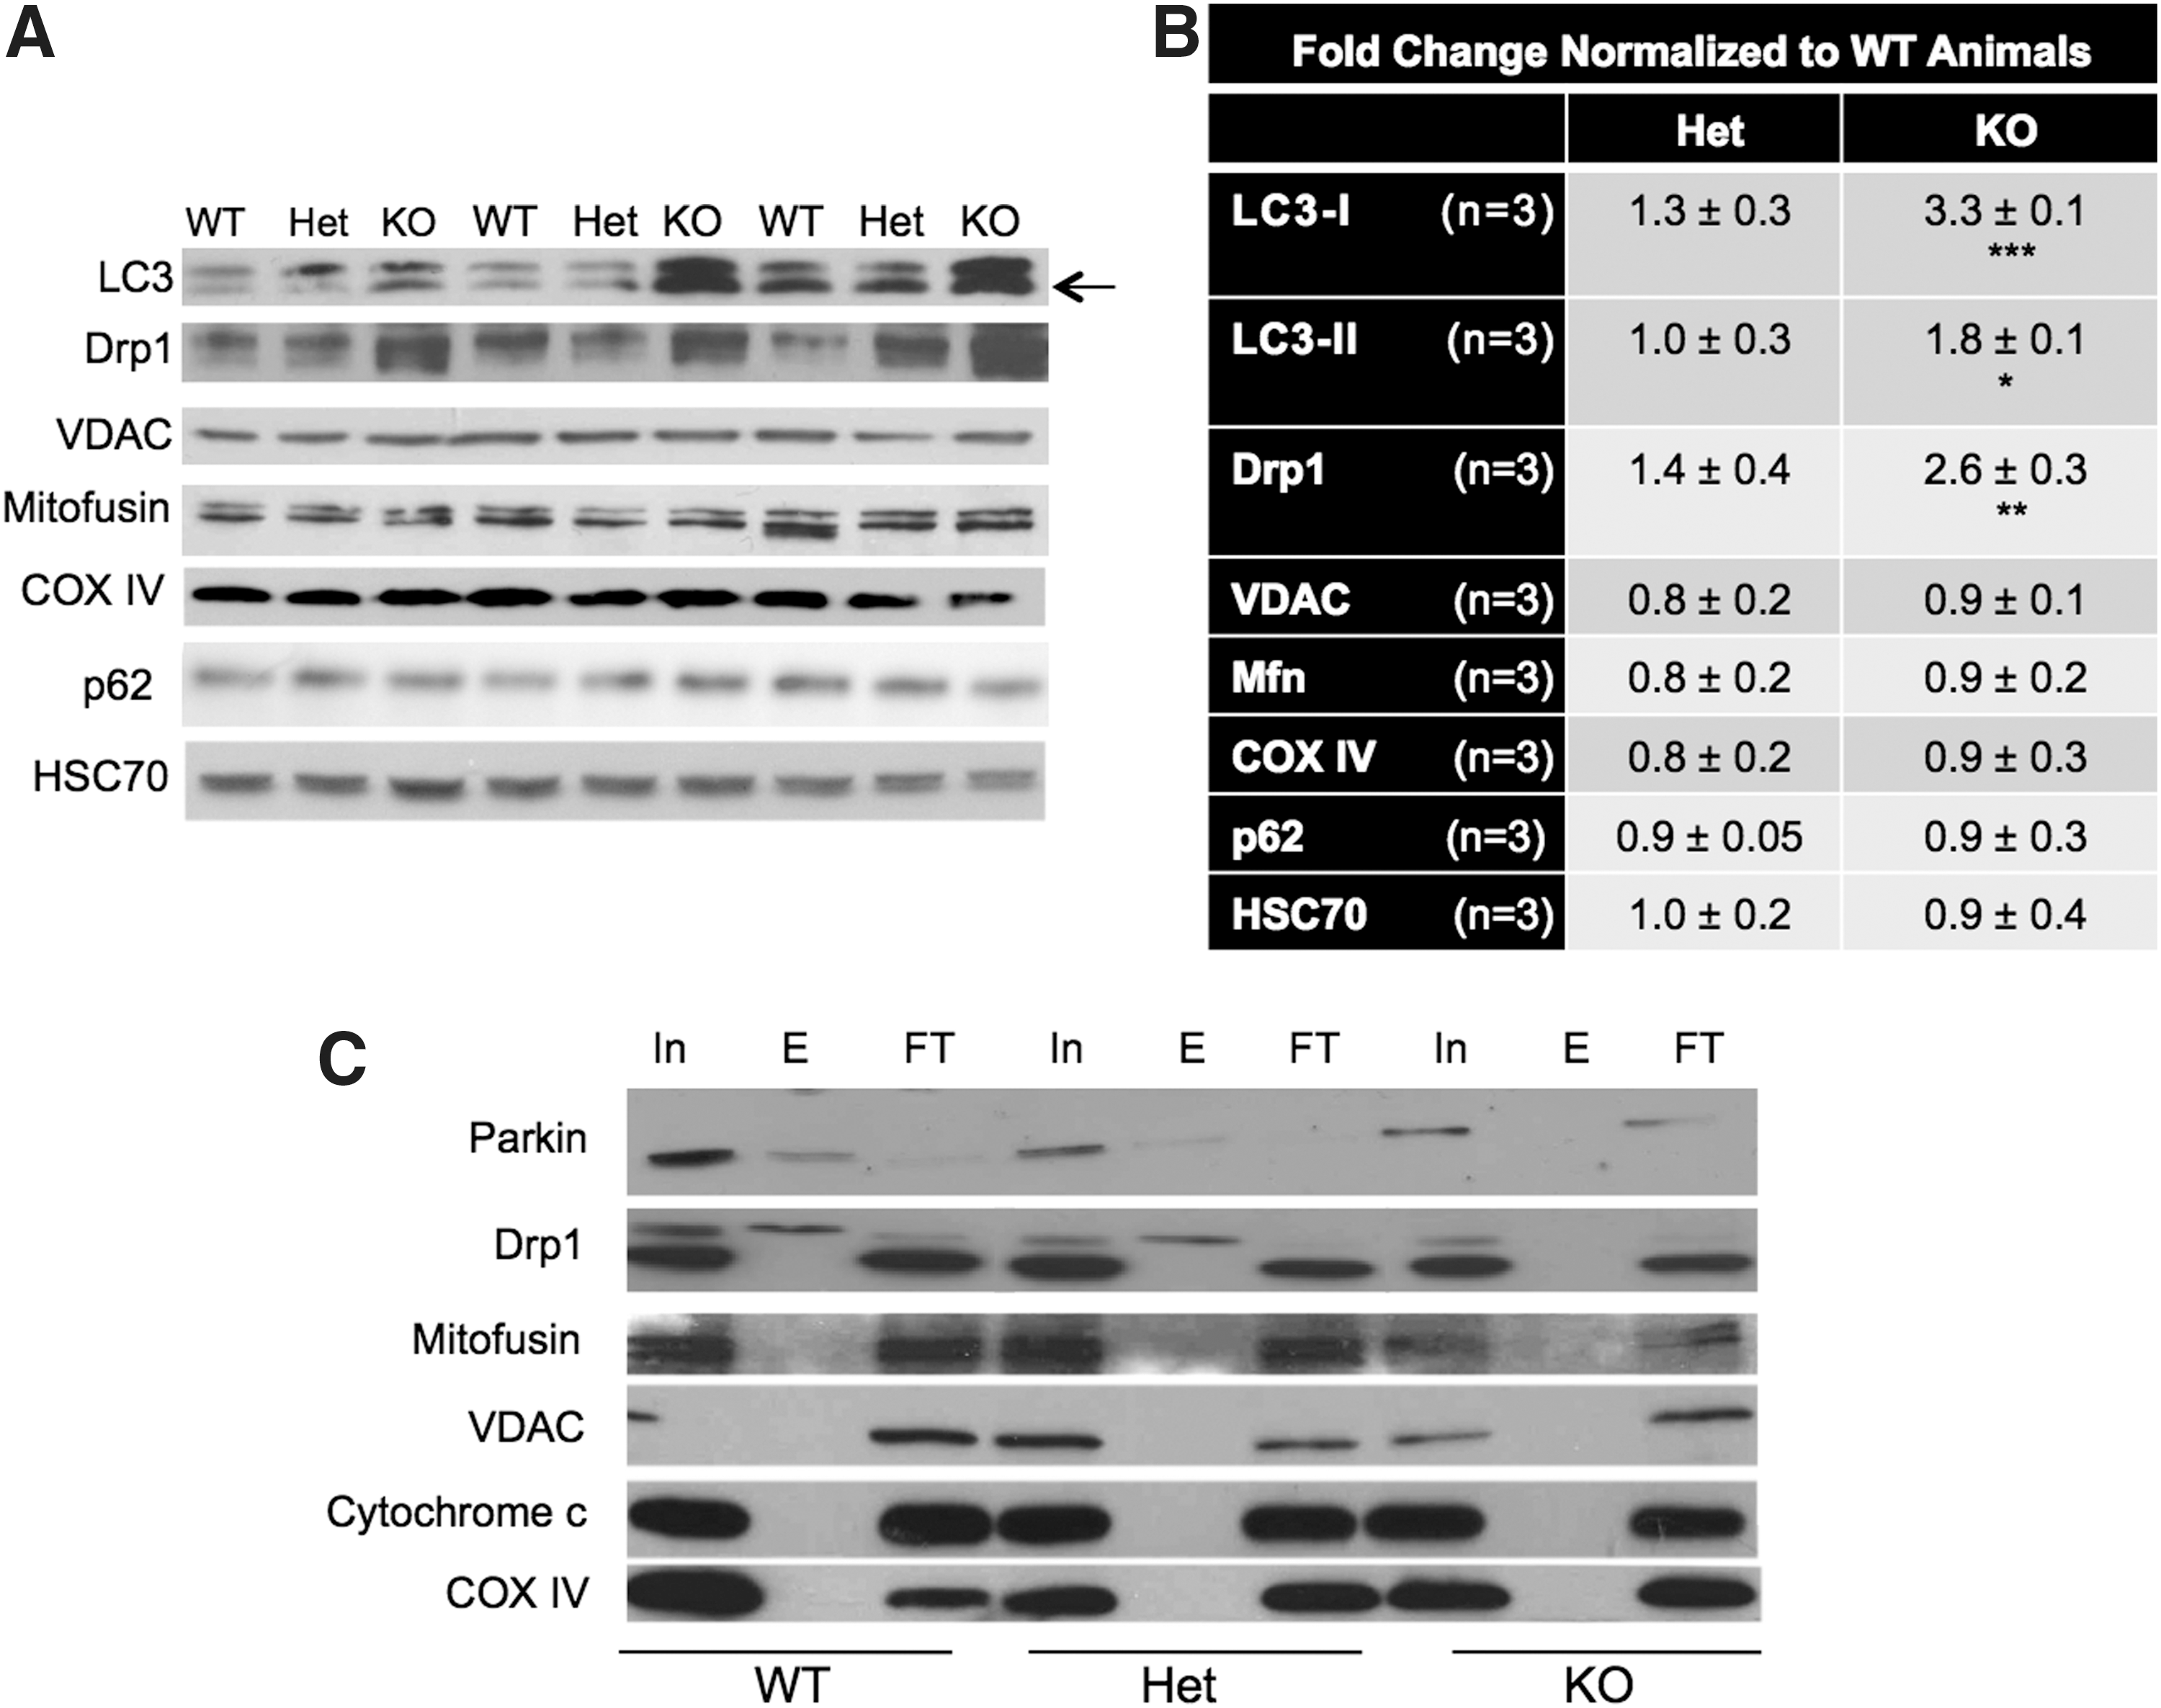
Novel biotin–avidin capture methodology on freshly isolated mitochondria was used to determine if the baseline redox stress in CHIP-deficient animals causes specific oxidative modifications of proteins involved in mitochondrial integrity, function, and homeostasis. Given that CHIP KO animals had high levels of total protein oxidation (Fig. 1A), we anticipated that many essential regulators of mitochondrial function would be oxidized. We were surprised to find that both Drp1 and Parkin were subject to carbonyl adduction in WT and Het animals (as demonstrated by the presence of a band in the eluate [E] fraction lane), but not in CHIP KO mice (Fig. 7C).
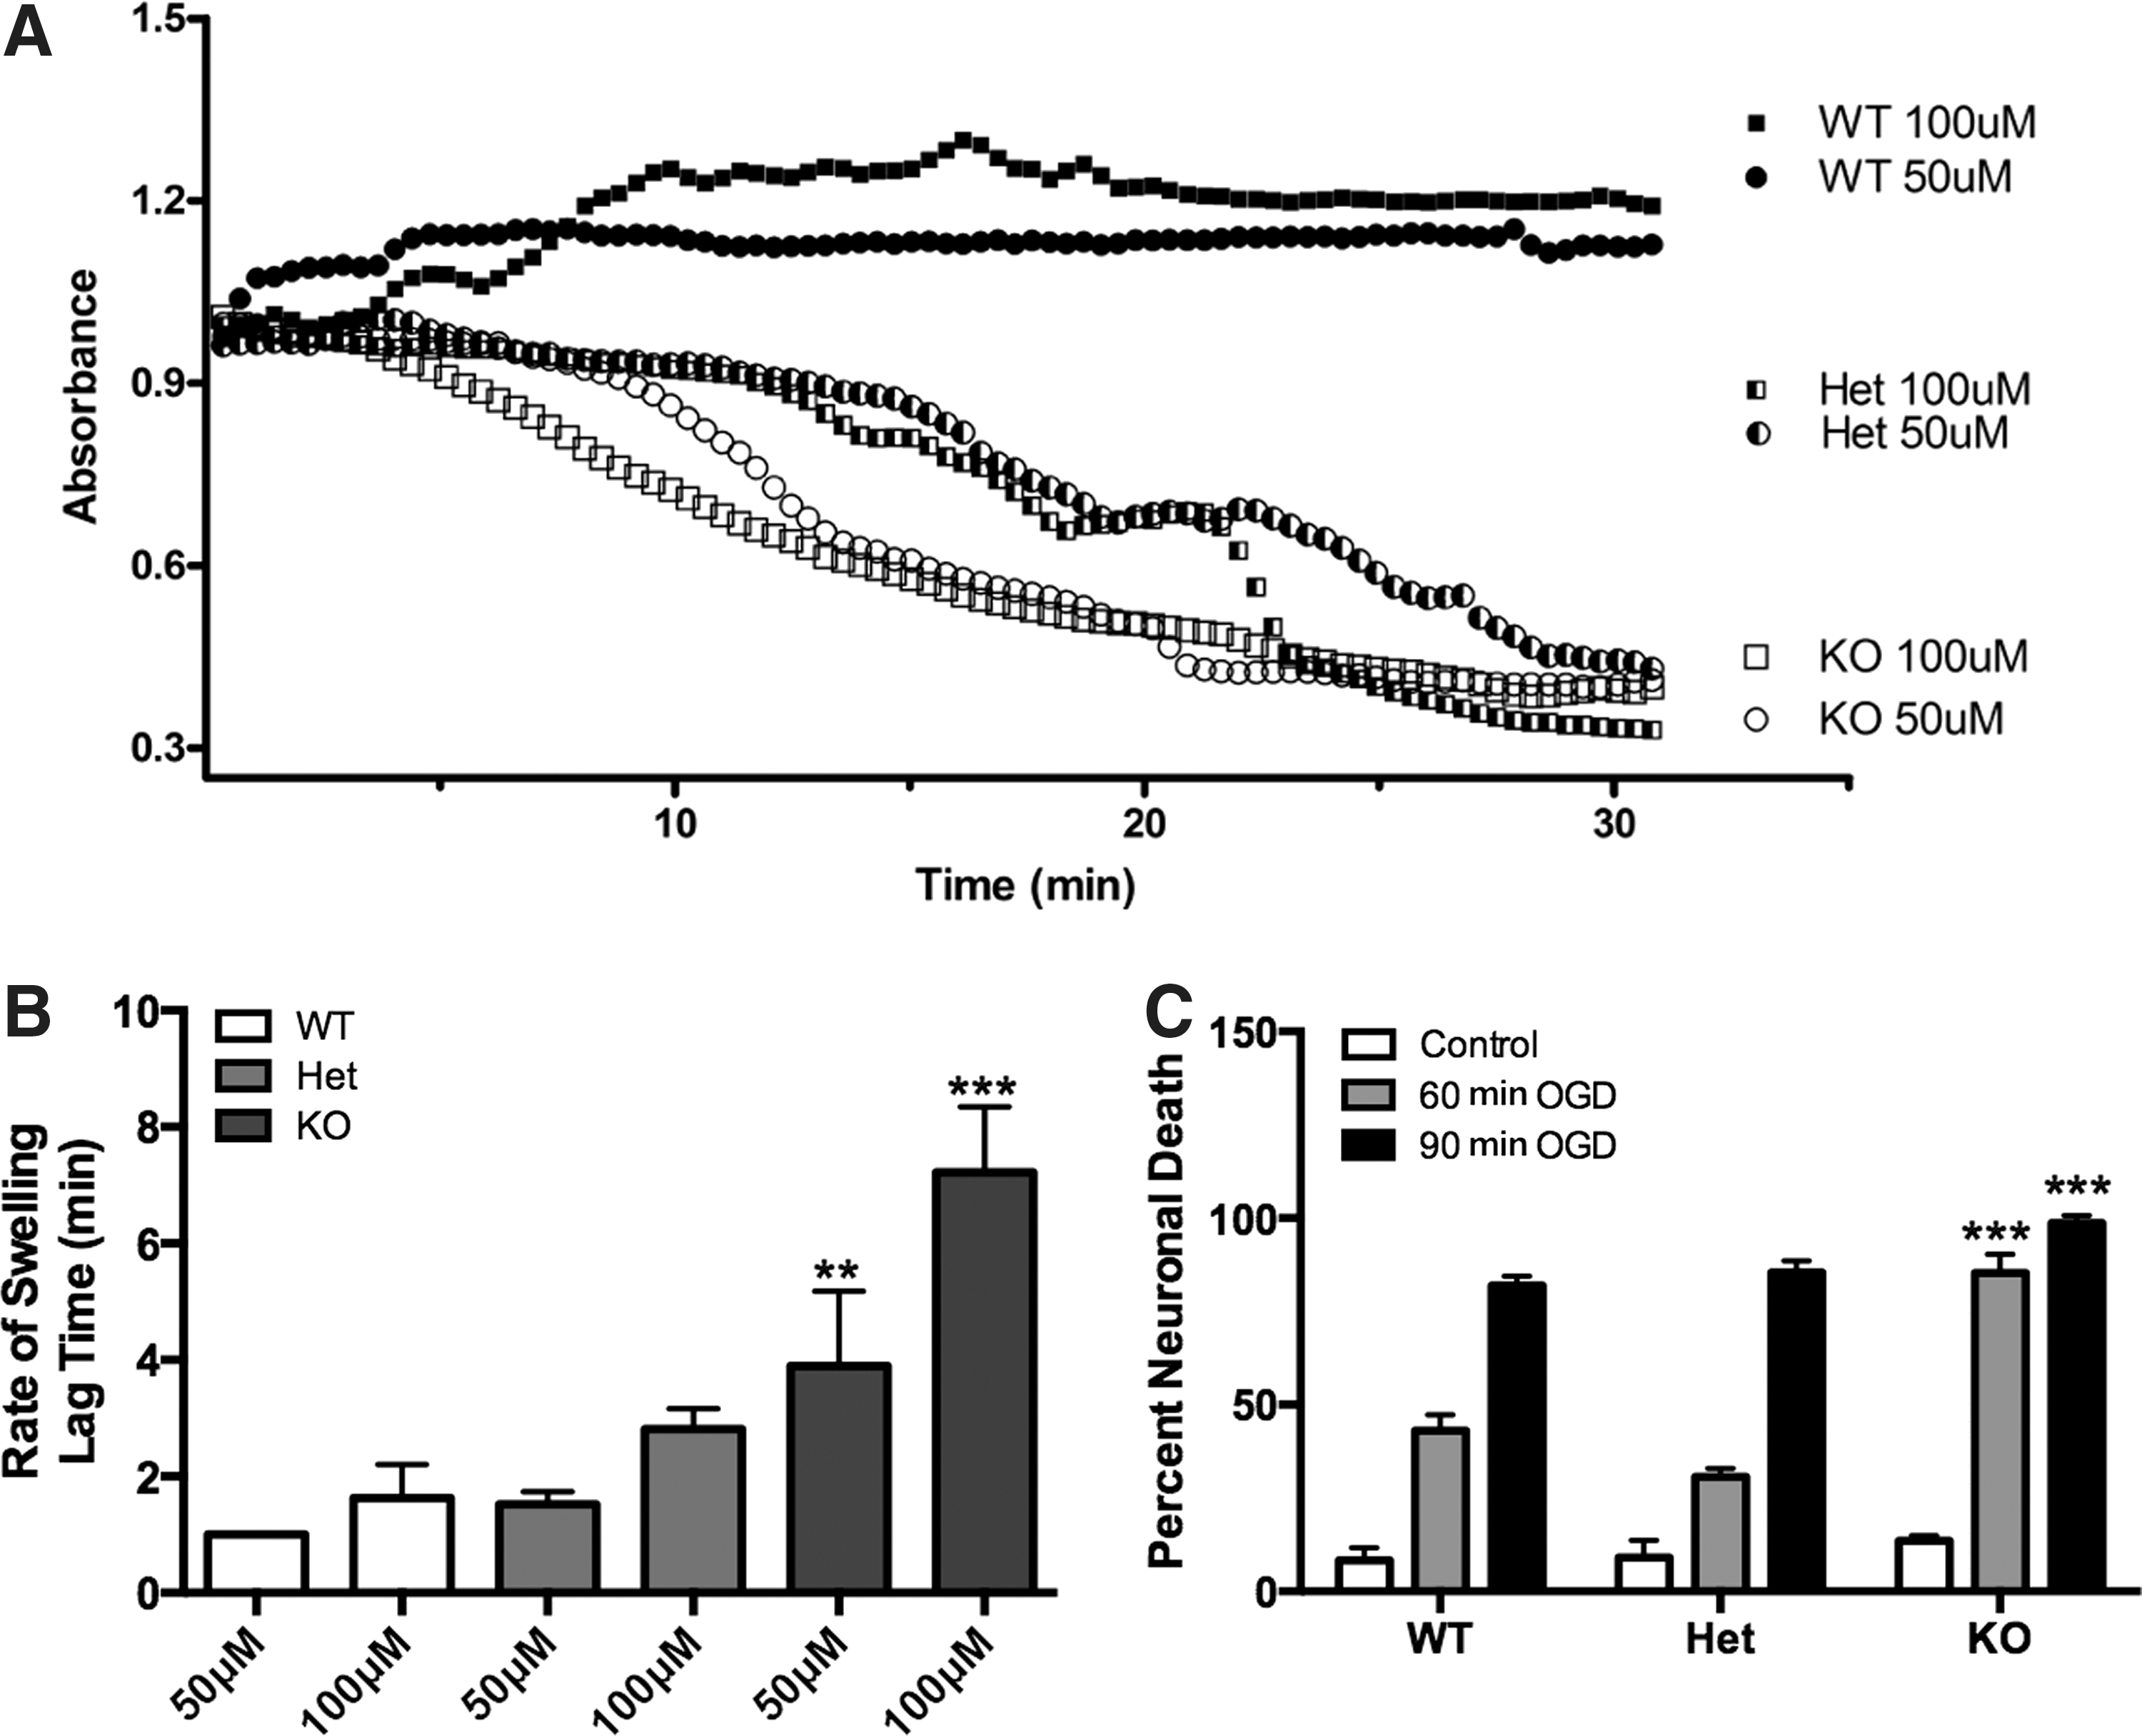
Protein oxidation, energetic status, and production of free radicals have all been linked to altered stress-induced calcium buffering and mitochondrial permeability transition. Using isolated mitochondria, we found that the lag time of Ca2+-induced mitochondrial swelling (Fig. 8A, B) was much more rapid and profound in CHIP KO animals, indicative of poor ion buffering capability. Taken together, these data suggest that CHIP is a regulator of mitochondrial integrity under conditions of stress and that CHIP deficiency is associated with altered stress-induced mitophagy.
CHIP deficiency results in increased neuronal death following OGD
To test the hypothesis that CHIP-deficient neurons have impaired stress responsiveness, neuronal cultures were exposed to varying durations of OGD, and cell viability was assessed. OGD is a well-appreciated mitochondrial stress mediated by NMDA receptors, and cell death can be observed after neuron-enriched cultures are exposed to >30 min of deprivation (61). In these experiments, OGD caused an increase in cell death in all genotypes in a time-dependent manner (one-tailed analysis of variance (ANOVA) p<0.01; Note: time dependence of this effect is not shown with asterisks so as to highlight gene vs. time effects). Post hoc analysis of time points across genotypes revealed that primary cultures derived from CHIP KO animals fared worse following either 60 or 90 min of OGD when cell death was assessed 24 h later (p<0.05; Bonferroni's post hoc testing). These data suggest that loss of CHIP is detrimental to neuronal survival following an ischemic event (Fig. 8C).
Discussion
Biochemically and energetically intact mitochondria are essential determinants of cell viability in response to stress. These organelles play a critical role in ion homeostasis, metal sequestration, and oxidative stress signaling. It has become increasingly evident that mitochondrial dysfunction is associated with a multitude of CNS diseases. In turn, neurons have evolved powerful mechanisms to remove injured organelles from the cell, including mitophagy, a process that is an essential regulator of mitochondrial quality control and neuronal survival (3, 21, 35, 54). The role of mitophagy has come under particular scrutiny lately as an increasing number of proteins have linked neurodegeneration with aberrant mitophagy (4, 5, 52, 59). Acute overexpression of CHIP is neuroprotective against a number of acute and chronic stressors, and we recently reported that CHIP KO mice are uniquely impaired by the loss of this ligase, which dramatically decreases life span (8), impairs motor skills (29, 38), and alters anxiety responses (29). We show in the current work that these mice also present with atypical CNS protein oxidation and lipid peroxidation, decreased antioxidant responses, and impaired bioenergetic status at baseline. Additionally, loss of CHIP results in changes in redox tone, energetic status, and stress handling, as well as increased vulnerability to acute stress. Taken together, these findings suggest that CHIP plays a nonredundant and previously unrecognized role in governing mitochondrial signaling in response to stress.
The observation that prompted these studies was the dramatically shortened life span and neurological impairments that are unique to CHIP deficiency. Other E3 ligase-deficient animals, such as Parkin KO mice, are neurologically intact. Surprisingly, even triple transgenic KO of PINK1, Parkin, and DJ1 fails to produce an overt phenotype (8, 9, 19, 38, 57). The motor phenotype and oxidative stress we observed in CHIP KO animals occur in the CNS of relatively young animals (PND35), suggesting that CHIP deficiency has a major impact early in life. We now demonstrate that these changes in physiology are accompanied by high levels of CNS protein oxidation and lipid peroxidation and decreased antioxidant responses, which are far more profound than those observed in PINK1, DJ1, or Parkin-deficient animals (42, 57).
Previous studies suggest that the neuroprotective potential of CHIP lies in its role in protein triage, refolding, transcription of stress response genes, and degradation of a growing list of proteins associated with cystic fibrosis, Alzheimer's disease, and other disorders (2, 28, 32, 36, 47). CHIP is both cytoprotective (62) and can inhibit apoptosis by increasing ubiquitination and degradation of proapoptotic proteins (58). Our data are the first to demonstrate that CHIP is a direct regulator of mitochondrial homeostasis and cellular energetic status. These data are particularly intriguing given that CHIP appears to be one of only a handful of the ∼500 mammalian E3 ligases in the CNS that responds to ischemia (22, 34).
Support for a role of CHIP in response to ischemia comes from proteomic analysis of human postmortem CNS samples from patients who suffered transient ischemic attacks or ischemic strokes where increased levels of CHIP and loss of VDAC were noted (51). The close association of CHIP with stressed mitochondria would suggest that the upregulation of CHIP during stroke acts as a negative regulator of mitochondrial permeability transition activity, maintaining organelle homeostasis until mitophagy can be initiated. Future experiments will allow us to determine if this is a conserved stress signaling mechanism or one that is unique to Ca2+ overload following ischemia.
In this work, we demonstrate that the increased expression of CHIP observed in postmortem human samples following ischemic events (51) can be recapitulated in an in vitro model of stroke. This allowed us to demonstrate that CHIP relocalization to mitochondria is an early event in response to OGD, much like PINK1 stabilization and p66shc relocalization (3). Parkin's concerted action with PINK1 to promote mitophagy is a novel function of E3 ligases (12, 13, 26, 39, 40, 44) and our data support the importance of these molecules in mitochondrial homeostasis as both CHIP and PINK1 colocalize with mitochondria following OGD. These data suggest that signaling pathways similar to those observed in PD may also mediate responses to ischemia. Conservation of mitochondrial stress signaling has also recently been noted in a mouse model of Alzheimer's disease, where Parkin overexpression decreases both amyloid-beta (Aβ) accumulation and the number of damaged mitochondria (17), as well as in cardiomyocyte ischemic preconditioning studies where Parkin translocation to mitochondria precedes the removal of damaged organelles (15).
We have previously shown that phosphorylation and relocalization of the redox-sensitive kinase p66shc occurs within 30 min of OGD and is essential to evoke mitophagy (3). The importance of redox signaling in autophagic processes is underscored by the role of ROS in autophagosome formation, where redox modifications of specific cysteine residues in autophagy-related genes can regulate their bioactivity (48). Given that we observed increases in the ROS sensor, PINK1, 1 h after a lethal OGD, we hypothesize that PINK1 may promote CHIP relocalization to damaged mitochondria in a manner similar to that of PINK1 recruitment of Parkin in PD. This is supported by our observation that mitochondria from CHIP KO animals have increased PINK1 stabilization, which may, in turn, recruit the E3 ligase, Parkin, in the absence of CHIP.
Using a novel and powerful biotin–avidin capture methodology, we demonstrate that Drp1 is specifically oxidized in both WT and Het animals, but not CHIP KO animals. Our data support a model in which the balance between mitochondrial fission, fusion, and mitophagy is impaired in CHIP-deficient animals as there is a substantial increase in the baseline expression of the fission protein, Drp1, yet no change in the fusion protein, Mfn1. Overexpression of Drp1-K38A, which blocks mitochondrial fission, was recently shown to restore mitochondrial morphology and dopamine release defects in PINK1 mutant mice (46), supporting a model in which the observed increase in Drp1 in CHIP KO animals is indicative of stress.
Post-translational modifications of Drp1 are thought to play an essential role in regulation of mitochondrial fission (41). Twig et al. have recently shown that in cells deficient in mitochondrial fission, there is an increase in oxidatively modified proteins (54), which is supported by our OxyBlot™ and F2t-IsoP data. If oxidation promotes degradation of Drp1, the lack of oxidation in KO animals would be predicted to promote Drp1 accumulation and potentially uncontrolled fission to the point of metabolite and mitochondrial DNA depletion—a scenario supported by our data demonstrating impaired energetics, altered autophagy, and increased Parkin and PINK1 in the brains of very young CHIP-deficient animals.
We also found that the high-molecular-weight Parkin complex (56) was oxidized in a gene dose-dependent manner. WT and Het animals express an oxidized form of Parkin, whereas CHIP KO animals do not. The fusion promoting protein, Mfn1, is a substrate of Parkin, yet even increased Parkin expression was insufficient to alter baseline expression of Mfn1 across the genotypes examined (45). This suggests that oxidative modification of Parkin may be important for promoting its E3 ligase activity. These data are supported by reports of both S-nitrosylation and oxidation of Parkin leading to impairment in bioactivity (7, 33, 60). Taken together, these data support a unique and nonrecoverable role for the E3 ligase, CHIP, in the CNS response to stress.
In conclusion, our work demonstrates that CHIP deficiency results in dramatic motor impairments and an early lethal phenotype, which we now show are associated with increased levels of protein oxidation and lipid peroxidation, decreases in antioxidant responses, significant declines in CNS ATP, upregulation of a number of redox and stress-associated mitochondrial proteins, and alterations in specific protein oxidation events. Moreover, acute ischemic stress reveals a unique mechanism whereby CHIP is an essential regulator of redox tone that, when absent, results in increased neuronal death in response to stroke-like insults. In combination with our previous data demonstrating that chronic CHIP overexpression is associated with decreased neuronal survival (51), these results underscore the importance of maintaining an exquisite balance of CHIP as a means of efficiently responding to acute injury.
Materials and Methods
Reagents
Commercial vendors of chaperone antibodies as well as reagents and supplies used for immunoblotting, immunofluorescence, and cell culture experiments are the same as previously described (3, 51). Additional primary antibodies used for immunoblotting in this study include p66shc (566807; EMD), VDAC, COX IV, and Parkin (4866, 4850, and 2132, respectively; Cell Signaling), PINK1, Mfn1, and Drp1 (BC100-494, NB110-58853, and NB110-55288, respectively; Novus Biologicals), polyclonal CHIP (PC711; Calbiochem), LC3 (PD014; MBL International), and Cytochrome c (556433; BD Pharmingen). For immunocytochemistry, the following secondary antibodies were used: anti-rabbit Cy2 (711-225-152), anti-mouse Cy2 (715-225-150), and anti-rabbit Cy3 (711-165-152), all purchased from Jackson ImmunoResearch. Coverslips were mounted using ProLong Gold (P36934) from Invitrogen. Commercially available kits that were used include the DC Protein Assay Kit (500-0112; Bio-Rad), the OxyBlot Protein Oxidation Detection Kit (S7150; Millipore), and an ATP/ADP Ratio Assay Kit (Z5030042; BioChain). Reagents and materials required for the biotin–avidin capture methodology were obtained from the same companies as previously described (50). All cell culture media and supplements were purchased from Invitrogen. Unless otherwise stated, all other chemicals were purchased from Sigma-Aldrich.
Animals
The Institutional Animal Care and Use Committee at Vanderbilt University approved all animal husbandry and experiments. Parent mouse lines used in this study were previously described (8). All mice are maintained on a mixed background of C57BL/6 and 129SvEv as backcrossing unto a pure genetic background exacerbates the early lethality of CHIP KO animals with a less than 5% survival at birth. As CHIP KO mice are sterile, heterozygous matings are used to maintain the colony. Genotyping is performed by PCR with DNA from tail clippings using primers for the CHIP allele. Primers were purchased from XXIDT and the sequences of the reverse and forward primers used are 5′ TGA CAC TCC TCC AGT TCC CTG AG 3′ and 5′ AAT CCA CGA GGC TCC GCC TTT 3′, respectively. Unless otherwise noted, all experiments were completed and tissue samples harvested at PND35 to ensure proper age-matched controls.
OxyBlot methodology
Derivatization of oxidized proteins was performed as previously described (50). Briefly, whole brains from PND35 WT, Het, and CHIP KO mice were removed and immediately treated with 50 mM DTT to prevent auto-oxidation of proteins. Samples were homogenized and then equally divided into derivatization reaction solution containing 2,4-dinitrophenylhydrazine or negative control solution. Samples were stored at 4°C and processed further within 7 days. Equal protein concentrations were separated using Criterion Bis-Tris gels and processed as described in the Immunoblotting section below. The manufacturer provided antibodies specific for the detection of oxidized proteins.
Lipid oxidation
Lipid peroxidation was assessed through quantification of F2t-IsoPs, prostaglandin-like molecules generated from free radical-mediated nonenzymatic peroxidation of arachidonic acid. F2t-IsoPs are considered the gold standard in detecting oxidative stress and are measured using gas chromatography–mass spectrometry as previously described (37). Briefly, whole brains of PND35 WT, Het, and CHIP KO mice were removed and immediately treated with methanol containing 0.05% (v/v) butylated hydroxy-toluene to prevent auto-oxidation of lipids. F2t-IsoPs esterified to phospholipids were hydrolyzed by chemical saponification, after which total isoprostanes were extracted using C-18 and silica Sep-Pak cartridges, purified by thin-layer chromatography, converted to pentafluorobenzyl ester trimethylsilyl ether derivatives, and quantified by stable isotope dilution techniques using gas chromatography/negative ion chemical ionization mass spectrometry. [2H4]-8-iso-PGF2 (m/z 573) was used as an internal standard. F2t-IsoPs are detected at m/z 569.
Glutathione measurement
GSH and GSSG concentrations were measured by high-performance liquid chromatography (HPLC) as previously described (51). Briefly, PND35 WT, Het, and CHIP KO animals were anesthetized and cervically dislocated. Brains were quickly removed and a 1-cm2 piece of cortex was dissected. Cortical tissue then underwent extraction with 5% (v/v) perchloric acid/0.2 M boric acid. Acid-soluble thiols were derivatized with iodoacetic acid and dansyl chloride and were analyzed by HPLC using a propylamine column (YMC Pack, NH2; Waters) and an automated HPLC system (Alliance 2695; Waters). GSH and GSSG concentrations were normalized to protein content.
ATP:ADP measurement
Intracellular ATP and ADP concentrations were assessed using a bioluminescent assay. PND35 WT, Het, and CHIP KO animals were anesthetized and cervically dislocated. Brains were quickly removed, placed in LN2, and pressed to form a fine powder. The powder was then reconstituted in assay buffer, homogenized, and sonicated. Samples were incubated in ATP reagent mix in the presence of luciferase and the light generated was measured via a luminometer, with the intensity representing the intracellular concentration of ATP. ADP reagent was added and allowed to incubate, during which time ADP is converted to ATP, which again reacts with D-luciferin and the generation of light is then measured. Luminescence from the initial ATP reading is stable over time and by subtracting the relative light units of the first read from that of the second read, we determined the intracellular concentration of ADP. The remaining lysate was used for the determination of protein concentrations.
Primary rat neuronal culture
Primary neuronal forebrain cultures were prepared from embryonic day 18 Sprague-Dawley rats as previously described (51). Briefly, cortices were digested in trypsin and dissociated. Resultant cell suspensions were adjusted to 335,000 cells/ml and plated at 2 ml/well in six-well tissue culture plates containing five 12-mm or one 25-mm poly-
Primary mouse neuronal culture
Primary neuronal forebrain cultures were prepared from embryonic day 18 mice generated by heterozygous matings. Upon dissection, mice were decapitated and the entire brain was stored individually in 10 ml of Hibernate E medium (HE-Pr; Brain Bits) at 4°C, while tails were processed for genotyping. Once the genotype was known, WT, Het, and KO brains were pooled accordingly and dissection continued with cortical tissue digestion in 0.025% trypsin for 20 min at room temperature (RT), followed by dissociation. Resultant cell suspensions were adjusted to 700,000 cells/ml and plated at 2 ml/well in six-well tissue culture plates containing five 12-mm or one 25-mm poly-
Oxygen–glucose deprivation
OGD experiments were performed between day in vitro (DIV) 21 through DIV 25, at which time neurons represent at least 95% of the population as assessed by NeuN and GFAP staining (31). OGD was performed as previously described (51) by complete exchange of media with deoxygenated, glucose-free Earle's balanced salt solution (150 mM NaCl, 2.8 mM KCl, 1 mM CaCl2, and 10 mM HEPES; pH 7.3) bubbled with 10% H2/85% N2/5% CO2. Cultures were exposed to OGD in an anaerobic chamber (Billups-Rothberg) for 90 min at 37°C. Upon OGD termination, cells were washed with MEM/BSA/HEPES (0.01% [w/v] BSA and 25 mM HEPES) and then maintained in MEM/BSA/HEPES/N2 (0.01% [w/v] BSA, 25 mM HEPES, and 2× N2 supplement) for various recovery times, at the completion of which protein extracts were prepared for immunoblotting, or cells were fixed for immunofluorescence.
Lactate dehydrogenase assays
Neuronal viability was determined 24 h following OGD exposure by measuring LDH release with the LDH in vitro toxicology assay kit (Tox7; Sigma-Aldrich). Forty microliter samples of the medium were assayed spectrophotometrically (490 nm absorbance) in triplicate according to the manufacturer's protocol to obtain a measure of cytoplasmic LDH released from dead and dying neurons (14). LDH results were confirmed qualitatively by visual inspection of the cells and, in several instances, quantitatively by cell counts using our previously described method (30).
Immunoblotting
Western blots were performed as previously described (3, 31, 51). For in vivo lysates, the tissue of interest was dissected and immediately placed into ice-cold TNEB lysis buffer (50 mM Tris-Cl, pH 7.8, 2 mM EDTA, 150 mM NaCl, 8 mM β-glycerophosphate, 100 μM sodium orthovanadate 1% [v/v] Triton X-100, and protease inhibitor diluted 1:1000), followed by homogenization (on ice) in a 7-ml glass dounce, and sonication. For in vitro lysates, all cell lysis and harvesting steps took place on ice. Cells were washed twice with ice-cold 1×phosphate-buffered saline (PBS), and following the second wash, 250–500 μl of TNEB was added.
Approximately 100–200 μl of lysate was saved for the determination of protein concentrations and the remaining lysate was resuspended in an equal volume of Laemmle buffer with β-mercaptoethanol (1:20). Protein samples were heated to 95°C for 10 min and stored at −20°C. Protein concentrations were determined via the Dc Protein Assay Kit II and equal protein concentrations were separated using 4%–12% Bis-Tris gels, followed by transfer onto PVDF membranes, and then blocked in methanol for 5 min. Once dry, the membranes were incubated at 4°C overnight in primary antibody prepared in 5% (w/v) nonfat dry milk in a Tris-buffered saline solution containing 0.1% Tween 20 (TBS-Tween). All primary antibodies were diluted 1:1000 (v/v). Following incubation in primary antibodies, membranes were washed and incubated for 1 h at RT in a 1:5000 (v/v) dilution of horseradish peroxidase-conjugated secondary antibodies prepared in 5% (w/v) nonfat dry milk in TBS-Tween. After additional washes, protein bands were visualized using a chemiluminescent substrate and exposed to autoradiography film.
MitoTracker labeling and immunofluorescence
MitoTracker Orange was added 45 min before termination of recovery using a final concentration of 790 nM. Following this incubation, neuronal coverslips were washed with 1× PBS and fixed with 4% (v/v) formaldehyde. Cells were permeabilized with 0.1% Triton X-100, washed with 1× PBS, and blocked with 8% (w/v) BSA diluted in 1× PBS. After 25 min of blocking, coverslips were incubated in either anti-CHIP (1:500) or anti-PINK1 (1:500) primary antibodies diluted in 1% (w/v) BSA overnight at 4°C. Following primary antibody incubation, cells were washed in 1× PBS for a total of 30 min and incubated in Cy2 secondary antibody (1:500) in 1% BSA for 1 h. Cells were next washed for a total of 30 min in 1× PBS and incubated in 1.4 μM DAPI for 10 min. After 30 min of additional washing, coverslips were mounted via Prolong Gold.
For immunofluorescence experiments done without MitoTracker, neurons were prepared as described above starting with fixation. In these cases, anti-LC3 and anti-CHIP primaries (both diluted 1:500) were added simultaneously and incubated overnight at 4°C. Incubation in appropriate fluorescent secondary antibodies (1:500) was also done simultaneously.
Fluorescence was visualized using a Zeiss Axioplan microscope equipped with an Apotome (63×). Nine fields of view were imaged from 4 separate neuronal preps and subsequent experiments, totaling 36 imaged fields. The fluorescent images within the article are representative of these fields.
Subcellular fractionation
Neuronal cultures were exposed to 90 min OGD and cell lysates were prepared 6 h later. Subcellular fractionation via differential centrifugation was used to isolate nuclear, mitochondrial, and cytosolic compartments. Briefly, neurons were washed with ice-cold 1× PBS. Following the PBS wash, sucrose buffer (10 mM HEPES, 1.5 mM MgCl2, 10 mM KCl, 1 mM EGTA, 1 mM EDTA, 1 mM DTT, 250 mM sucrose, protease inhibitor, pH 7.5) was added and neurons were collected on ice via scraping and placed into a precooled Sorval tube that was centrifuged at 3000 g for 15 min at 4°C. Pellets were resuspended in fresh sucrose buffer and incubated in ice for 30 min. Cells were then transferred to a homogenizer and dounced for roughly 40 strokes, followed by centrifugation at 50 g for 10 min at 4°C. Following this spin, the supernatant was transferred to a new tube and centrifuged at 800 g for 10 min at 4°C. The supernatant was transferred to a new tube and the resultant nuclear pellet resuspended in TNEB lysis buffer. The remaining supernatant is centrifuged at 13,000 g for 10 min at 4°C. The resultant mitochondrial pellet is resuspended in TNEB lysis buffer. A second centrifugation of the initial supernatant at 13,000 g for 10 min at 4°C is carried out to pull down any remaining mitochondria. Following this spin, the supernatant is transferred to a new tube and the mitochondrial pellet is resuspended in the same TNEB containing the mitochondria from the first spin. The remaining supernatant from the previous spin is then centrifuged at 100,000 g for 1 h at 4°C. This cytosolic pellet is then resuspended in TNEB lysis buffer. To test for fraction purity, following a protein assay, all three fractions were equally loaded and analyzed for Ku70 (nucleus), Cytochrome c (mitochondria), and β-tubulin (cytosol) via Western blot (data not shown).
Mitochondrial isolation for swelling assay
Mitochondrial homogenates were generated from PND40 WT, Het, and CHIP KO mice. Briefly, the liver was removed, washed in ice-cold 1× PBS, and weighed. The liver was then homogenized in ice-cold isolation media (250 mM sucrose, 10 mM Tris, and 2 mM EGTA at pH 7.4) using a 7-ml glass dounce homogenizer at 10 ml/g of tissue. Homogenates were spun at 500 g for 10 min at 4°C, and the supernatant was removed and placed into a new tube. Supernatants were then spun at 9500 g for 10 min. The pellet was washed with 10 ml of isolation media (without EGTA) and spun again at 9500 g for 10 min. The remaining pellets were either resuspended in 1 ml of TNEB lysis buffer with protease inhibitors (1:1000), subjected to protein assay, and further processed for immunoblotting or biotin–avidin capture methodology (described below) or resuspended in 1 ml of EGTA-free isolation media, subjected to protein assay, and analyzed for mitochondrial permeability transition activities (described below).
Mitochondrial permeability transition assay
Briefly, isolated mitochondria were resuspended in 1 ml of assay buffer (40 mM HEPES, 195 mM mannitol, 25 mM sucrose, 5 mM succinate, and 1 μM rotenone at pH 7.2). Following a 2-min equilibration period, either 50 or 100 μM Ca2+ was added and the absorbance was measured at 535 nm over a 20-min period at 37°C. Lag time before the onset of mitochondrial swelling was measured by determining the time when the maximal rate of change in absorbance was evident following Ca2+ addition (23). Time to mitochondrial swelling was normalized to that of WT animals. Statistical significance was determined by two-tailed t-test assuming unequal variances.
Biotin–avidin capture methodology
Derivatization of specific protein targets of oxidative stress was performed using the biotin–avidin capture methodology as previously described (50). Briefly, liver mitochondrial extracts from PND35 to PND40 WT, Het, and CHIP KO animals were prepared as described in the mitochondrial preparation section. Equal protein concentrations (2 mg/ml) were incubated with biotin hydrazide (5 mM) while rotating in the dark for 2 h at RT, after which samples were incubated with sodium borohydride (50 mM) for 30 min at RT. Samples were then transferred into Amicon Ultra Centrifuge Filter Devices (UFC 801024; Millipore), and washed thrice via addition of 1× PBS, followed by centrifugation for 30 min at 2500 g. Following the last wash, a 100 μl aliquot was removed to prepare an input sample via addition of DTT (50 mM) and NuPage sample buffer (4×; NP0007; Invitrogen). The remainder of the sample was added to Streptavidin Sepharose High-Performance Beads (17-5113-01; GE Healthcare) and incubated while rotating overnight at 4°C. The next day, samples were centrifuged briefly at 2500 g. The supernatant of the first spin was saved and a 100 μl aliquot of this sample was used to prepare a flow-through sample via addition of DTT and sample buffer. Sample elution was initiated by treating twice with each of the following reagents: sodium dodecyl sulfate (SDS) (1% w/v), urea (4 M), NaCl (1 M), and 1× PBS. Eluate (E) samples were then prepared in sample buffer with DTT, heated for 10 min at 95°C, and stored at−20°C. Equal protein concentrations were separated on SDS-polyacrylamide gel electrophoresis (SDS-PAGE) gels as described in the Immunoblotting section above and probed with antibodies specific to Mfn1, VDAC, Cytochrome c, Drp1, Parkin, and COX IV.
Analysis and statistics
Except where otherwise noted, data were summarized and are represented as mean±SEM. The statistical significance of differences between means was assessed using one-way ANOVA at the 95% confidence interval, followed by Bonferroni's multiple comparison post hoc testing using GraphPad Prism software. Semiquantitative analyses of immunoblot results were generated to determine the mean relative densities of each protein band in comparison with control conditions or WT genotype (NIH Image, Scion ImageJ).
Footnotes
Acknowledgments
The authors thank Dr. Cam Patterson for providing CHIP knockout animals, Dr. Pat Levitt and Mrs. Britney N. Lizama-Manibusan for helpful comments and suggestions, and Ms. Jessica S. Cohen for technical assistance and microscopy expertise. This work was supported by Walter and Suzanne Scott Foundation funding of the J.B. Marshall Laboratory (B.M.M., A.C.K., A.M.P., R.S.), NIH grants, NS050396 (B.M.M.), ES022936 (D.L., B.M.M., S.C.), and MH086629 (G.D.S.), a Vanderbilt Brain Institute Scholarship (A.M.P.), and a predoctoral fellowship from the AHA 12PRE11640010 (A.M.P.). Graphical support was provided by P30HD15052 (Vanderbilt Kennedy Center).
Author Disclosure Statement
No competing financial interests exist.