
Abstract
Introduction
N
We suggest that an engineering principle might apply to nuclear factor erythroid 2-related factor 2 (Nrf2) to make it fit for purpose. The Nrf2 system is a cytoplasmic stress sensor as well as a mediator of increased protective gene transcription. Dynamical resolution of engineered sensors (e.g., in wireless sensor networks) relies on a high refresh rate because the sensor must reassess the relevant aspects of the environment at an appropriately high rate—a circumstance relevant to Nrf2. A process that repeatedly reassesses the environment is more reliable than one that relies on detecting changes in an equilibrium level of a signal that represents the environment. Such sensors can be linked to decision-making apparatus and can alter the refresh rate to match dynamical information. The functional pay-off and advantage achieved with this regulatory mechanism is the positive coupling of increased frequency of direct sensing of surveillance of cytoplasmic stress by Nrf2 to increased transcriptional response when cells are challenged by toxicants and metabolic disturbance. In clinical translation of this work it can be seen that employing a strategy of screening Nrf2 activators on the basis of maximizing residence time of Nrf2 in the nucleus may rather have selected for suboptimal if not poor inducers of the antioxidant response element-linked transcriptional response. A more effective approach may be to “tune” Nrf2 translocational oscillation frequency to maximize functionally active Nrf2 in the cell nucleus.
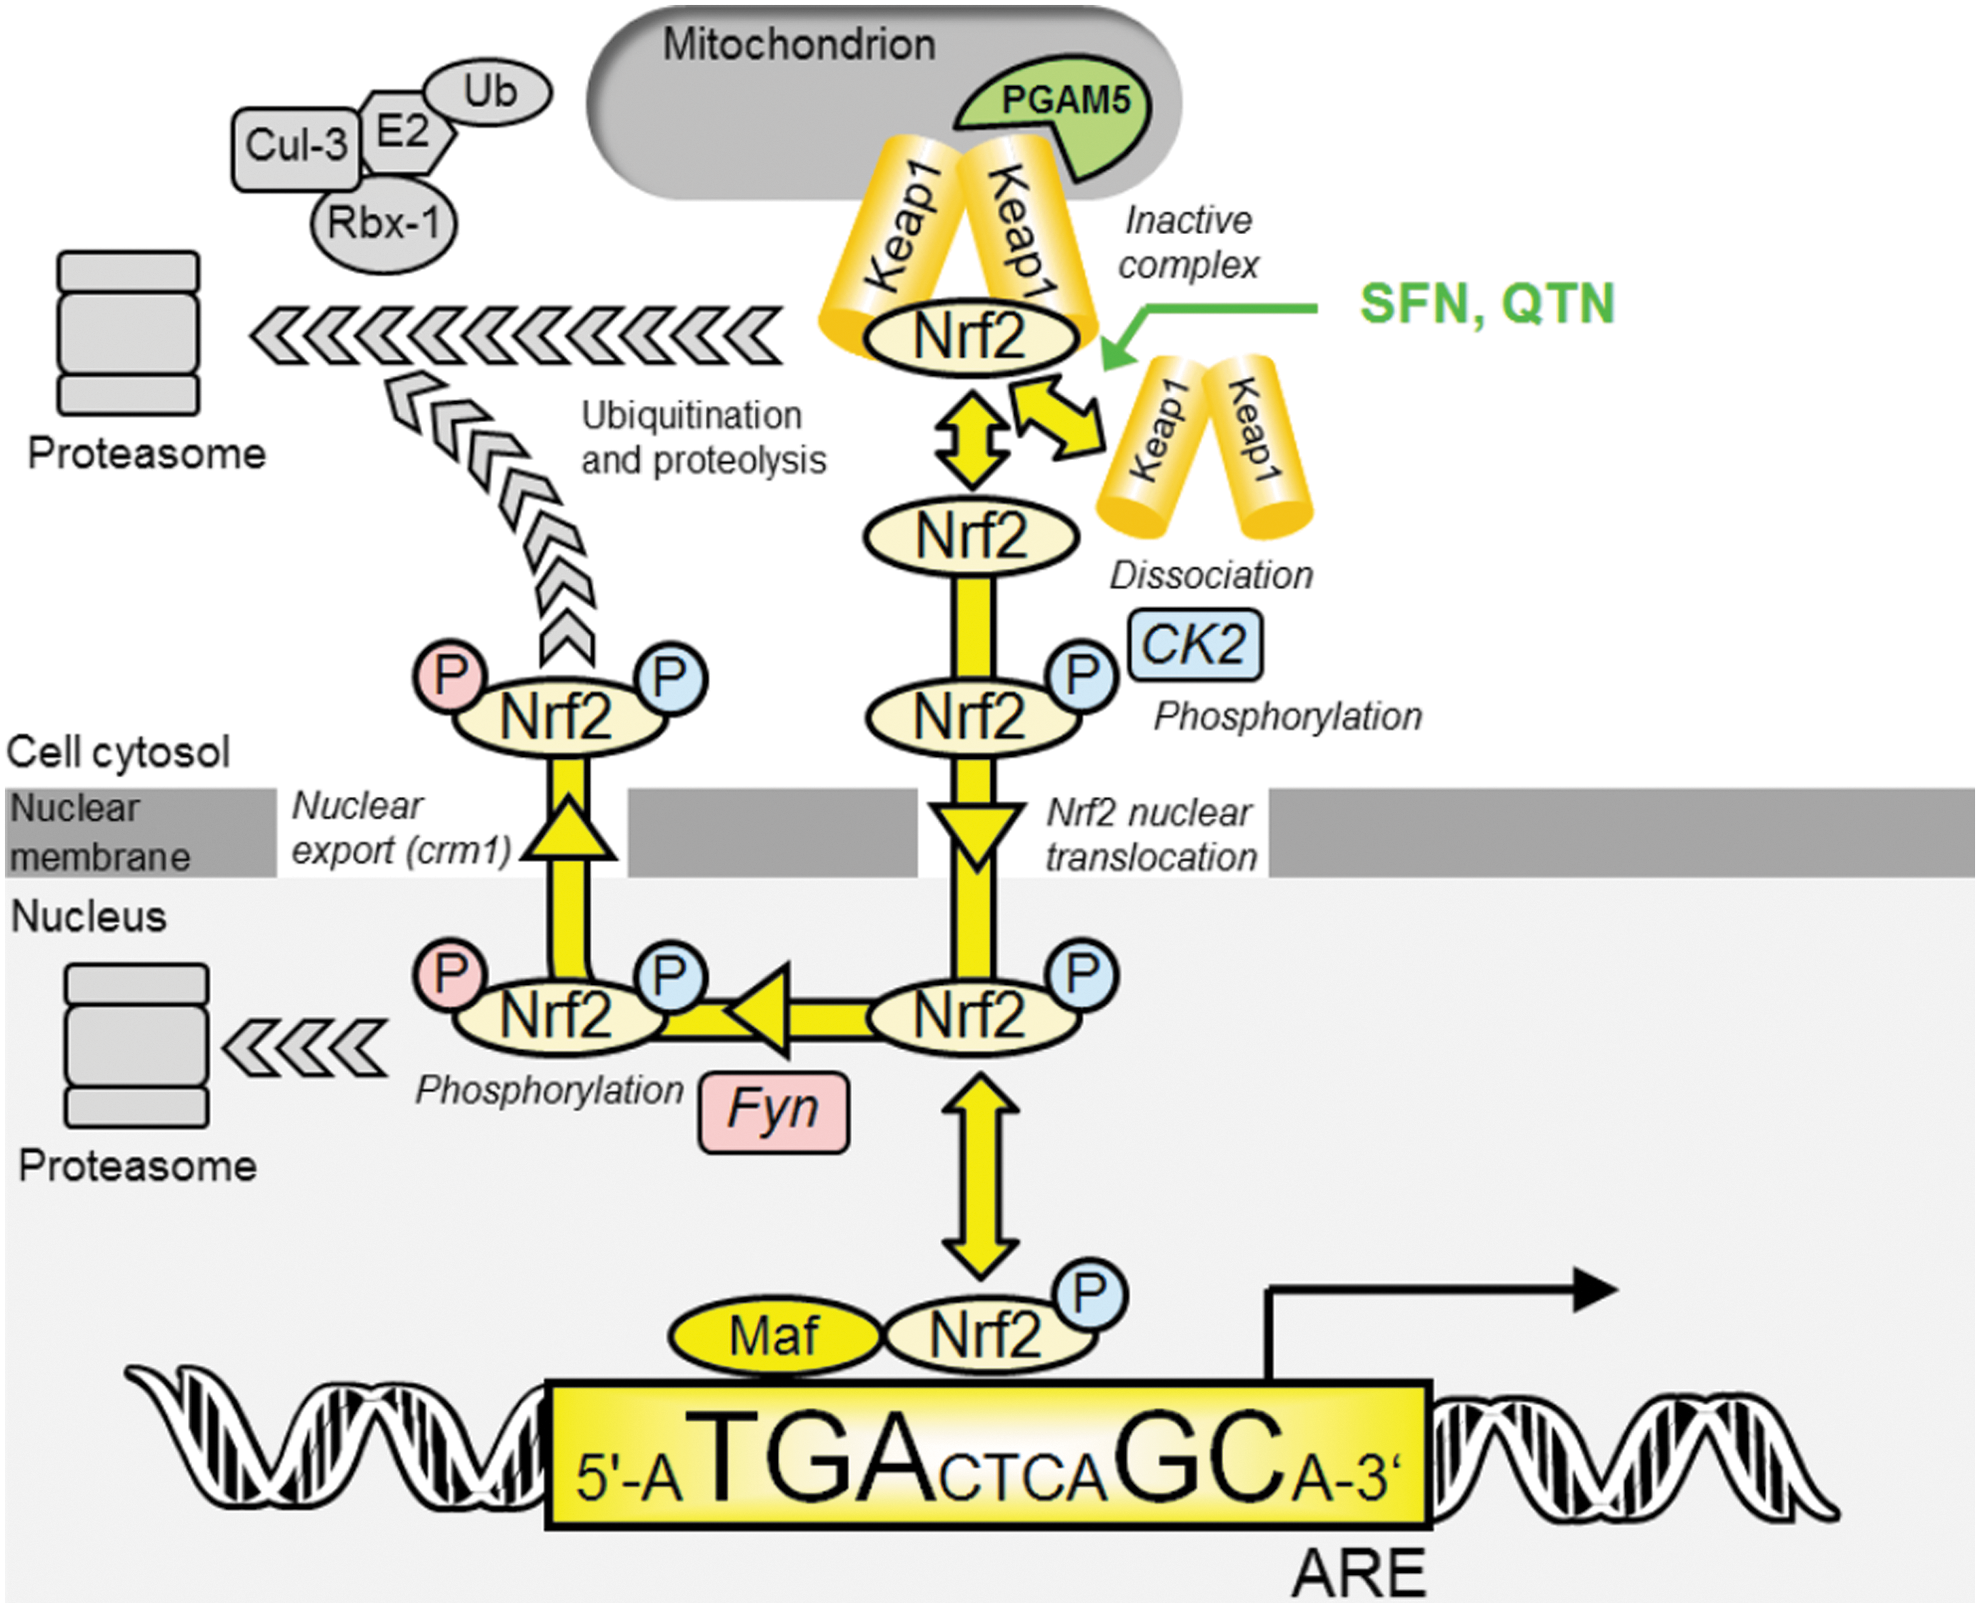
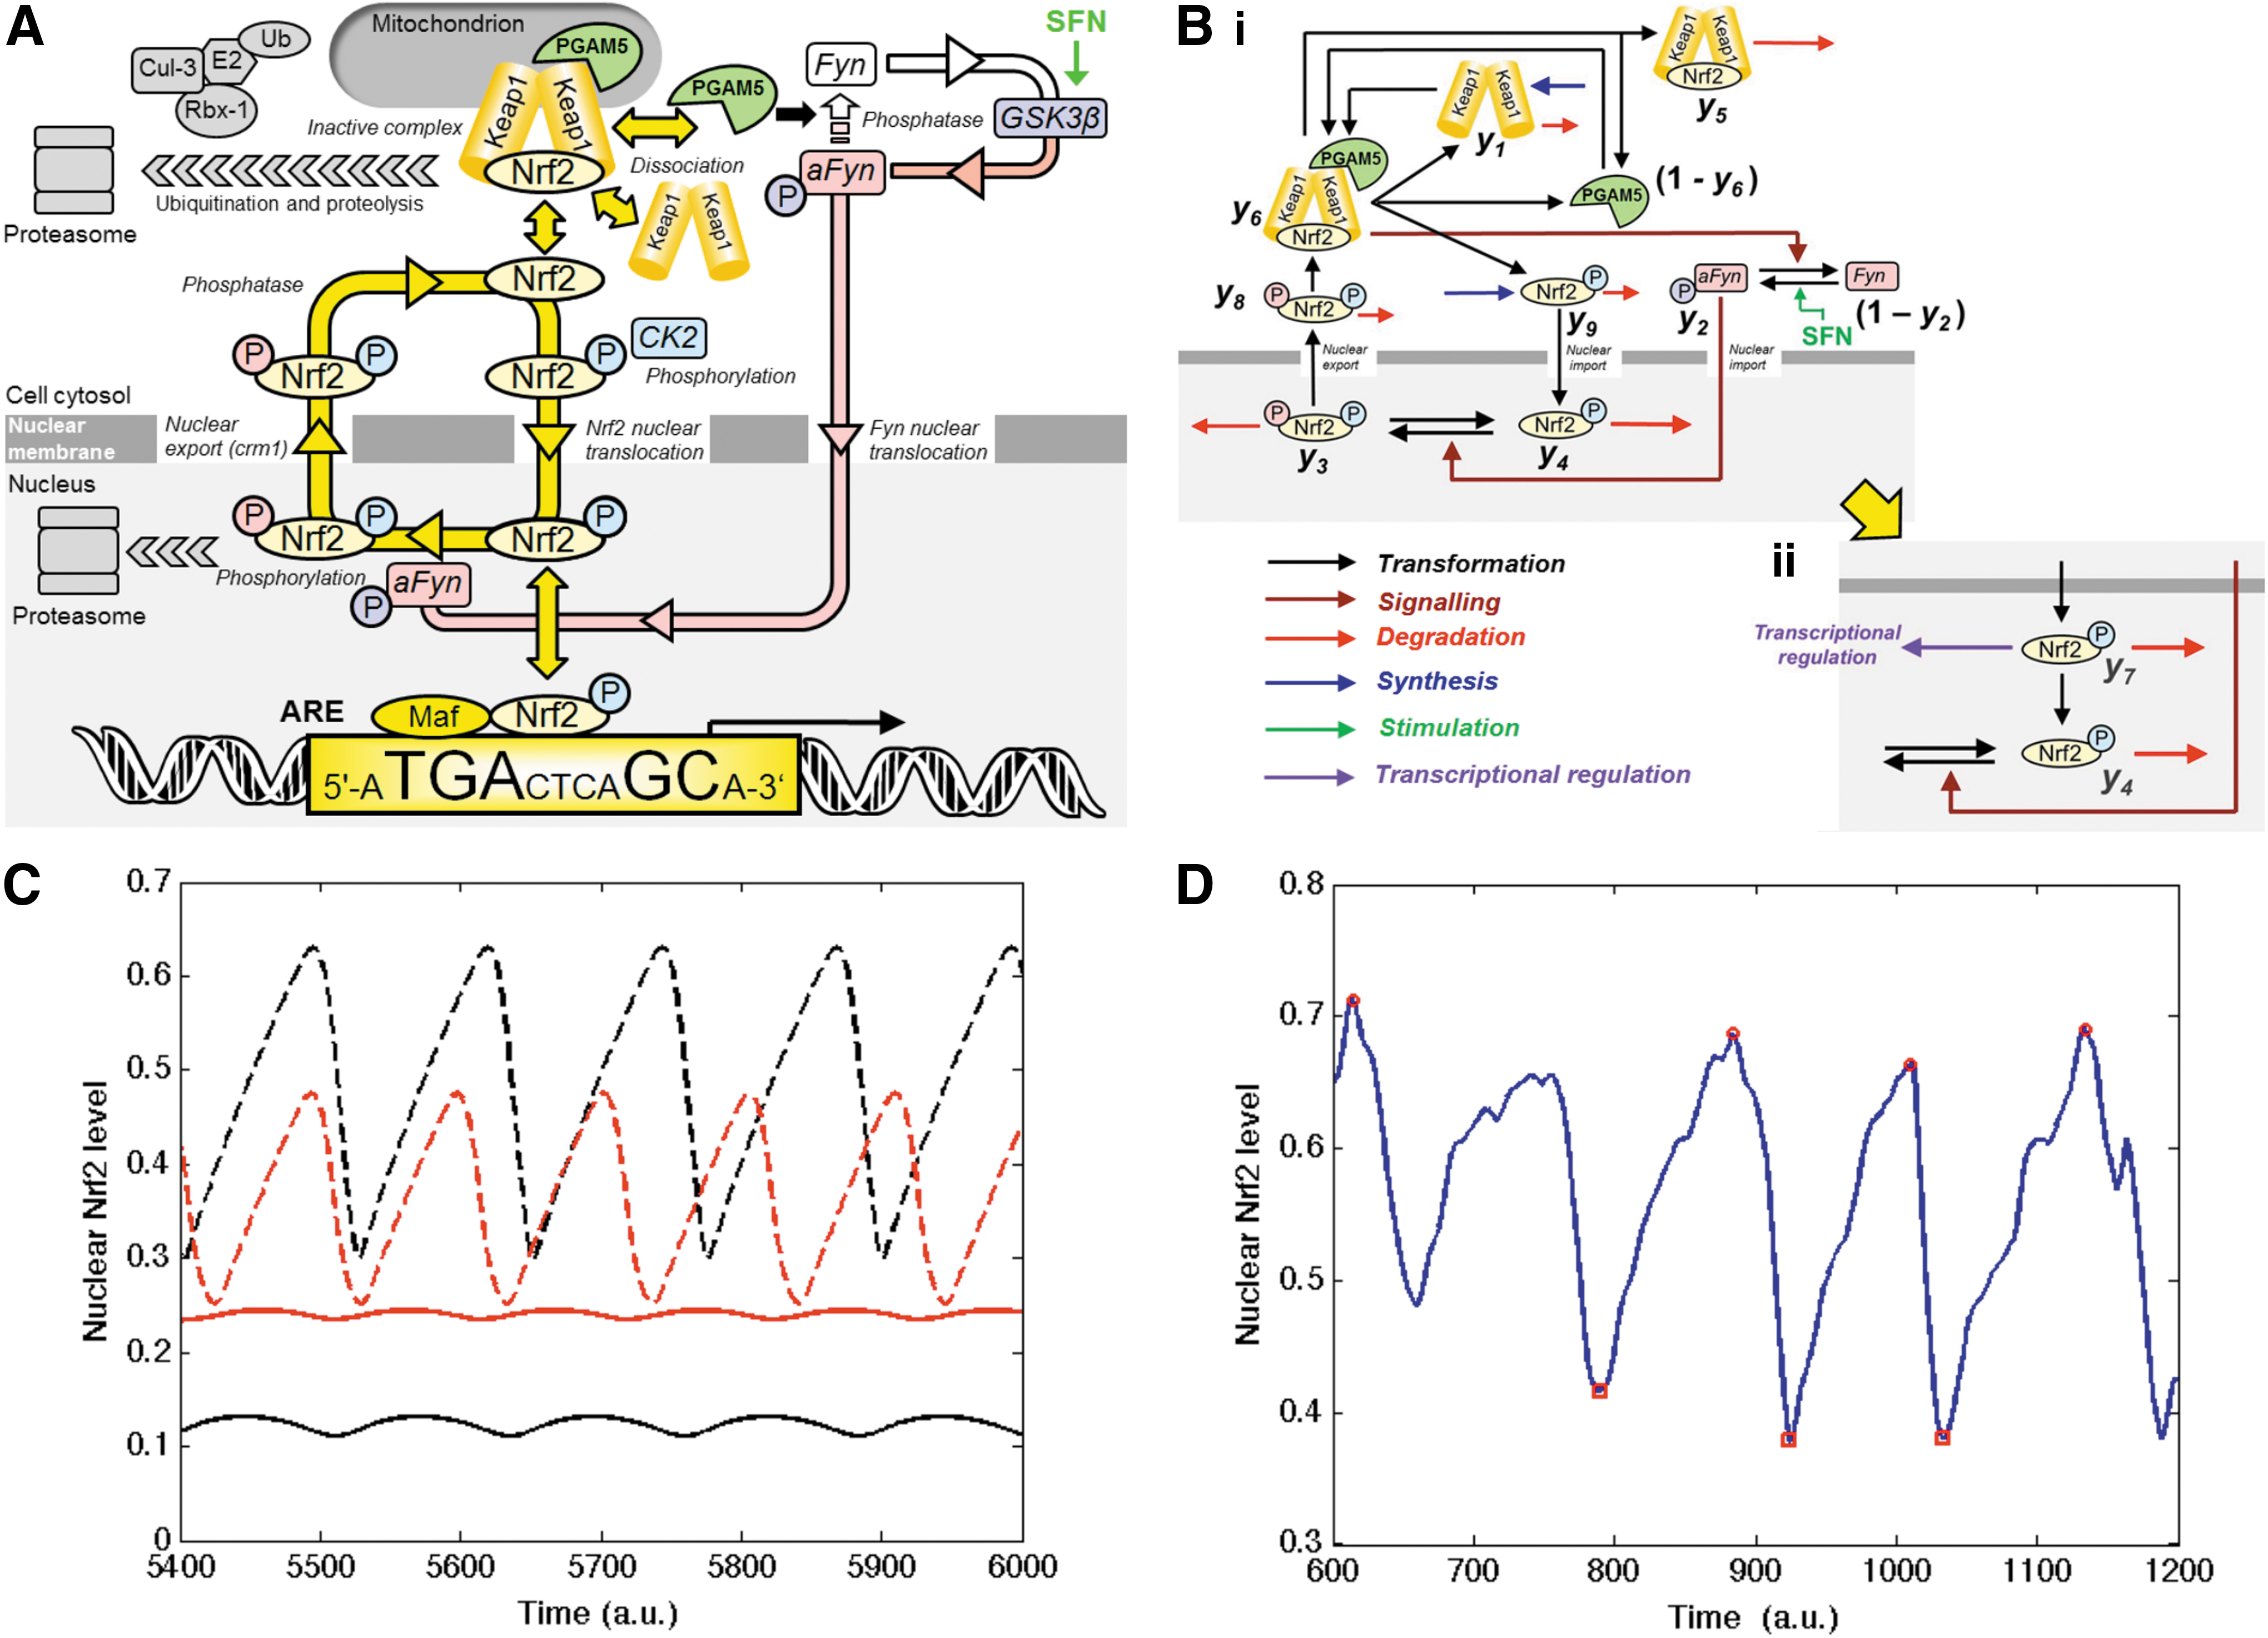
According to current understanding, under basal conditions, Nrf2 transactivational activity is repressed by binding to Kelch-like erythroid cell-derived protein with CNC homology-associated protein 1 (Keap1). This acts as an inhibitor holding Nrf2 in the cytoplasm and facilitating its degradation. Keap1 is a substrate adaptor protein for Cullin-3 (Cul3)-dependent E2 ubiquitin ligase complex, directing Nrf2 for degradation by the 26S proteasome (9). Keap1 and Nrf2 are held together with the protein threonine phosphatase, PGAM5, which tethers Keap1 and Nrf2 to the outer mitochondrial membrane (36).
The mechanisms of stress sensing and surveillance by the Nrf2 system are uncertain but under conditions of oxidative and electrophilic stress Nrf2 is released from Keap1. Nrf2 is phosphorylated by casein kinase-2 (CK2) (1). It translocates to the nucleus via importins α5 and β1 (58). In the nucleus, Nrf2 activates target genes by binding to regulatory antioxidant response elements (AREs) (45). Thereafter, Nrf2 is phosphorylated by Fyn kinase and expelled from the nucleus via the nuclear membrane export channel exportin-1/crm1, and degraded (20) (Fig. 1). Endogenous activators are lipid peroxidation and arachidonic acid oxidation products, 4-hydroxynonenal and J3-isoprostanes (13, 17), and exogenous activators are typically bioactive compounds from fruits and vegetables such as R-sulforaphane (SFN) and quercetin (QTN) (57, 59). The Nrf2/Keap1/ARE system regulates a large number of genes in mammals: basal expression of ca. 640 genes, inducible expression of 650 genes and basal and inducible expression of ca. 240 genes has been detected (38).
Research on the control of Nrf2 has focused on binding and chemical modification of its inhibitor, Keap1, by activators, stabilizing Nrf2 to proteolysis thus increasing cellular Nrf2 protein content (27). Our initial studies, however, showed that activation of cells to produce half-maximal ARE-linked transcriptional response elicited no significant change in Nrf2 protein concentration—although markedly higher and often toxic concentrations of activators did so (23, 57). Under physiological and health beneficial conditions, therefore, Nrf2 activation status may be encoded in the time dependence of subcellular Nrf2 location rather than its resistance to proteolysis. Herein we show, for the first time, that Nrf2 undergoes translocational oscillations from the cytoplasm to the nucleus in the basal state. When stimulated at physiological levels, the translocational oscillations of Nrf2 increase in frequency, decrease in amplitude and activate ARE-regulated genes. We present a mechanism to explain this where Nrf2 functionality is linked to reactivation on return to the cytoplasm or “refresh rate” which links protective transactivational response to increased frequency of direct surveillance of the cytoplasm.
Results
Nrf2 undergoes autonomous translocational oscillations and cell stimulation increases oscillation frequency, decreases oscillation amplitude and regulates ARE-linked gene transcription
To examine Nrf2 stress response signaling between cytoplasmic and nuclear compartments we studied real-time changes in subcellular localization of Nrf2 in human HMEC-1 (human microvascular endothelial cell line-1) cells in vitro by live cell time-lapse fluorescence microscopy. HMEC-1 cells were transfected to express green fluorescent protein (GFP)-Nrf2 fusion protein. Dynamics of nucleus/cell GFP-Nrf2 fluorescence intensity ratio obtained from time-lapse image sequences revealed that Nrf2 undergoes oscillatory cytoplasm-nucleus translocation. Observation periods were for 400 min (Fig. 2A and Supplementary Video S1; Supplementary Data are available online at
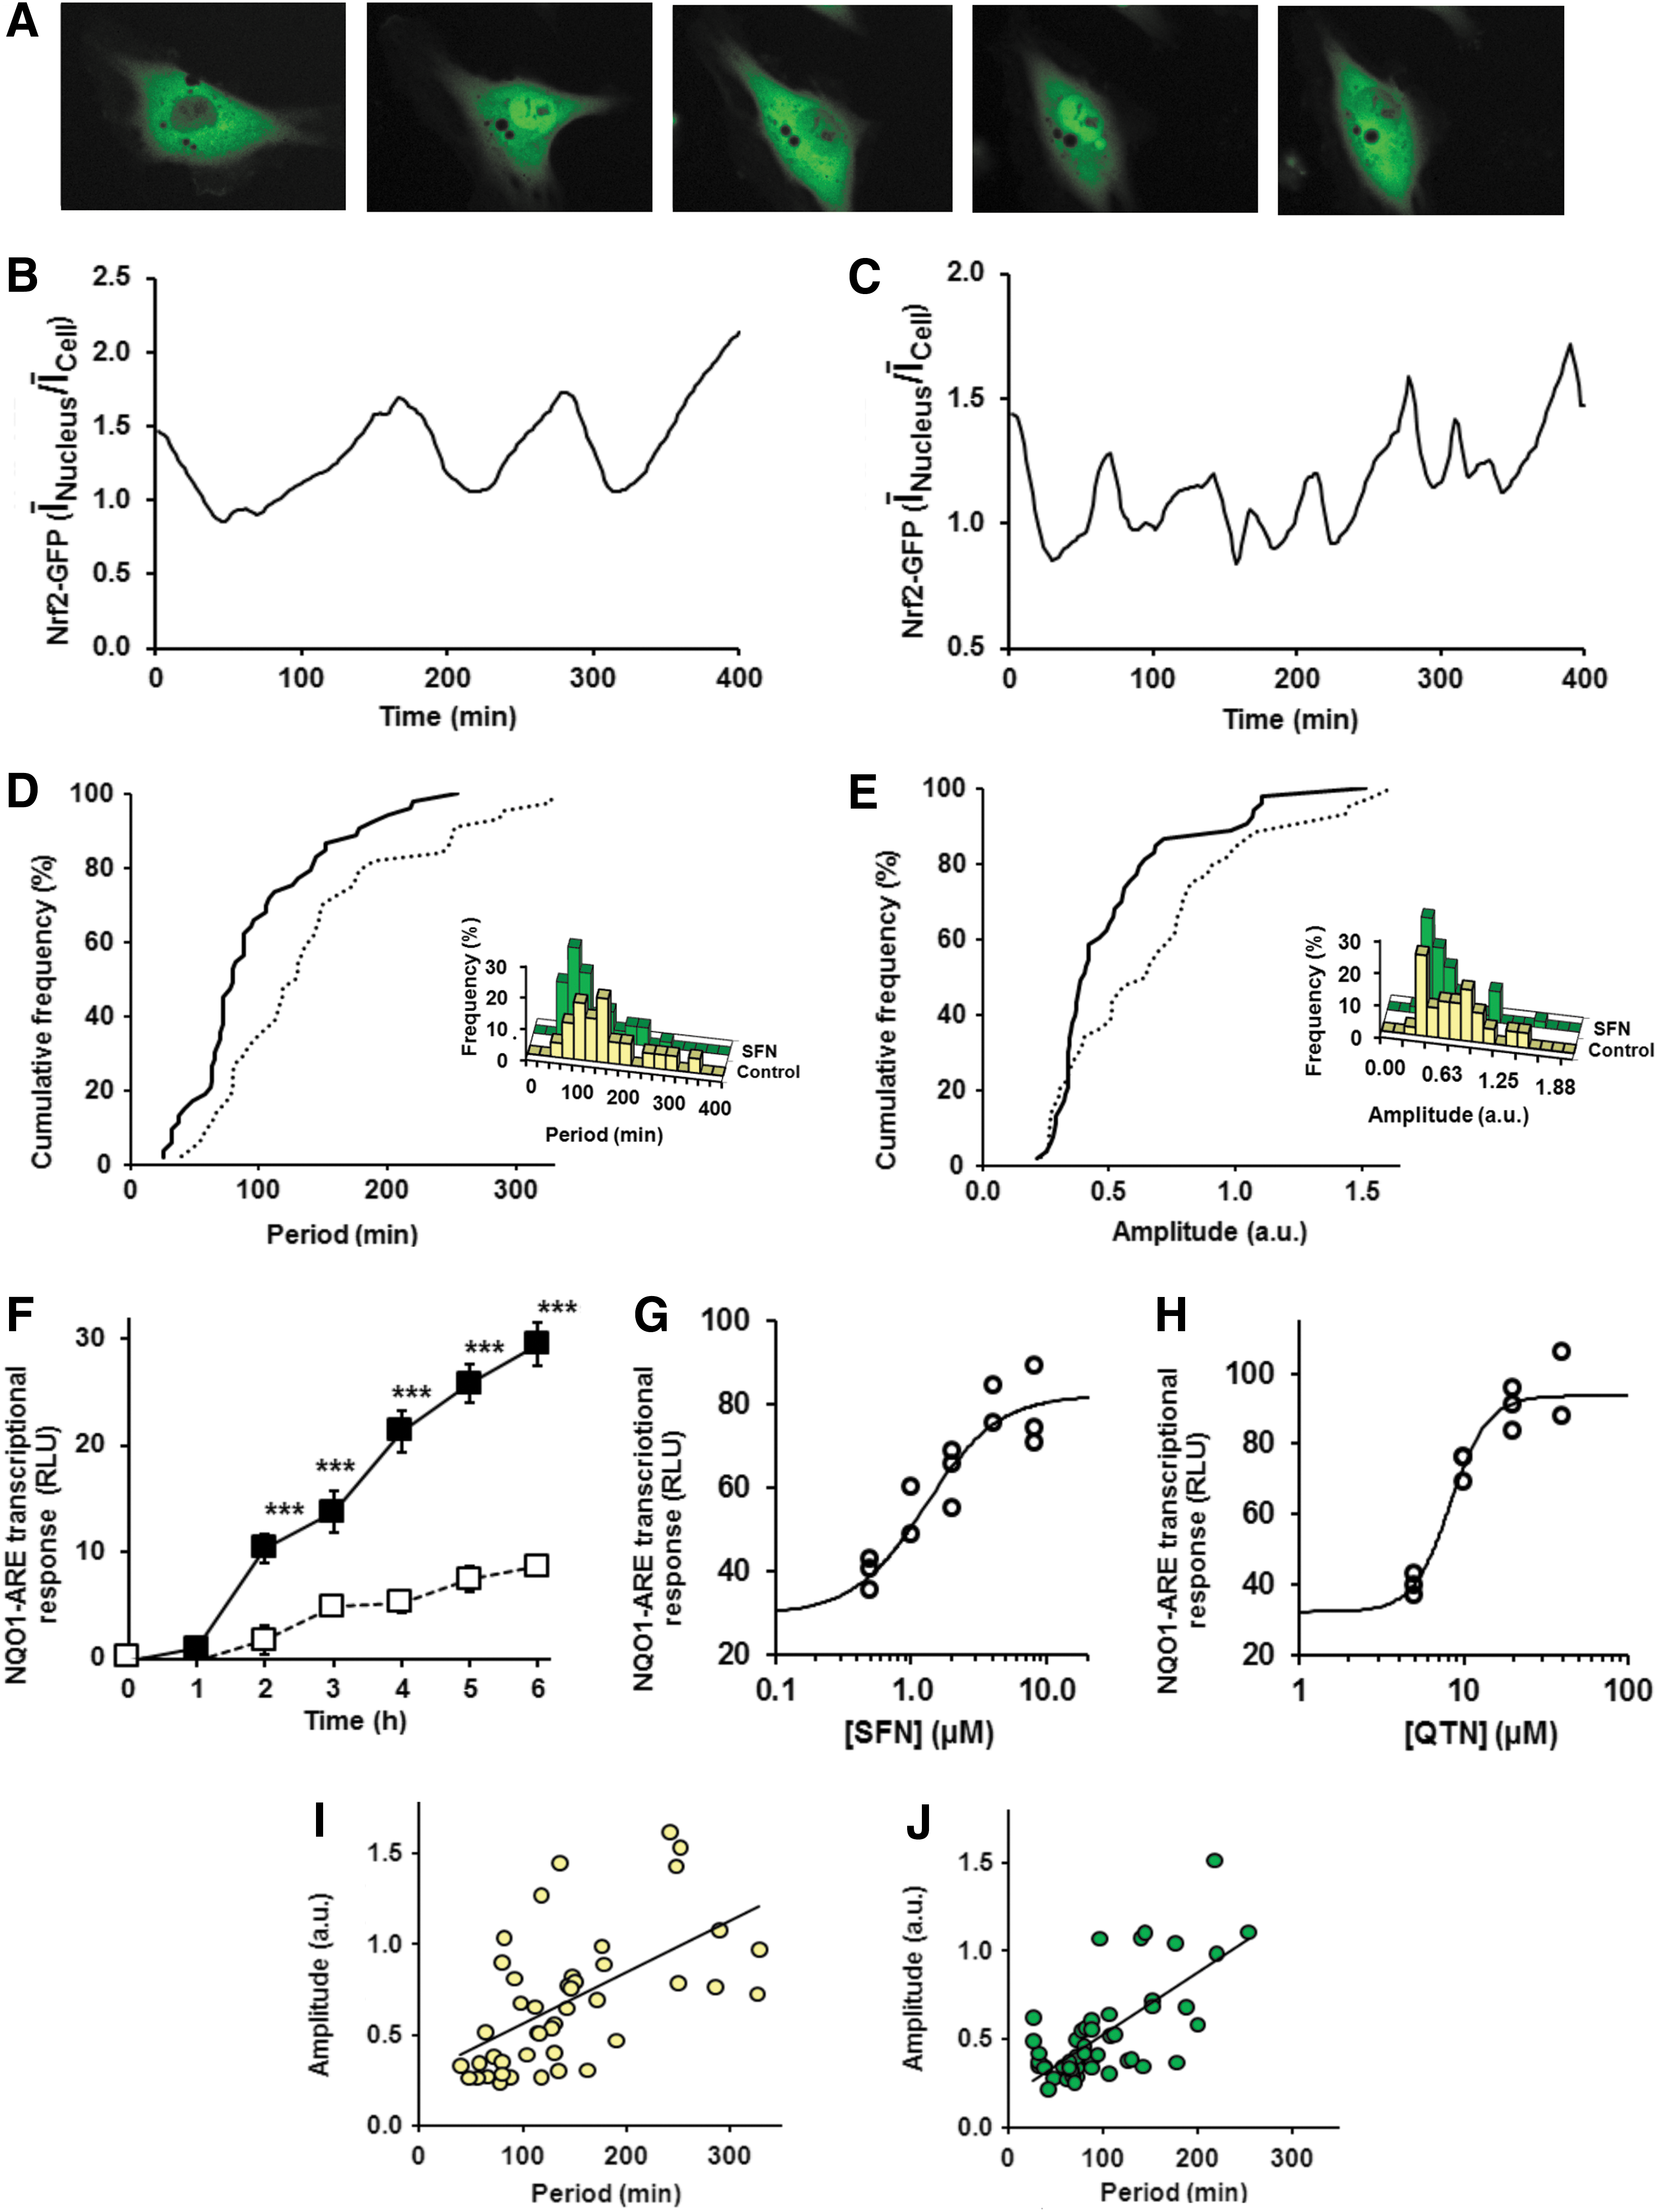
We next studied the effect of Nrf2 activators, SFN and QTN, on cytoplasm-nucleus translocational oscillations. To establish a concentration that achieves functional Nrf2 activation without cytotoxicity we studied the concentration dependence of Nrf2 transactivational activity using a transfected quinone reductase-ARE (NQO1-ARE) luciferase reporter vector. The NQO1-ARE transcriptional response increased slowly over 6 h in unstimulated cells and with ca. threefold increased rate when cells were stimulated with 2 μM SFN (Fig. 2F). We used the 6 h treatment response as a fixed time point measure of NQO1-ARE transcriptional activity. Stimulant concentration-transcriptional response relationships were explored for SFN (0.5–8 μM) and QTN (5–40 μM). We found median effective concentration EC50 values producing half-maximal increase in transcriptional response were 1.3±0.3 μM SFN and 8.3±0.5 μM QTN (Fig. 2G, H). SFN (2 μM) and QTN (8 μM) were used in subsequent studies. The concentration-response profile for SFN was similar to that previously found using a Nrf2 Neh2 domain-lucerifase reporter (50). Similar activation response was found when cells were cultured short-term without epidermal growth factor (EGF)-indicating that the response was not dependent on EGF signaling. These concentrations do not induce growth arrest, change in distribution of cells in the cell growth cycle or toxicity (56, 66), which is rather typical of much higher concentrations; for example, disturbance of the cell cycle and induction of apoptosis by 12.5–50 μM SFN (3). The low concentrations of SFN and QTN used herein are similar to peak plasma concentrations achieved with a diet containing source materials rich in these bioactive compounds or their precursors associated with health benefit (6, 16). When cells were treated with SFN there was an increase in frequency and decrease in amplitude of the oscillations (Fig. 2C, E and Supplementary Video S2). The period of oscillation was decreased to 80 (64–128) min (−38%, p<0.001) with concomitant decrease in oscillation amplitude to 0.40 (0.34–0.59) arbitrary units (−38%, p<0.05); n=53, Mann–Whitney U. Oscillation period correlated positively with amplitude (Fig. 2I, J). We used a statistical analysis of the autocorrelation function (4) to reject the hypothesis that what we observed are not faster oscillations but a loss of oscillations resulting in stochastic fluctuations. This hypothesis was strongly rejected (Ljung-Box test, p<3×10⁻¹⁶ for all SFN-treated cell time series). Similar oscillations of Nrf2 were found with QTN where the oscillation period was intermediate to that of control and SFN-treated cells (Supplementary Video S3). Removal of SFN from the culture by washing cells and continued culture with fresh medium returned the translocational oscillation period to that of quiescent cells in the subsequent 2–4 h, consistent with the half-life of cell protein bound isothiocyanate adducts (64).
We next sought to validate the detection of translocational oscillations of Nrf2 in HMEC-1 cells in vitro. To test whether the Nrf2 oscillations were associated with cell stress induced by illumination with excitation wavelength light to record the GFP image, we varied the frequency of image frame capture with fixed exposure time of 250 ms from 2 to 10 min in the time-lapse microscopy. The presence of oscillations and oscillation frequency did not change significantly: oscillation frequency—5 min frame interval, 110 (99–118) min (n=6); and 10 min frame interval, 120 (110–130) min (n=7). Hence microscope illumination was not a driver of Nrf2 oscillation. HMEC-1 cells have a dermal microvascular endothelial phenotype and translocational oscillations of Nrf2 may be a response to abnormal high oxygen concentration. To test this we incubated transfected cells under a depleted oxygen atmosphere of 3% oxygen, typical of skin in vivo (61). Translocational oscillations of Nrf2 were found of similar frequency to those characterized above (Supplementary Video S4); oscillation frequency 104 (87–115) min (n=6). To test whether Nrf2 oscillations were an artifact of the characteristics of the HMEC-1 cell line, we transfected human aortic endothelial cells and human BJ fibroblasts (human foreskin fibroblasts originated in the laboratory of J.R. Smith, Baylor College of Medicine, Houston, Texas, USA) fibroblasts in primary culture and recorded similar time lapse images. Therein we found similar cytoplasm-nucleus translocational oscillations of Nrf2 (Supplementary Videos S5 and S6).
We also made test transfections to determine the extent to which Nrf2-GFP increases the total cellular content of Nrf2 and to check that GFP-Nrf2 faithfully reports the cellular location of Nrf2. Transfection with the vector pcDNA3-EGFP-C4-Nrf2 produces expression of Nrf2-GFP comprising the human Nrf2 domain (sequence mass 68 kDa, with N-terminal tag of GFP, 27 kDa sequence mass). Antibodies raised to the C-terminal domain of Nrf2, EP1808Y, detected both Nrf2 and Nrf2-GFP with equal affinity. Western blotting with EP1808Y antibody detected a band at 98 kDa from control, untransfected HMEC-1 cells (consistent with electrophoretic mobility of Nrf2) (32, 65), and bands at 98 and 125 kDa from transfected HMEC-1 (consistent with electrophoretic mobility of Nrf2 and Nrf2-GFP) (Fig. 3A). Densitometry of these bands produced an intensity ratio of 100:4. Immunoblotting of Nrf2 with H300 antibodies raised to an Nrf2 N-terminal epitope gave similar results—intensity ratio of 100:7, indicating that expression of GFP-Nrf2 produced only a minor increase in the total Nrf2 pool of 4%–7%. Immunofluorescence micrographs of transfected HMEC-1 cells with anti-Nrf2 antibody produced staining for some cells mostly in the cytosol, others mostly nucleus or both cytosol and nucleus. Irrespective of where anti-Nrf2 immunostaining was located (green), immunofluorescence of GFP (red) showed co-localization with Nrf2 (Fig. 3B–E). Addition of stimulants did not change total GFP-Nrf2 fluorescence. Moreover, studies with double transfection of cells to express GFP-Nrf2 and destabilized Venus-ARE-linked transcription reporter with monitoring of Nrf2 translocation and ARE-linked transcription before and after SFN stimulation indicated that cells with increased Nrf2 translocation frequency were those with increased ARE transcription activity.
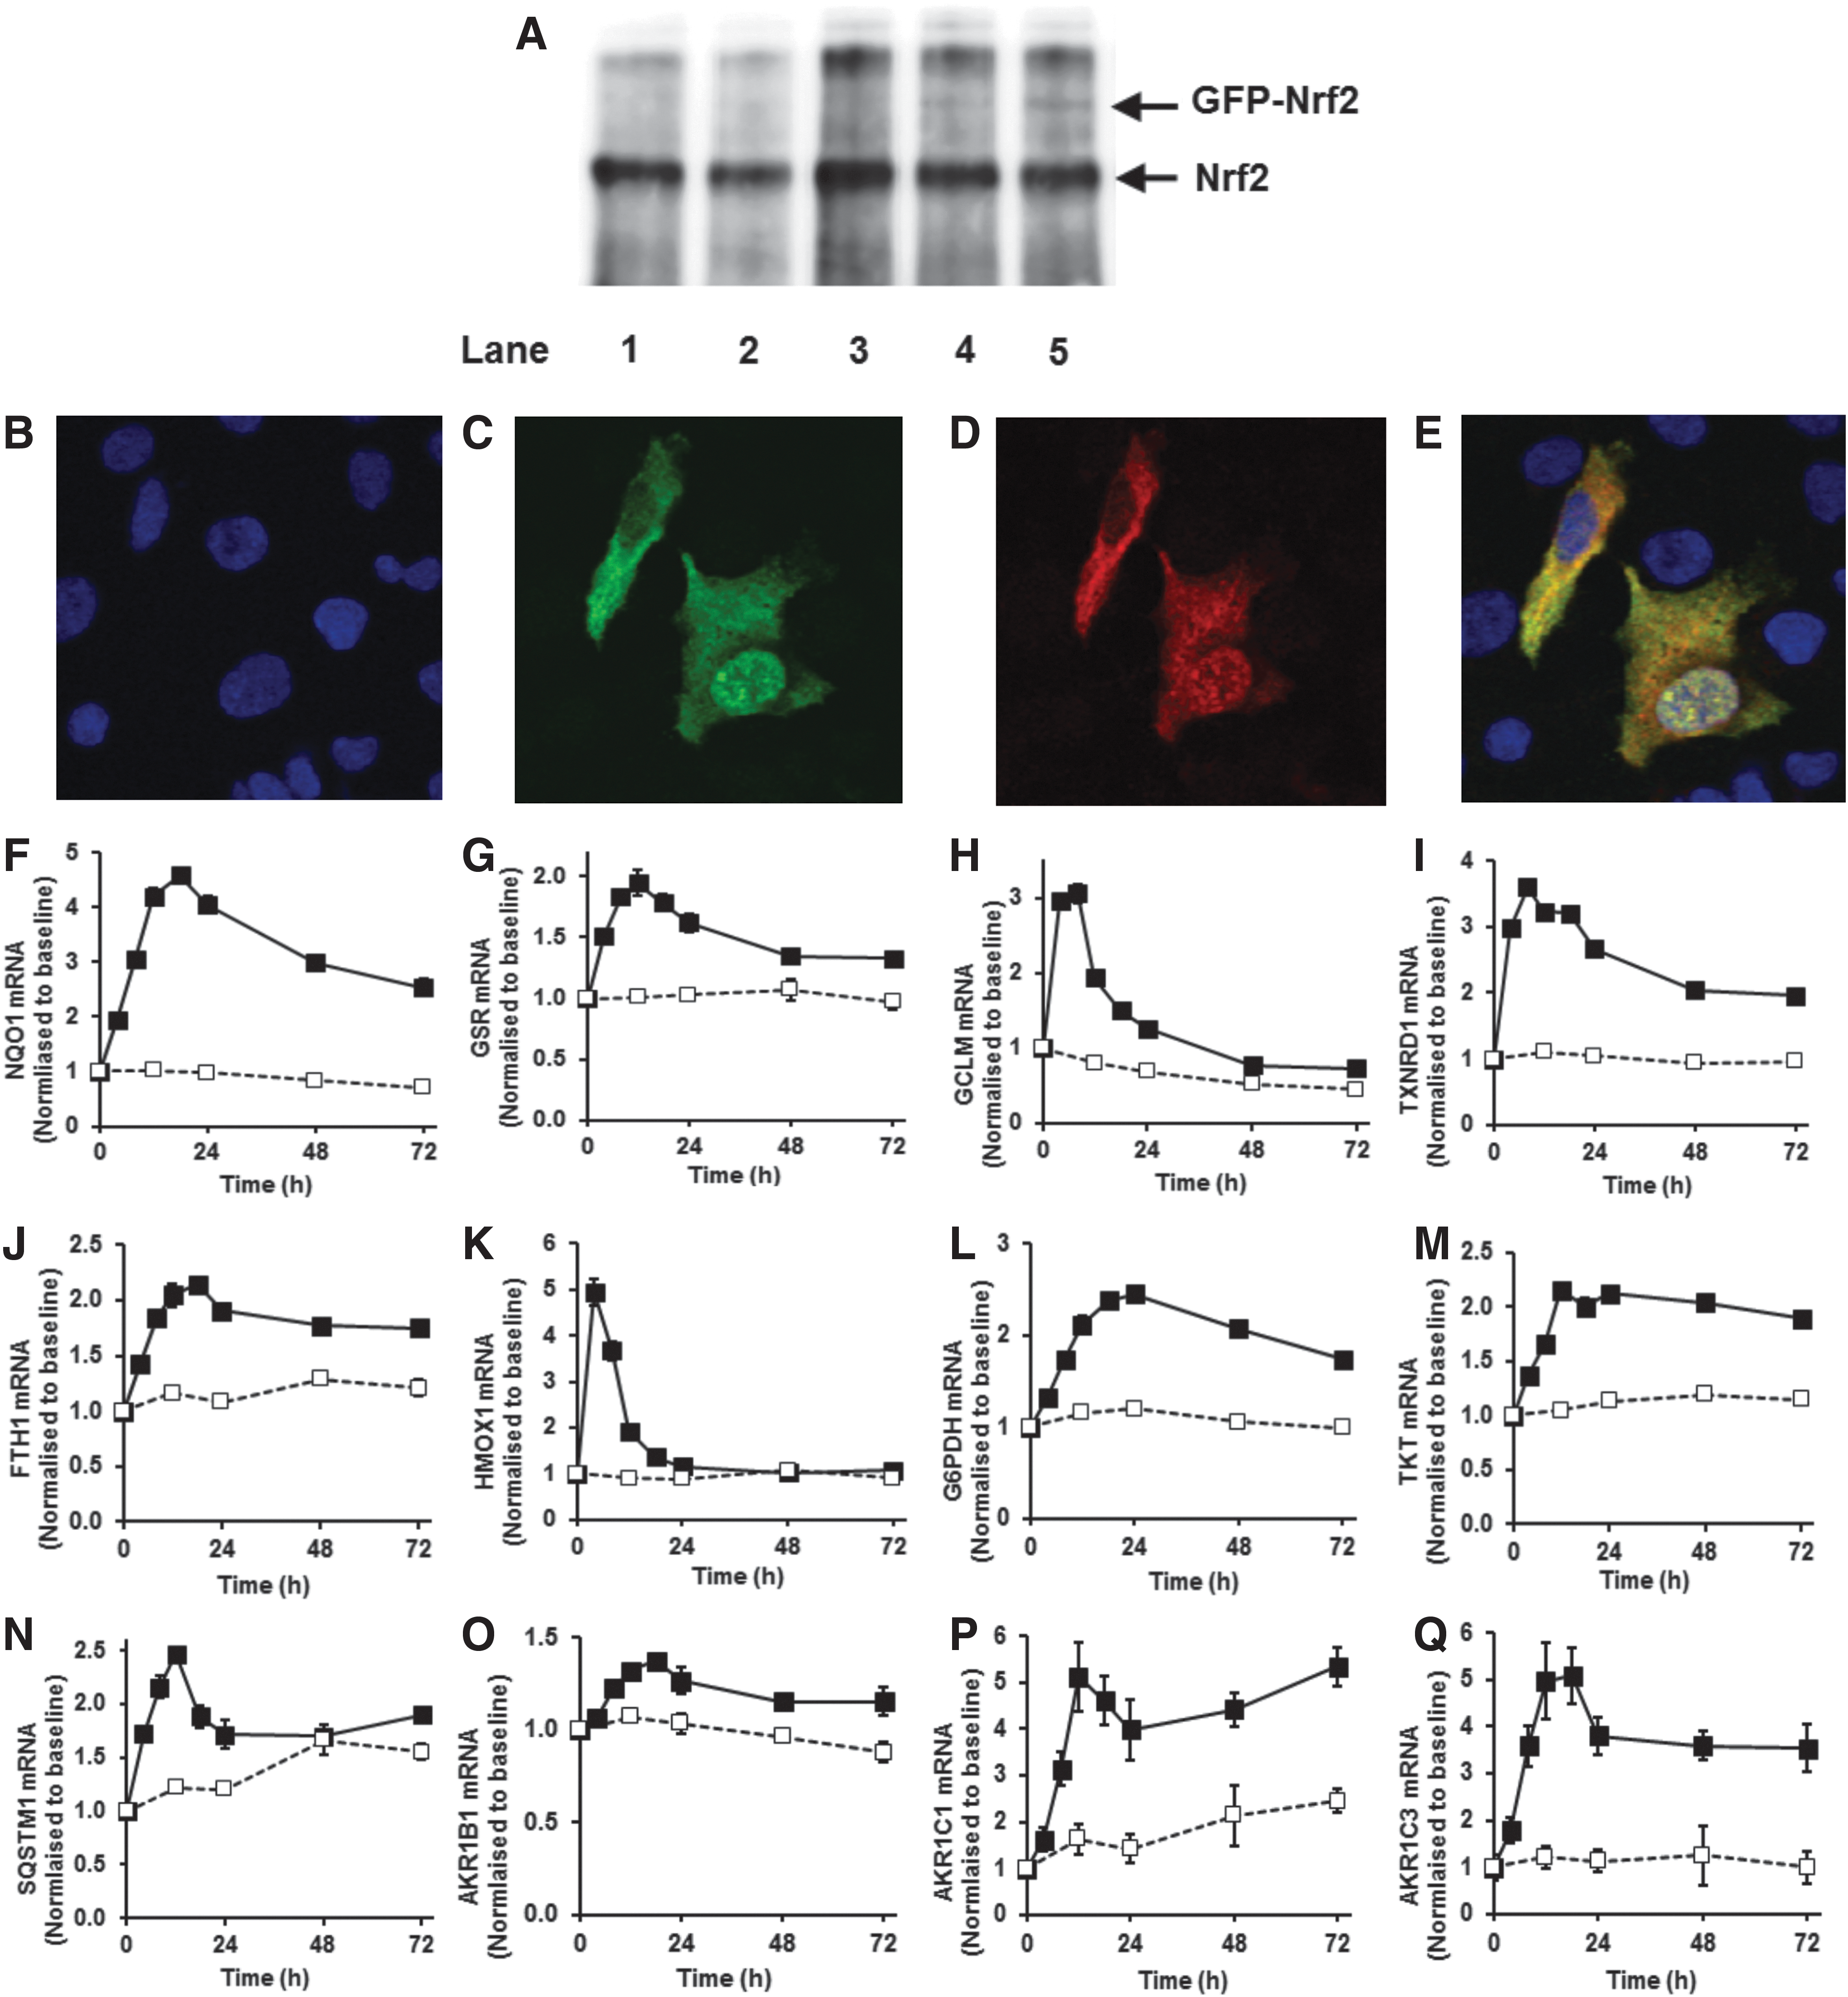
Increased frequency and decreased amplitude of Nrf2 translocational oscillations were associated with increased expression of ARE-linked genes: quinone reductase, glutathione reductase, γ-glutamylcysteine ligase-regulatory subunit, thioredoxin reductase, ferritin and heme oxygenase linked to antioxidant cytoprotective responses (47) (Fig. 3F–K); glucose-6-phosphate dehydrogenase and transketolase linked to metabolic re-programming (41) (Fig. 3L, M); sequestosome-1 (p62) linked to autophagy in healthspan (11) (Fig. 3N), and aldoketo reductase isoforms 1B1, 1C1 and 1C3, linked to carbonyl stress cytoprotective responses (Fig. 3O–Q). The time course profile of mRNA of these ARE-linked genes increased over the initial 6–8 h, matching the period of pharmacological activity of SFN. The pharmacological response of SFN and related isothiocyanates is associated with reversible binding to target protein thiols (protein thiocarbamoylation) which increases over the initial 4 h, remaining above the half-maximal value for 6–8 h and declining thereafter; cf. reversible cell protein binding by phenethyl isothiocyanate (64). Thereafter, mRNA levels return to baseline over periods reflecting half-lives of mRNA and residual increased expression. Response duration may be increased by induction of expression of SQSTM1/p62 which is itself an activator of Nrf2 (28). Increased ARE-linked gene mRNA level was associated with increased expression product, for example, increased NQO1 protein (see Fig. 4C, D).
Activation of the ARE transcriptional response occurs without increase in Nrf2 or decrease in Keap1 protein
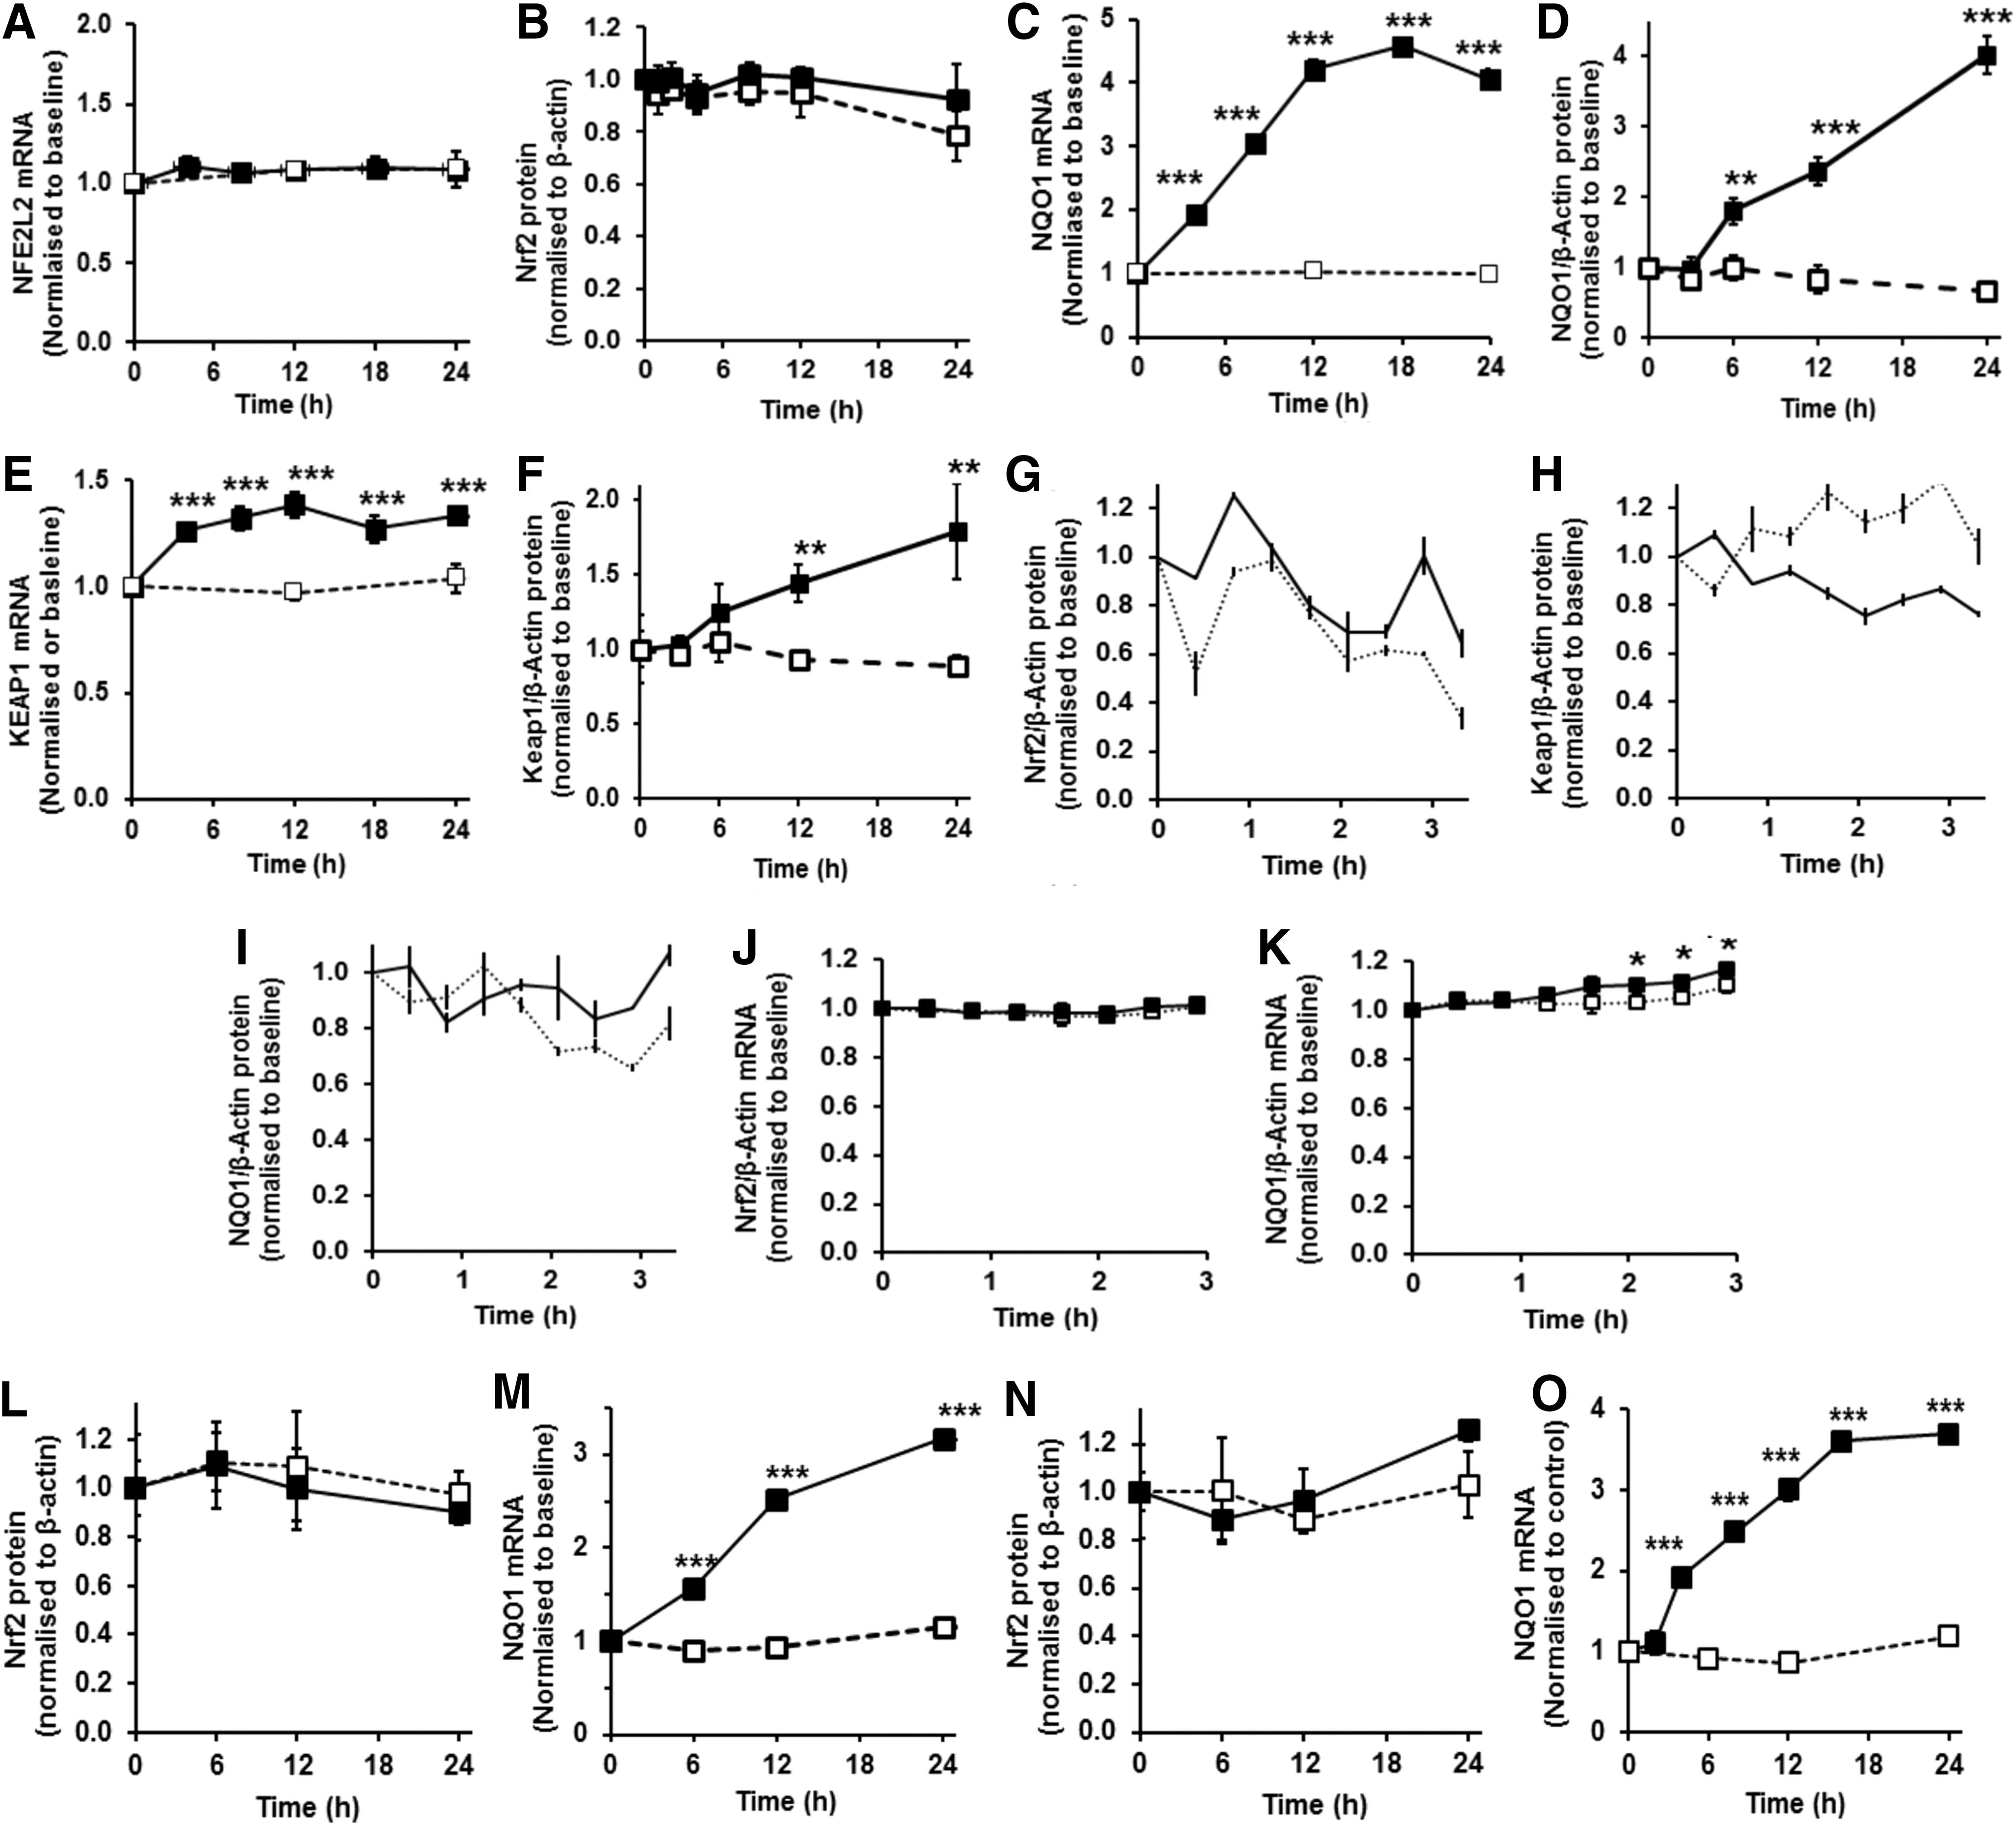
It is currently considered that increased Nrf2 transactivational activity is mediated by accumulation of Nrf2 protein in the cell cytosol with CK2-driven entry of Nrf2 into the nucleus and increased ARE-linked gene transcription. We examined mRNA and protein of Nrf2 in HMEC-1 cells with and without treatment with 2 μM SFN and found no change in the initial 24 h (Fig. 4A, B), although Nrf2 transactivational activity was increased in this period by SFN—as evidenced by increased NQO1 expression at the mRNA and protein levels in the initial 24 h period (Fig. 4C, D). In contrast to current mechanistic interpretation, Nrf2 transactivational activity appears not linked to change in cellular levels of Nrf2 protein for SFN concentration-limited responses but rather to change in subcellular localization in translocational oscillations (see Fig. 2B, C, F). Keap1 mRNA was increased at 4 h poststimulation and remained increased thereafter to 24 h poststimulation, and Keap1 protein was not decreased and rather increased at 12 h poststimulation (Fig. 4E, F). Change in cytoplasmic/nuclear translocational oscillation frequency and amplitude of Nrf2 induced by SFN, however, occurred within the initial 6 h poststimulation period (see Fig. 2B, C). Taken together, these observations suggest high frequency, low amplitude oscillations of Nrf2 associated with transactivational activity are not linked to change in Nrf2 or Keap1 protein. Induction of Keap1 expression by SFN was expected as Keap1 is an ARE-linked gene (33).
We also examined levels of Nrf2, Keap1 and NQO1 protein in the initial 24 h of control and stimulant treatments to detect possible oscillatory change in regulatory components and target gene product. Time intervals of 25 min were small relative to the period of Nrf2 translocational oscillations. Inspection of time course profiles in cellular content of Nrf2, Keap1 and NQO1 protein (Fig. 4G–I) and statistical testing (α=0.95, autocorrelation function analysis) show that variation in response is that expected for white noise, implying that the time series are not oscillatory. There was also no evidence of oscillation in levels of Nrf2 mRNA (Fig. 4J), nor in target gene NQO1 mRNA which was increased in SFN-treated cells from 125 min poststimulation, with respect to unstimulated control (Fig. 4K).
The key features of the Nrf2 regulatory mechanism, induction of ARE-regulated gene expression with Nrf2 oscillation without change in total Nrf2 protein concentration, were also found in other cells types—human aortic endothelial cells and human BJ fibroblasts in primary culture (Supplementary Videos S5 and S6 and Fig. 4L–O).
Mathematical models successfully reproduce the oscillations
Mathematical models were developed alongside the experiments in order to guide hypothesis generation and to understand the origin and nature of the oscillations. Initial model development was constrained by the autonomous nature of the oscillations, asymmetric profile of slow nuclear import and rapid export of Nrf2, the positive correlation of oscillation period and amplitude and unchanged Nrf2 mRNA and protein—the rate of synthesis and degradation of Nrf2 protein being assumed equal whether in the cytoplasm or nucleus by including terms for cytoplasmic and nuclear proteolysis of Nrf2. We also propose that the protein threonine phosphatase, PGAM5, associated with Nrf2 and Keap1 in a ternary complex in the cytoplasm (8, 35, 55), dephosphorylates Fyn for its inactivation—Table 1.
Constraints: 1. Nrf2 oscillations are translocational with no oscillation in total cellular Nrf2 protein. 2. Oscillations are autonomous (occur without stimulation). 3. Oscillations have an asymmetric waveform with slow nuclear import and rapid export. 4. Stimulation, by SFN or QTN increases frequency and decreases amplitude of oscillations (this work). 5. SFN and QTN increase Fyn activity (34, 37, 70). 6. Nrf2 is exported from the nucleus following phosphorylation by Fyn (20). 7. Cytoplasmic Nrf2 is imported into the nucleus by CK2 (1). 8. PGAM5 forms a ternary complex with Keap1 and Nrf2 in the cytoplasm (36). 9. Nrf2 is inactivated in the nucleus by acetylation (40).
Assumptions: ternary complex-bound PGAM5 catalyses the inactivation of Fyn. Inferred biochemical catalysts are: PPase for cytoplasmic dephosphorylation of Nrf2 [removing Tyr-568 phosphorylation of Fyn (20) and Ser phosphorylation of CK2 (1)], PTPase for reversal of phosphorylation of Nrf2 by Fyn in the nucleus, nuclear acetyl transferase and cytoplasmic deacetylase for reversible acetylation of Nrf2 (40, 46), and cytoplasmic and nuclear proteasome for Nrf2 and Keap1 degradation.
aFyn, phosphothreonine-activated Fyn; CK2, casein kinase-2; GSK3β, glycogen synthase kinase 3β; Keap1, Kelch-like erythroid cell-derived protein with CNC homology-associated protein 1; Nrf2, nuclear factor erythroid 2-related factor 2; PPase, protein phosphatase; PTPase, protein tyrosine phosphatase; QTN, quercetin; SFN, sulforaphane.
A key feature of the experimentally observed oscillations is the rapid coordinated exit of the Nrf2 from the nucleus. This is driven by phosphorylation of nuclear Nrf2 by activated Fyn and represents one of the main mechanisms driving the oscillations. After the expulsion from the nucleus, Nrf2 rebinds Keap1 and PGAM5 in the ternary complex but at a level greater than at equilibrium. As a consequence the complex is disrupted by this overshoot from the equilibrium level with consequent release of PGAM5 from the complex. We assume that PGAM5 dephosphorylates and inactivates Fyn and less efficiently when free; thereby release of PGAM5 is associated with activation of Fyn. The combination of phosphorylation and de-phosphorylation of Fyn enables this subsystem to display ultrasensitivity, manifested by the gradual build-up of free PGAM5 and by the delayed and gradual build-up and then a rapid influx of activated Fyn into the nucleus. This phosphorylates nuclear Nrf2 and drives its rapid expulsion from the nucleus ready for the cycle to repeat [Fig. 5A (schematic) and B (regulatory model)]. We modeled ternary complex disruption mathematically in a generic form without discrimination for destabilization mechanism. The model reproduces the key features of experimental observations: asymmetric oscillations and the faster oscillations of decreased amplitude when stimulated (Fig. 5C). A stochastic version of the model simulated using the Gillespie algorithm (14) gives simulations that qualitatively match the experimental time course profiles and transcriptional response well (Supplementary Data S1 section and Fig. 5D).
Experimental validation of the fyn-glycogen synthase kinase 3β axis in Nrf2/ARE transcriptional response regulation
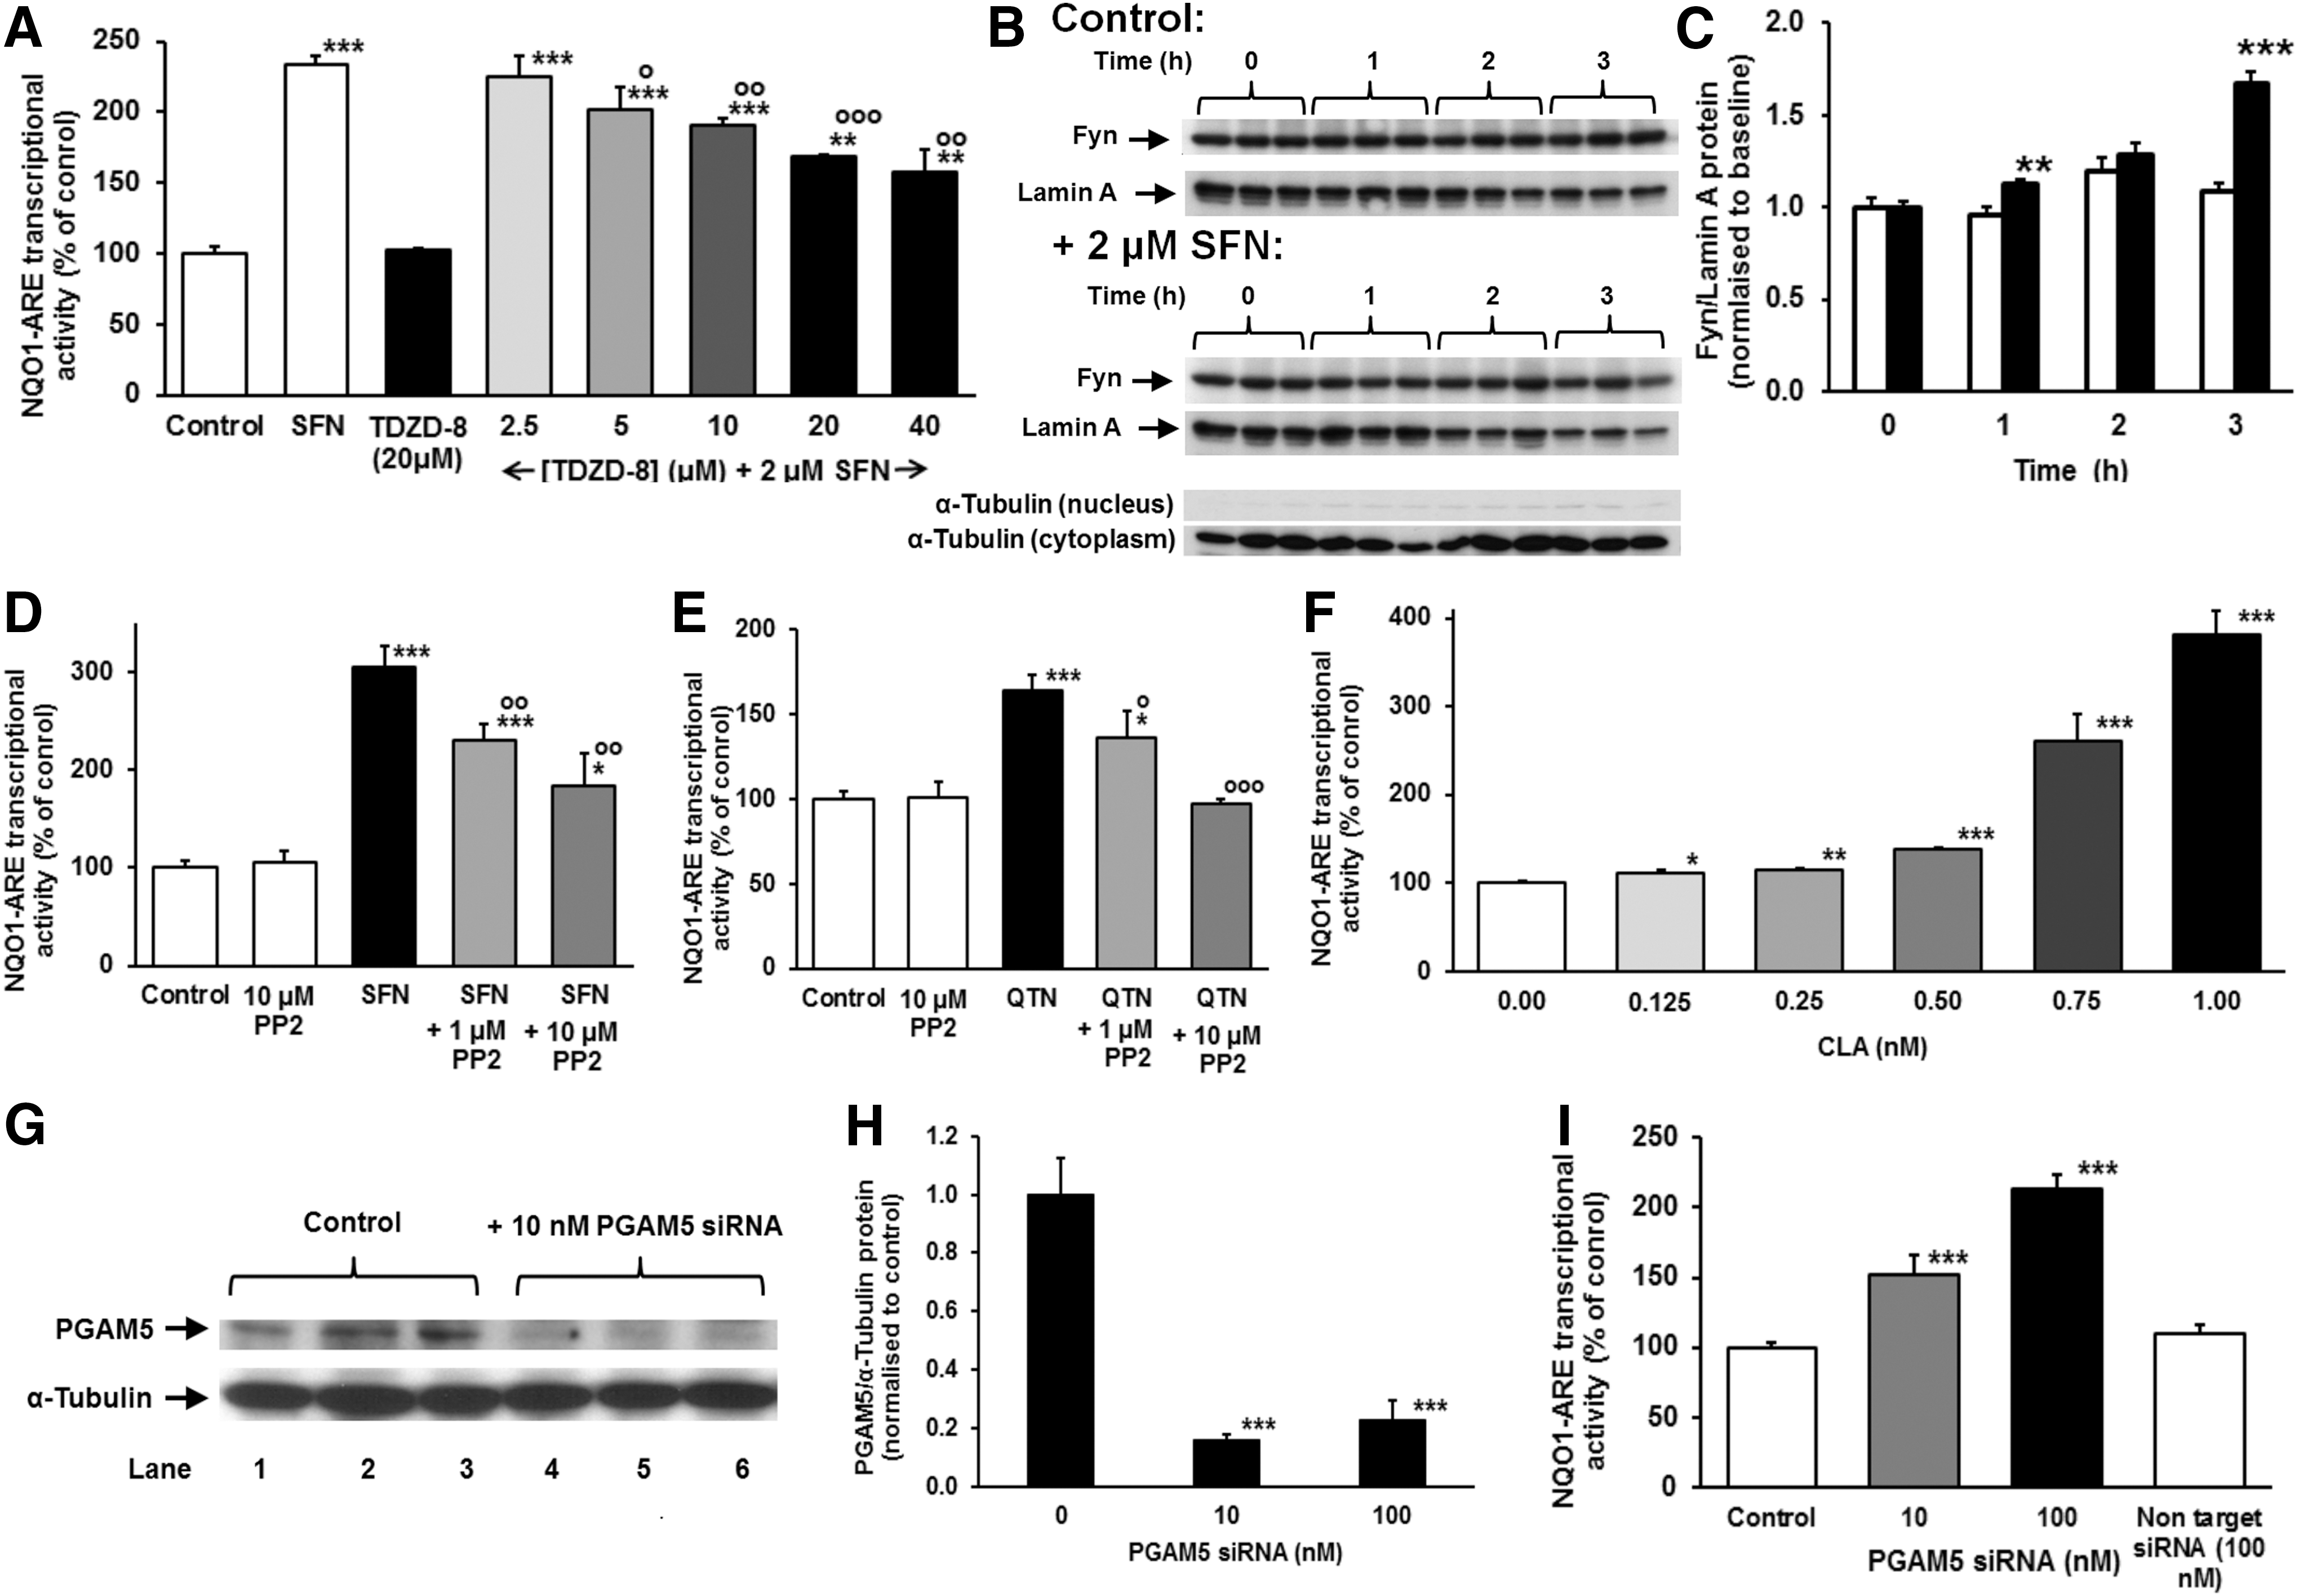
Fyn mediated nuclear export of Nrf2 has a critical role in its refresh rate and thereby transcriptional activity. Upstream activation of Fyn occurs by glycogen synthase kinase 3β (GSK3β) catalyzed phosphorylation on threonine residues (22). We propose that Fyn returns to quiescence by dephosphorylation by threonine phosphatase PGAM5. Inhibition of GSK3β with the specific inhibitor TDZD-8 decreased SFN-activated NQO1-ARE transcriptional response, confirming the role of GSK3β in the SFN activated response (Fig. 6A). Inhibition was, however, partial at 40 μM TDZD-8, which suggests other effects are likely involved in the SFN-activated response. Activation of Nrf2 by SFN increased nuclear localization of Fyn (Fig. 6B, C). Addition of Fyn inhibitor PP2 to HMEC-1 cells stimulated by SFN decreased the proportion of cells exhibiting oscillations, 16/20 versus 3/10 (p=0.012, contingency tables) and decreased NQO1-ARE transcriptional response induced by SFN and QTN (Fig. 6D, E), confirming that Nrf2 oscillations and ARE-regulated transcription are linked to and sustained by active Fyn. Addition of the threonine phosphatase inhibitor calyculin A (CLA) and knockdown of PGAM5 activated the NQO1-ARE transcriptional response (Fig. 6F–I). Consistent with this, knockdown of PGAM5 confers resistance to oxidative cytotoxicity induced by peroxides (63). Protein threonine phosphatase inhibition by CLA provided potent activation of Nrf2 being the first sub-nanomolar activator of the Nrf2 system. The stimulation of NQO1-ARE transcriptional activity by CLA was greater than ca. 80% knockdown of PGAM5. This may be due to effects of CLA other than inhibition of PGAM5 although the sub-nanomolar response is typical of CLA at its specific targets (52).
Smaller faster oscillations can activate genes
At first sight it appears difficult to explain how a small amount of Nrf2 resident for a short time in the nucleus produces greater gene transcription than a greater amount of Nrf2 in the nucleus resident for longer. Using our model we show that this counterintuitive observation can be explained if we assume that after entering the nucleus in the active state, Nrf2 is deactivated before it is phosphorylated by Fyn and leaves the nucleus to be reactivated in the cytoplasm. Acetylation of Nrf2 in the nucleus was found to decrease ARE-regulated transcription (40). When this mechanism is included into the model we find that for a reasonable set of parameter values the levels of active nuclear Nrf2 are substantially higher with the smaller faster oscillations (Fig. 5C). The way we did this is described (Supplementary Data S1 section). These results suggest the following predictions.
Trapping Nrf2 in the nucleus turns off transcription after the initial quantum is produced
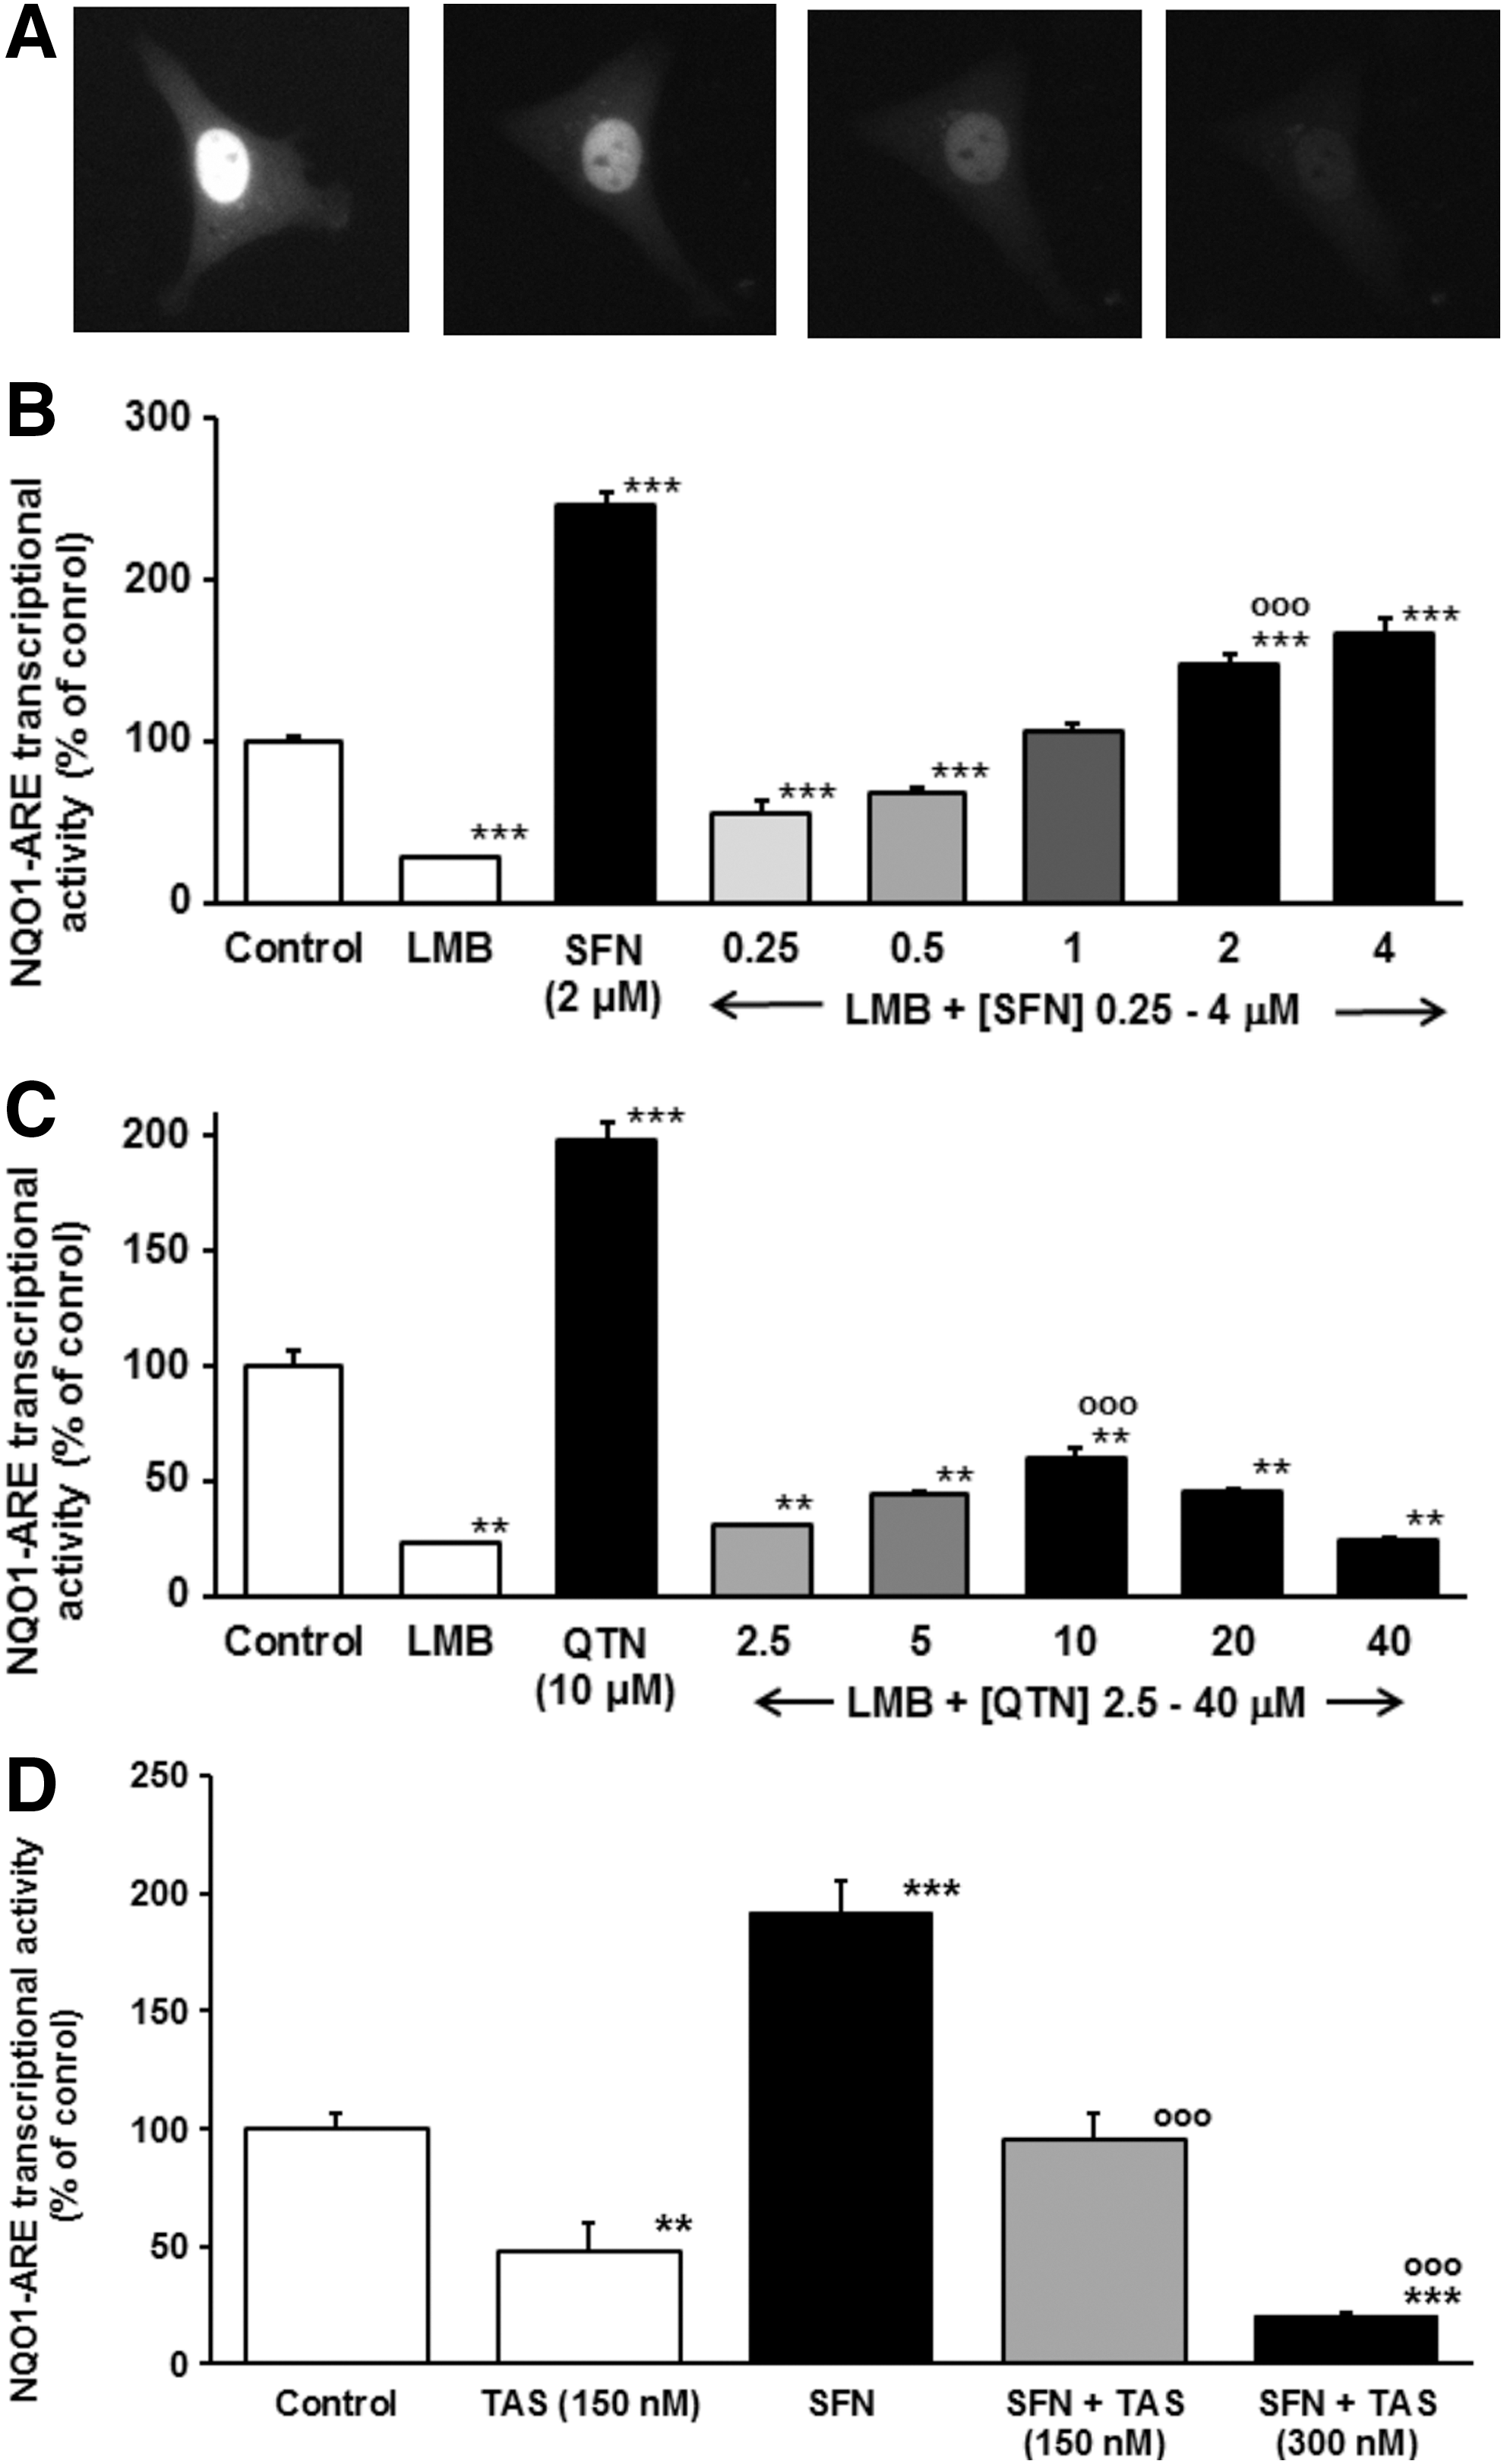
To test the transactivational activity of Nrf2 with prolonged dwell time in the nucleus we trapped Nrf2 in the nucleus by addition of leptomycin B (LMB)—a highly specific and potent inhibitor of crm1 (29) used previously in mechanistic studies of Nrf2 nuclear export (25). Addition of LMB to HMEC-1 cells transfected to express GFP-Nrf2 showed GFP-Nrf2 fluorescence localized in the cell nucleus. Furthermore, with concurrent block of de novo Nrf2 synthesis by addition of cycloheximide, Nrf2 protein was degraded in the nucleus with a half-life of 66 (48–195) min (n=8) (Fig. 7A). A recent estimate of total cellular half-life of Nrf2 was 62 min (48). Nuclear proteolysis of Nrf2, reported previously (18), suggests that Nrf2 is not being spared from degradation even when free of Keap1 and located in the nucleus. This also confirmed that Nrf2 is exported from the nucleus via crm1 and may be degraded within the nucleus. Addition of LMB produced inhibition of constitutive NQO1-ARE transcriptional response and SFN and QTN-induced NQO1-ARE transcriptional response (Fig. 7B, C). Our regulatory model invokes nuclear inactivation of Nrf2, mediated by acetylation as found previously (40). Nrf2 is an established target for reversible acetylation where acetylation is removed by histone deacetylases (46). The deacetylase inhibitor Trichostatin A (TAS) markedly increases acetylation of endothelial cell proteins in the concentration range 100 nM–1 μM (49). Addition of TAS (150 and 300 nM) to HMEC-1 cells inhibited constitutive and SFN-induced ARE-linked transcriptional response (Fig. 7D), consistent with acetylation as a likely cause of inactivation of nucleus trapped Nrf2. These studies indicate that Nrf2 loses its transactivational activity with prolonged dwell time in the nucleus where Nrf2 acetylation and nuclear proteasomal degradation are involved.
Discussion
In this study we have shown that an important much-studied signaling system uses oscillations to control expression of its target genes and, in addition, we propose a significant revision of the signaling mechanism. The current view of regulation of Nrf2 transactivational activity envisages that stimulants stabilize Nrf2 from proteolysis and increased total cellular Nrf2 protein produces equilibrium shift to increased Nrf2 in the nucleus with resulting increased ARE-linked transcription (2). Nuclear expulsion of Nrf2 after double phosphorylation is also viewed as a route for Nrf2 degradation (22) (Fig. 1). Key to the need for revision was the observation that stimulation of HMEC-1 cells with 2 μM SFN achieved 67% maximal transcriptional response without increase in total cellular Nrf2 protein. This suggests that transcriptional activity of Nrf2 is encoded in the time dependence of its subcellular localization rather than total cellular Nrf2 concentration in basal and stimulated states. Also, trapping of Nrf2 in the nucleus by LMB and Fyn kinase inhibition decreased rather than increased transcriptional activity of Nrf2, suggesting that return of Nrf2 to the cytoplasm has a reactivation function. We found that the Nrf2 signaling system is an autonomous oscillator with translocational oscillations occurring whether stimulants such as SFN are present or absent. When stimulated the frequency of the oscillation increases, the amplitude decreases and the target genes are up-regulated. To gain greater understanding of this we developed a mathematical model of regulation of the Nrf2 system and tested its predictions. As a result we propose a revised mechanism for both the signaling dynamics and the transcriptional response of the Nrf2 system (Fig. 5A). The nuclear translocation period of Nrf2 was 129 min in quiescent cells and decreased to 80 min during activation of the ARE transcriptional response. Recent estimate of Nrf2 half-life in human cells by stable isotopic labelling studies is ca. 5 h (31). This suggests that Nrf2 makes two to three cytoplasmic nucleus translocations before degradation in unstimulated cells and more in stimulated cells. Nuclear translocation of Keap1 occurs in some systems (51) and its translocational oscillation would be worthy of future investigation.
We validated the detection of Nrf2 translocational oscillations. We conclude that GFP-Nrf2 faithfully reported the subcellular localization of Nrf2, GFP-Nrf2 transfection produced only a small marginal increase in the cellular Nrf2 pool unlikely to perturb total Nrf2 localization, Nrf2 translocational oscillations are not dependent on incident illumination nor oxygen concentration in HMEC-1 cells and they occur in multiple cell types—including human cells in primary culture. Oscillations of Nrf2 may have been overlooked in previous studies because higher concentrations of SFN and QTN were used. Previous observations of increased total cellular Nrf2 protein (23, 57) have often used cytotoxic concentrations of SFN and QTN, 25 and 40 μM respectively (23, 39, 66). Cytotoxic concentrations of SFN and QTN may impact differently on cytosol-nucleus translocational oscillations of Nrf2 and, indeed, activate the Nrf2 system indirectly as a defence to toxicity.
For regulatory and signaling systems the most common form of feedback that produces oscillation is where the production of a molecular species represses its own production but does it with a delay and in a manner yielding high sensitivity: the switch-off signal lags the switch-on signal, causing repeated overshoots. Our system is different. It belongs to a class of negative feedback systems where translocation of a molecular species M between two compartments from N to C is enhanced in a sensitive fashion by increased levels of M in N at some previous times: the enhanced leave-now signal for M in N lags the arrival of M, causing M to overshoot repeatedly analogous to the mechanism suggested in (19). In our case, increased free Nrf2 in the cytoplasm causes, after a delay, increased Fyn in the nucleus and hence an increased rate of translocation from the nucleus. We show in the Supplementary Data that, if y represents the total amount of Nrf2 in the nucleus, then one can approximate this system by the differential delay equation
The first term describes influx into the nucleus and the second outflux. We describe in the SI how inclusion of the term y(t - τ) induces oscillations for certain values of τ because then the system continually overshoots the state y* where the terms balance. By applying linear stability analysis to this equation, the oscillation period is approximately
The mechanism destabilizing the ternary complex in the basal state likely relates to change in post-translational modifications (PTMs) of Nrf2. Indeed, this is why ternary complex formation is not a simple equilibrium process: the putative form of Nrf2 involved in complex formation (with tyr and ser phosphorylation and lys acetylation) is different from that involved in complex dissociation (with no PTMs or ser phosphorylation as CK2-dependent phosphorylation may destabilize the complex and is constitutively active). It is also likely that modification of Keap1 by Nrf2 activators also influences ternary complex stability (60)—a feature where conventional and oscillatory mechanisms of Nrf2 regulation may concur. Hitherto regulatory control of the Nrf2 has focused on binding and chemical modification of Keap1 by activators but in an Nrf2:Keap1 binary complex. Mutation of C273S, C288S and C155S affecting transcriptional response (69, 72) may do so through effects on ternary complex stability and translocational oscillations. SFN may also affect ternary complex stability through binding and modification of cysteinyl thiol groups of Keap1 (60) but it remains unclear if QTN affects ternary complex stability directly (57). Stimulants such as SFN and QTN may rather act independently of this by up-regulating Fyn activation in the cytoplasm: for SFN through activation of GSK3β (34) and for QTN by suppressing inhibition of Fyn (37, 70). Both these interventions increase Fyn activity, Nrf2 oscillation frequency and refresh-rate. Nuclear export of Nrf2 is nevertheless important to activate the optimum transcriptional response—as evidenced by the effect of crm1 and Fyn inhibition on the Nrf2 transcriptional response.
Nuclear localization of Nrf2 in response to cell stress and nuclear export following phosphorylation by Fyn has been previously observed (21) but these together cannot account for oscillatory Nrf2 shuttling. The crucial new feature that sustains oscillations is linkage of Nrf2 nuclear import and export by the PGAM5-mediated feedback loop which prevents attainment of the equilibrium steady-state with different phosphorylation steps driving Nrf2 relocation.
For oscillatory systems such as the nuclear factor kappa-light-chain-enhancer of activated B cells (NF-κB) signaling system, Stat/Smad/Hes1 and p53, synthesis and degradation of protein components play a key role in the mechanisms generating oscillations. Strong oscillations in the cellular levels of key proteins such as inhibiting factors are observed (30, 42, 71). We found no evidence for oscillation in Nrf2, Keap1 nor NQO1 protein. We conclude Nrf2 translocational oscillations mediate the ARE-linked transcriptional response without oscillation in the cellular content of Nrf2, Keap1 or target gene protein. The oscillatory model, however, predicts increased oscillatory bursts of transcription or suppression of transcription of ARE-linked genes over the period that stimulants remain at pharmacologically competent concentrations in the cell. Translocational oscillations of Nrf2 likely do not lead to detectable oscillations of mRNA and protein of ARE-regulates genes through damping effects of the downstream kinetics of transcription, translation, and mRNA and protein degradation acting as a low-pass filter.
Limitations of this study are lack of in vivo evidence of Nrf2 oscillation although in the primary cell culture studies ex vivo evidence of oscillation is provided. We have not provided a mathematical description of transition between basal and activated states but this may be achieved in future refinements where Nrf2 oscillation frequency as a function of time-dependent receptor-bound stimulant concentration is included. The basis by which subsets of ARE-linked genes are selectively regulated is not explored but Nrf2 translocational oscillation frequency provides a new factor to consider in the mechanism of target gene selection together with Mafs and other members of the Nrf2 interactome (26). The new insight into regulation of Nrf2 explains multiple features unexplained by the conventional mechanism: activation occurs without change in Nrf2 protein concentration, Nrf2 transactivational activity is inhibited by prolonged nuclear residence time (73) and potent activators of Nrf2 may function without directly binding to Nrf2 or Keap1 (54).
Recent research has shown that several key mammalian signaling systems such as ERK, NF-κB, N-FAT/Crz1, Stat/Smad/Hes1 and p53 have dynamic oscillatory or cyclic behavior (5a, 30, 42, 49a, 71) leading to the hypothesis that the temporal profile of the signal is either encoding important information or functioning to enhance the robustness of the response. We show that Nrf2 differs from these in three key ways that throw light on general signaling design principles: (i) for the systems mentioned cycling is induced by stimulation whereas we show that the Nrf2 system is an autonomous oscillator, indicating that oscillatory systems have a role in constitutive and stimulus response control; (ii) except for extracellular-signal-regulated kinase (ERK), regulatory degradation and synthesis of protein components is crucial whereas we show that oscillations of Nrf2 are driven by cyclic PTMs (ERK also does not employ a direct negative feedback loops); and (iii) the Nrf2 system is unique in the way it regulates transcription of target genes. Our mathematical model uses a feedback mechanism with similarities to that used in a minimal mechanism explaining activation of Saccharomyces cerevisiae transcriptional activators Msn2 and Msn4 (19) where a shuttling process receives delayed activation from an upstream signal to induce oscillations.
Materials and Methods
Materials
Antibodies used and other chemicals are given in Supplementary Data S1 section.
Cell culture conditions
Human microvascular HMEC-1 endothelial cells were cultured in MCDB-131 medium with supplements (10% fetal bovine serum, 5 mM
For fluorescence imaging, chemical treatments were added to the dish with the fresh MCDB-131 without phenol red and the images were recorded immediately on a time-lapse fluorescence inverted microscope (Cell^R live cell microscopy system; Olympus, Southend-on-Sea, United Kingdom) equipped with a 37°C, 5% CO2 environmental enclosure (Solent, Segensworth, United Kingdom) and a digital camera iXon2 BV888 EMCCD (Andor, Belfast, United Kingdom). Time-lapse videos were created with CellM & CellR imaging software for life science (Olympus). Cells were imaged through a 40× objective using Olympus HQGFP Filter cube 0.9NA. The exposure time was from 50 to 200 ms with autofocus and recording one frame per 2 min. Methods for assessment of cellular content of Nrf2 during transfection for expression of GFP-Nrf2 and subcellular co-localization of Nrf2 and GFP-Nrf2 and construction and use of the dVenus-NQO1-ARE reporter are described in Supplementary Data S1 section.
The dual luciferase reporter assay
HMEC-1 cells were co-transfected with vectors pGL3-NQO1 and pRL-TK (66). HMEC-1 cells (2×10⁵ cells/well) in 24-well plates were incubated overnight and then transfected with 0.5 μg reporter vector and 10 ng pRL-TK plasmid using Lipofectamine 2000 according to manufacturer's instructions. The empty pGL3-basic vector was used as control. After 24 h, SFN or diluted DMSO vehicle was added and incubated for 0–24 h. The cells were then washed once with phosphate-buffered saline (PBS) and assayed for luciferase activity immediately or kept at −80°C until analysis. Cell culture lysis reagent (Promega, Southampton, United Kingdom), 100 μl, was added to each well and the plate placed on the shaker and gently shaking for 30 min. After shaking, the cell lysate was centrifuged (12,000 g, 5 min, 4°C) and 20 μl supernatant used in the analysis. Luciferase activity was determined using a Dual Luciferase Reporter Assay System (Promega) with luminescence measurements with an Orion Microplate Luminometer (Berthold Detection Systems GmbH, Bleichstrasse, Germany). The relative firefly luciferase activities were normalized to Renilla luciferase activities of the co-transfected pRL-TK vector. Studies also employed a stable transfectant NQO1-ARE luciferase reporter cell line (Supplementary Data).
Video image analysis
Time-course cell images were segmented using in-house software, CellTracker (Systems Biology Centre, University of Warwick, United Kingdom,
Western blotting assessment of Fyn partitioning between the nucleus and cytoplasm
HMEC-1 cells (5×10⁶) were seeded in 10 cm diameter Petri dishes, cultured overnight and SFN (2 μM) or vehicle (0.002% DMSO) added. The cells were incubated a further 0–6 h, then washed twice with ice cold PBS, dislodged with a scrapper in 1 ml PBS and sedimented by centrifugation. Nuclear and cytosolic protein fractions were prepared using CelLytic™ and NuCLEAR™ extraction kits (Sigma, Poole, United Kingdom) and analyzed by Western blotting (see Supplementary Data S1 section).
Nrf2 system and ARE-linked gene expression by digital mRNA profiling
HMEC-1 cells (5×10⁵ cells/well) were seeded on six-well plates in MCDB-131 medium with supplements (see Cell culture conditions section) and cultured overnight at 37°C under 5% CO2/air. Cells were treated with 2 μM SFN or vehicle (0.002% DMSO) and cultured further for up to 72 h. At desired time point, cells were washed twice with ice-cold PBS and total RNA was extracted using RNeasy Mini Kit (Qiagen, Crawley, United Kingdom). Total RNA (600–800 ng) was analyzed for mRNA copy number of target genes by the NanoString nCounter Gene Expression method (12) (outsourced to Nanostring, Seattle, WA). A custom codeset of genes including three reference genes (β-actin, clathrin heavy chain and β-glucuronidase) was designed.
Statistical analysis
Data are mean±SD for parametric data and median (upper–lower quartile) for nonparametric data. Significance testing of mean and median changes was assessed by Student's t-test and Mann–Whitney U test, respectively. Spearman correlation analysis was performed of nonparametric data. Other tests are described where implemented.
Footnotes
Acknowledgments
The authors thank the Biosciences and Biotechnology Research Council (BBSRC), United Kingdom for research funding—Diet and Health Research Industry Club (DRINC) project grant No. 07/84, and the European Union Framework Programme-7 for support for the BIOCLAIMS research programme, grant agreement No. 244995 and grant K/ZDS/002442. D.A.R. held an EPSRC Senior Fellowship (GR/S29256/01). We thank Drs. Andrew Blanks (Warwick Medical School, University of Warwick) and Chengjin Du (Systems Biology Centre, University of Warwick) for expert assistance with time-lapse video microscopy and semi-automated image analysis.
Author Disclosure Statement
No competing financial interests exist.
Abbreviations Used
References
Supplementary Material
Please find the following supplemental material available below.
For Open Access articles published under a Creative Commons License, all supplemental material carries the same license as the article it is associated with.
For non-Open Access articles published, all supplemental material carries a non-exclusive license, and permission requests for re-use of supplemental material or any part of supplemental material shall be sent directly to the copyright owner as specified in the copyright notice associated with the article.