
Abstract
Introduction
D
Investigations regarding the role of reactive oxygen species (ROS) in PHD2 stabilization and thus hypoxia-inducible factor-1α (Hif-1α) signaling in tumor development have yielded controversial results. Taking advantage of well-defined knockout tumor models, evidence is provided that the chronic leakage of mitochondrial ROS triggers PHD2 stabilization in a JNK-dependent manner that, ultimately, leads to impaired tumor angiogenesis and tumor growth. This study highlights the relevance of mitochondrial thioredoxin reductase as a yet-unrecognized critical player in tumor development.
In mammalian cells, the major intracellular sites for ROS production are the mitochondria, in which leakage of electrons generates superoxide that is readily dismutated by superoxide dismutase to hydrogen peroxide (H2O2). To maintain ROS at nonpathological levels, cells are equipped with highly efficient antioxidant redox networks. With regard to mitochondrial redox homeostasis, the peroxiredoxin III (Prx III)/mitochondrial thioredoxin (Txn2)/mitochondrial thioredoxin reductase (Txnrd2) axis is considered the most important H2O2-scavenging system (14, 45), as corroborated by reverse genetics in mice: Mice lacking Prx III are viable but show increased sensitivity to ROS-generating toxins (29); genetic deletion of either Txn2 or Txnrd2 causes embryonic lethal phenotypes during mid-gestation and fetal development, respectively (10, 36).
Hypoxia is another classical hallmark of tumor growth and metastasis (21). The individual components of hypoxic signaling downstream of restricted oxygen and nutrient supply are well established and comprise the inactivation of Hypoxia-inducible factor prolyl hydroxylase (PHD) and subsequent stabilization of Hypoxia-inducible factor-1α (Hif-1α), culminating in increased transcription of Hif-1α target genes (41). Via these target genes, Hif-1α is involved in a myriad of cellular processes, including typical features favoring tumor growth such as angiogenesis or cell proliferation (44, 53). Interestingly, Hif-1α can also be stabilized under nonhypoxic conditions in response to various hormones (19), growth factors, and cytokines (23), and many of these stimuli induce ROS production as a part of their signaling cascade. Although the role of hypoxia in tumor growth is well established, conclusive data on the contribution of cellular ROS to hypoxic signaling are scarce and even conflicting. Previously, H2O2 was viewed as an inevitable and toxic by-product of aerobic life due to its potentially deleterious side effects. A number of studies, however, suggest that H2O2 plays an important role in cell signaling by regulating a diverse set of physiological processes (12). Previous reports demonstrated that Hif-1α stabilization and activation of its target genes can also be induced by exogenous H2O2 or other oxidative stressors (4, 8, 15, 34). Furthermore, mitochondrial ROS production has also been shown to stabilize Hif-1α (5, 20, 34), and Hif-1α DNA-binding activity appears to be sensitive to oxidizing reagents (51). On the other hand, short pre-exposure of cells to H2O2 selectively prevents hypoxia-induced Hif-1α binding by preventing the accumulation of Hif-1α protein, whereas treatment of hypoxic cell extracts with H2O2 has no effect on Hif-1α binding (24). It appears that ROS can interfere with the Hif-1α pathway at the level of PHDs by oxidizing the essential co-factor ferrous iron [Fe(II)] to the inactive ferric form [Fe(III)] (17, 38). However, to date, the precise link between ROS and hypoxic signaling has remained elusive.
To address whether the PrxIII/Txn2/Txnrd2 axis contributes to tumor growth/viability by maintaining redox homeostasis and controlling hypoxic signaling, we generated transformed cells with a targeted deficiency in the mitochondrial ROS-regulating enzyme Txnrd2.
In our experiments, we could show that loss of Txnrd2 in tumor cells results in a modified cellular redox balance. This imbalance leads to a sustained upregulation of PHD2 and failure to stabilize Hif-1α even in response to appropriate stimuli, ultimately culminating in the inhibition of tumor vascularization and growth. We additionally identified c-Jun NH2-terminal Kinase (JNK) as a hitherto unknown participant in ROS-mediated hypoxic signaling.
Results
Transformation and characterization of Txnrd2-deficient mouse embryonic fibroblasts
The gene targeting strategy for the disruption of Txnrd2 is depicted in Figure 1A (10). First, mouse embryonic fibroblasts (MEFs) were isolated from E12.5 embryos. Genotyping and immunoblotting was performed to confirm the deletion of Txnrd2 (Fig. 1B). To maintain H2O2 emission from the mitochondria at cell-tolerable levels, Txnrd2−/− MEFs responded with a strong compensatory upregulation of the mitochondria-located oxidoreductase glutaredoxin-2 (grx2) (n=5, Fig. 1C). However, despite this compensatory response, Txnrd2−/− cells still displayed higher ROS levels than wild-type (WT) cells (mean fluorescence intensity: 8.6±2.1 in Txnrd2+/+ vs. 25.2±7.6 in Txnrd2−/− cells, n=10, Fig. 1D).
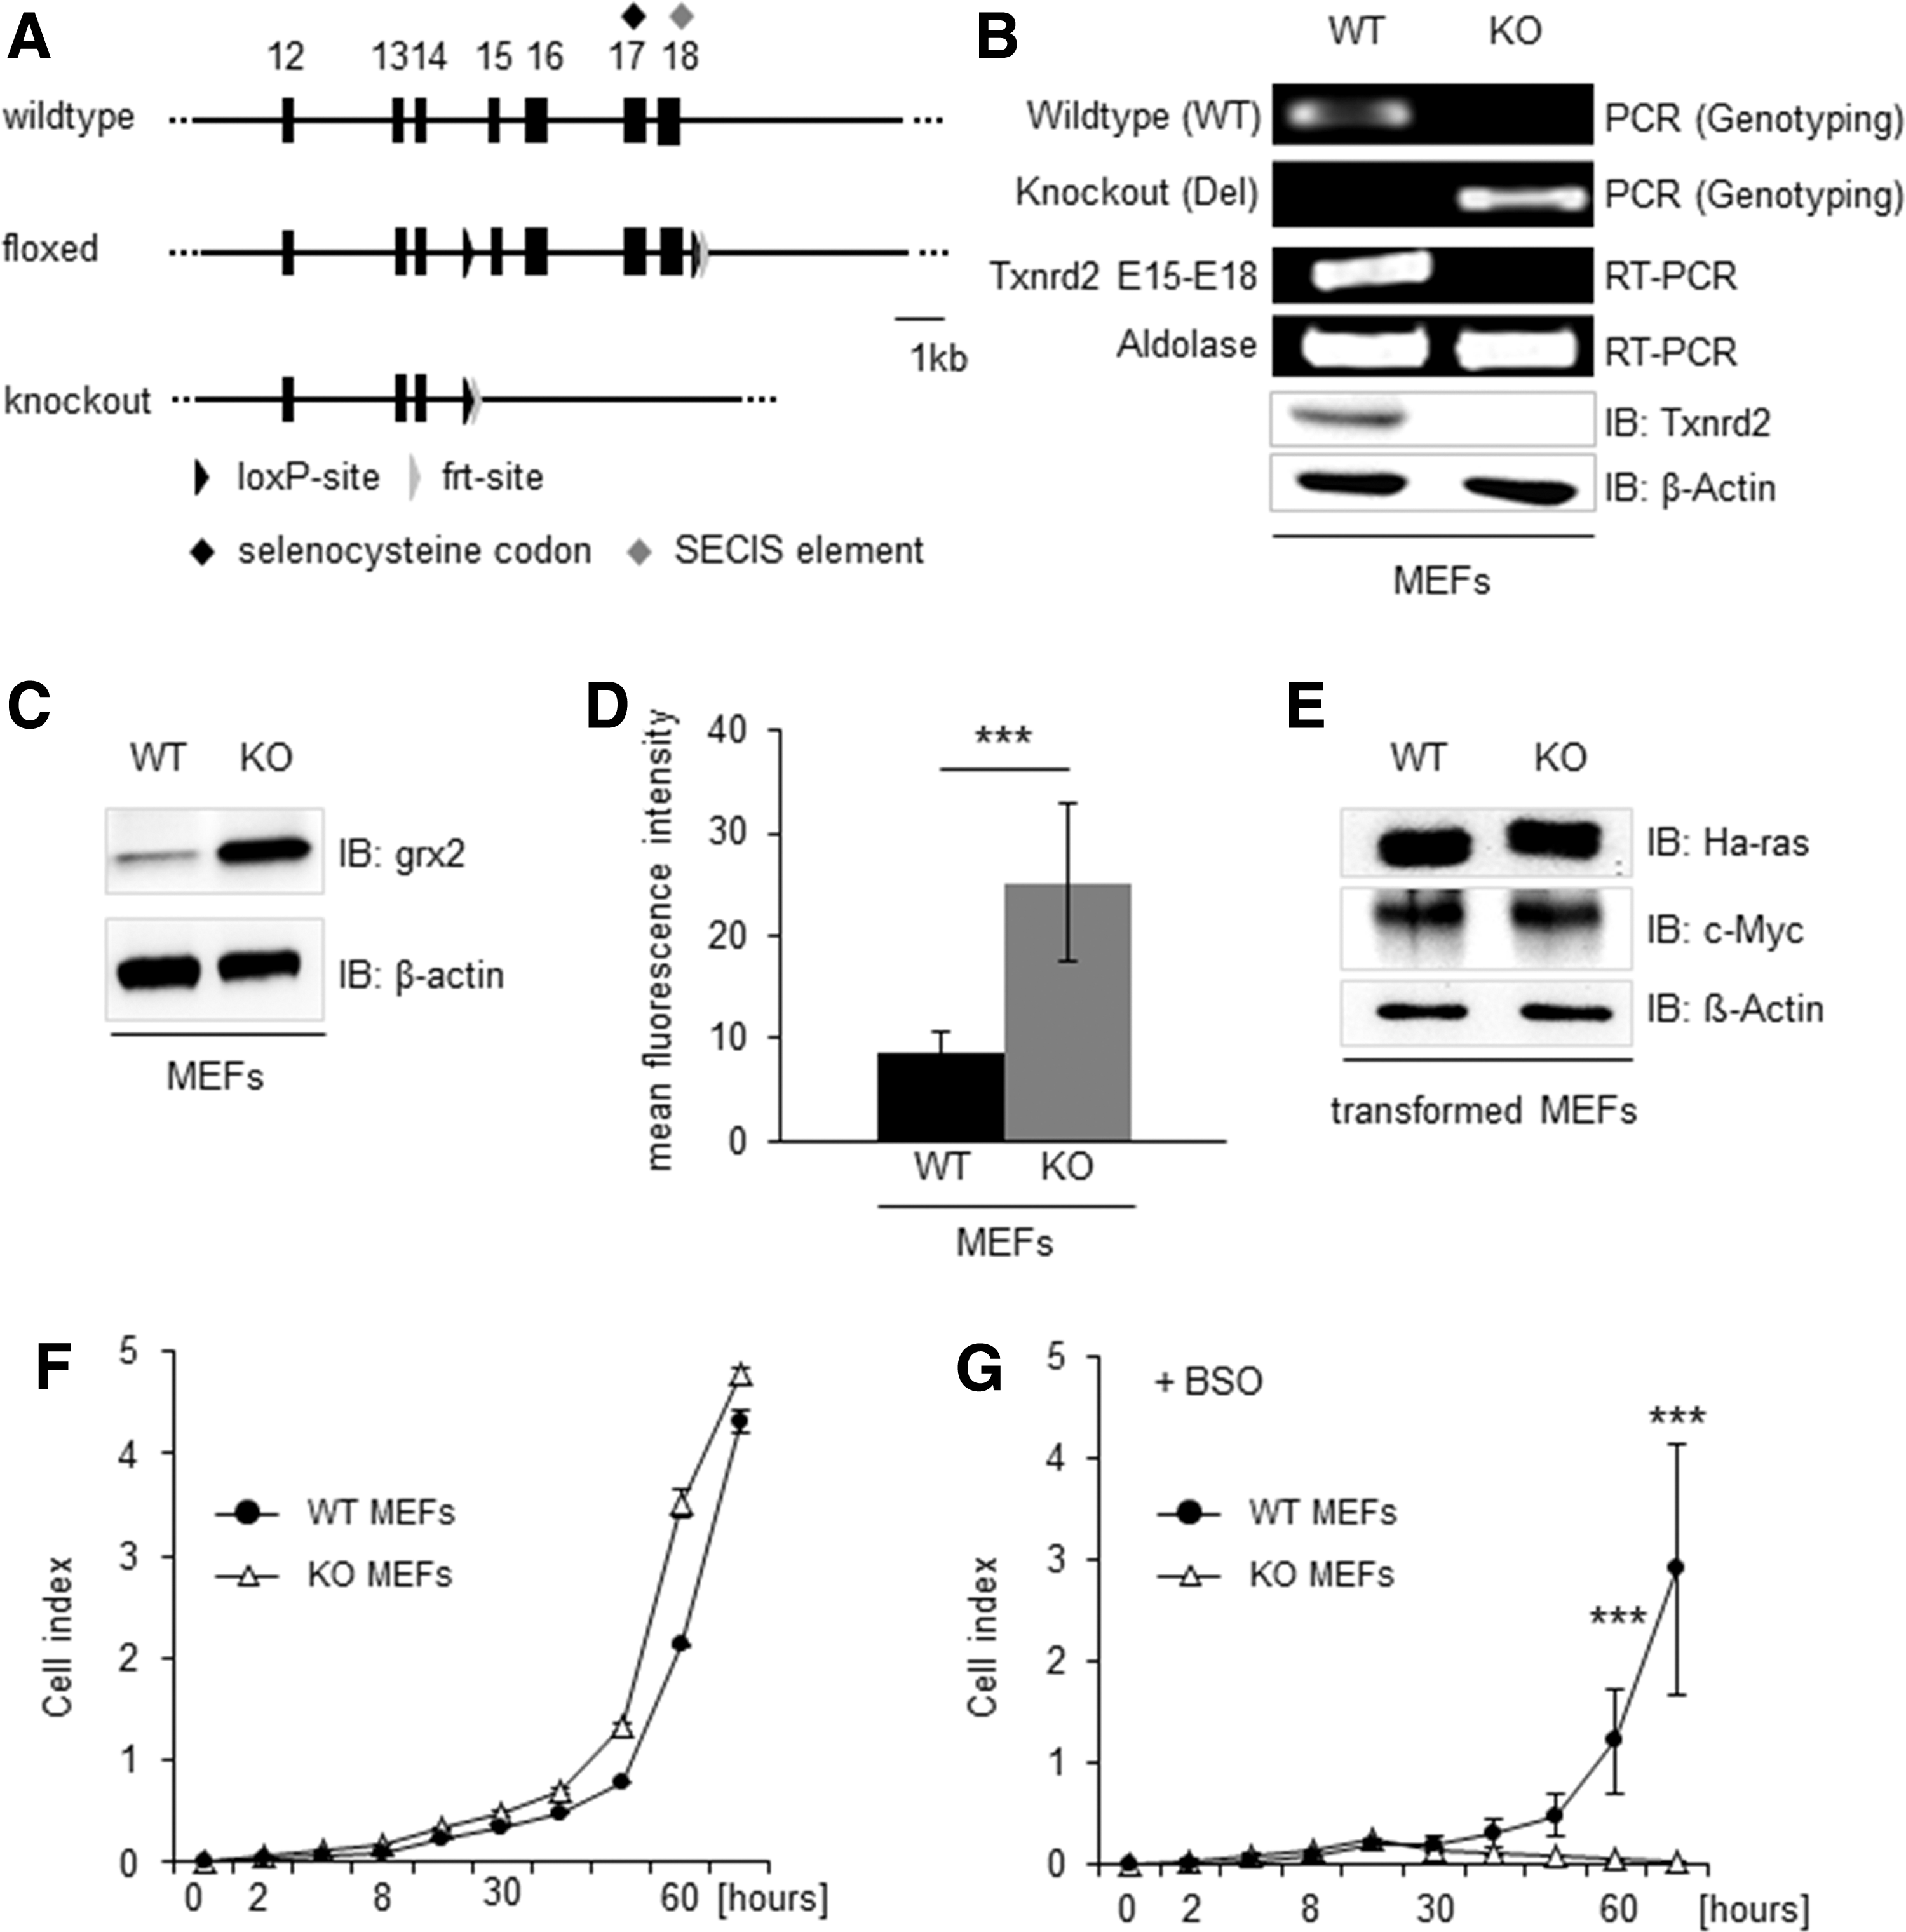
Immortalized MEFs were transformed by lentiviral transduction of the proto-oncogene c-Myc and the oncogene Ha-rasV12 and plated in soft agar (28). We established transformed cell lines from individually picked clones. This was deemed necessary as a basis for the in vivo tumor cell implantation studies. Equal expression of c-Myc and Ha-rasV12 was confirmed by immunoblotting (Fig. 1E). Transformation of cells did not have any impact on cellular ROS levels (mean fluorescence intensity: 9.9±1.6 in Txnrd2+/+ vs. 20.7±4.9 in Txnrd2−/− , n=10, data not shown). However, we observed an alignment of in vitro proliferation of the transformed WT and knockout (KO) clones under baseline cell culture conditions (n=6, Fig. 1F).
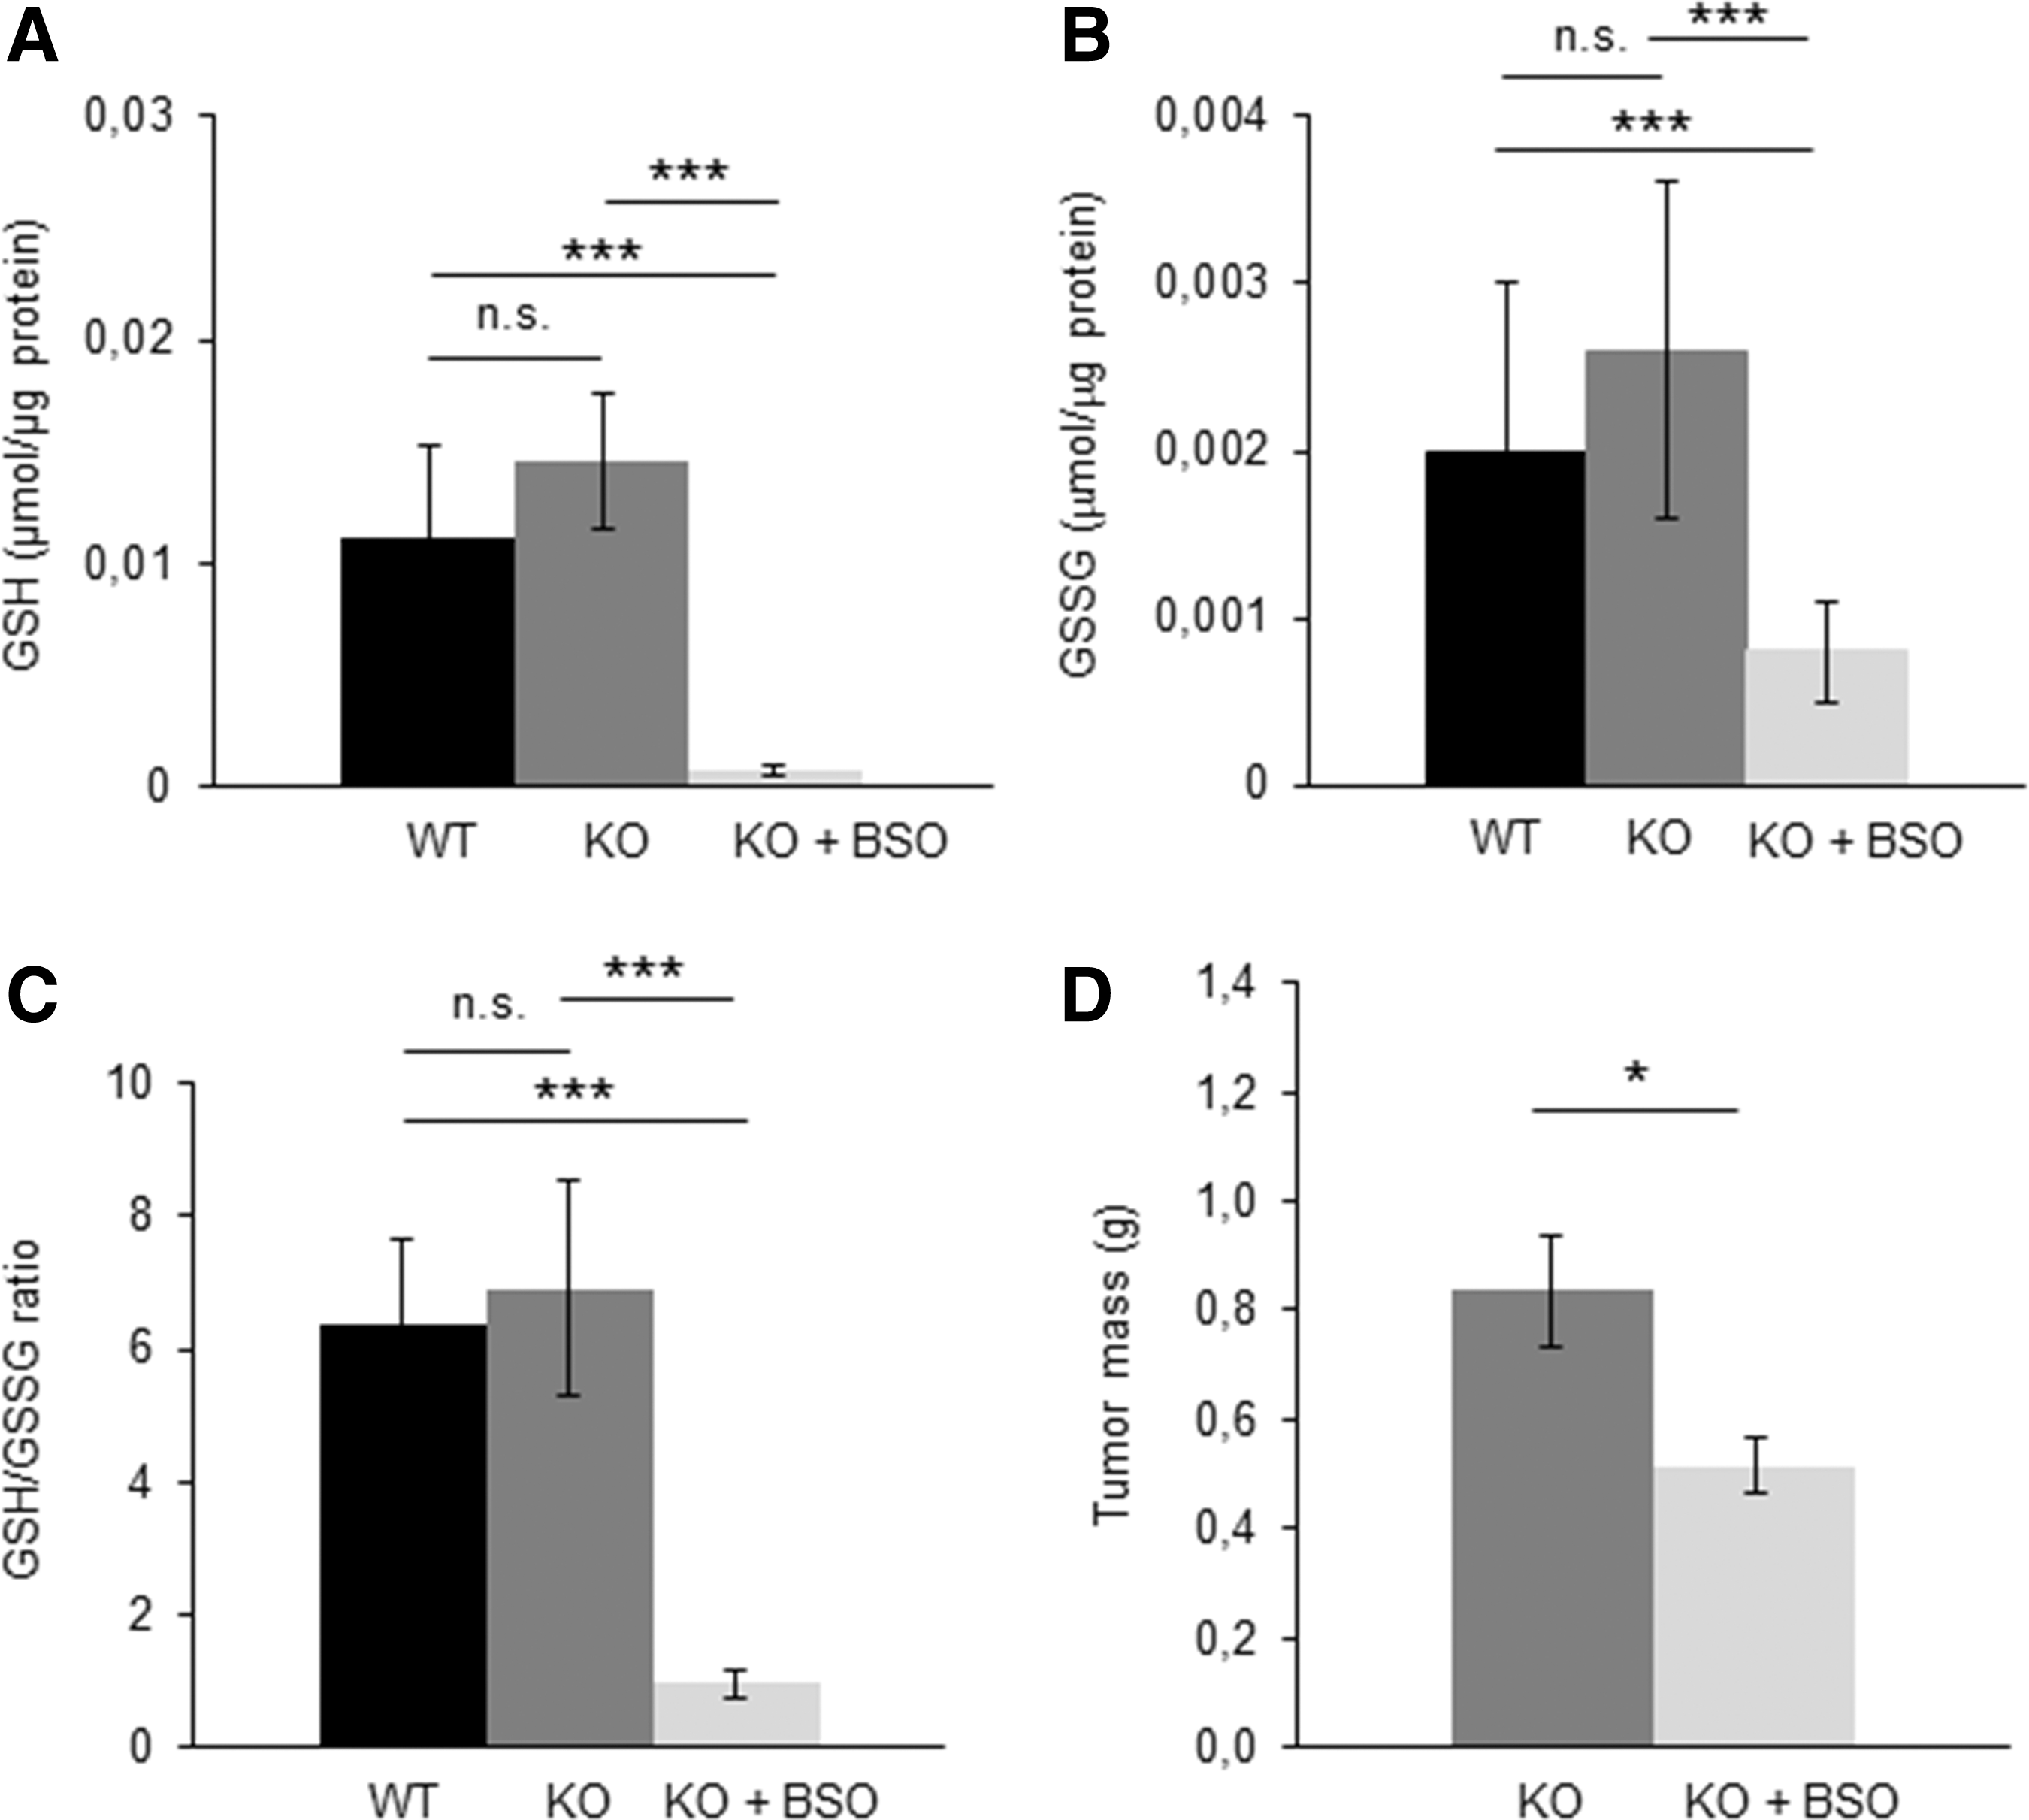
Since the Prx III-dependent release of H2O2 from the mitochondria is not only under the control of the Trx2-Txnrd2 node but can also be altered by grx2 in a glutathione (GSH)-dependent manner (22), we tested how Txnrd2-deficient cells would react to an additional loss of GSH. Indeed, when Txnrd2 −/− cells were treated with L-buthionine sulfoximine (BSO), a highly specific and irreversible inhibitor of the GSH-synthesizing enzyme γ-glutamylcysteine synthetase, cell survival and proliferation were considerably impaired (n=6, Fig. 1G).
Targeted loss of Txnrd2 substantially impairs tumor growth in vivo
Having been characterized, transformed cells were subcutaneously implanted into the retral flank of C57BL/6 mice. Although single cell-derived transformed fibroblasts showed no difference in proliferation rates in vitro (n=6, Fig. 1F), the tumor mass of tumors formed by Txnrd2-deficient cells was substantially reduced by ∼50% (mean 0.8±0.16 g, median 0.6 g) after 11 days in contrast to tumors from Txnrd2-expressing cells (mean 1.7±0.34 g, median 1.57 g, n=25, Fig. 2A). Analysis of tumor growth at different time points indicated that the difference in the tumor mass was most pronounced on day 11 (day 2, n=3; day 3, n=9; day 4, n=3; day 6, n=9, day 8, n=3; day 11, n=25, Fig. 2B).
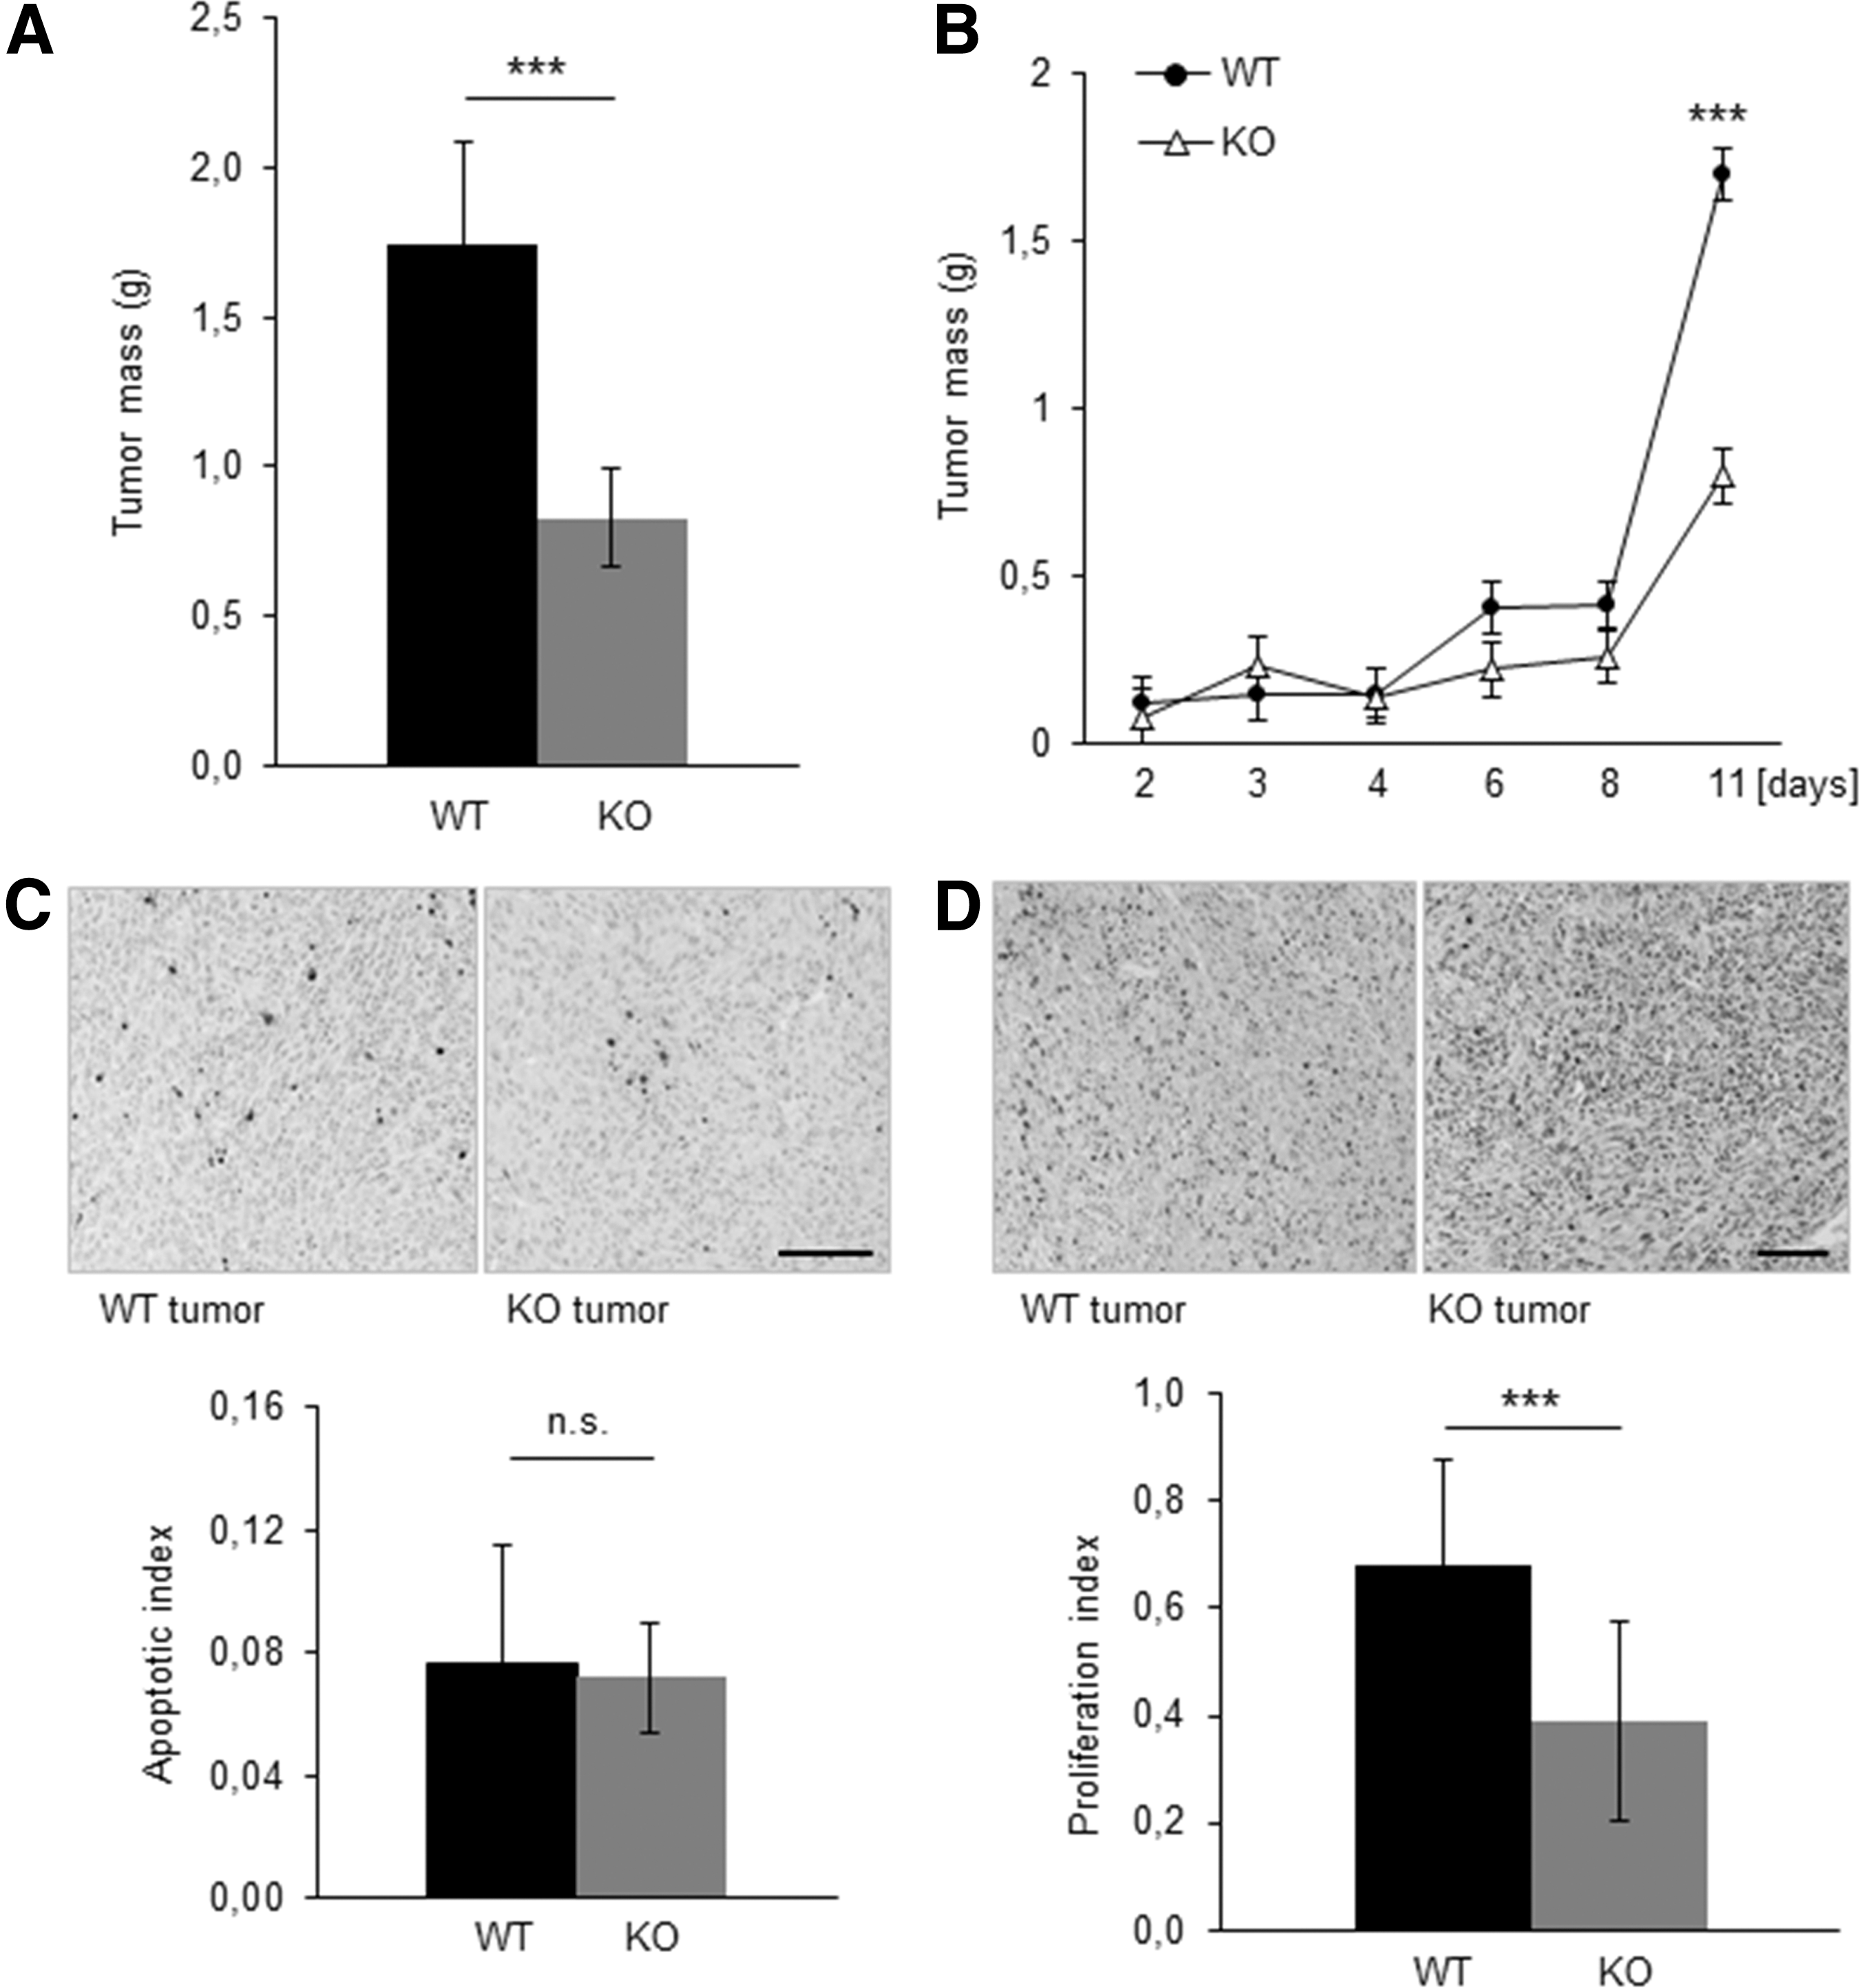
Histological analysis was performed to elucidate the underlying reasons for the attenuated tumor growth. Quantification of cells positive for cleaved caspase-3, an apoptosis marker, revealed no difference (Txnrd2+/+ 0.08±0.1 vs. Txnrd2−/− 0.07±0.05 positive cells per region of interest, [Fig. 2C]). The assessment of necrotic areas within the tumors (n=6) also revealed that the smaller tumor volume was not a result of necrotic cell loss (percentage of the necrotic area relative to the entire tumor area: Txnrd2 +/+ tumors: 20%±6.5% vs. Txnrd2 −/− tumors: 14.5%±7.2%, data not shown). However, Txnrd2-deficient tumors immunostained for the proliferation marker Ki-67 showed a significantly lower ratio of proliferating to nonproliferating cells (proliferation index [PI]) than WT tumors (0.39±0.19 vs. 0.68±0.14, n=6 tumors per group, Fig. 2D).
Txnrd2−/− tumors are highly susceptible to pharmacologic GSH deprivation
In our initial in vitro experiments, we could show that depletion of GSH by BSO resulted in the death of Txnrd2-deficient cells (Fig. 1G). Since both Txnrd2 and grx2 contribute to the reduction of Prx III (22), thereby controlling H2O2 emission from the mitochondria, we assessed whether inhibition of the de novo GSH synthesis may represent a pharmacological rationale to further reduce the growth of Txnrd2-deficient tumors in vivo. First, we confirmed that Txnrd2-deficient tumors also expressed significantly higher levels of grx2 than WT tumors (n=3 tumors per group, Supplementary Fig. 1A; Supplementary Data are available online at
Loss of Txnrd2 delays the angiogenic switch and impairs tumor angiogenesis
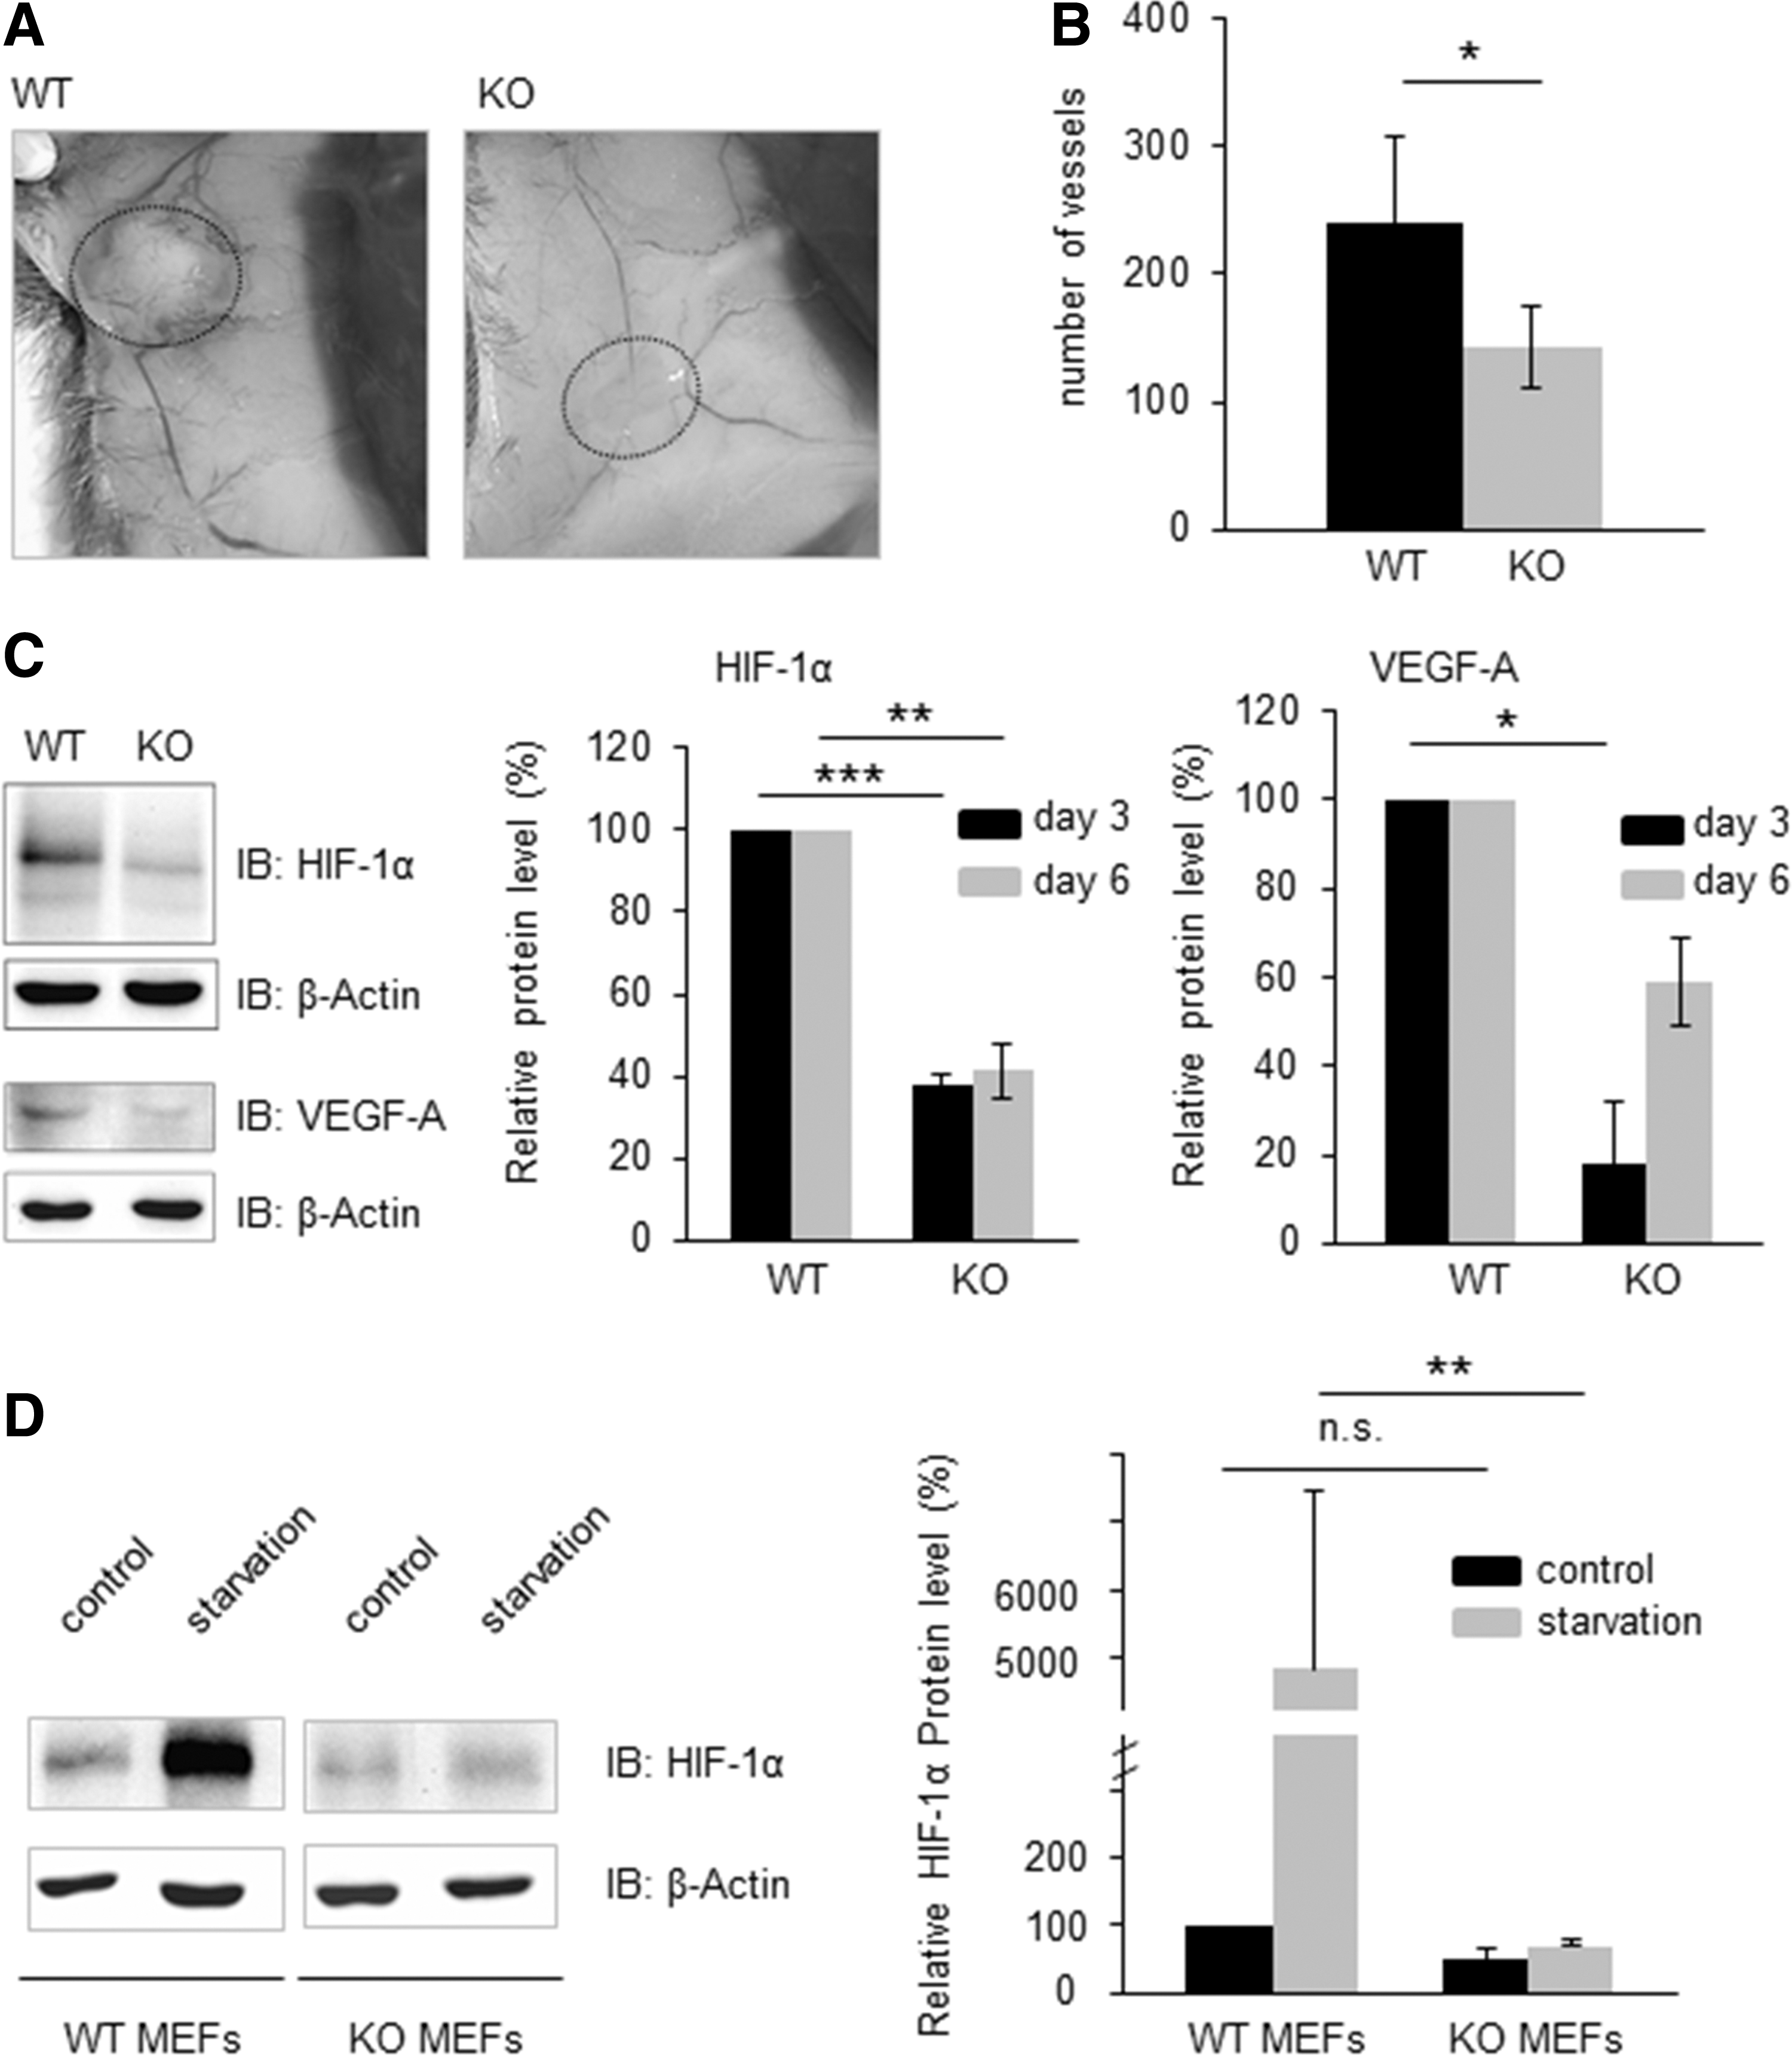
The tumor-surrounding vascular network of Txnrd2-deficient tumors was less prominent compared with WT tumors (Fig. 4A). In line, quantification of tumor vessels demonstrated significantly fewer vessels per Txnrd2-deficient tumor (143±13.9) compared with WT tumors (239±30.43, n=6, Fig. 4B).
Reduced expression of key angiogenic players in tumors derived from Txnrd2−/− cells
The delayed angiogenic switch and the diminished vascularization could be attributed to a substantial reduction of Hif-1α protein levels in Txnrd2-deficient tumors (day 3: 38%±2%; day 6: 41%±7%) compared with tumors expressing Txnrd2 (day 3, day 6: arbitrarily set to 100%) at both time points (n=4 per time point, Fig. 4C). In accordance, vascular endothelial growth factor A (VEGF-A) levels were also significantly reduced at day 3 (18%±2%) in these tumors compared with Txnrd2 WT tumors (arbitrarily set to 100%, Fig. 4C). This phenotype was still present on day 6 of tumor growth (Txnrd2+/+ : arbitrarily set to 100% vs. Txnrd2−/− : 59%±2%). An ELISA specific for mouse VEGF confirmed that Txnrd2-deficient tumors contained less VEGF-A (n=4 per time point, day 3: 0.19±0.06 pg/μg protein; day 6: 0.09±0.05 pg/μg protein) than WT tumors (day 3: 0.48±0.24 pg/μg protein day 6: 0.12±0.05 pg/μg protein) (data not shown).
Hif-1α stabilization in response to serum withdrawal and hypoxia is impaired
Under normal cell culture conditions, Hif-1α expression was barely detectable in either cell line (Txnrd2+/+ : arbitrarily set to 100% vs. Txnrd2−/− : 50%±16.7%, n=6, Fig. 4D). However, Hif-1α expression substantially increased in WT cells but not in Txnrd2-deficient cells after serum withdrawal (Txnrd2+/+ : 4830%±2640% vs. Txnrd2−/− : 70%±17.3%) (n=6, Fig. 4D). A similar effect was also observed under hypoxic conditions (n=4, Supplementary Fig. S1C).
To investigate whether Hif-1α is regulated at the transcriptional and/or the translational level, Hif-1α mRNA expression levels were assessed by quantitative real-time-polymerase chain reaction (qRT-PCR). Under normal cell culture conditions, Hif-1α mRNA levels were comparable (Txnrd2+/+ : arbitrarily set to 100% vs. Txnrd2−/− : 110%±26%, n=5, data not shown). Starvation resulted in a moderate increase in WT cells, whereas Txnrd2-deficient cells failed to upregulate Hif-1α mRNA levels (Txnrd2+/+ : 190%±78% vs. Txnrd2−/− : 90%±35%). These data indicate that stabilization of the majority of Hif-1α occurs at the protein level since the small change of Hif-1α transcripts was unlikely to account for the increased levels of Hif-1α protein in WT cells.
Increased PHD2 expression promotes Hif-1α protein degradation in Txnrd2−/− cells and tumors
Next, we examined some upstream regulators of Hif-1α protein stability, including HIF prolyl hydroxylases. Interestingly, even under baseline conditions, PHD2 protein levels were elevated in Txnrd2−/− cells compared with control cells (Txnrd2+/+ : arbitrarily set to 100% vs. Txnrd2−/− : 322.2%±99.8%, n=4, Fig. 5A). Vice versa, knockdown of PHD2 using siRNA increased Hif-1α protein levels in both WT and Txnrd2-deficient MEFs, thereby substantiating that PHD2 is the main regulator of Hif-1α protein stability (n=3, Supplementary Fig. S1D).
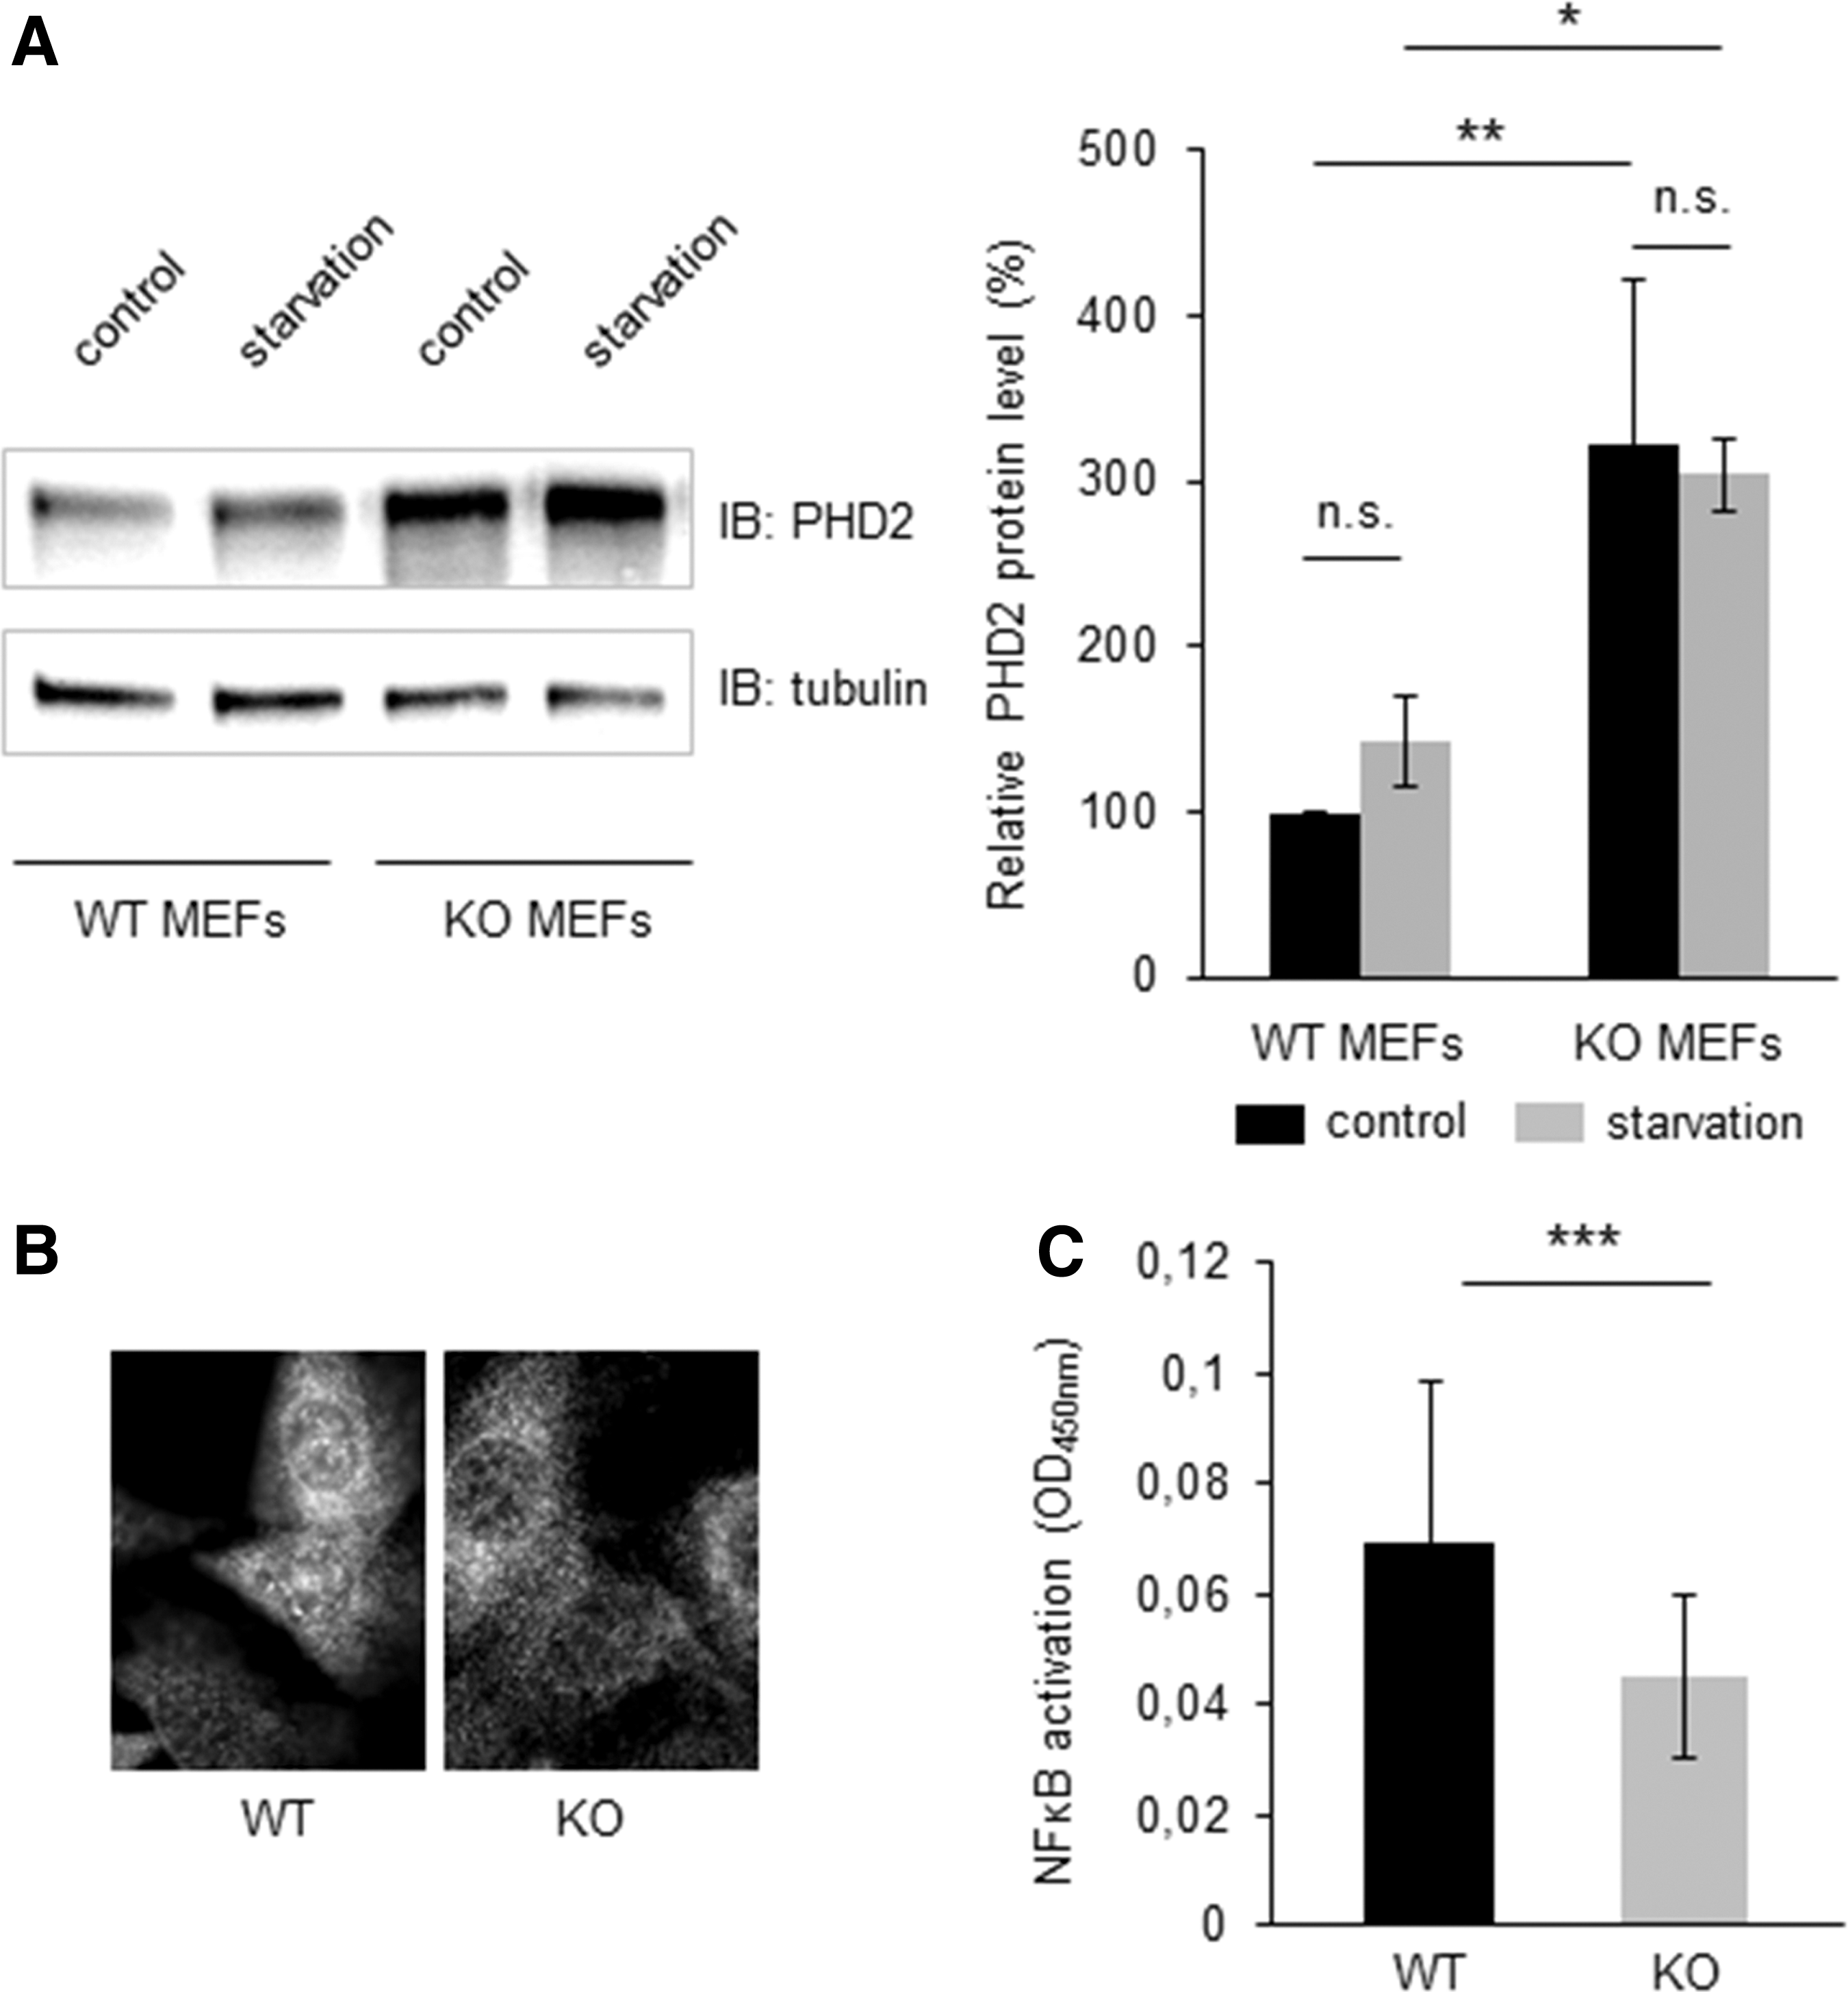
Serum starvation had no additional impact on PHD2 protein expression in either of the cell lines (n=4, Fig. 5A). Consistent with these in vitro findings, Txnrd2 null tumors also displayed augmented PHD2 expression (n=3, Supplementary Fig. S1B).
To examine whether the mRNA levels were also increased, we performed qRT-PCR. Indeed, Txnrd2−/− cells showed statistically significant enhanced levels of PHD2 mRNA (n=11, WT arbitrarily set to 100% vs. KO 242%±55%, data not shown).
Apart from affecting Hif-1α stabilization, PHD2 is also a well-known regulator of nuclear factor-κB (NF-κB) activity (11). Indeed, immunocytochemistry revealed reduced nuclear translocation of the p65 NF-κB subunit in Txnrd2 null cells (Fig. 5B). Quantification of nuclear translocation of p65 confirmed this observation (n=6, Fig. 5C).
Enhanced JNK phosphorylation leads to increased PHD2 protein levels
Intrigued by the findings that Txnrd2 deletion impairs tumor growth via an increase in PHD2 expression, we endeavored to unmask a previously unknown link between Txnrd2 and PHD2. Since JNK is known to be regulated by the cellular redox status (27), we investigated its phosphorylation status. Indeed, JNK phosphorylation was increased in immortalized Txnrd2−/− cells in contrast to their WT counterparts (n=5, Fig. 6A) and this effect could be attributed to elevated ROS as the phosphorylation status could be reduced by addition of polyethylene glycol-conjugated catalase (PEG-catalase) (n=4, Fig. 6B). Substantiating our hypothesis that ROS-induced, sustained JNK activation leads to elevated PHD2 expression, PEG-catalase treatment also blunted PHD2 expression (n=4, Fig. 6B). To provide a molecular link between mitochondrial ROS and increased JNK-phosphorylation, we measured PTP activity. ROS have been implicated in this pathway through inhibition of the counteracting JNK phosphatases (27), and measurements of protein tyrosine phosphatase (PTP) activity, indeed, demonstrated a reduced activity in the Txnrd2-deficient cells (n=7, Fig. 6F).
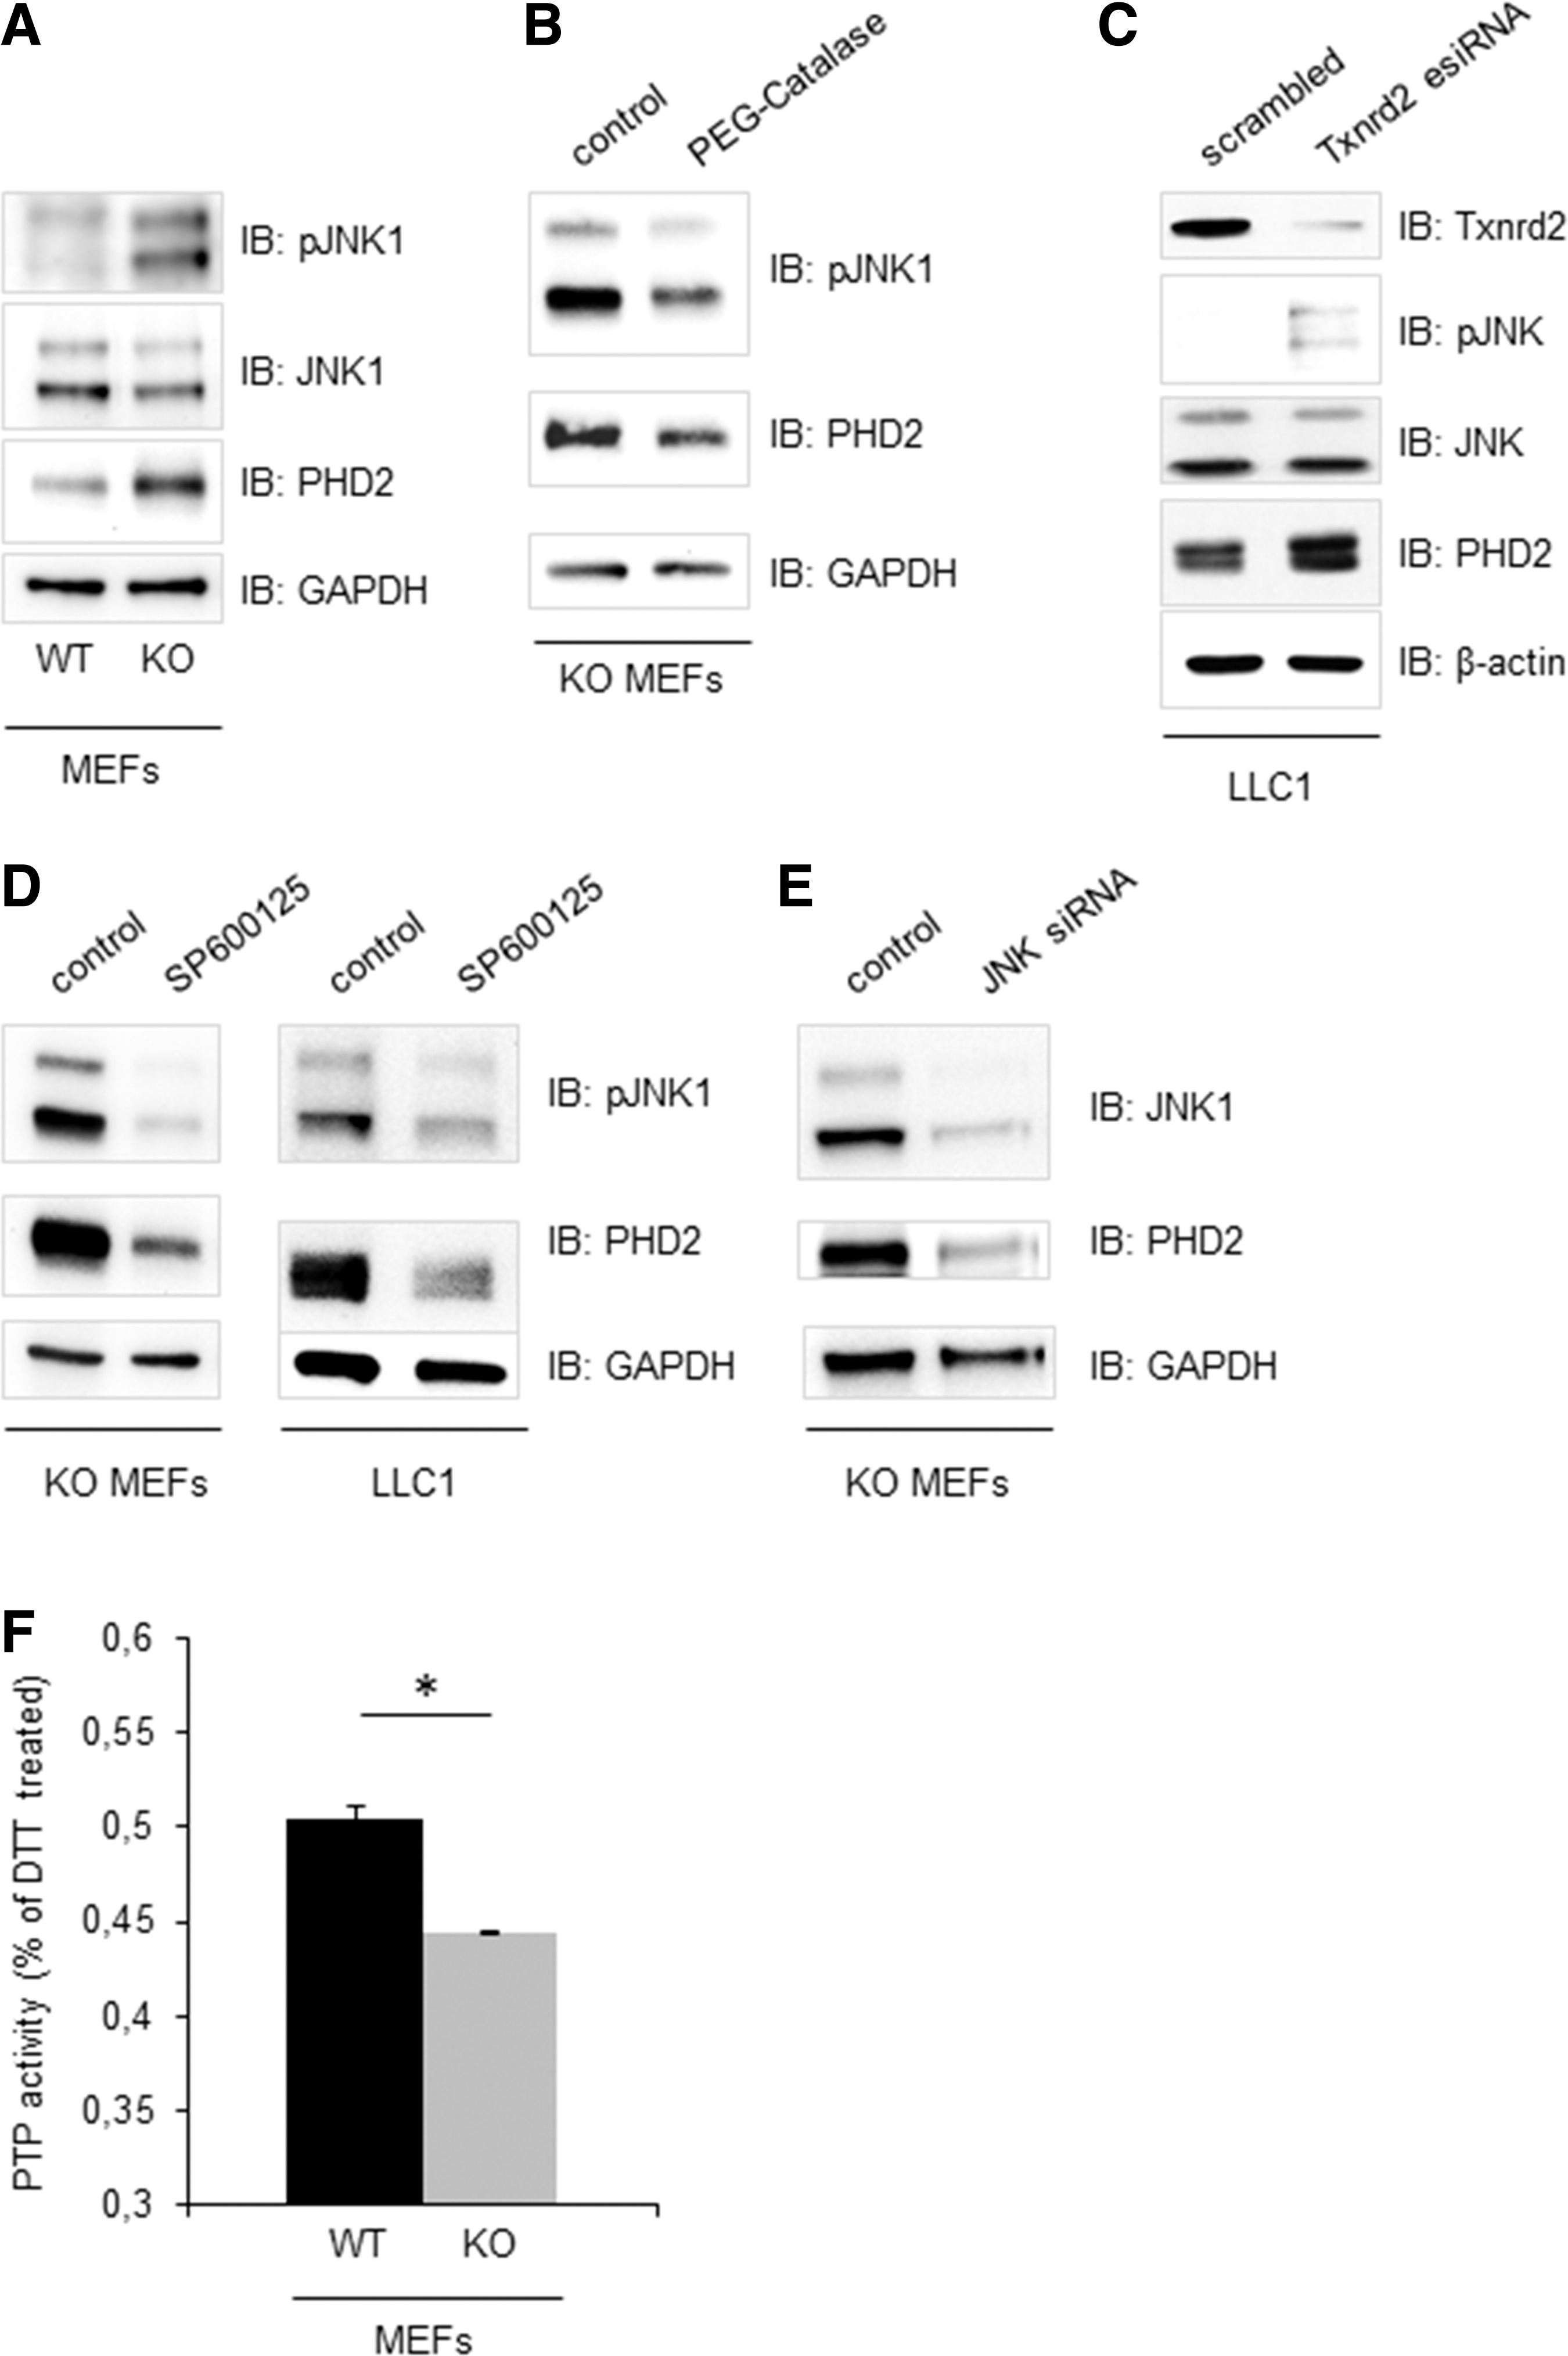
To investigate whether the Txnrd2-dependent PHD2 regulation was a general mechanism and not a cell type-specific effect, we manipulated Txnrd2 expression levels in the murine lung tumor cell line LLC1. Using endoribonuclease-prepared small interfering RNA (esiRNA), we were able to decrease Txnrd2 protein levels by ∼90% compared with scrambled esiRNA-treated cells (n=4, Fig. 6C). This knockdown led to a subsequent increase in pJNK and PHD2 levels in Txnrd2-deficient LLC1 cells. Furthermore, treating Txnrd2 KO MEFs and LLC1 cells with the JNK inhibitor SP600125 caused both a decrease of basal pJNK levels and a strong decrease in PHD2 expression, which is in accordance with the proposed mechanism (n=5, Fig. 6D). These data demonstrate that this Txnrd2-pJNK-PHD2 axis is also a relevant pathway for bona fide tumor cells. Finally, knockdown of JNK by siRNA significantly attenuated PHD2 expression (control siRNA arbitrarily set to 100%, siRNA: JNK 22.6%±3.7%, PHD2 53.2%±6.3%, n=13, exemplarily shown in Fig. 6E), further substantiating our findings that JNK acts as an upstream participant in this pathway.
Expression of Txnrd2 in human cancer tissue
To demonstrate that our findings are also of relevance for human tumors, the expression of Txnrd2 was studied by immunohistochemistry in human cancer tissue derived from three different types of tumors: colon carcinoma (n=10), hepatocellular carcinoma (n=8), as well as lung adenocarcinoma (n=8). In colon carcinomas as well as in hepatocellular carcinomas, we could observe an abundant expression of Txnrd2. Lung adenocarcinomas also expressed Txnrd2, however to a much lesser extent than in the colon and liver samples (Supplementary Fig. S2). These observations are in line with previously published reports (9, 49) as well as with the human protein atlas (48).
Discussion
Elevated levels of ROS have been detected in almost all cancers, where they promote many aspects of tumor development and progression, including DNA damage, activation of inflammatory pathways, receptor tyrosine kinase signaling, and stabilization of Hif-1α (30). On the other hand, several oncogenes were recently discovered to act as active inducers of NF-E2-related factor-2 (Nrf2), which, in turn, promotes an ROS detoxification program required for tumor initiation (13). Moreover, most tumor cells also express increased levels of antioxidants to detoxify ROS, suggesting that a delicately balanced elevation of intracellular ROS levels is required for cancer cell function (30, 40).
Since the PrxIII-Trx2-Txnrd2 node is considered the most important route for mitochondrial H2O2 removal (14, 45) and we observed an abundant expression of Txnrd2 in a variety of human tumors (Supplementary Fig. S2), we employed genetically engineered Txnrd2-deficient cells to study the effects of an altered mitochondrial redox balance on tumor signaling and growth. Indeed, our model enabled us to unveil how a chronic change of this balance affects Hif signaling and tumor growth via a previously unknown pathway. The cornerstones of this pathway encompass a ROS-dependent activation of JNK after the loss of Txnrd2, elevated PHD2 protein and mRNA expression, a failure to stabilize Hif-1α in response to hypoxia and other stressors, and decreased VEGF-A levels. In vivo we could observe a delayed angiogenic switch, attenuated tumor vascularization, and, ultimately, reduced growth of tumors lacking Txnrd2.
Unexpectedly and in contrast to previous results (5, 8, 17), loss of Txnrd2 followed by a compensatory increase in grx2 expression, as well as moderately increased ROS levels, did not stabilize Hif-1α. Numerous studies have demonstrated that addition of exogenous ROS leads to the stabilization of Hif-1α protein and activation of Hif target genes such as VEGF-A (4, 8, 15). In accordance, tumor cell-derived ROS can regulate angiogenesis and tumor growth through VEGF (52) and exposure to antioxidants has been demonstrated to delay tumorigenesis by reducing HIF levels (16). Given the previous reports, we expected that the Txnrd2 deletion and coincident further elevation of ROS levels would lead to a stabilization of the Hif-1α protein through PHD2 inactivation; for instance, by oxidizing PHD-bound Fe(II) to Fe(III) (17, 38), and/or the cysteine residue 201 within the catalytic domain of PHD2, thereby further inhibiting PHD2 activity (35, 37). In this study, we observed quite the contrary: Hif-1α protein levels were reduced not only in Txnrd2−/− tumors but also in Txnrd2−/− MEFs, particularly following certain stressors such as hypoxia or serum starvation. The diminished Hif-1α levels could be attributed to high PHD2 expression, which leads to hydroxylation of key proline residues of Hif-1α and subsequent targeting of Hif-1α to the proteasome (25, 26). Considering the existing reports in the literature, these findings indicate that, apparently, PHD2 is differentially regulated upon a ROS challenge. In contrast to an acute and possibly nonphysiological, exogenous bolus administration of ROS that inhibits PHD2 activity, a compensatory expression of the mitochondria-located oxidoreductase grx2 is induced in Txnrd2-deficient cells, thereby keeping the emission of ROS from the mitochondria in a cell-tolerable, however moderately elevated range. This continuous and modest elevation of endogenous ROS in Txnrd2-deficient cells appears to result in an adaptive upregulation of PHD2 protein levels, possibly as a protective measure against chronically increased Hif-1α expression. A similar adaptive mechanism has also been observed during chronic hypoxia. Acute hypoxia impairs PHD2 activity, whereas chronic hypoxia inhibits mitochondrial respiration, thus restoring oxygen availability and leading to PHD2 over-activation (18).
In pursuit of a molecular link between mitochondrial ROS and increased PHD2 expression, we investigated the redox-sensitive JNK signaling pathway. ROS-induced JNK phosphorylation via Mitogen-activated protein kinase kinase 4 (MKK4) can be initiated by the liberation of the apoptosis signal-regulating kinase 1 (ASK-1) from its endogenous suppressor, reduced thioredoxin 1 (42). Furthermore, ROS have been implicated in this pathway through inhibition of JNK phosphatases (27) and we could indeed measure a reduced activity of PTPs in the Tnxrd2-deficient cells. Furthermore, we could show that JNK phosphorylation was markedly increased in Txnrd2−/− cells as well as in the established mouse cancer cell line, LLC1, when Txnrd2 was knocked down. Administration of the JNK inhibitor SP600125 and knockdown of JNK by siRNA substantiated our hypothesized mechanism, as this led to reduced PHD2 protein levels, thus confirming the yet-unrecognized link between JNK and PHD2 expression. Currently, it remains to be shown how exactly PHD2 levels are regulated by activated JNK.
Taken together, our in vitro observations serve as a plausible foundation for the restricted growth of Txnrd2-null tumors. First, JNK signaling has been shown to suppress tumor growth (33, 50). Second, tumor angiogenesis is, at least partly, regulated by PHD2 (7), and Txnrd2-null tumors express reduced Hif-1α as well as reduced VEGF-A protein levels. Finally, PHD2 has additional Hif-independent tumor suppressor functions (7), which are also in agreement with the reduced tumor growth observed in our model.
We previously showed that primary Txnrd2−/− fibroblasts are highly sensitive to GSH depletion-induced cell death (10). As demonstrated here, this apparently also holds true for immortalized cells and tumors derived thereof, most likely due to a block of the compensatory GSH-dependent Prx III reduction by grx2. For future studies targeting antioxidants to efficiently combat cancer, we therefore suggest the concomitant targeting of at least two key antioxidant systems.
In conclusion, our data describe a hitherto unrecognized pathway for PHD2 activation via JNK, originating from an altered mitochondrial redox balance. Phosphorylated JNK leads to a sustained expression of PHD2 in a yet unknown manner, ultimately leading to the impairment of Hif-1α signaling. While our data oppose previous results on PHD2 inhibition by ROS, this should be rationalized on the basis of variations in the models regarding radicals, sources of ROS, as well as their concentrations and the duration in which they are present.
Although our study only scratches the surface regarding the relevance of Txnrd2 for human cancer biology, we hope it will motivate other groups to study ROS-controlling systems in this context. Finally, our findings highlight the need for future anti-cancer strategies to consider the fine tuning of intracellular ROS signaling to efficiently shift cells from ROS-dependent tumor growth-promoting events toward ROS-induced cell death signaling.
Materials and Methods
Cell lines and reagents
Txnrd2+/+ and Txnrd2−/− MEFs were isolated from embryos at embryonic day E12.5 from breeding of heterozygous Txnrd2 mice. Genotyping and cell culturing was performed as previously described (10). Primer sequences are listed in Supplementary Tables S1 and S2. Primary MEFs (passage number<10) were immortalized by serial passaging (passage number>10) as described (39). LLC1 cells were obtained from ATCC (Teddington, United Kingdom). To induce Hif-1α protein expression, cells were either cultured in serum-free medium for 4 h or kept in a hypoxic chamber (1% O2) for 6 h.
Generation of transformed Txnrd2+/+ and Txnrd2−/− cells
For the transformation of cells, MEFs were co-transduced with c-Myc and Ha-rasV12-expressing lentiviruses as described (31). Soft agarose assays were performed to select successfully transformed cells. After 7 days of growth in soft agarose, single-cell-derived colonies were isolated, expanded, and analyzed for expression of Txnrd2, c-Myc, and Ha-rasV12. To assess the efficacy of transformation with c-Myc and Ha-rasV12, cells were analyzed for green fluorescent protein (GFP) expression using BD FACSort (Beckton Dickinson, Heidelberg, Germany). Data were analyzed using the CellQuest software (Beckton Dickinson) and WinMDI software, version 2.9 (Scripps Research Institute, La Jolla, CA).
Proliferation assay
Cell proliferation and cytotoxicity were measured using the electronic cell sensor array technology xCELLigence (Roche, Mannheim, Germany) as described (32). BSO (Sigma-Aldrich, Munich, Germany) was used at a final concentration of 10 μM to inhibit the de novo synthesis of GSH.
Measurement of cellular ROS levels
ROS generation was assessed using CellROX Deep Red Reagent (Life Technologies, Darmstadt, Germany) according to the manufacturer's recommendations. Fluorescence intensity was analyzed by flow cytometry using a Gallios 2/8 flow cytometer (Becton Coulter, Krefeld, Germany) at an excitation wavelength of 633 nm and emission collected with a 660 band-pass detector. Cells were gated and analyzed using the Gallios Data acquisition and analysis software (Becton Coulter).
Measurement of GSH concentration in cells and tumors
Total glutathione content in cells was analyzed by performing a modified assay based on a method first described by Tietze (46). The concentration of total glutathione in cells was calculated as μM/mg protein and referenced to a 10 mM GSH calibration solution (Sigma-Aldrich). Reduced and oxidized glutathione concentrations (GSH and GSSG) in tumor samples were measured by isocratic HPLC as previously described (31).
Quantitative real-time PCR
The expression of Hif-1α, PHD2, and Txnrd2 was investigated by RT-PCR/qRT-PCR as described (31). Expression was normalized to β-actin or aldolase expression. Primer sequences are listed in Supplementary Table S2.
Hematoxylin-eosin staining/immunohistochemistry/immunofluorescence and image analysis
Paraformaldehyde-fixed (4% w/v, in phosphate-buffered solution [PBS]) and paraffin-embedded tumor material was cut in 5 μm-thick sections and stained as described (10). Hematoxylin-eosin (H&E) staining, immunohistochemistry, and immunofluorescence staining were performed as previously described (2). Antibodies are listed in Supplementary Table S3. As control, primary antibodies were omitted during staining. Slides for peroxidase staining were incubated with peroxidase-conjugated streptavidin (Vectastain KIT ABC; Vector Laboratories, Linaris, Wertheim-Bettingen, Germany). Thereafter, slides were incubated with Vector® DAB kit or AEC kit (Vector Laboratories). Sections were counterstained with hematoxylin. Sections for immunofluorescence were counterstained with 4,6-diamidino-2-phenylindole ([DAPI], Hard Set™ Mounting Medium; Vector Laboratories). Immunostaining was analyzed using the Olympus BX41 microscope in combination with the CAMEDIA C-5050 digital camera and the software Olympus DP-Soft v3.2 (Olympus, Tokio, Japan). For the quantification of tumor vascularization, tumor cell proliferation, tumor cell apoptosis, and necrosis, three representative sections per tumor were analyzed (n=6 tumors) and micrographs were obtained from five random regions of interest from all three sections. Altogether, the analysis of these 15 random microscopic visual fields per tumor was performed in a blinded fashion by two researchers using a 20× objective. Total blood vessels were determined by counting the number of CD31-positive blood vessels. Proliferation was studied by counting Ki-67 positive and -negative cells. The ratio of proliferative to nonproliferative cells was expressed as PI. Apoptosis was assessed by counting caspase-3 positive cells. For the determination of necrosis, the percentage of the necrotic area relative to the entire tumor area was measured on H&E stained tumor sections.
Immunoblotting
Immunoblotting was performed as previously described (1). Primary antibodies are listed in Supplementary Table S4. Detection of Txnrd2 expression was achieved with a Txnrd2-specific antibody as described (31). Nuclear translocation of Hif-1α in cells was analyzed with the NE-PER® Nuclear and Cytoplasmic Extraction Reagent (Fisher Scientific GmbH, Schwerte, Germany). Equal loading was confirmed with a lamin-specific antibody. To block H2O2, cells were treated with PEG-catalase (50 U/ml; Sigma-Aldrich) for 18 h.
To analyze the levels of phosphorylated JNK, samples were lysed with buffer containing sodium fluoride (0.5 mM) and Na3VO4 (0.5 mM) (Sigma Aldrich). All blots were stripped and reprobed with either β-actin or glyceraldehyde 3-phosphate dehydrogenase (GAPDH). To block JNK activation, the specific JNK-inhibitor SP600125 (#420119, 50 μM; Merck Millipore, Schwalbach, Germany) was applied to the cell culture medium, either for 8 h or overnight. Application of dimethyl sulfoxide (DMSO) served as a control.
PHD2 knockdown in Txnrd2+/+ and Txnrd2−/− MEFS
MEFs were transfected with siMax siRNA (Eurofins Genomics, Ebersberg, Germany) using the following sequences: PHD2 siRNA 5′-GUG GAG GUA UUC UUC GAA UTT-3′; scramble siRNA 5′-UUC UUC GAA CGU GUC ACG UTT-3′. 105 cells were seeded onto 12-well plates and incubated with 5 nM siRNA and HiPerfect transfection reagent (Qiagen, Hilden, Germany) in full medium for 50 h. Subsequently, cells were washed in PBS and proteins were extracted by cell lysis. Knockdown of PHD2 was confirmed by immunoblot.
Txnrd2 knockdown in LLC1 tumor cells
LLC1 cells were transfected with MISSION® esiRNA targeting mouse Txnrd2 (EMU067221; Sigma-Aldrich) according to the manufacturer's instructions. Cells were harvested, lysed for 72 h after transfection, and blotted against designated antibodies as described earlier.
JNK knockdown in Txnrd2 −/− MEFs
MEFs were transfected with FlexiTube siRNA (Qiagen) against both JNK1 (GS26419) and JNK2 (GS26420). Reverse transfection was performed in 24-well plates according to the manufacturer's advice using 5 μl HiPerFect transfection reagent and 50 nM siRNA for 70,000 cells for 72 h. Subsequently, cells were lysed and knockdown of JNK was confirmed by immunoblot.
Enzyme-linked immunosorbent assay
To measure mouse VEGF in cell culture supernatants and tumor tissue, the Mouse VEGF Quantikine Immunoassay (R&D Systems, Wiesbaden-Nordenstedt, Germany) was employed according to the manufacturer's recommendations. Absorbance was measured at a wavelength of 450 nm using the ELISA plate reader Infinite F200 (Tecan, Crailsheim, Germany). Total protein concentration in supernatants and tumor homogenates was measured with the BCA™ Protein Assay Kit (Pierce; Fisher Scientific).
Subcutaneous xenograft tumor model
Transformed Txnrd2−/− and Txnrd2+/+ cells (4×10⁶ cells dissolved in 200 μl sterile PBS) were injected subcutaneously into the retral flank of C57BL/6 mice. Tumors were collected over a period of 11 days. All animal experiments were performed in compliance with the German Animal Welfare Law and had been approved by the institutional committee on animal experimentation and the government of Upper Bavaria.
Treatment of tumor-bearing mice with BSO
For the in vivo pharmacological studies, 4×10⁶ transformed Txnrd2-deficient cells in 200 μl sterile PBS were injected subcutaneously into the retral flank of C57BL/6 mice. Tumors were allowed to settle for 3 days. From day 3 onward, BSO (20 mM) was administered via the drinking water for 8 days. BSO-containing water was exchanged every third day. At day 11, mice were sacrificed and tumor mass and volume was analyzed.
Measurement of PTP activity
PTP activity in total cell lysates was measured toward a 32P-labeled phosphotyrosine substrate (AEEEIpYGEFEA KKKK) as previously described (43). WT and Txnrd2−/− fibroblasts were starved overnight in phenol-red free DMEM (Gibco, Stockholm, Sweden) with 1% fetal calf serum. Cells were washed in 20 mM Hepes pH 7.4 (Sigma-Aldrich, Stockholm, Sweden) and lysed in degassed lysis buffer (50 mM sodium acetate, 150 mM NaCl, 1% NP-40, 25 μg/ml aprotinin, 25 μg/ml leupeptin, 250 U/ml catalase, and 125 U/ml superoxide dismutase [Calbiochem, Solna, Sweden]). Lysates were cleared by centrifugation at 21,000 g at 4°C for 5 min. A fraction of the lysate was mixed with deoxygenated 25 mM imidazole pH 7.4 (Sigma-Aldrich), the PTP substrate (kind gift from Carl Henrik Heldin) was added, and the mixture was incubated for 20 min. The dephosphorylation reaction was stopped by addition of a charcoal mixture (0.9M HCl, 90 mM sodium pyrophosphate, 2 mM NaH2PO4, 4% vol/vol NoritA; Sigma-Aldrich) and centrifuged at 21,000 g for 3 min. The supernatant containing released 32P (PerkinElmer, Upplands Väsby, Sweden) was transferred to scintillation vials (Sigma-Aldrich) with EcoScint A (National Diagnostics, BioNordika, Stockholm, Sweden), and radioactivity was measured using a Wallac Winspectral 1414 Liquid Scintillation Counter (PerkinElmer). The radioactive signal reflects the activity of the reduced PTPs and was normalized toward cell lysate treated with the reducing agent dithiothreitol (DTT; Sigma-Aldrich) that represents the maximal activity when all PTPs are reduced.
Determination of NFκB activation
Translocation of the NFκB subunit p65 to the nucleus was analyzed by immunocytochemistry in formaldehyde-fixed MEFs as described (3). In brief, cells were grown to ∼80% confluence on glass coverslips coated with collagen G (10 μg/ml; Biochrom AG, Berlin, Germany). Subsequently, cells were fixed with 3.7% formaldehyde, permeabilized with 0.3% Triton X-100, and incubated with a p65-specific antibody. Slides were mounted with DAPI-containing Hard Set Mounting Medium (Vector Laboratories) and analyzed using the confocal laser scanning microscope Leica TCS SP5 (Leica Microsystems, Wetzlar, Germany).
To further substantiate the results from immunocytochemistry, activation of the NFκB subunit p65 was measured using the colorimetric NFκB p65 EZ-TFA transcription factor assay according to the manufacturer's instructions (Millipore GmbH, Schwalbach, Germany).
Statistical analysis
Statistical analysis was performed using SigmaPlot© 11.0 software (Jandel GmbH, Erkrath, Germany). Experimental values are expressed as mean±standard deviation, unless stated otherwise. Numbers of independent experiments are indicated in the corresponding results section. Statistically significant differences between groups were calculated by Student's t-test or analysis of variance followed by Bonferroni's correction. Non-Gaussian distributed data were analyzed by the nonparametric Kruskal–Wallis test for nonpaired data. p<0.05 was considered significant.
Footnotes
Acknowledgments
The authors thank Dora Kiesl, Dorothee Gössel, Heidi Förster, Kasia Stefanowski, and Matthias Semisch for their excellent technical assistance.
This work was supported by the Deutsche Forschungsgemeinschaft (DFG) priority Program SPP 1190 to H.B. and M.C., the Friedrich-Baur Stiftung to H.B. and T.F., a DFG grant (CO 291/2-3) to M.C., a Marie Curie Actions Fellowship of the FP7 People Program to J.K., and a fellowship from Alexander von Humboldt-Stiftung to J.P.F.A.
Author Disclosure Statement
No competing financial interests exist.
Abbreviations Used
References
Supplementary Material
Please find the following supplemental material available below.
For Open Access articles published under a Creative Commons License, all supplemental material carries the same license as the article it is associated with.
For non-Open Access articles published, all supplemental material carries a non-exclusive license, and permission requests for re-use of supplemental material or any part of supplemental material shall be sent directly to the copyright owner as specified in the copyright notice associated with the article.