
Abstract
Introduction
M
Our experimental data provide new insights into the role of cell-based versus noncell-based therapeutic effects of progenitor cells (PC) derived from induced pluripotent stem cells (iPSC). Current research inadequately distinguishes the nature of post-MI restoration of cardiac function with cell-based therapies. Our focus on noncell-based therapy mediated by paracrine factors secreted by PCs is supported by several studies in which PCs that secrete cytokines, chemokines, and growth factors are observed to improve heart function. However, increasing evidence supports the notion that iPSC differentiation into cardiovascular cell lineages is important to compensate for pathological insufficiency and to prolong the therapeutic effect, leading to a favorable reversal of tissue remodeling after ischemic conditions.
The present study seeks to determine whether iPSC-produced therapeutic effects in postischemic myocardium can be ascribed preferentially to a cell-based differentiation or to a cell-derived product mechanism. To obtain evidence on the respective roles of these two mechanisms, an “inducible suicide gene” approach was employed. iPSC-derived cardiovascular PCs were genetically modified to express thymidine kinase (TK) “suicide” gene driven by cardiac promoter (NCX1) and vascular endothelium ([VE]-cadherin) promoter in cardiac myocytes and endothelial cell (EC) lineages, respectively. When these cells are exposed to GCV (8), the pro-drug GCV will be converted into a tri-phosporylated cytotoxic agent by TK, thereby triggering the death of such cells. Thus, by specifically targeting iPSC-derived CM and EC at different time windows with a sequential administration of GCV, the study design enables an assessment of the role of these two mechanisms mentioned earlier in any observed cardiac tissue repair process.
Results
Transduction of TK for suicide gene delivery
The lentiviral vectors co-expressing green fluorescent protein (GFP) and TK under the control of promoterless (pCDH-Null-TK), CVM promoter (pCDH-CMV-TK), and specific cardiac sodium-calcium exchanger (NCX1) promoter (pCDH-NCX1-TK) were constructed, as shown in Figure 1A–C, respectively. Neonatal cardiomyocytes (Neo-CM) were transfected with lentivirus containing the herpes simplex virus TK under the control of NCX1 promoter, or CMV promoter, or promoterless vector (Null) as control, respectively. TK expressions in Neo-CM were assessed by reverse transcription-polymerase chain reaction (RT-PCR) (Fig. 1E). TK was expressed specifically in Neo-CMCMV-TK and Neo-CMNCX1-TK but not in the Neo-CMNull-TK group (Fig. 1E). CM derived from iPSC (CM) were transduced with TK gene and then treated with vehicle or ganciclovir (GCV, 100 μM). Two days later, cells were photographed under a fluorescent microscope (Fig. 1G). CMNull-TK, CMCMV-TK, and CMNCX1-TK survived when CM was treated with a vehicle. However, all CMCMV-TK and CMNCX1-TK died when GCV (100 μM) was administered.
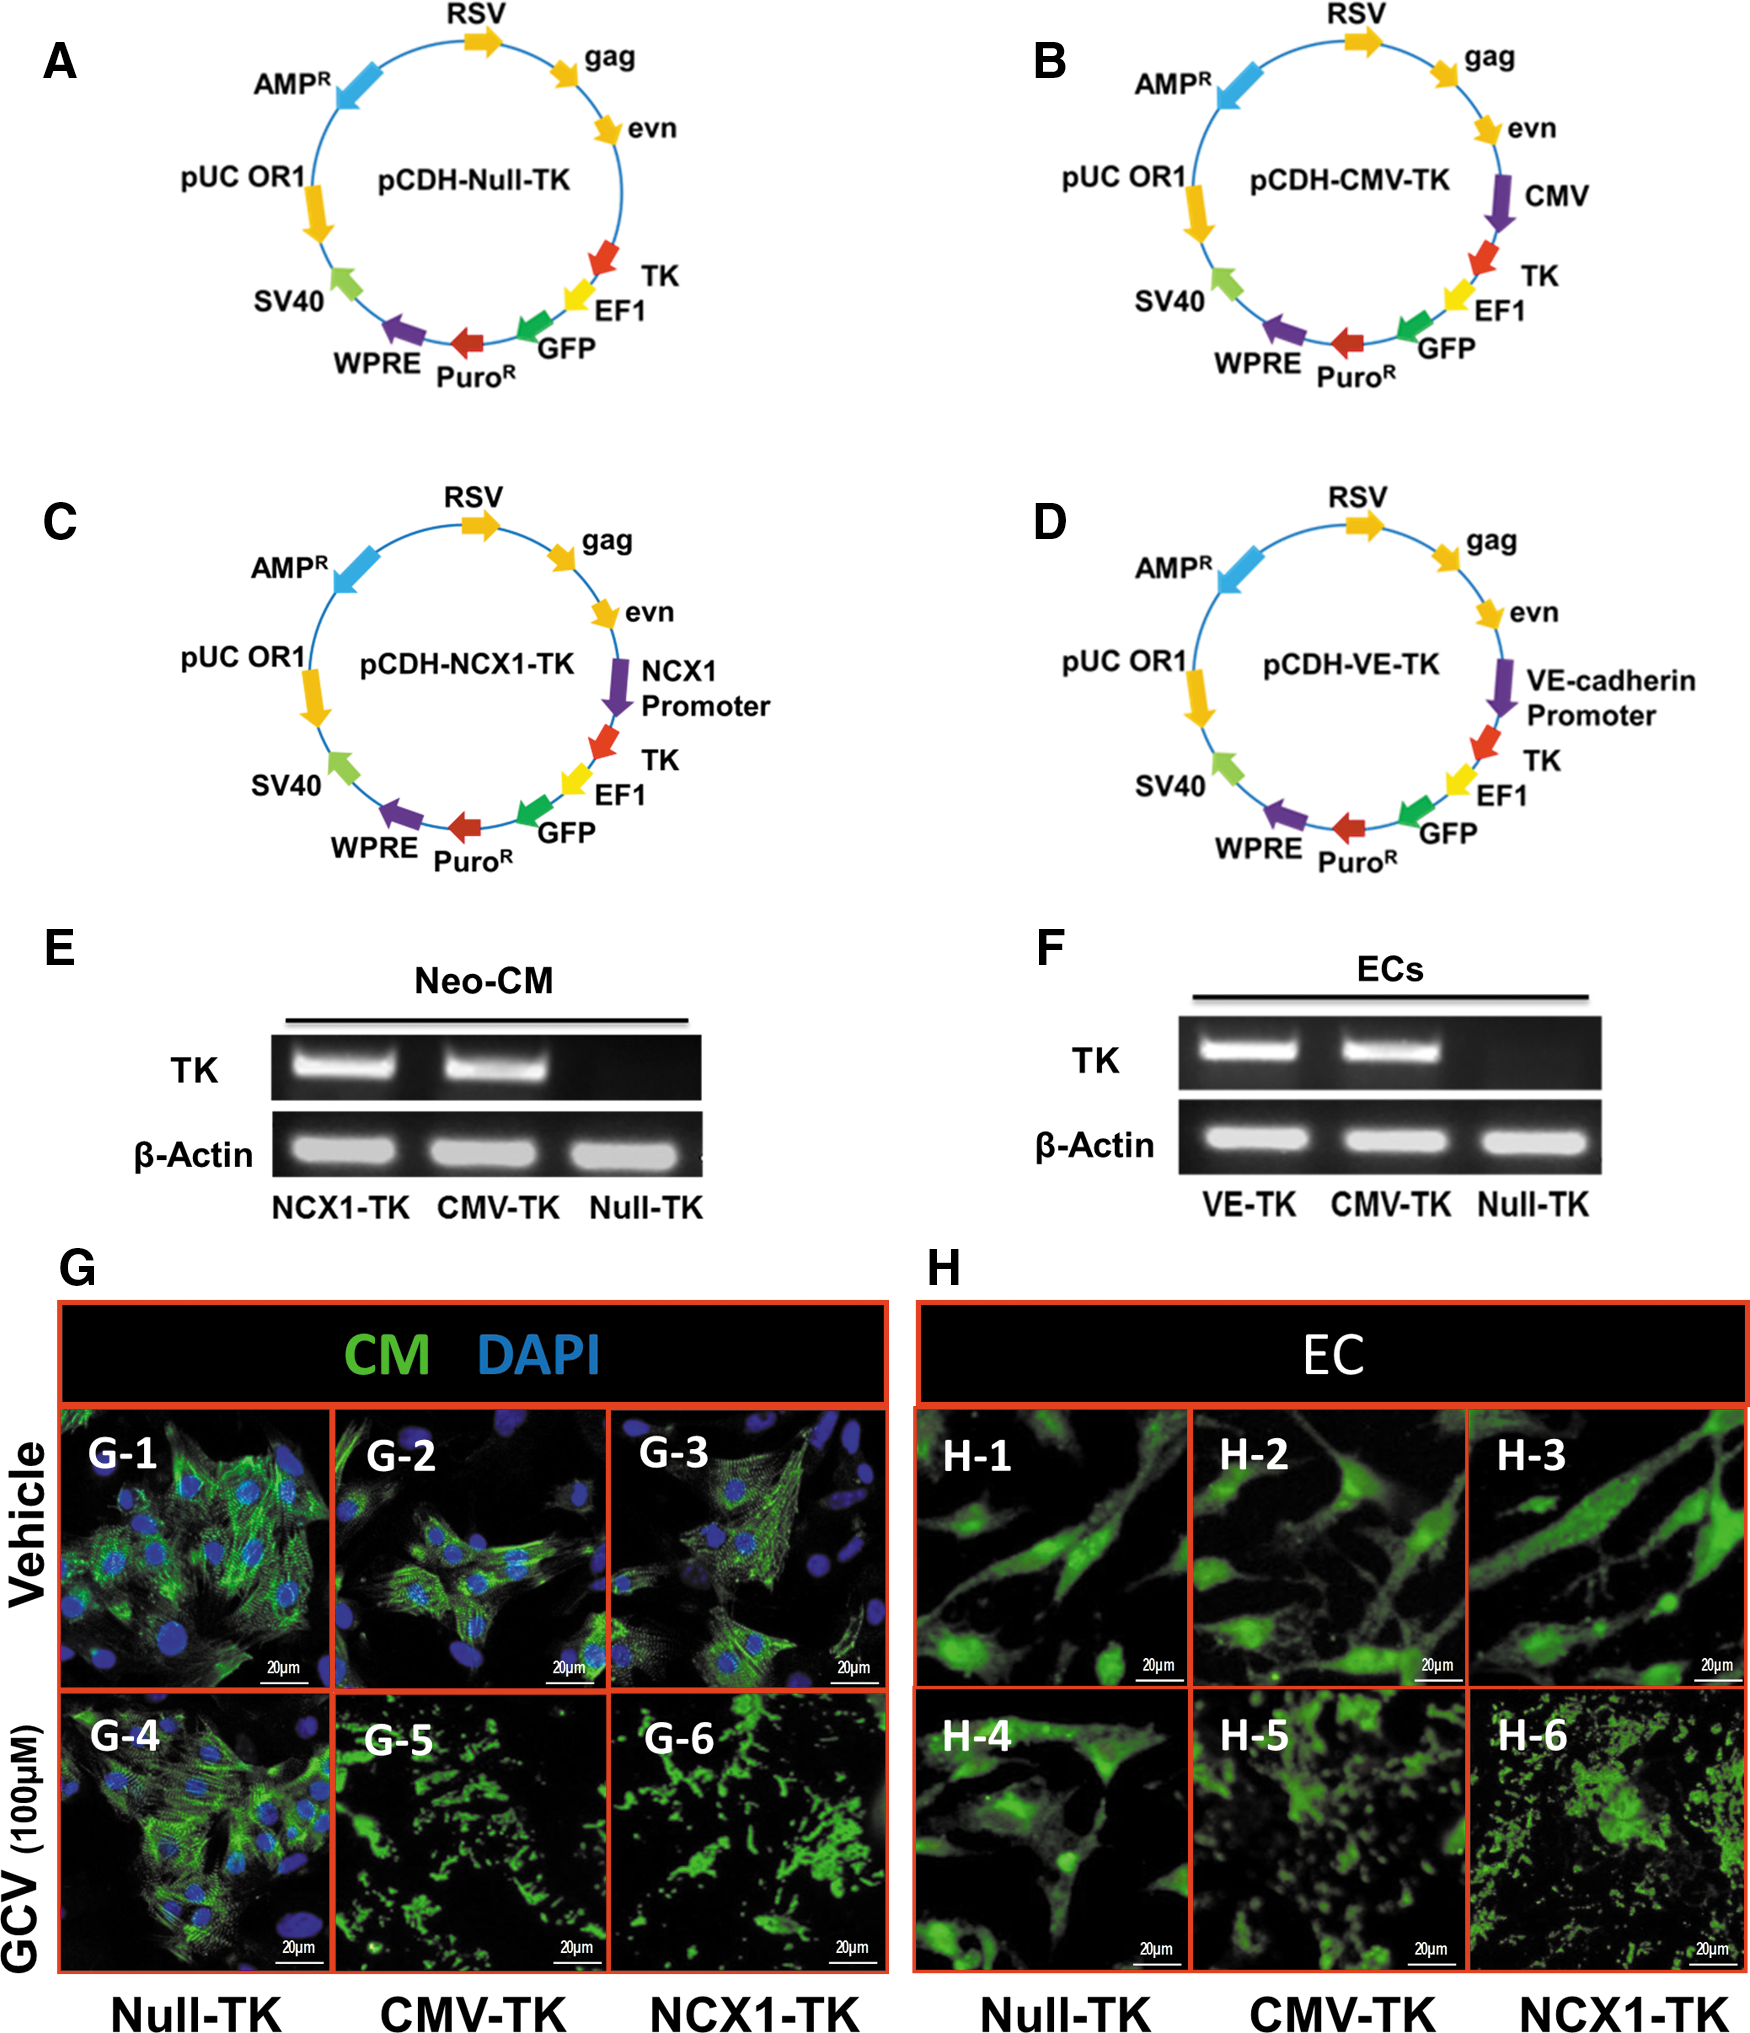
Similarly, the lentiviral vectors co-expressing GFP and TK under the control of promoterless (pCDH-Null-TK), CVM promoter (pCDH-CMV-TK), and specific EC promoter (VE-cadherin) were constructed as shown in (Fig. 1A, B, D, respectively). TK expression in ECs was detected by RT-PCR (Fig. 1F). TK gene was expressed in ECsVE-TK and ECsCMV-TK but not in ECsNull-TK (Fig. 1F). ECs derived from iPSC (EC) were then transduced with the lentivirus mentioned earlier. The cell growth of ECNull-TK, ECCMV-TK, or ECVE-TK was not influenced when treated with vehicle. There were no surviving cells that expressed TK in the ECCMV-TK or ECVE-TK group. In fact, the only group in which cells survived after administration of 100 μM GCV was ECNull-TK (Fig. 1H).
Characteristics of iPSC-derived cardiovascular PCs
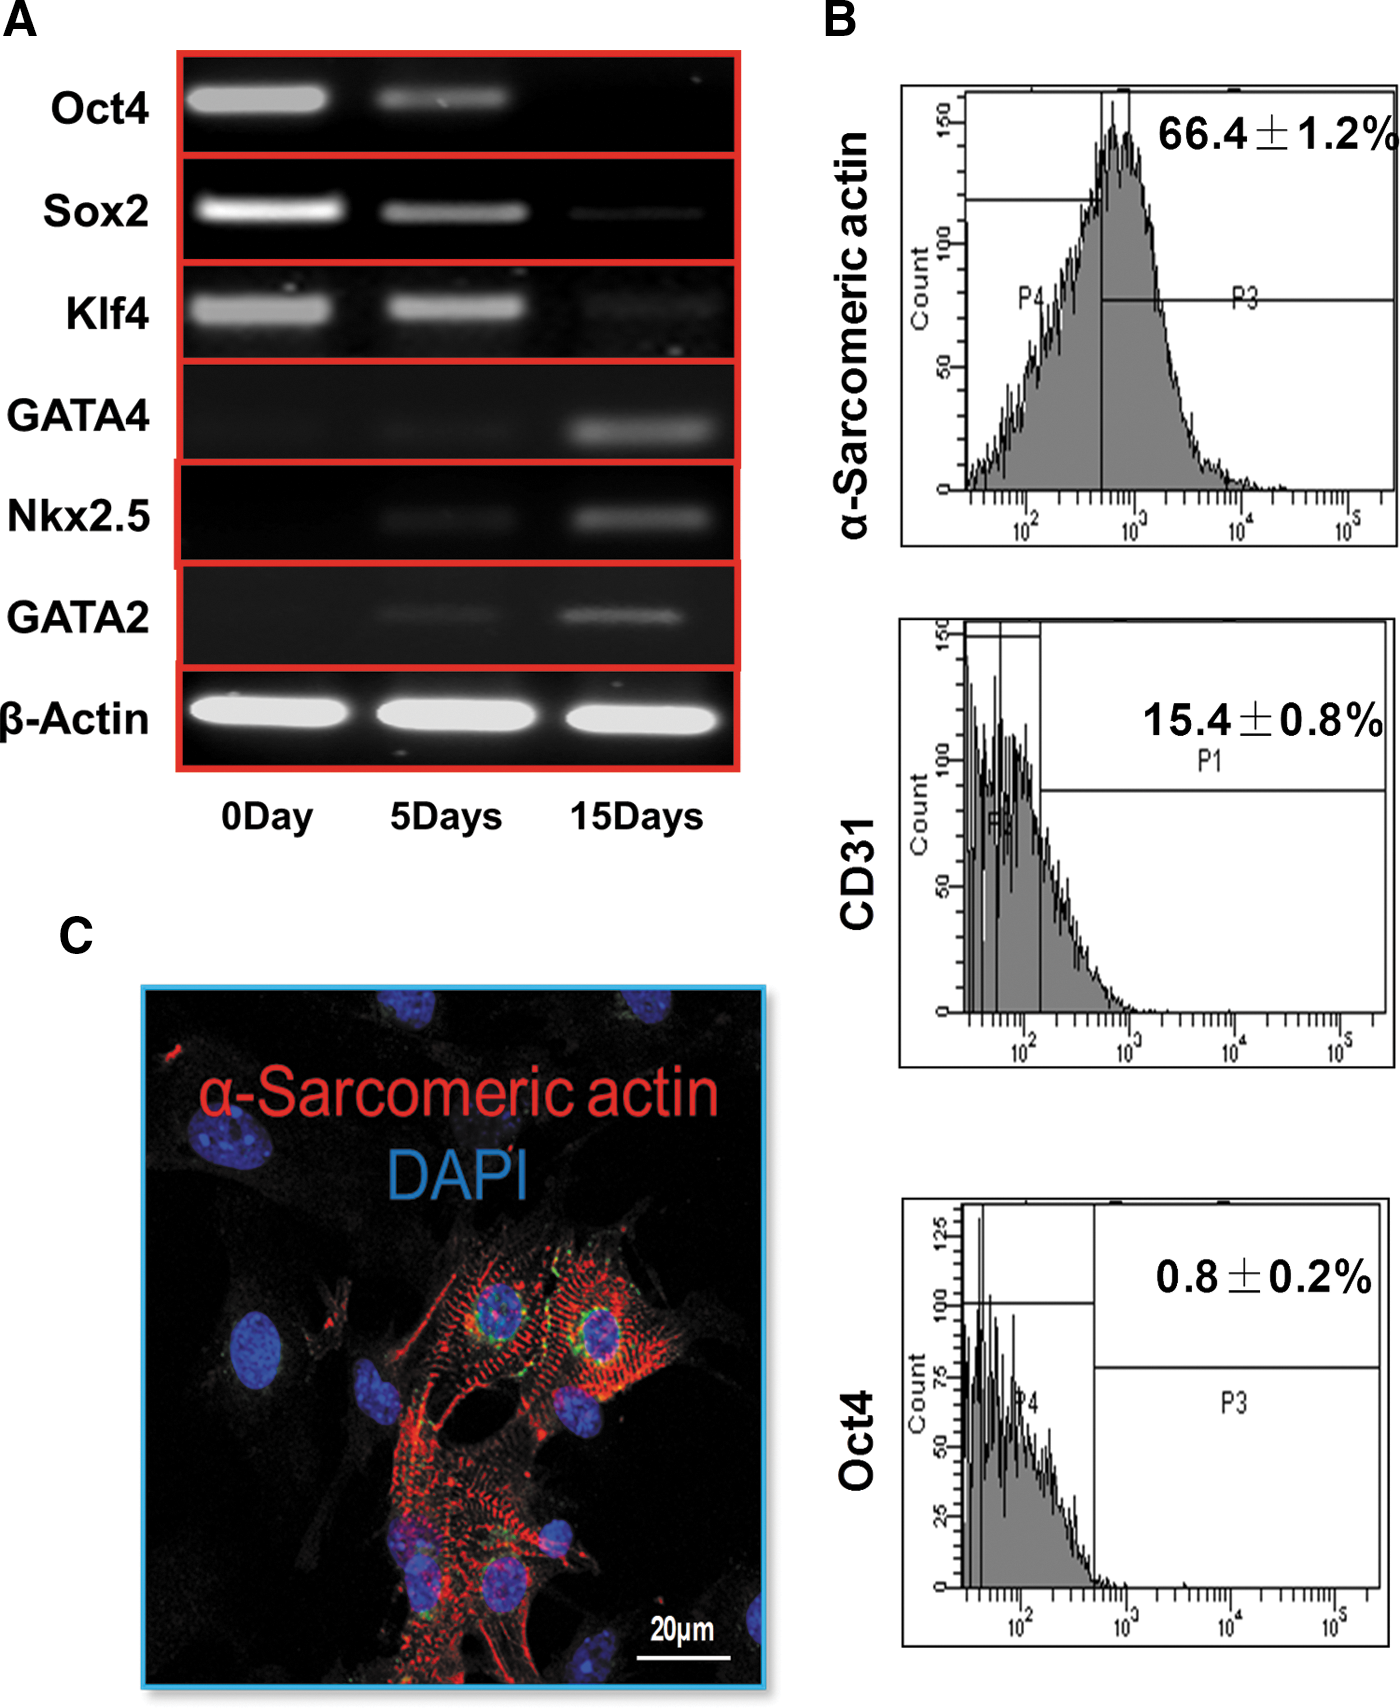
The gene expressions of Oct4, Sox2, Klf4, GAGT4, Nkx2.5, and GAGT2 were assessed by quantitative RT-PCR (qRT-PCR) to investigate the phenotype of cardiovascular PCs derived from iPSC. The gene expression levels of Oct4, Sox2, and Klf4 were gradually decreased; while the GATA4, GATA2, and Nkx2.5 were upregulated in a time-dependent manner (Fig. 2A). At 2 weeks after the formation of EBs, the expression level of the stem cell marker Oct4 decreased (Fig. 2B); whereas the percentages of α-sarcomeric actin-positive cells and CD31+ cells increased to 66.4% and 15.4%, respectively, suggesting that CM and EC were successfully differentiated from iPSC. CM derived from iPSC were also confirmed by positive staining with the α-sarcomeric actin antibody, a specific cardiomyocyte marker (Fig. 2C).
Growth factor release in vitro and in vivo
The gene expression of IGF-1α and VEGF was significantly upregulated, while TGF-β1 expression was significantly reduced in CM after 4 h of exposure to anoxia as compared with levels detected in CM cultured in normoxia, p<0.05, (Fig. 3A). Similarly, all gene expression was significantly upregulated except IGF-1α, which was significantly reduced in EC after 4 h of anoxia as compared with EC cultured under normoxic conditions, p<0.05, (Fig. 3B).
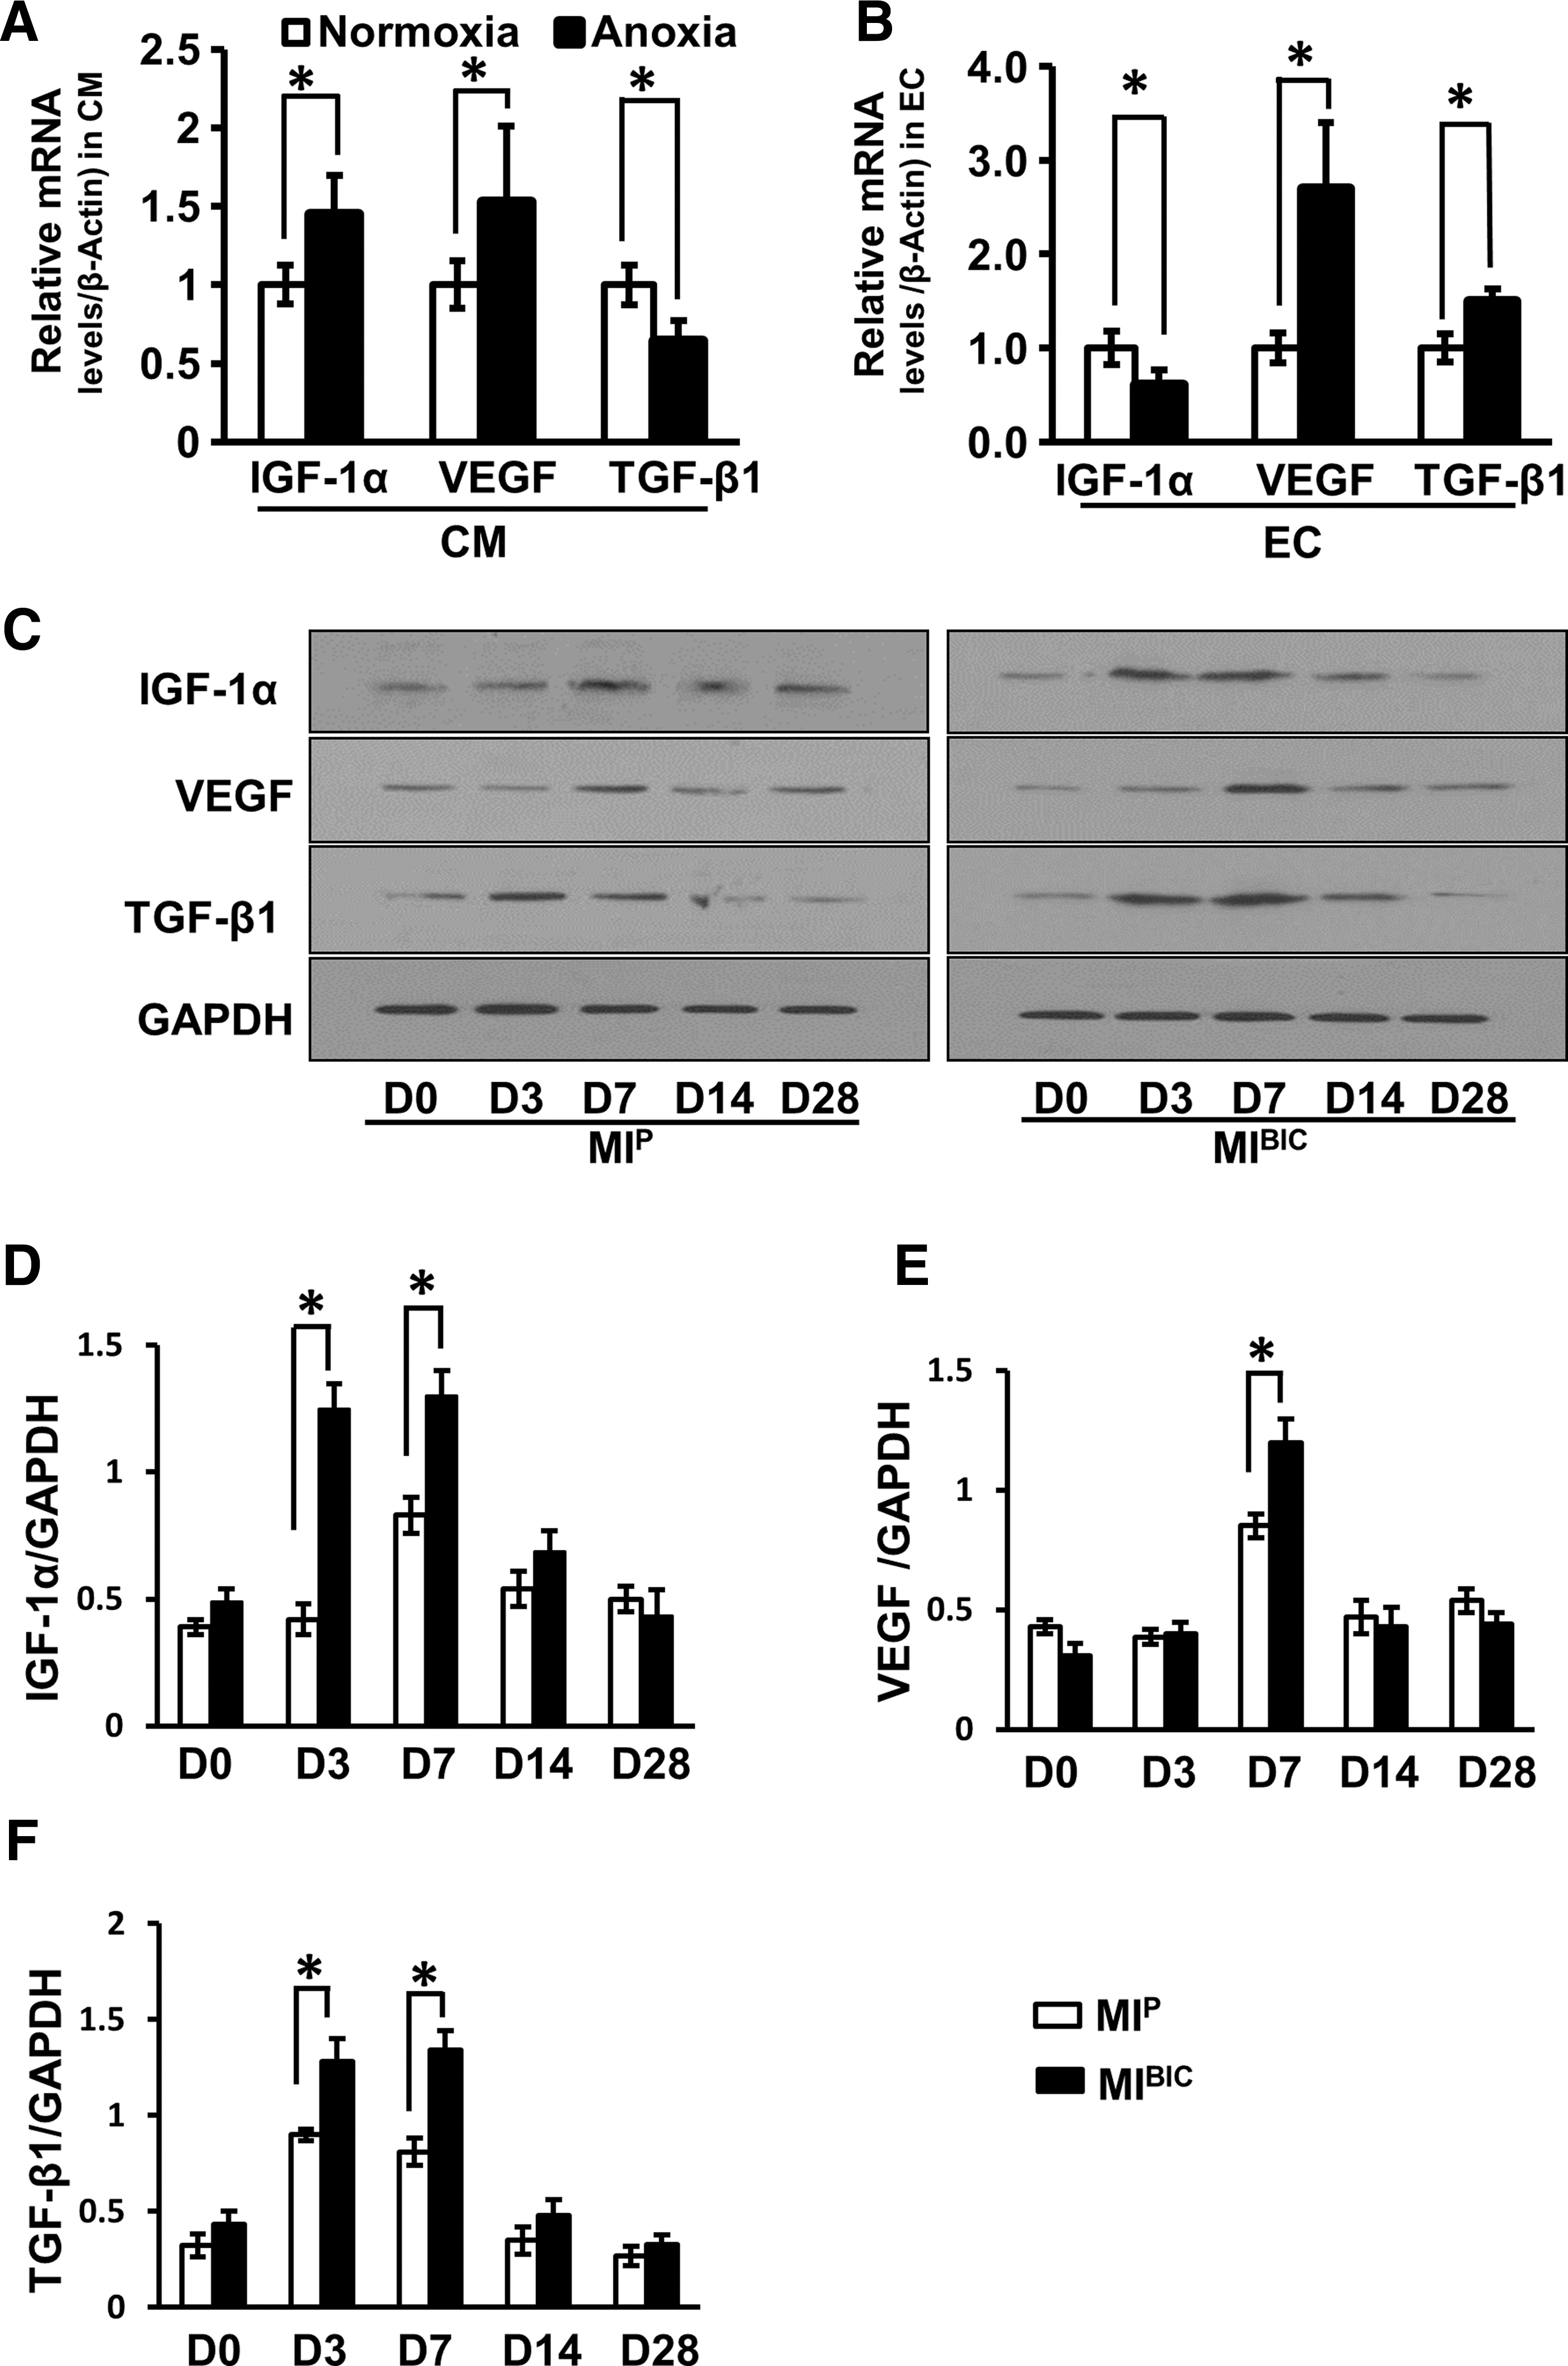
The expression of IGF-1α, VEGF, and TGF-β1 was assessed by Western blotting (Fig. 3C) to explore the growth factor-releasing profiles of infarcted hearts with various treatments. All growth factors were significantly upregulated in a time-dependent manner in the MIBIC (MI operated rats with bi-cell (CM+EC)-seeded peritoneum patch) group as compared with the MIP group (MI operated rats with peritoneum patch without cells) (Fig. 3D–F). In addition, upregulation of growth factor(s) expression occurred immediately after BIC implantation and reached a peak level on day 7 (except for TGF-β1, which peaked at day 3). Growth factor(s) gradually returned to similar levels in both MIBIC and MIP groups by day 28 (Fig. 3C).
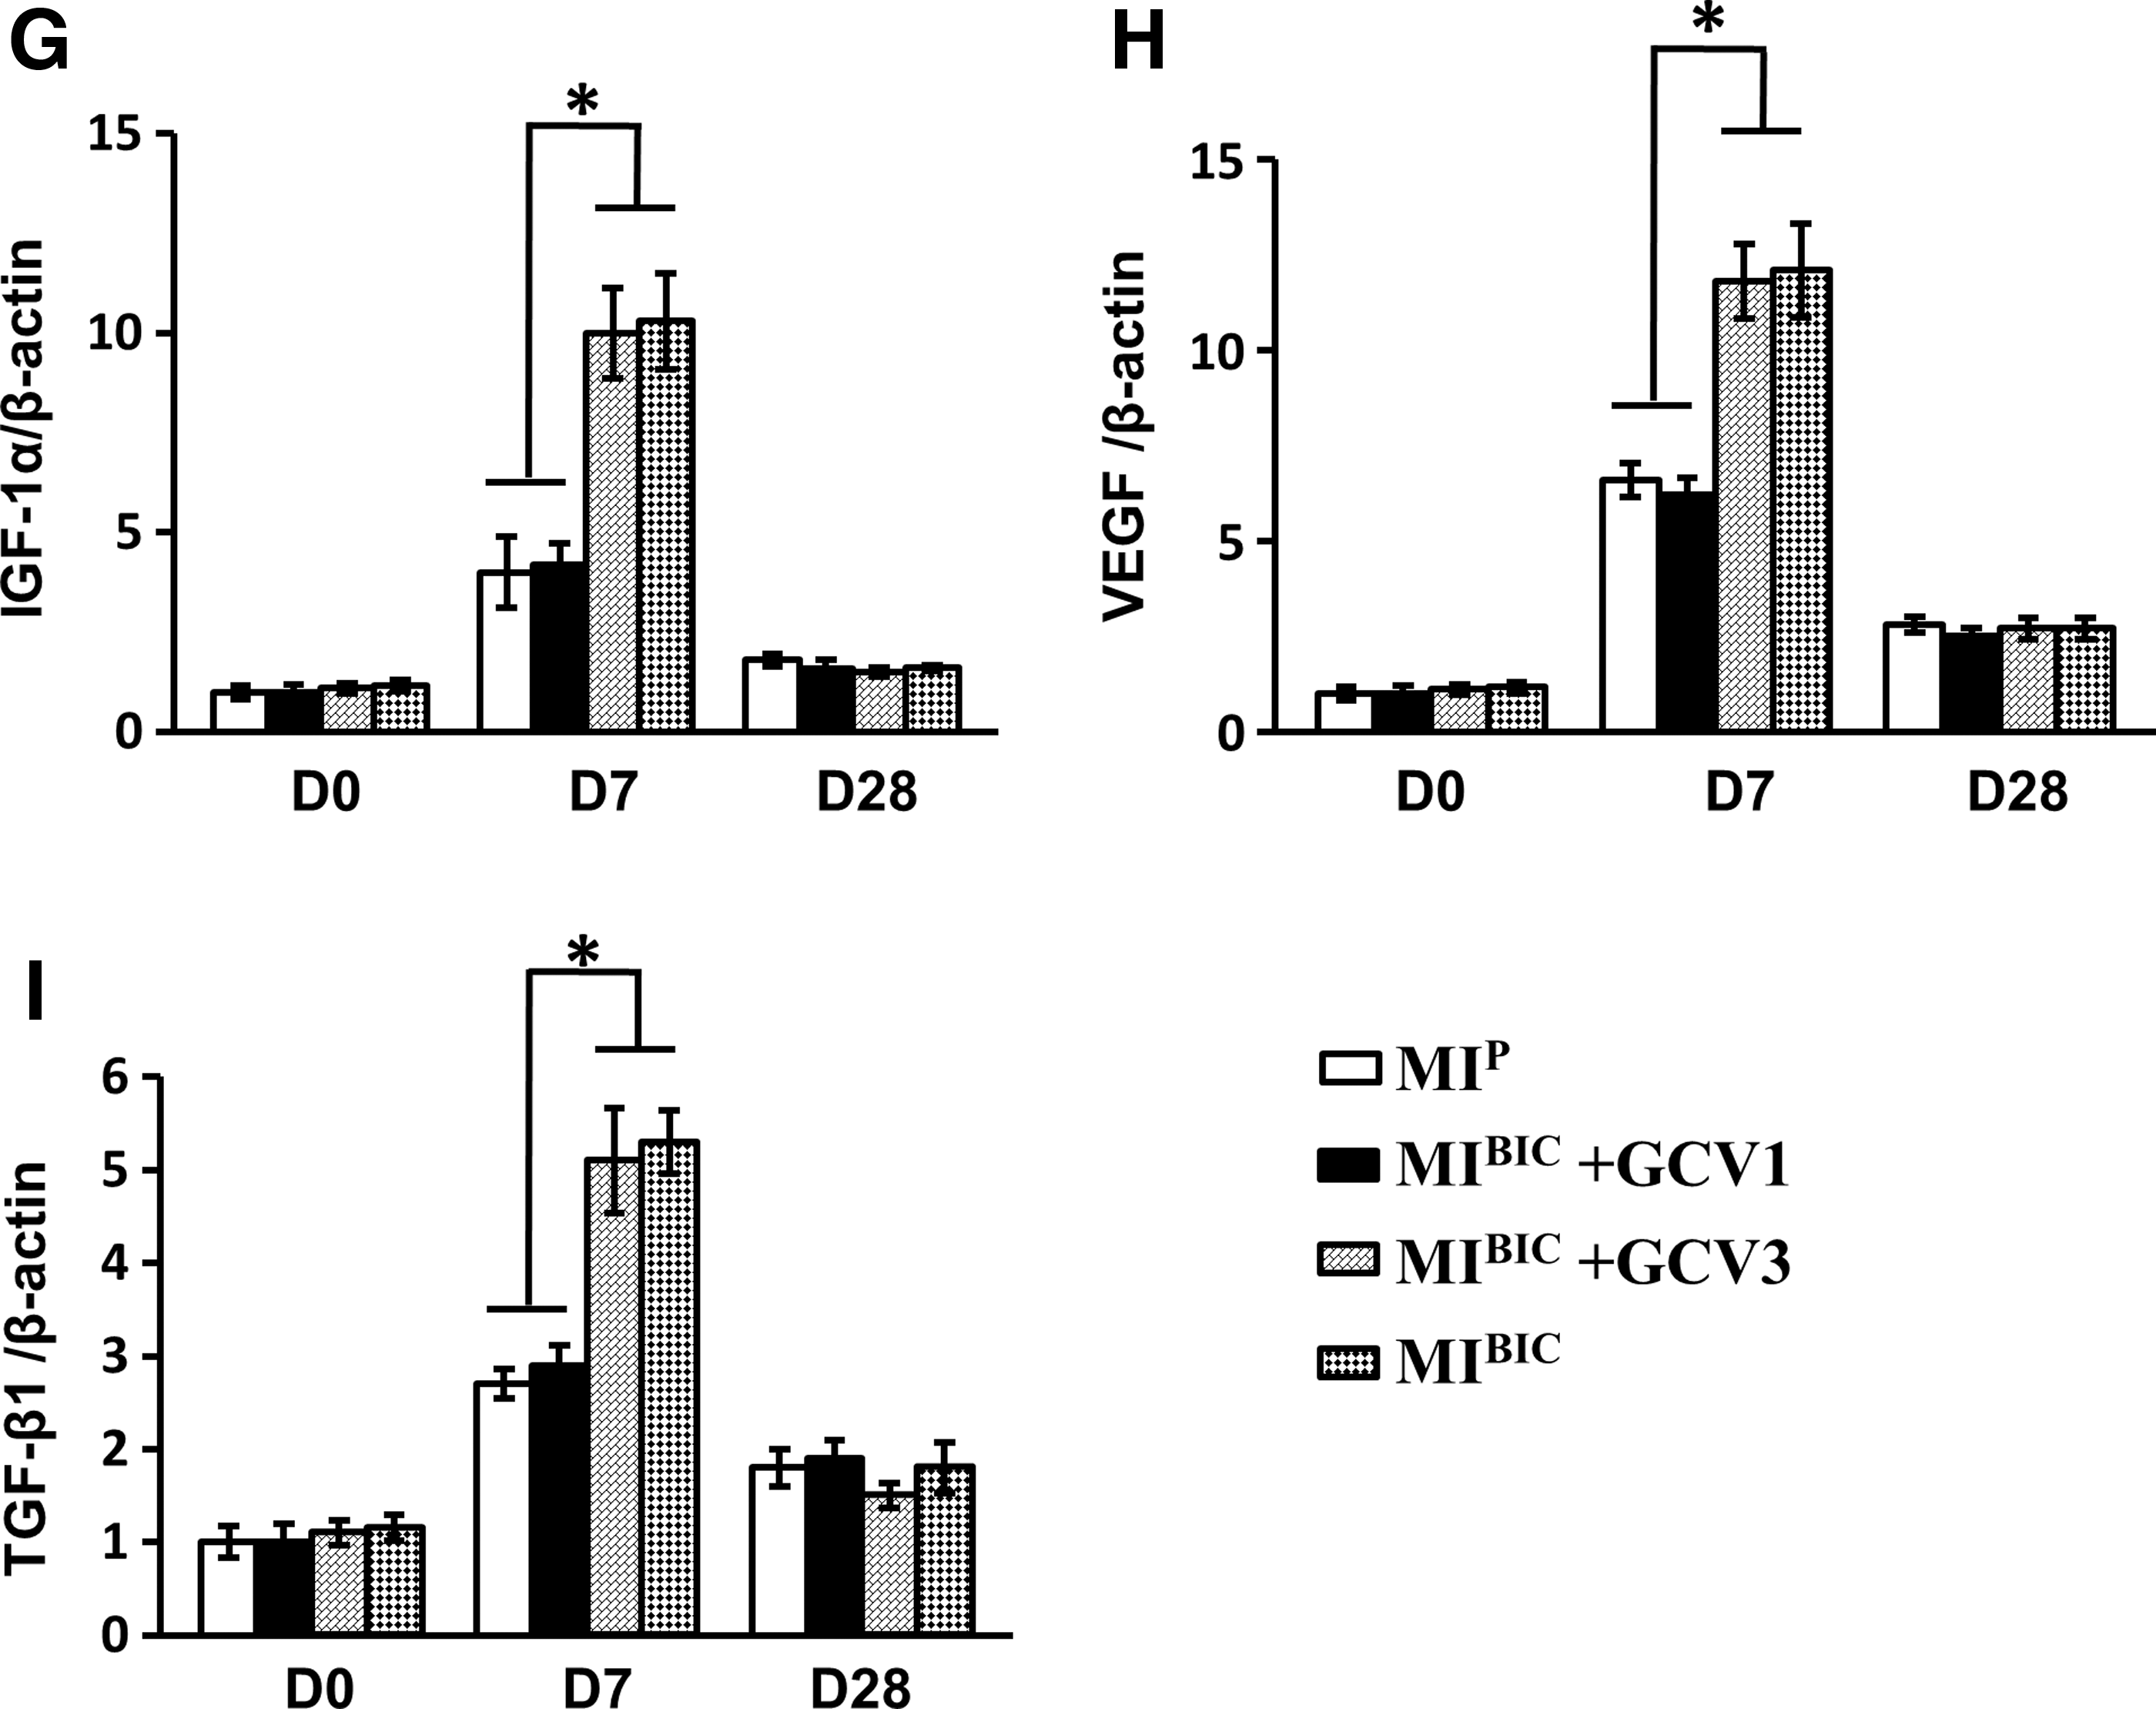
The role of selective timed elimination of cardiovascular cells in growth factor release was also investigated. Before and 21 days after cell patch implantation, there was no significant difference in expression of IGF-1α (Fig. 3G), VEGF (Fig. 3H), and TGF-β1 (Fig. 3I) in the various treatment groups. The expression of IGF-1α, VEGF, and TGF-β1 was significantly reduced in the MIBIC+GCV1 group (MI-operated rats with bi-cell patch given GCV in first week) in the first week. However, the increased levels of these growth factors (IGF-1α, VEGF, and TGF-β1) were not diminished at 7 days in the MIBIC+GCV3 group (MI-operated rats with bi-cell patch given GCV in third week). These expression levels were similar to the MIBIC group, indicating that growth factors were mainly released during the first week.
Evidence of angiomyogenesis
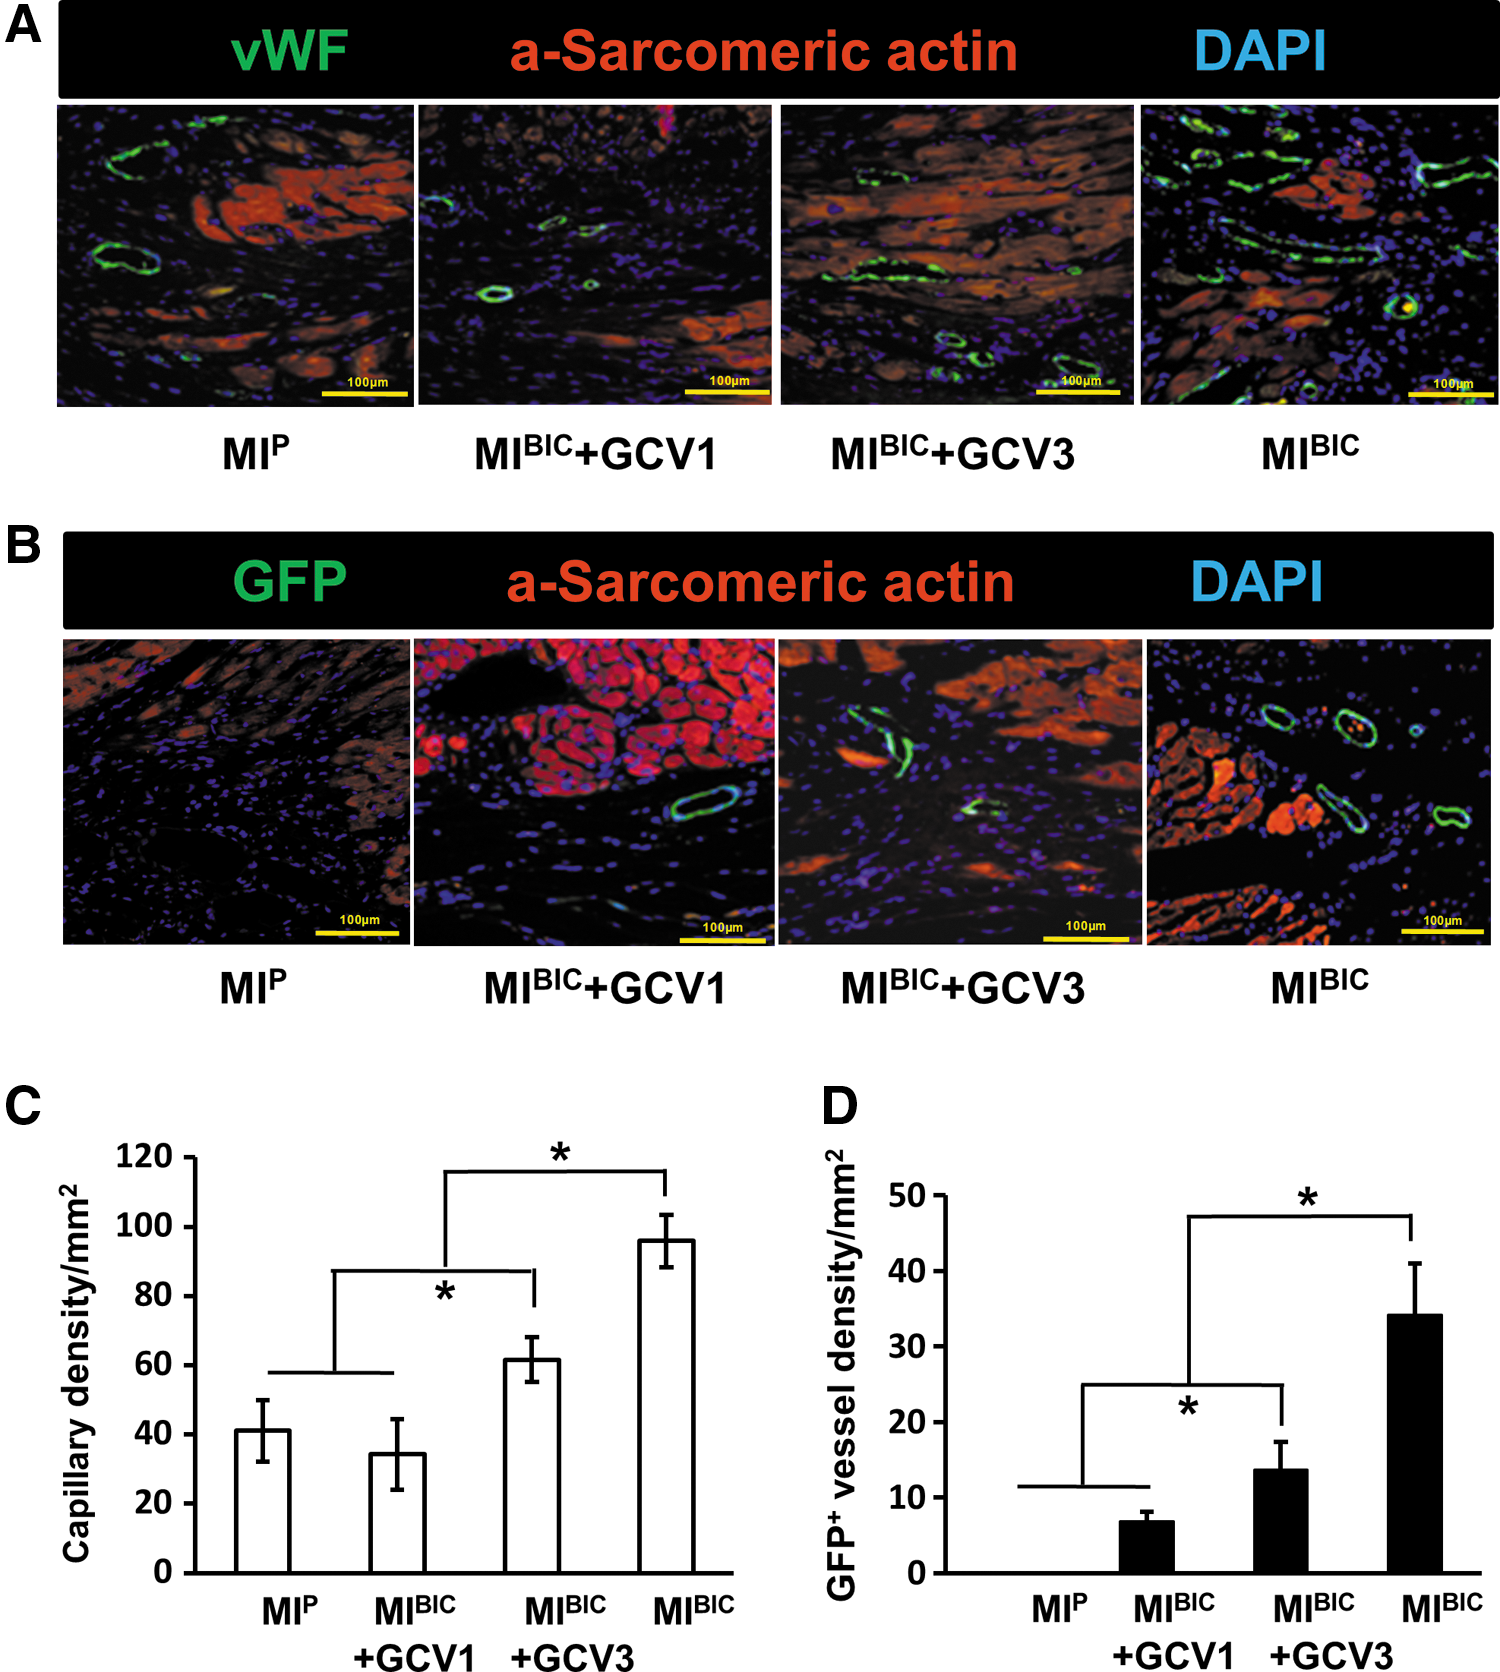
Four weeks after cell patch treatment, capillary density, as determined by von Willebrand factor (vWF) staining, was significantly higher in the MIBIC+GCV3 group than in the MIBIC+GCV1 group at 4 weeks after BIC sheet implantation in situ. This result was similar to that observed in the MIP control group. Notably, capillary density was the highest in the MIBIC group as compared with any other group (Fig. 4A, C). In addition, GCV administration significantly attenuated the new vessel formation, leading to significantly decreased GFP+ vessel number in the MIBIC+GCV1 group as compared with the MIBIC+GCV3 group. However, more GFP+ new vessels derived from iPSC were observed in the MIBIC group when compared with any other group (Fig. 4B, D).
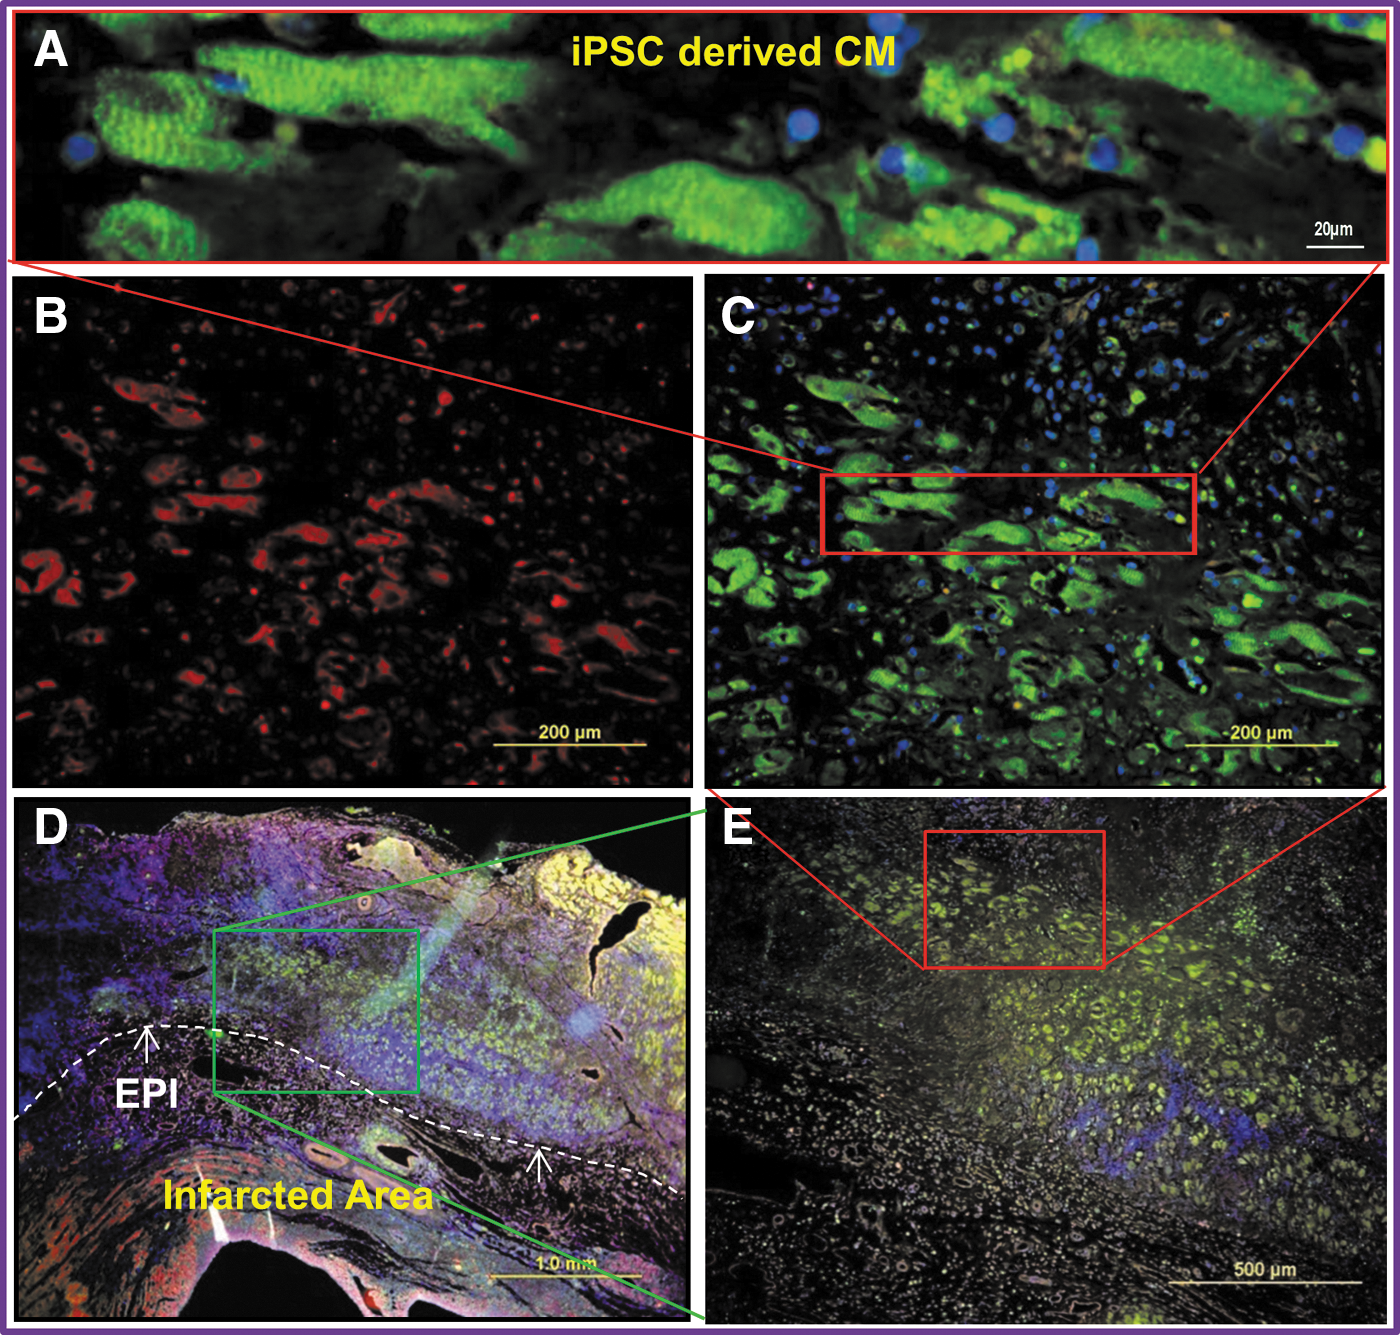
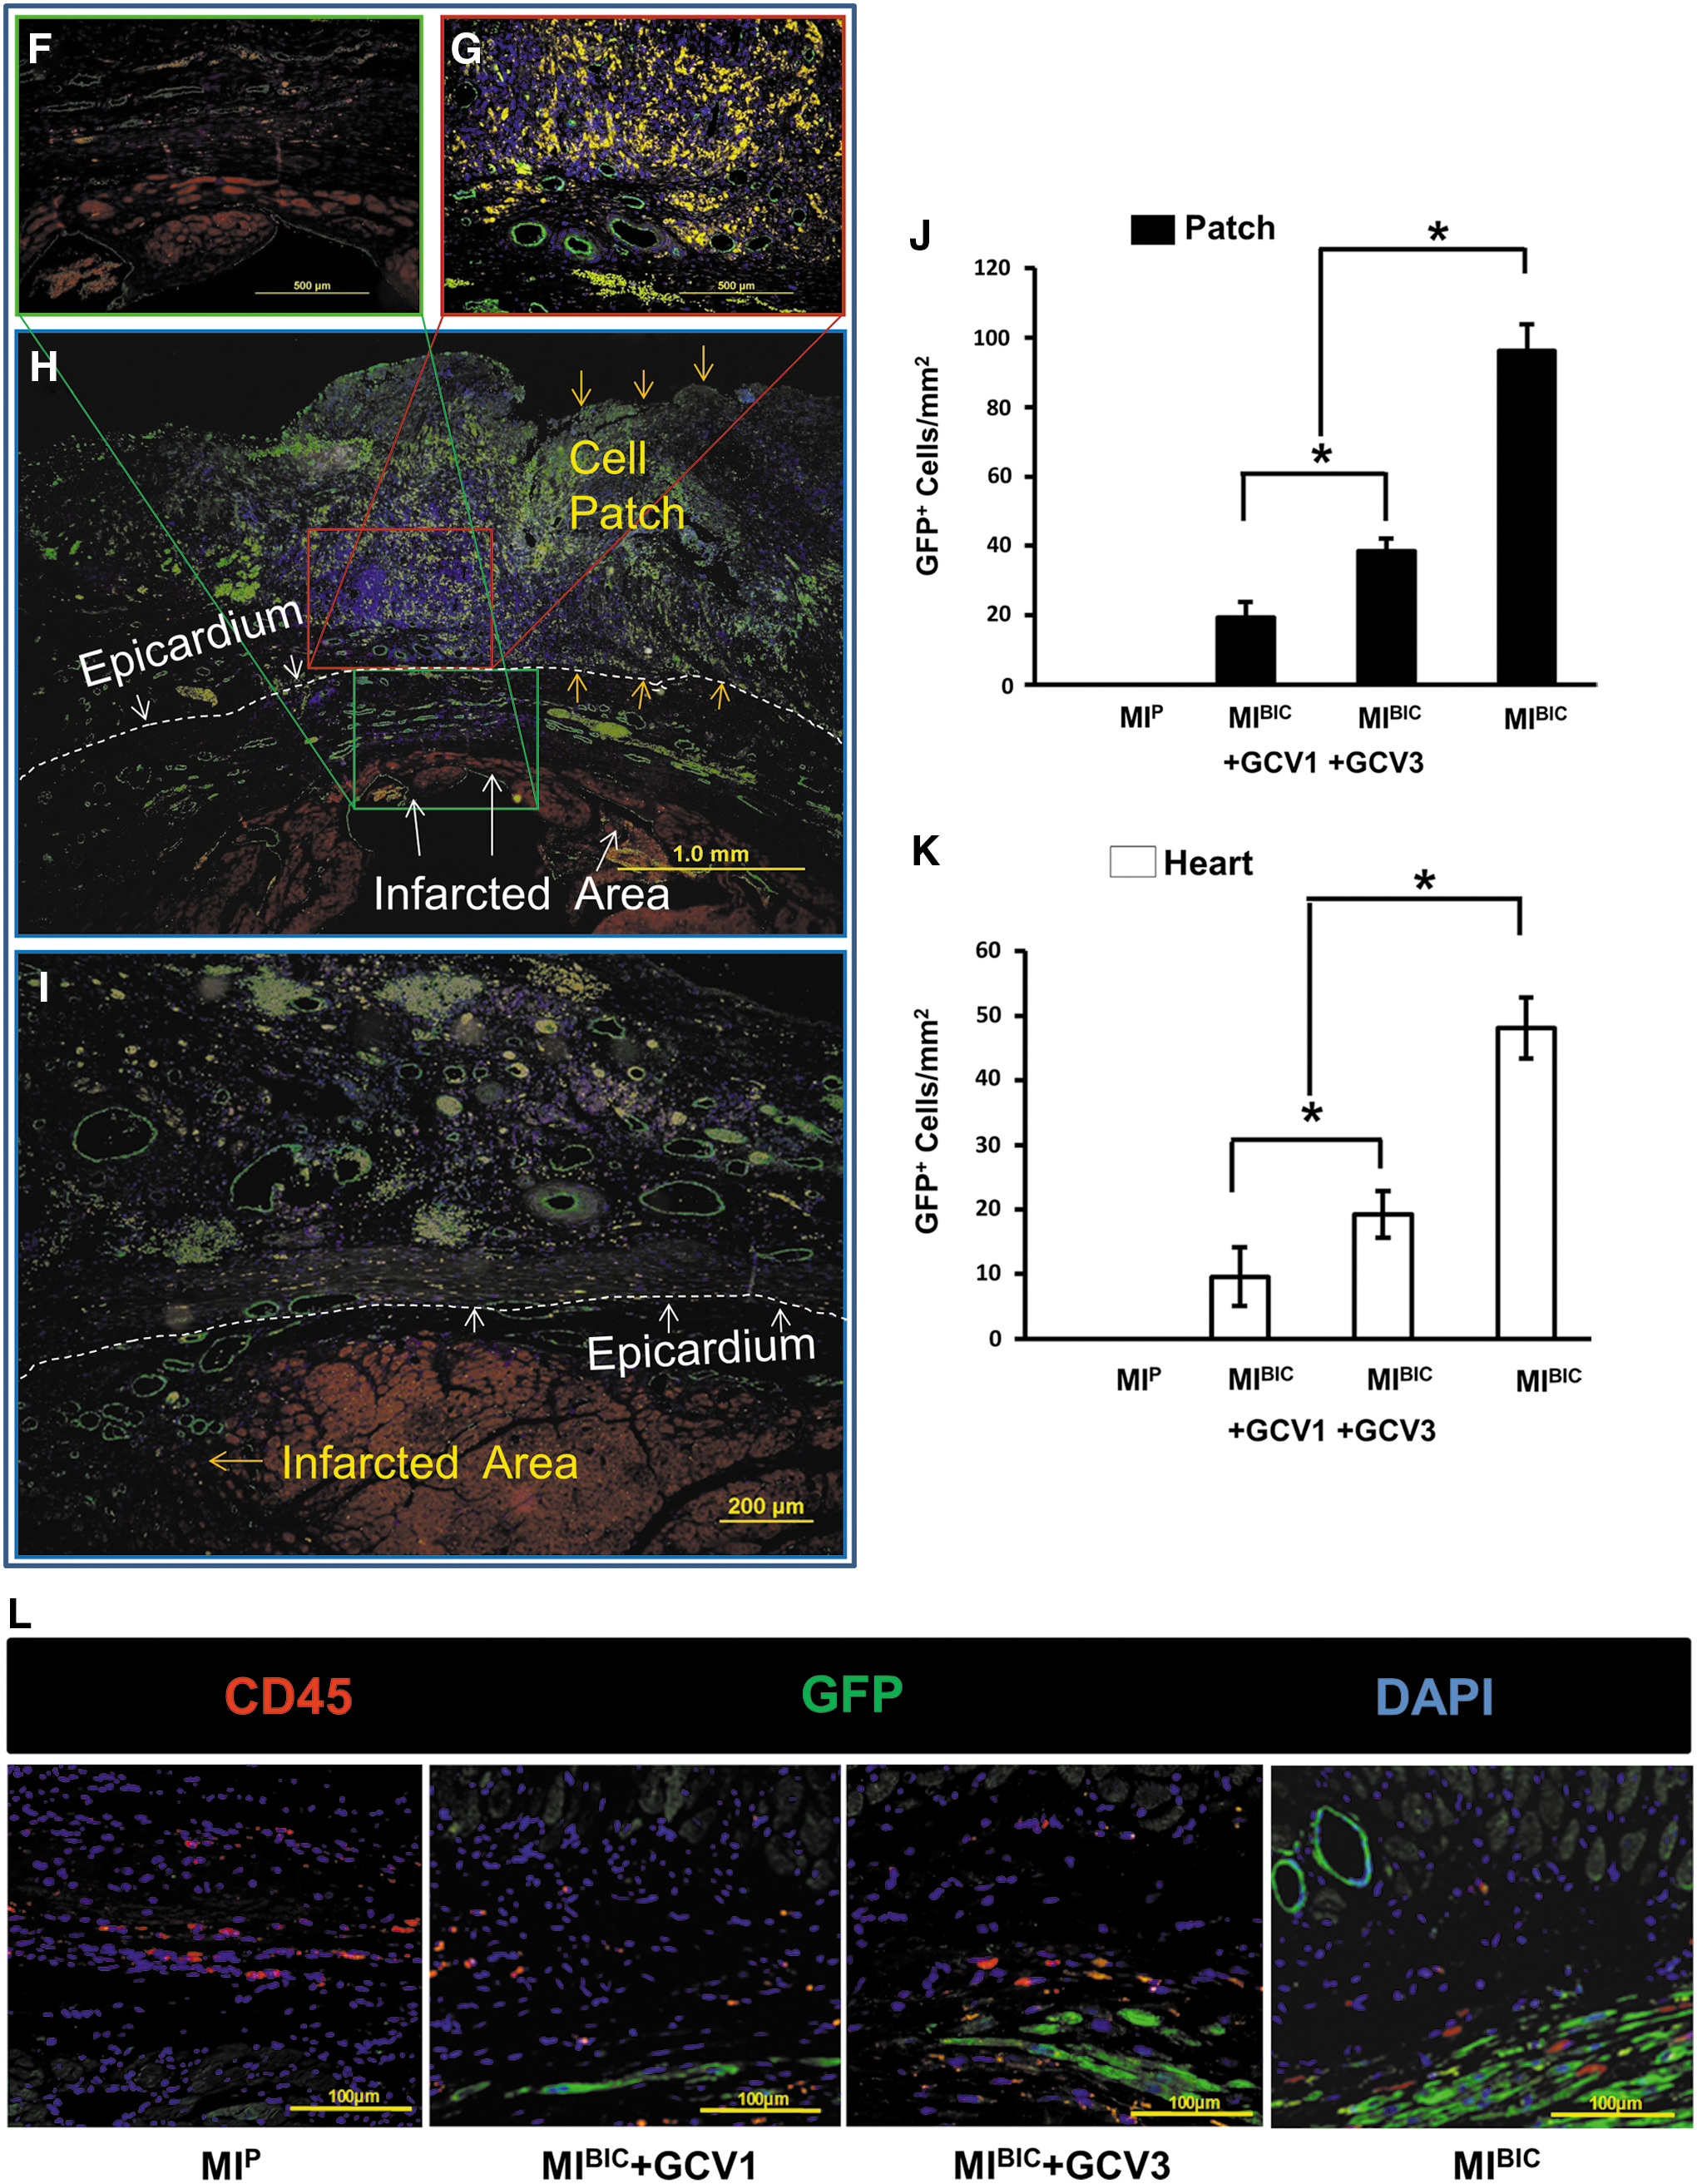
Four weeks after cell patch placement, Masson's Trichrome staining confirmed that the patch was tightly adhered to the epicardial surface of the recipient heart. Specifically, as seen in low to high magnification images of the MIBIC group (Fig. 5A–I), large numbers of the CM were proliferating within the cell patch. Similarly, large numbers of the GFP+ cells were observed in the cell patch area in the MIBIC group (Fig. 5A–E), and were positively stained for α-sarcomeric actin, a specific marker for CM (Fig. 5B, red colors), indicating that most of these GFP+ cells were CM. The distinctive myofibrillar Z-line was also seen in these GFP+ cells when viewed at high magnification (Fig. 5A). However, these new GFP+ CM derived from iPSC were severely eliminated by GCV treatment in the third week, and no cardiomyocyte distinctive structures were observed in the transplanted cells in the MIBIC GCV3 group (Fig. 5F). Similarly, CM characteristic GFP+ cells were killed in the MIBIC GCV1 group (data not shown). Quantitative analysis showed that the number of GFP+ cells within the cell patch and peri-infarcted area of the heart were present to a greater extent in the MIBIC group in the absence of GCV administration than in any of the other groups, *p≤0.05, (Fig. 5J, K). The number of GFP+ cells was significantly reduced in MIBIC GCV1 and MIBIC GCV3 groups after GCV treatment at the first or third week, suggesting that implanted cells were effectively killed by GCV treatment. Notably, histological assessment for an immune reaction against iPSC revealed no evidence of infiltration of GFP+ iPSC-derived CD45+ lymphocytes into the infarcted region (Fig. 5L).
Assessment of myocardial fibrosis area, myocyte hypertrophy, heart functional changes, and apoptosis after time-dependent elimination of implanted cells
Four weeks after cell patch implantation, the extent of MI was assessed using Masson's Trichrome staining in the various patch treatment groups (Fig. 6A, B). The percentage of left ventricular (LV) infarct area was significantly reduced in the MIBIC+GCV3 group and was reduced further in the MIBIC group, while no remarkable changes were observed in infarct size/fibrosis area (as% of LV) in the MIBIC+GCV1 group as compared with the MIP group (Fig. 6B).
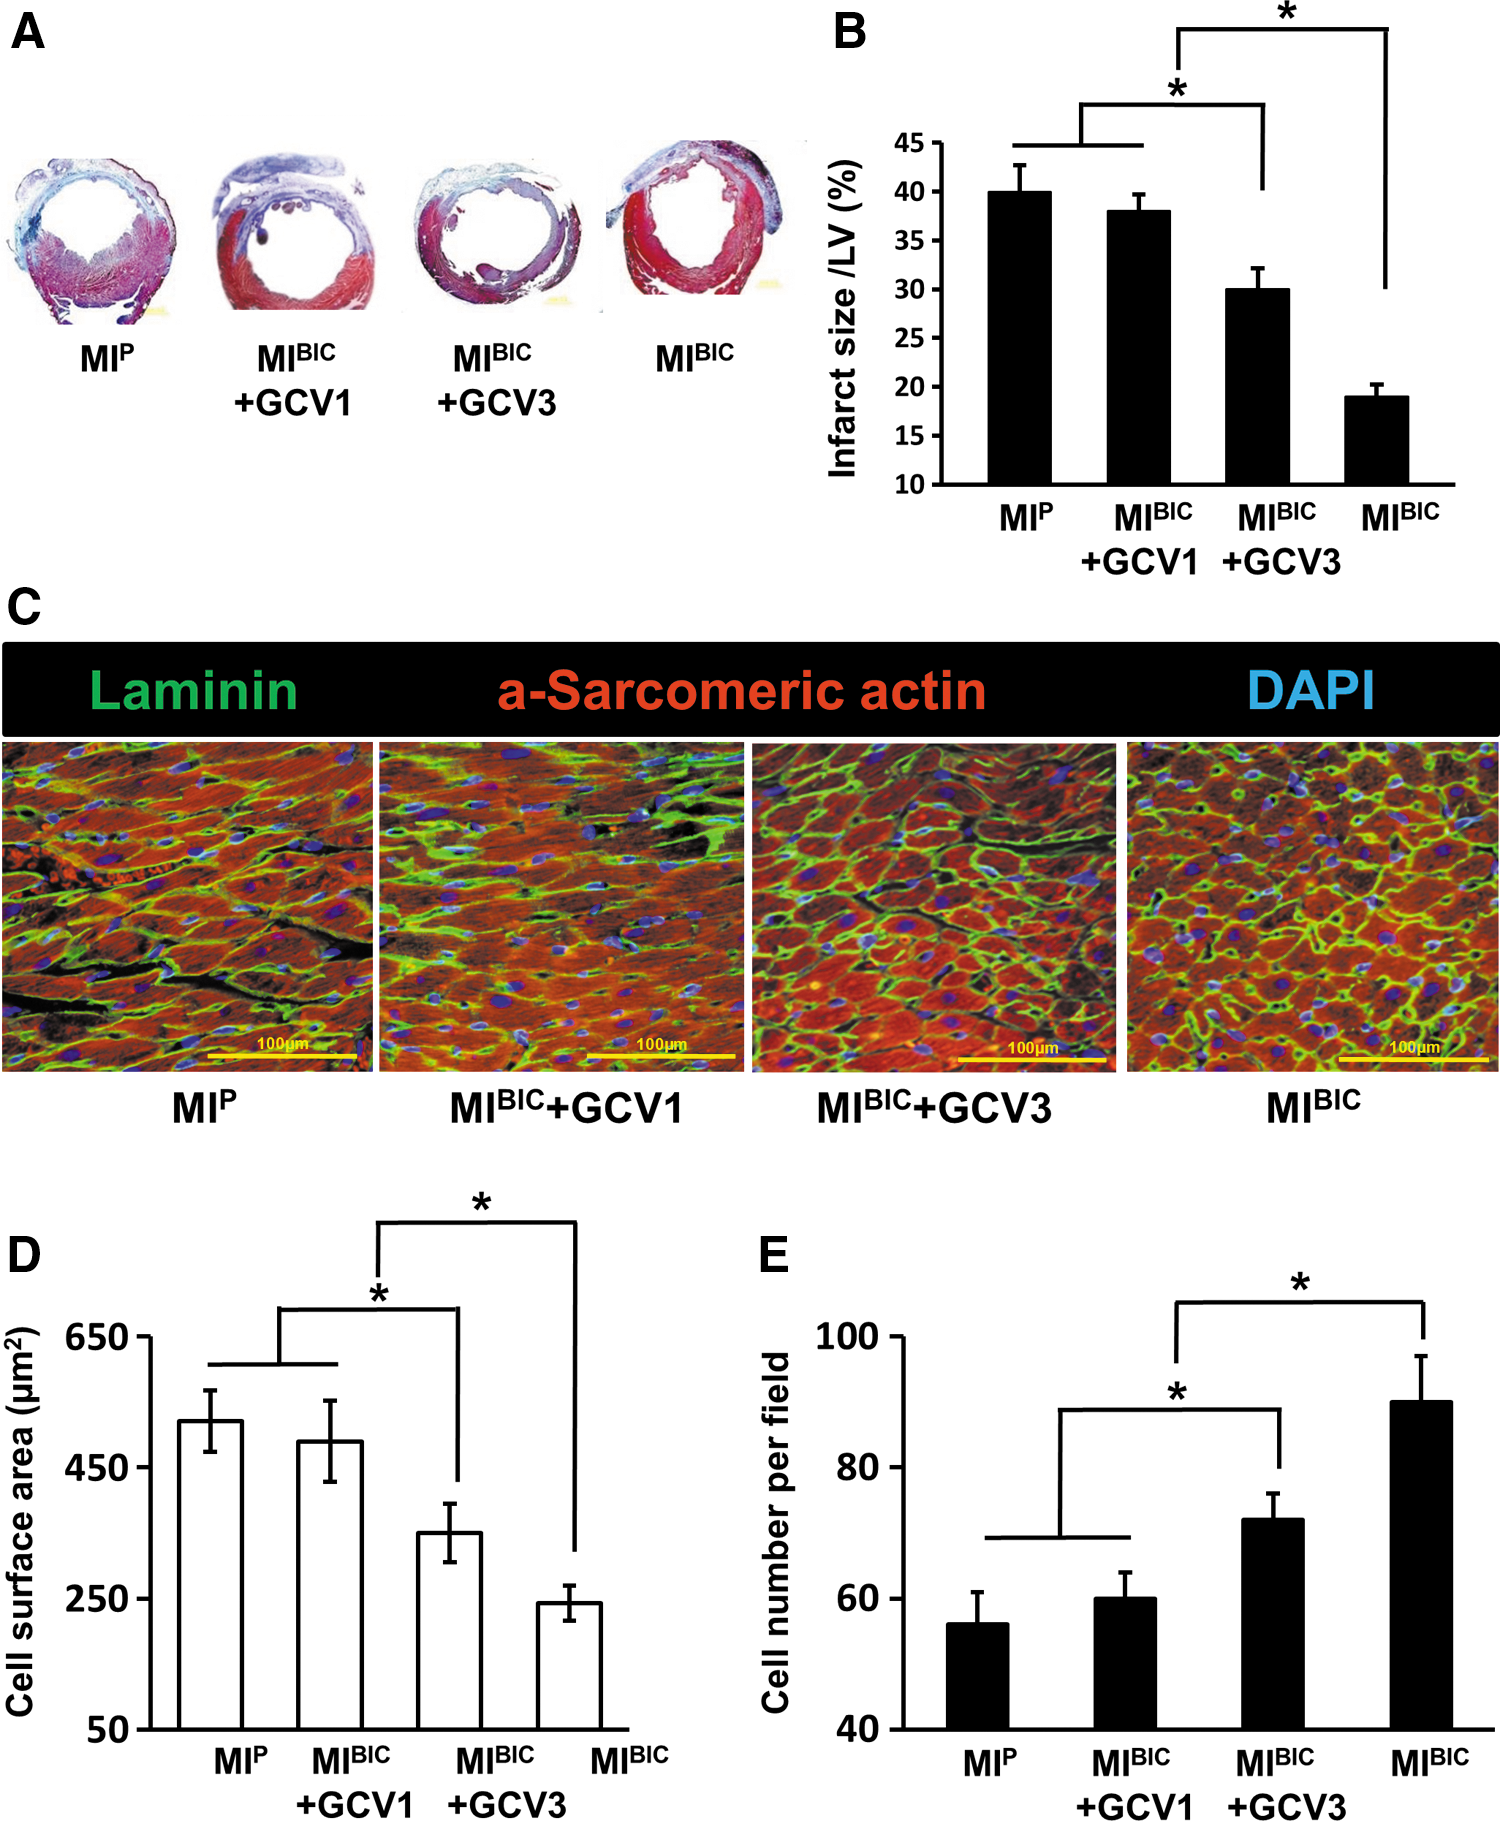
To determine cardiomyocyte hypertrophy at 4 weeks post-MI, hearts were stained with α-sarcomeric actin (for cardiomyocyte) and laminin (for surface cell membrane) (Fig. 6C). Of note, CM were the largest (Fig. 6D) and fewest in number (Fig. 6E) in the MIP group in comparison to other groups, indicating myocyte hypertrophy. However, with BIC treatment, cardiomyocyte hypertrophy was prominently attenuated, as evidenced by higher cardiomyocyte density and a decrease in cell surface area in the MIBIC group. This presumptive salutary effect of BIC was completely reversed by GCV administration at week 1 (MIBIC+GCV1), but only attenuated in the group given GCV at week 3 (MIBIC+GCV3) as compared with the MIBIC group.
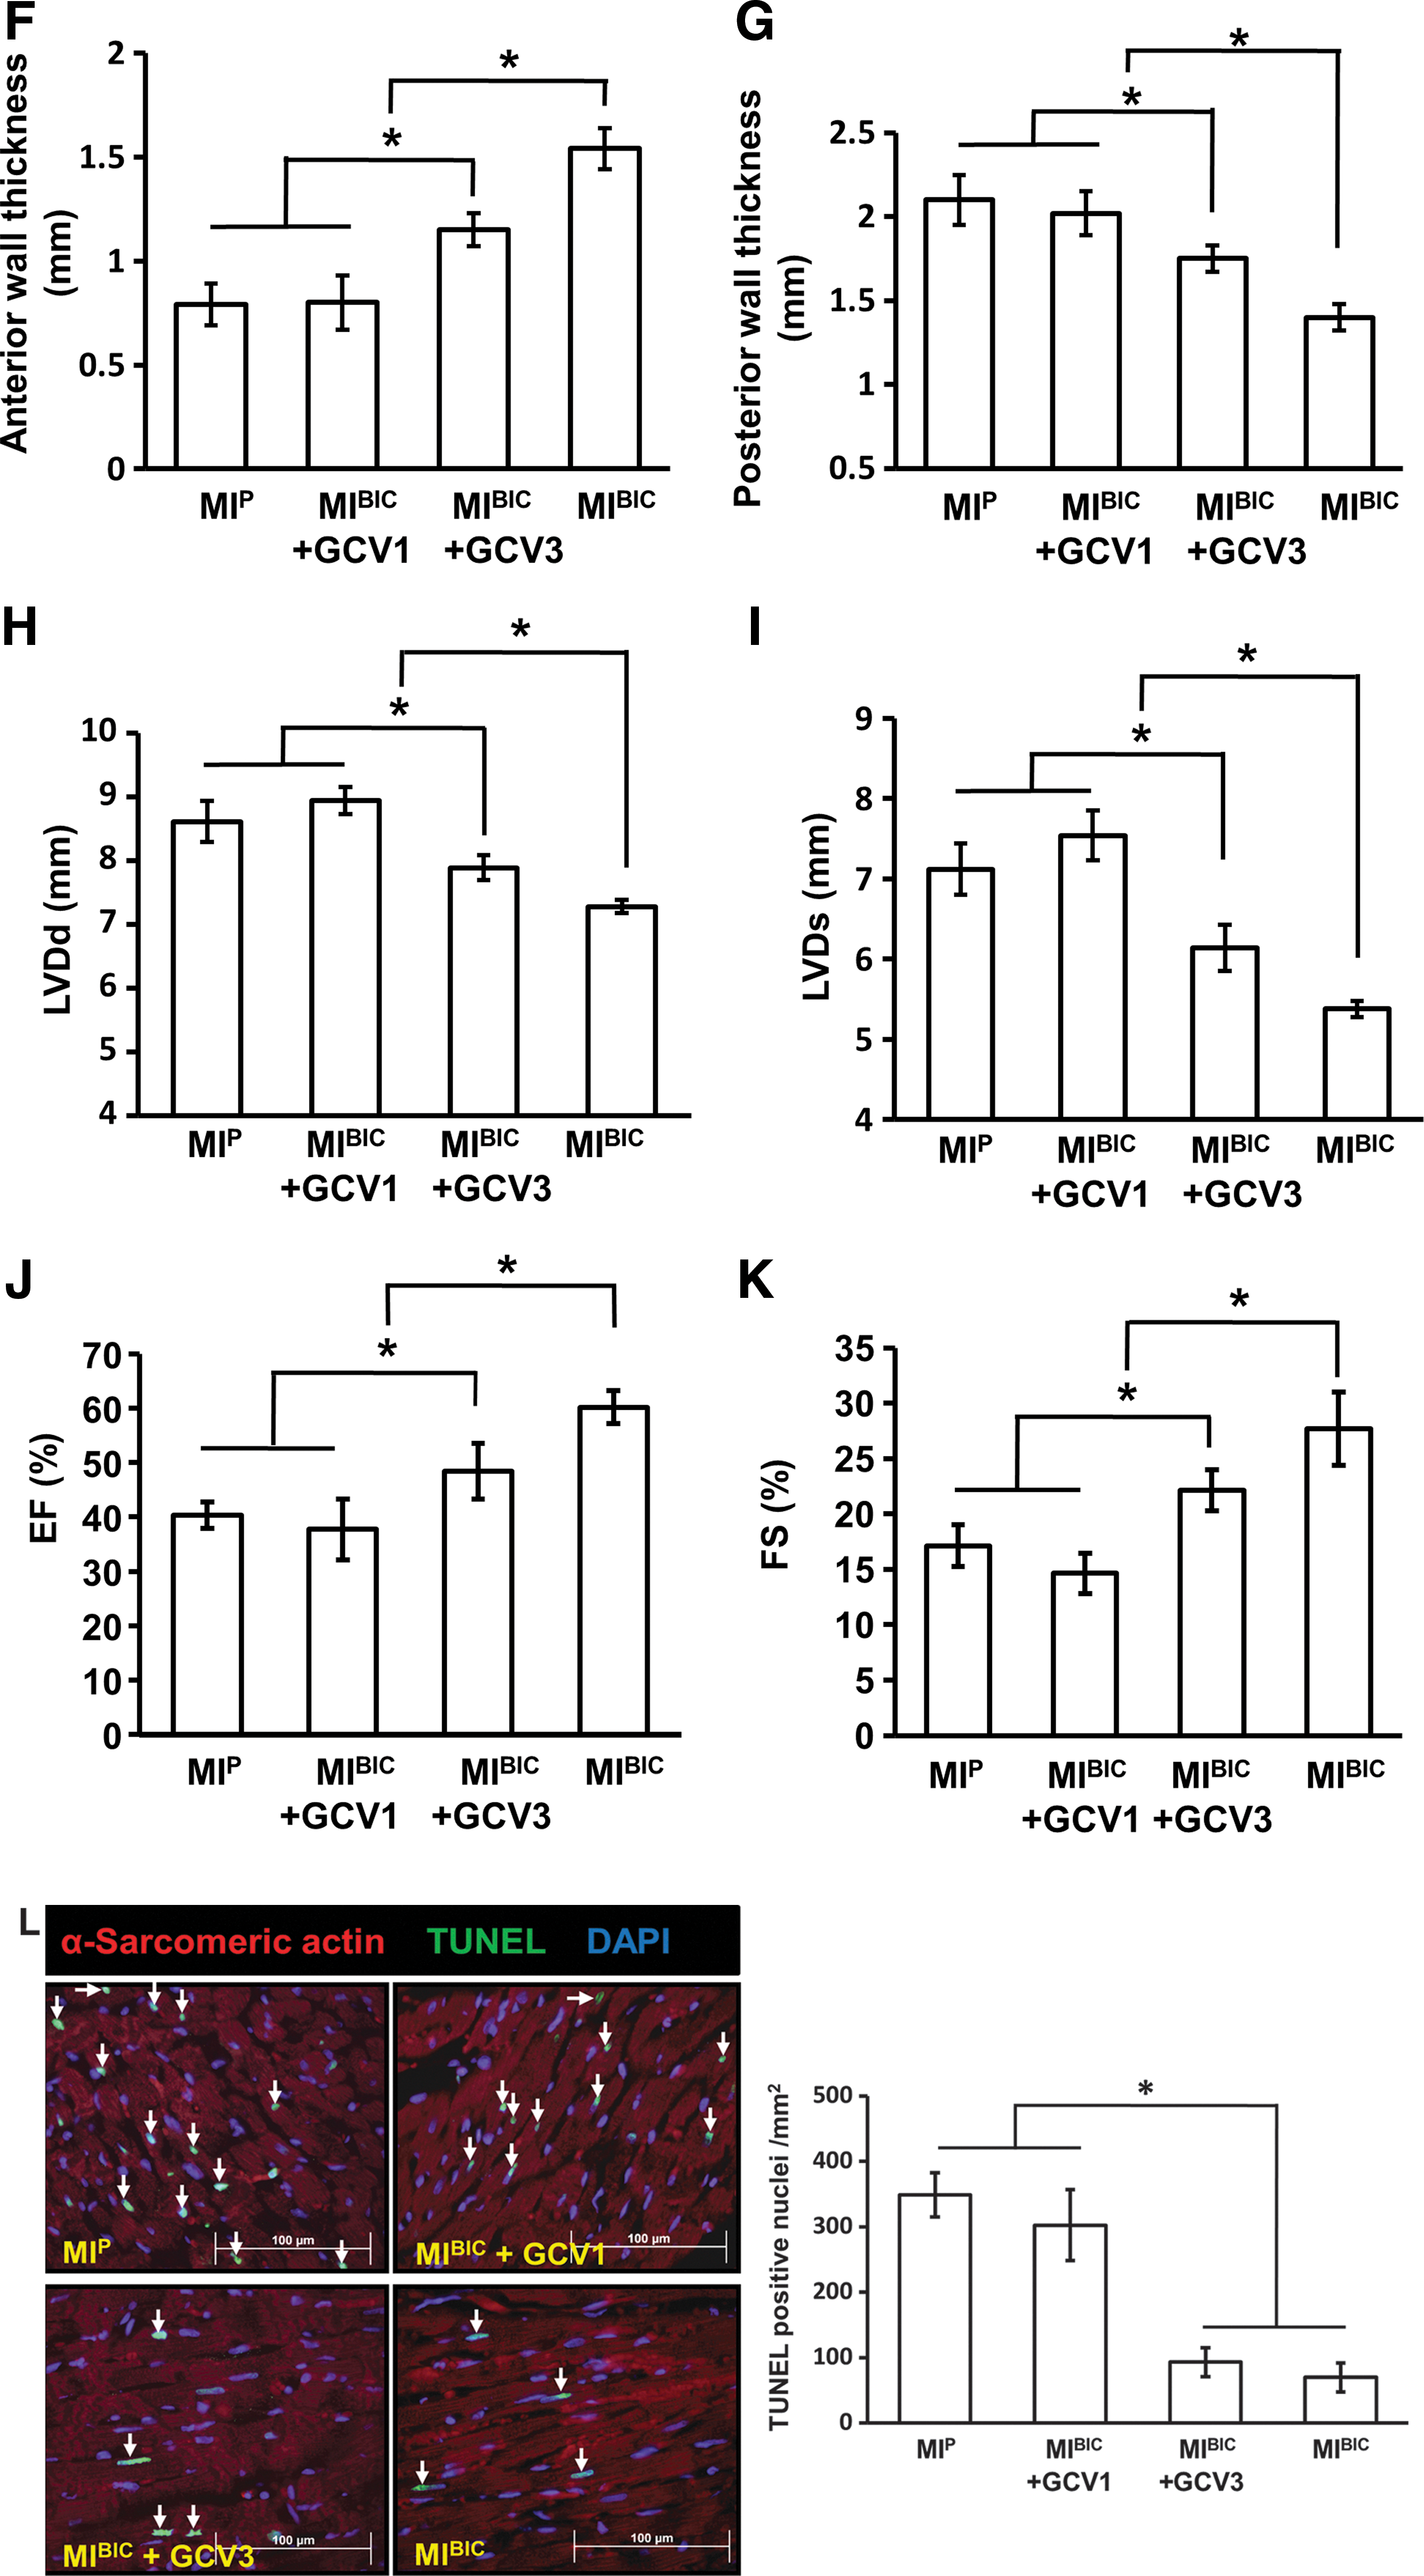
Then, functional assessments (LVDd, LVDs, EF, and FS) are illustrated in Figure 6H–K for the various treatment groups at 4 weeks after cell patch implantation. There were no significant differences in heart rate among the groups (data not shown) and no significant differences in LV function in terms of LVDd, LVDs, EF, and FS between the MIBIC+GCV1 group and the MIP control group. However, LVDd, LVDs, EF, and FS were significantly improved in the MIBIC+GCV3 group as compared with the MIP group. The most significant changes were observed in the MIBIC group, in which both LVDd and LVDs were significantly decreased, and an accompanying increase of EF and FS compared with any other groups. Although ventricular function was improved in the MIEC group and MICM groups as compared with the MIP group, no significant differences were detected between the MIEC and MICM groups in LVDd, LVDs, EF, and FS (Supplementary Fig. S1A–D; Supplementary Data are available online at
Large numbers of cells undergoing apoptosis, as reflected by TUNEL-positive nuclei, were observed in the peri-infarcted area at 7 days after cell patch implantation in the MIP group (Fig. 6L, arrow). Similar numbers of cells were observed in the MIBIC+GCV1 group using TUNEL-positive nuclei. However, the number of cells with TUNEL-positive nuclei was significantly reduced in the MIBIC+GCV3 group. Numbers of nuclei reached counts similar to those seen in the MIBIC group.
Discussion
TK transgenic iPSC were generated, and cell viability was controlled by generation of intracellular toxic molecules after GCV administration. These iPSC-derived cardiovascular cells were then prepared into a cell patch for direct application onto the epicardial surface of an infarcted rat heart. Experimental results obtained in this study provide evidence that (i) iPSC-derived cardiovascular cells - both CM and ECs - were the predominant contributors to cardiac functional improvement after acute MI; (ii) the depletion of cardiovascular cells by GCV administration at the first week was followed by a deterioration in LV contractile function, associated with a reduction of cell-associated paracrine factors and with a decrease in vascular density; (iii) the depletion of iPSC-derived cardiovascular cells by GCV administrated at the third week reduced LV contractile function, as well as the vascular density; and (iv) the extent of LV contractile function reduction after GCV treatment at the third week was less than that seen with treatment at the first week. These findings support a 2-phase overlapping mechanism by which the iPSC-derived CM and EC delivered in the cell patch over the infarcted myocardium promote a reverse myocardial remodeling in which the therapeutic effect of iPSC-derived cardiovascular cells in the rat MI model is in the early phase due to paracrine factors released from iPSC, with a sustained improvement during the second phase when cardiovascular cells remain viable and continue to express these factors.
Previous studies with intravascular and intramyocardial injections of stem cells demonstrated functional restoration of the LV after MI (10, 11, 13). However, it is difficult to control the delivery of grafted cell populations to the target tissue using such methods. Optimization of the cell delivery methods is essential to enhance functional benefit in such cellular therapies. The peritoneum patch containing iPSC provides a supportive micro-environment for cell engraftment, migration, and survival within the infarcted myocardium (4). Nevertheless, the precise cellular mechanism underlying the salutary effects associated with such cell therapy still remains unclear. The suicide gene system under the control of cardiomyocyte (NCX1) and endothelium (VE-cadherin) specific promoters provided a useful tool for elucidation of these mechanisms, by enabling selective and timed ablation of cell lines derived from iPSC.
The paracrine mechanism for the therapeutic effects of transplanted stem/PCs has been proposed in cardiovascular diseases (3). We, therefore, studied paracrine factor expression in the CM and EC under normoxia and anoxia in vitro (Fig. 3A, B). Among myriad putative paracrine factors, IGF-1α possesses broad biological effects, including those such as angiogenesis and cardiac stem cell survival (14). IGF-1α overexpression or local delivery of IGF-1α improves myocyte survival and protects against ventricular dilatation after injection (5). VEGF is also documented to induce angiogenesis (1). In addition, TGF-β1 is markedly activated in the infarcted myocardium, which is crucial for repression of inflammatory gene synthesis and cardiomyocyte hypertrophy (2). Taken together, this information suggested that paracrine factors released by iPSC-derived cardiovascular cells under anoxia conditions might initiate a cytokine signaling cascade which promotes cardiac repair and regeneration after BIC transplantation. To further investigate the paracrine effect in vivo after BIC transplantation in the setting of MI, we employed a strategy of “suicide gene” activation by GCV administration.
At various time points after BIC transplantation onto the MI heart, the mRNA levels of these paracrine factors were found to be significantly increased compared with those in the MIP group, with the peak values appearing before or on the seventh day, and returning to the baseline by 21 days. The transduction of TK gene under the control of a cardiac-specific promoter (NXC1 promoter) or endothelia-specific promoter (VE-cadherin promoter) was expressed in iPSC-derived CM and EC. When GCV was acquired by CM or EC, the TK gene was activated and cell death ensued. Our data confirmed the effectiveness of this suicide gene approach when GCV administration specifically resulted in the death of CM expressing TK and EC expressing TK. In vivo, when GCV was administrated during the first week, severely cardiomyocyte apoptosis ensued. Peak levels of growth factors were significantly reduced, and the mRNA levels in the GCV treatment group were reduced to those in MI control group, leading to severe cardiomyocyte apoptosis. In addition, the significantly increased vascular density associated with the application of BIC patch was completely abolished by GCV administration during the first week. Thus, paracrine factors released by iPSC-derived cardiovascular cells contribute to a reverse myocardial remodeling process during a critical period of infarcted heart repair. During the later phase (at week 3), we noted that vascular density was not abolished by GCV administration, but rather was partially preserved and less cardiomyocyte apoptosis was evident in the BIC treated hearts. As other studies have demonstrated, paracrine factors released from transplanted stem/PCs can also augment various humoral factors of recipient heart tissue, thereby providing an additional favorable environment for angiogenesis and heart function improvement (3). These additional signaling molecules might participate as supplementary mechanisms to explain the difference we observed when GCV was administrated at different time points. In addition to the paracrine mechanism we advocated based on our data in these studies, a comparative analysis of data on iPSC engraftment and cardiovascular cell differentiation provided a second and potentially equally important therapeutic mechanism for ischemic myocardium repair and regeneration. The angiomyogenesis observed was abrogated similarly using the suicide gene approach under the control of a cardiac-specific promoter (NXC1 promoter) or endothelia-specific promoter (VE-cadherin promoter). The GFP and α-sarcomeric-actin-positive cells (GFP+/actin+) were used to trace the penetration of iPSC-derived CM from the cell patch into the infarcted area. We confirmed that grafted cells from the cell patch had entered into the infarcted region after patch implantation, while grafted cells in the patch were significantly destroyed after GCV had been administered during either the first or third weeks (Figs. 4 and 5).
To assess the specific therapeutic mechanism(s) of BIC, cardiac function was analyzed using echocardiography combined with the suicide gene approach. Differential regional patterns after anterior infarction were induced by left anterior descending artery (LAD) ligation for systolic function, muscle hypertrophy, which accompanied serial changes in ventricular chamber volumes (15). As revealed by echocardiography analysis, LV remodeling was significantly improved in the MIBIC group as indicated by a reduction of LV chamber volume, an increase in LV EF, FS, and anterior wall thickness as compared with other groups. Although TK activated by GCV severely reversed the benefits of BIC (as evidenced by worsening cardiac function and LV wall thinning), the effect of TK activation at two time points is different. Further insights were obtained by measuring these cardiovascular cell differentiation levels in various groups. In the absence of GCV, BIC treatment enhanced the migration and cardiovascular cell differentiation of iPSC in the infarcted heart. This finding was consistent with the echocardiography results. Hypertrophy of surviving CM is a major compensatory mechanism post-MI, but in the longer term, it can be associated with an increased risk of heart failure and malignant arrhythmia and metabolic activity (17). The reduced compensatory hypertrophy and decreased LV posterior wall thickness in the BIC-treated group highlights the anti-remodeling effect of BIC treatment that resulted from enhanced angiomyogenesis in combination with a favorable paracrine effect rather than from cardiomyocyte hypertrophy. In contrast, GCV administration in the third week only partially reversed BIC-induced beneficial effects when the suicide gene was activated to specifically kill the differentiated cardiovascular cells. This result supported an important role of iPSC-cardiovascular cell differentiation in MI therapy and reversal of heart tissue remodeling after MI. It has been reported that overexpression of angiogenesis factors in the myocardium contributed to functional restoration post-MI (16). In this study, although heart function was improved in the MICM or MIEC group as compared with the MIP group, no significant difference was detected after 4 weeks between these two groups, which was similar to the MIBIC+GCV3 group.
In conclusion, implantation of a cell patch containing cardiovascular cells (CM and EC) derived from iPSC can significantly improve contractile function of an infarcted heart. The specific gene suicide approach with sequencing ablation targeted by GCV enabled us to determine that the early salutary effects of cardiovascular cells derived from iPSC on angiogenesis and consequent improvements in LV function were largely due to paracrine effects; while the long-term, potentially important, therapeutic effects were largely due to the new EC and CM populations derived from iPSC.
Materials and Methods
Laboratory animals
All research protocols conformed to the Guidelines for the Care and Use of Laboratory Animals published by the National Institutes of Health (National Academies Press, eighth edition, 2011). All animal use protocols and methods of euthanasia (pentobarbital overdose followed by thoracotomy) used in this study were preapproved by the University of Cincinnati Animal Care and Use Committee. An independent review and approval of cell and virus methods used in this study was conducted by the Institutional Biosafety Committee (IBC).
Experiment design
In vitro: iPSC-derived cardiovascular cells were induced by genetic modification with herpes simplex virus TK “suicide” gene driven by cardiac NCX1 (CM) or endothelial VE-cadherin promoter (EC). The effectiveness of the suicide gene approach and iPSC differentiation potential were examined by RT-PCR, immunofluorescence staining, and FACS. To induce growth factor (IGF-1α, VEGF, and TGF-β1) release, CM and EC were exposed to the anoxia condition, followed by qRT-PCR analysis. In vivo: An ischemia-induced MI model was developed in 10–12 week-old nude rats (Charles River), and the animals were randomly divided into the following groups: (i) MIP group (MI-operated rats with peritoneum patch without cells); (ii) MIBIC group (MI-operated rats with bi-cell (CM+EC)-seeded peritoneum patch); (iii) MIBIC+GCV1 group (MI-operated rats with bi-cell patch given GCV in first week); (iv) MIBIC+GCV1 group (MI-operated rats with bi-cell patch given GCV in third week); (v) MIEC group (MI-operated rats with EC patch); and (vi) MICM group (MI-operated rats with CM patch). Echocardiography was performed before or at week 4 after cell patch transplantation. After 4 weeks for patch treatment, hearts were fixed for immunohistochemical assessment of angiomyogenesis, hypertrophy, as well as Masson's Trichrome staining for infarct size assay. Additional hearts in various groups at day 0, 3, 7, 14, and 28 were harvested and followed by Western blotting and qPCR for in vivo growth factor release profile analysis. To evaluate cardiomyocyte apoptosis at 1 week after transplantation, the heat tissue was fixed for TUNEL analysis.
Lentiviral vectors and transduction
The multiple cloning site of pCDH-GFP between EcoRI and NotI was replaced with TK gene obtained from pORF-TK (Invivogen) to construct the vector pCDH-TK-GFP. Sodium/Calcium exchanger (NCX1) promoter was then subcloned into pCDH-TK-GFP between CalI and EcoRI restriction enzyme sites replacing the CMV promoter (pCDH-NCX1-TK-GFP), while a short fragment was subcloned into the same sites to produce a promoterless vector as the negative control (pCDH-Null-TK-GFP). The endothelial-specific VE-cadherin promoter was subcloned into the sites to produce pCDH-VE-TK-GFP as described (12). The identity of the promoter was confirmed by sequencing (Genewiz). Pseudoviral particles were produced in 293YN cells using pPACK lentivector Packaging Kit according to the manufacturer's instructions. Target cells were transduced with pseudoviral stock, and the transgenic positive cellular clone was selected by puromycin (5 μg/ml; Sigma-Aldrich).
Cell culture and suicide gene approach
Neo-CM were isolated from ventricles of 2-day-old neonatal Sprague–Dawley rats using a neonatal cardiomyocyte isolation kit (Worthington Biochemical) as described (4). A rat EC line, YPEN-1, was maintained with Dulbecco's modified Eagle's medium (DMEM) supplemented with sodium bicarbonate (1.5 mg/ml), 0.1 mM nonessential amino acids, 1.0 mM sodium pyruvate, heparin (30 g/ml), and 5% fetal bovine serum (FBS). CM and YPEN-1 were incubated in viral supernatants containing pCDH-Null-TK-GFP, pCDH-CMV-TK-GFP, pCDH-NCX1-TK-GFP, or pCDH-VE-TK-GFP, respectively. Cells were then treated with 100 μM GCV for 4 days. Viable cells were identified by GFP or immunostaining and counted under a microscope at 200-magnification.
Anoxia and real-time PCR
The iPSC-derived CM and EC were seeded and cultured for 24 h before anoxia. The medium containing serum was replaced with glucose-free and serum-free DMEM and then subjected to anoxia (5% CO2/95% N2) for 4 h in an anoxia chamber (Forma Scientific Corp.). The cells were collected for total RNA extraction later using TRIzol Reagent (Ambion, Life Technologies). Total RNA was used for reverse transcription in a miScript II RT kit (Qiagen). The primer sequence for the genes used in qPCR is listed below. qPCR was performed using miScript SYBR Green PCR kit (Qiagen). The expression of genes of interest was normalized to that of β-actin. The primers for qPCR were synthesized as follows: IGF-1α forward primer: 5′- TGAGCTGGTGGATGCTCTTCAGTT-3′, reverse primer: 5′- TCATCCACAATGCCTGTCTGAGGT-3′; VEGF forward primer: 5′-GCA ACACCAAGTCCGAATGCAGAT-3′, reverse primer: 5′-TCTGGCTTCACAGCACTC TCCTTT-3′; TGF-β1 forward primer: 5′- ACCAACTACTGCTTCAGCTCCACA-3′, reverse primer: 5′- TGTACTGTGTGTCCAGGCTCCAAA-3′; Oct4 forward primer: 5′- TGGAGGAAGCCGACAACAATGAGA-3′, reverse primer: 5′-TGGCGATGTGAGTG ATCTGCTGTA-3′; Sox2 forward primer: 5′ -CAGGAGTTGTCAAGGCAGAGA-3′, reverse primer: 5′-CTTAAGCCTCGGGCTCCAAA-3′; Klf4 forward primer: 5′- CCCAAACCTTGCCGCATTAAGGAA-3′, reverse primer: 5′- ACACCCTTGGATGCTCTTCTTGGA-3′; GATA4 forward primer: 5′- TCTGGCTGGCCGAGAGCAGT-3′, reverse primer: 5′-GGCTGTGCAGGA CTGGGCTG-3′; GATA2 forward primer: 5′- GGAGAAAGGAGTAGGCAAGAAG-3′, reverse primer: 5′-CCCAAGAACACAAATAGCACAC-3′; Nkx2.5 forward primer: 5′- TGGGTCTCAATGCCTATGGCTACA-3′, reverse primer: 5′-GACGCCAAAGTTCAC GAAGTTGCT-3′; β-Actin forward primer: 5′- TGTCATCCTCCCAATCCCTCAGAA-3′, reverse primer: 5′- TGTGGTGCCAGATCTTCTCCATGT-3′.
iPSC culture and cell differentiation
Mouse iPSC were maintained as described (4). Briefly, iPSC were maintained in DMEM containing 15% knockout serum replacement, 0.1 mM nonessential amino acids, 2 mM L-glutamine, 0.1% mM β-mercaptoethanol, and 1000 U/ml leukemia inhibitory factor (LIF) on feeder layer of mitomycin C-treated mouse embryonic fibroblast cells. Cell differentiation was induced using the hanging drop method (8). iPSC were cultured in hanging drops of 500 cells per 20 μl of differentiation medium (composition identical to maintenance medium but without LIF and with 10% FBS replacing knockout serum) to form embryonic bodies (EBs). On day 3, EBs were transferred into fresh differentiation medium for suspension cultivation in nonadhering petri dishes. After 5 days, EBs were transferred to 0.1% gelatin-coated dishes. Medium was changed the next day and then changed every other day to maintain viable cells.
Reverse transcription-polymerase chain reaction
For RT-PCR analysis, RNA was isolated from undifferentiated iPSC (Day 0) and differentiated EBs with Trizol Reagent. RT into complementary DNA was conducted with miScript II RT kit (Qiagen). The PCR-related primers were the same as those used previously for anoxia and real-time PCR. Each RT-PCR was performed under the following conditions: 30 s at 94°C, 30 s at 55°C, and 1 min at 72°C. The details were described in our previous publication (4).
Western blot analysis
Western blotting was performed in heart tissues of various treatment groups to determine the expression of IGF-1α, VEGF, and TGF-β1 at different time points (9). Briefly, after electrophoresis, transformation, and immunoblotting, the samples on PVDF membranes were visualized with the ECL plus kit (Bio-Rad). Antibodies against IGF-1α, VEGF were from Santa Cruz Biotechnology. Antibody against TGF-β1 was from Cell Signaling Technology.
Immunocytological staining
Several beating EBs (day 15 of differentiation) were selected for dissociation using 10 mg/ml collagenase IV for 3 to 4 h at 37°C. Dissociated cells were seeded into 0.1% gelatin-coated dishes. After 2 or 3 days, the cells were fixed in 4% paraformaldehyde for 30 min and subsequently permeabilized with 0.2% Triton X-100 at room temperature. The fixed/permeabilized cells were then incubated at 4°C overnight with monoclonal anti-cardiac actin. Tritc-conjugated donkey anti-mouse IgG was applied to the cells for 1 h at room temperature. Nuclei were stained with DAPI for 5 min at room temperature.
Quantification of cardiovascular cell differentiation by flow cytometry
Differentiated iPSC were trypsinized and re-suspended as single cells in a glass tube at 15 days after differentiation had begun. Cells were fixed on ice with 4% paraformaldehyde for 30 min and permeabilized in 0.1% saponin for 30 min. After incubation with 1% FBS on ice for 30 min, mouse anti-a-sarcomeric-actin primary antibody was added. After incubating overnight at 4°C, cells were washed and incubated with donkey anti-mouse IgG-Cy5 for 1 h at room temperature. Cells were incubated with anti CD31 overnight at 4°C to enable ECs counting. After thorough washing with PBS, cells were re-suspended in 0.3 ml PBS. Samples were analyzed using an FACS Aria instrument (BD Biosciences). Cells with an adequate size and granularity were accounted for in the statistical analysis. The percentage of α-actin cells/total cells was calculated.
MI model and cell patch implantation
An MI model was developed in nude rats (female), as previously described (6). Briefly, nude rats (200–250 g) were anesthetized by spontaneous inhalation and maintained under general anesthesia with 1–2% isoflurane. Animals were mechanically ventilated using a rodent ventilator (Model 683; Harvard Apparatus) connected to an endotracheal tube. The heart was exposed by a left side limited thoracotomy, and the LAD was ligated with a 6-0 polyester suture 1 mm from the apex of the normally positioned left auricle.
iPSC were transduced with pseudoviral particles containing pCDH-NCX1-TK-GFP and pCDH-VE-TK-GFP at 2 days after EBs that were attached were 0.1% gelatin coated. CM and EC (2×10⁶) with a 1:1 ratio carrying specific suicide genes were seeded on a peritoneal cell patch2. One week after MI, the left thoracic cavity was reopened. Cell patches were applied to the surface of LAD distribution overarching the MI area by surface tension of the isolated peritoneum without any suture. The rats were simultaneously injected intraperitoneally with 10 mg/kg GCV daily for 7 days, and separate groups were injected at the third week.
Immunohistochemistry of rat hearts
After coronary perfusion with fixative solution, the heart was removed and fixed by immersion in 4% PFA in PBS. To measure infarct size at 4 weeks after MI, the LV cross-sections from mid-LV to apex stained with Masson's Trichrome were used to quantify infarct size in the left ventricle in various treatment groups. LV infarct area and total LV area of each image were measured using the Image-Pro-Plus (Media Cybernetics, Inc.), and the infarct area was reported as a percentage of the total LV area. To determine cardiomyocyte hypertrophy post-MI, hearts after 4 weeks of different treatments were stained with α-sarcomeric actin (for cardiomyocyte) and laminin (for the surface cell membrane). Myocyte area was measured in captured images using Image J (17). LV sections from border zone of infarcted hearts were used to quantify capillary density after staining with vWF antibody (Dako) as previously described (9). To quantify apoptotic CM, additional rat hearts were removed at 1 week after cell patch implantation, fixed with 0.5% PFA in 5% sucrose, routinely frozen embedded in OCT, and processed for sectioning and staining with TUNEL and α-sarcomeric actin (Sigma-Aldrich) as previously described (6). TUNEL was performed using an In Situ Cell Death Detection kit, Fluorescein (Roche Applied Science) as per the manufacturer's protocol. DAPI was used for nuclear counterstaining. For angiomyogenesis analysis, additional hearts were subjected to cryosection. The number of GFP+ cells per mm2 in the infarcted area was counted to evaluate cell migration from the cell patch. Four fields of each section were examined for quantification. Fluorescent imaging was performed with an Olympus BX41 microscope (Olympus America, Inc.) equipped with an epifluorescence attachment. Images were recorded using a digital camera and analyzed using MagnaFire™ 2.1 software.
Echocardiography
Transthoracic echocardiography (iE33 Ultrasound System; Phillips) was performed with a 15-MHz probe. Hearts were imaged in 2D long-axis view at the level of the greatest LV diameter in animals under light general anesthesia (13). This view was used to position the M-mode cursor perpendicular to the LV anterior and posterior walls. LV end-diastolic and end-systolic diameters were measured from M-mode recordings. LV ejection fraction (EF) was calculated as EF (as a%)=[left ventricular end-diastolic dimension (LVDd)3 minus left ventricular end systolic dimension (LVDs)3/(LVDd)3×100. LV fractional shortening (FS as a%) was determined as [(LVDd–LVDs)/LVDd×100. All measurements were performed according to the American Society for Echocardiography leading-edge technique standards, and averaged over three consecutive cardiac cycles.
Statistical analysis
Results were statistically analyzed with the use of the StatView 5.0 software package (Abacus Concepts, Inc.). All values are expressed as mean±SEM. Student's t-test was applied to compare growth factor expression between normoxia and anoxia condition. Two-way ANOVA were used to analyze the growth factor expression in various treatment groups at different time points. One-way ANOVA was applied to analyze angiomyogenesis, infarct size, echocardiographic data, and TUNEL assay data. After ANOVA, the post hoc Bonferroni was performed for comparisons of multiple groups. A value of p<0.05 was considered statistically significant.
Footnotes
Acknowledgments
The authors wish to recognize Christian Paul for technical assistance. This work was funded by National Institutes of Health grants HL089824, HL-110740, and HL107957 (Y. Wang).
Author Disclosure Statement
The authors declare that they have no competing interests to disclose.
Abbreviations Used
References
Supplementary Material
Please find the following supplemental material available below.
For Open Access articles published under a Creative Commons License, all supplemental material carries the same license as the article it is associated with.
For non-Open Access articles published, all supplemental material carries a non-exclusive license, and permission requests for re-use of supplemental material or any part of supplemental material shall be sent directly to the copyright owner as specified in the copyright notice associated with the article.